


-
Anemia is among the top 10 public health issues worldwide which affects both developed and developing countries, especially iron deficiency anemia. Children are particularly vulnerable to the effects of iron deficiency because physical and mental development occurs during this life stage[1]. The 2010–2013 China National Nutrition and Health Survey revealed that the anemia rate in children aged 6–11 was nearly 5%[2], the current recommended nutrient intake (RNI) and the estimated average requirement (EAR) for iron of China were calculated for adults, which may not be suitable for children[3]. Because of different physiological states and demand levels, it is particularly important to obtain more accurate iron requirements for children.
Stable isotopes are regarded as valuable tools that are widely used in studies on mineral metabolism. Due to the low iron isotopic ratios observed in blood, which are attributed to differences in metabolism or uptake[4], the utilization of iron can be determined based on the administration of isotopes[5-7]. In China, due to the high price of stable isotopes and other reasons, there are few studies on the iron demand by using stable isotopes technology, and in these studies it mainly focus on the iron absorption rate of adults, but few on the utilization of iron in children[8]. In the past, double-standard isotopes were mainly used for analysis, which required lower natural abundance and higher cost of isotopes given through veins, but it was difficult to implement them in children. Based on the premise that nearly 80% of the newly absorbed iron will be incorporated into erythrocytes within two weeks[9], a single isotope can be used for the determination of iron absorption and utilization after oral administration. Especially among infants and children, because their erythrocyte iron pool is not large or easy to detect[5], this method may work well for iron absorption in them[10].
In addition, the observation period in existing foreign reports was only within 28 days[11,12], such a short observation period is not conducive to observing the dynamic distribution of iron in erythrocytes and predicting the equilibrium period. In the present study, for the sake of safety, economy and operability, we innovative used a single stable isotope tracer method in Beijing prepubertal children and assessed the resulting variations in iron enrichment in red blood cells (RBCs) within 90 days after the oral administration. This data can help us to better update the physiological needs of iron and adjust the DRIs in China and provide guidance for the iron nutrition of prepubertal children.
-
Thirty boys and thirty girls aged 10 to 12 years from Huaibei primary school of Beijing (A boarding school for nine-year compulsory education, where our research can be carried out to keep track of the children and avoid the loss of samples due to higher education) were recruited to participate in this study. All of the children were subjected to a physical examination and were considered to be healthy and prepubertal if no evidence of menarche (girls) or secondary sexual characteristics (boys) was found. Three girls withdrew because of diarrhea in the pre-experiment stage. The trial was registered at the Chinese Clinical Trial Registry (No:ChiCTR-OCH-14004302) and approved by the Ethical Committee of the National Institute for Nutrition and Health, Chinese Center for Disease Control and Prevention. Informed consent was obtained and provided by at least one parent of each participant.
-
A stable iron isotope enriched for 57Fe was obtained in metal form from Trace Sciences International Corporation (54Fe: 0.0023% ± 0.0008%, 56Fe: 1.27% ± 0.06%, 57Fe: 96.610% ± 0.008%, and 58Fe: 2.11% ± 0.05%, as determined by the National Institute of Metrology) and used to prepare a ferrous sulfate solution by the addition of 0.5 mol/L sulfuric acid until the metal was completely dissolved[13]. After dilution, vitamin C was added to eliminate the unpleasant flavor caused by the ferrous sulfate and to maintain an acidic environment. The oral solution was prepared according to a previously established method[14]. The solution complied with the hygienic standards of the China National Center for Food Safety Risk Assessment and was sealed and stored in a cool and dark environment until use.
-
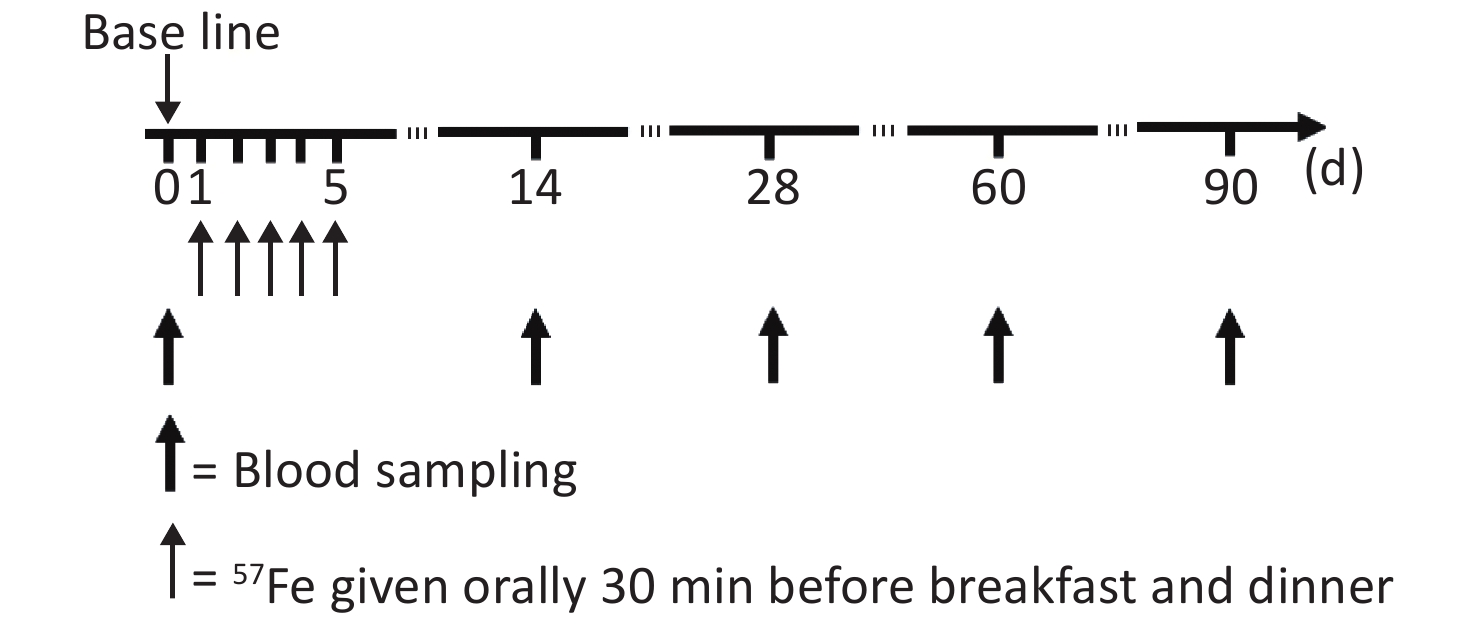
The study flow chart is shown in Figure 1. At the first 14 d, to achieve the highest possible reduction in the saturation of mucosal cells with iron, the subjects were assigned to a low-iron diet during the trial and not allowed to consume food or drink other than those specified and water, the actual intake of food served for the subjects every day was recorded. Thirty minutes before breakfast and dinner, the subjects were orally administered 3 mg of 57Fe in the form of the ferrous sulfate solution, and this process was repeated to obtain a total administration of 57Fe of 30 mg over a 5 d period. The exact 57Fe intake for each subject was calculated by the 57Fe abundance in the solution and food and the amount of intake.

Figure 1. Schedule of stable isotope administration and blood sampling.
Following an overnight fast, 10 mL of blood was obtained from each participant in 0 day, 14th day, 28th day, 60th day, and 90th day after isotope administration. The RBCs in the blood samples were divided into two parts: 5 mL of the collected blood was subjected to common testing, such as analyses of the hemoglobin (Hb) and serum ferritin (SF) contents, as described previously[3], and the other 5 mL of blood was analyzed by multi-collector inductively coupled plasma mass spectrometry (MC-ICP-MS) to obtain the isotope ratio, as detailed by von Blanckenburg et al.[15].
-
The total amount of 57Fe incorporated into erythrocytes (57Feinc) was calculated according to the following formula[16]:
$$ ^{57}{\text{Fe}}{_{\text{inc}}} = \frac{{{{MIR}}_{{{57/56}}}^{{t}}-{{MIR}}_{{{57/56}}}^{{0}}}}{{{{MIR}}_{{\bf{57/56}}}^{{0}}}} \times {{F}}{{{e}}_{{{circ}}}} \times {{0}}{{.0214}} $$ where 57Feinc is expressed in mg,
${{{MIR}}_{{\bf{57/56}}}^{{t}}}$ is the 57Fe/56Fe ratio at the specified time after isotope administration,${{{MIR}}_{{\bf{57/56}}}^{\bf{0}}}$ is the 57Fe/56Fe ratio at baseline, and Fecirc is the total amount of iron in the circulation at the specified time, which is expressed in mg and estimated as follows[17]:$$ \text{Fe}{_{\text{circ}}} = \text{BV} \times \text{Hb} \times 3.47 $$ where 3.47 is the concentration of iron in Hb expressed in mg/g, Hb is the hemoglobin concentration (g/L), and BV is the blood volume expressed in mL. In this study, BV was estimated by the sex and the body weight (BW), as described by Etcheverry et al.[18], as follows:
$$ \text{For boys: BV}= \text{0.075 3} \times \text{BW (kg)}-\text{0.05} $$ $$ \text{For girls: BV} = \text{0.075 3} \times \text{BW (kg)} + 0.01 $$ Thus, the incorporation of 57Fe into erythrocytes was calculated as:
$$\frac{{{}^{{{57}}}{{Fe}}_{{{inc}}}}}{{{}^{{{57}}}{{Fe}}\;{{given}}\left( {{{oral}}} \right)}}$$ -
The results are presented as the mean values ± standard deviation (SD). Repeated measures ANOVA was used for comparisons between groups. All of the statistical analyses were performed using the Statistical Product and Service Solutions 13.0 software.
-
Anthropometric measurements of the subjects are described in Table 1. There were no differences in the average age, height, sitting height, body weight, RBC, Hb and SF. According to the standard of iron deficiency which was defined as serum ferritin below 14 μg/L[19], the iron status of all of the children was good.
Characteristics Boys (n = 30) Girls (n = 27) Age (years) 10.6 ± 0.2 10.4 ± 0.2 Height (cm) 146.2 ± 7.5 144.9 ± 6.5 Sitting height (cm) 78.1 ± 4.3 77.0 ± 3.7 Body weight (kg) 41.5 ± 12.0 37.8 ± 6.9 Body mass index (kg/cm2) 19.2 ± 4.4 17.9 ± 2.6 Red blood cells (× 1012/L) 4.4 ± 0.2 4.5 ± 0.3 Hemoglobin (g/L) 133.1 ± 4.9 130.8 ± 6.1 Serum ferritin (μg/L) 57.67 ± 6.65 41.08 ± 4.96 Table 1. Baseline data of the children according to sex (mean ± SD)
-
The total energy intakes were slightly higher than the RNI (Table 2). According to the RNI[20], the energy proportions from carbohydrates, proteins and fats are all reasonable, and the intakes of iron in boys was slightly higher than that in girls (P< 0.05).
Characteristic Boys (n = 30) Girls (n = 27) Actual intake (g/d) Energy (%) Actual intake (g/d) Energy (%) Carbohydrate 352.7 ± 33.9 56.3 ± 5.2 294.2 ± 18.5 58.4 ± 4.0 Protein 75.5 ± 4.1 15.8 ± 3.1 69.3 ± 6.2 13.9 ± 2.9 Fat 52.5 ± 8.4 31.4 ± 4.7 45.6 ± 6.4 29.5 ± 2.4 Iron 8.1 ± 1.1* − 7.3 ± 0.9* − Note. −: nor measured; *: (mg/d). Table 2. Intake of main dietary nutrients according to sex (mean ± SD)
-
The mean 57Fe/56Fe ratios increased starting 14th day, reached a peak at 60 d and then decreased. The percentage of the administered dose of 57Fe that was incorporated into erythrocytes ranged from 13% to 27%. The erythrocyte incorporation of 57Fe presented a trend consisting of an initial increase to a peak at 60 d; the mean peak values were 19.67% and 21.33%. As shown in Table 3 and Figure 2, the erythrocyte incorporation of 57Fe of the boys was significantly lower than that of the girls in 60th day (F = 43.842, P < 0.0001), but no difference was observed in 14th day, 28th day, and 90th day ( F = 2.05, P = 0.157). There was an interaction between gender and time point both in 57Feinc and erythrocyte incorporation of 57Fe (F = 31.45, 32.16, P < 0.0001), and erythrocyte 57Fe incorporation in girls was significantly difference at each time point, as calculated by repeat measure ANOVA (P < 0.05).
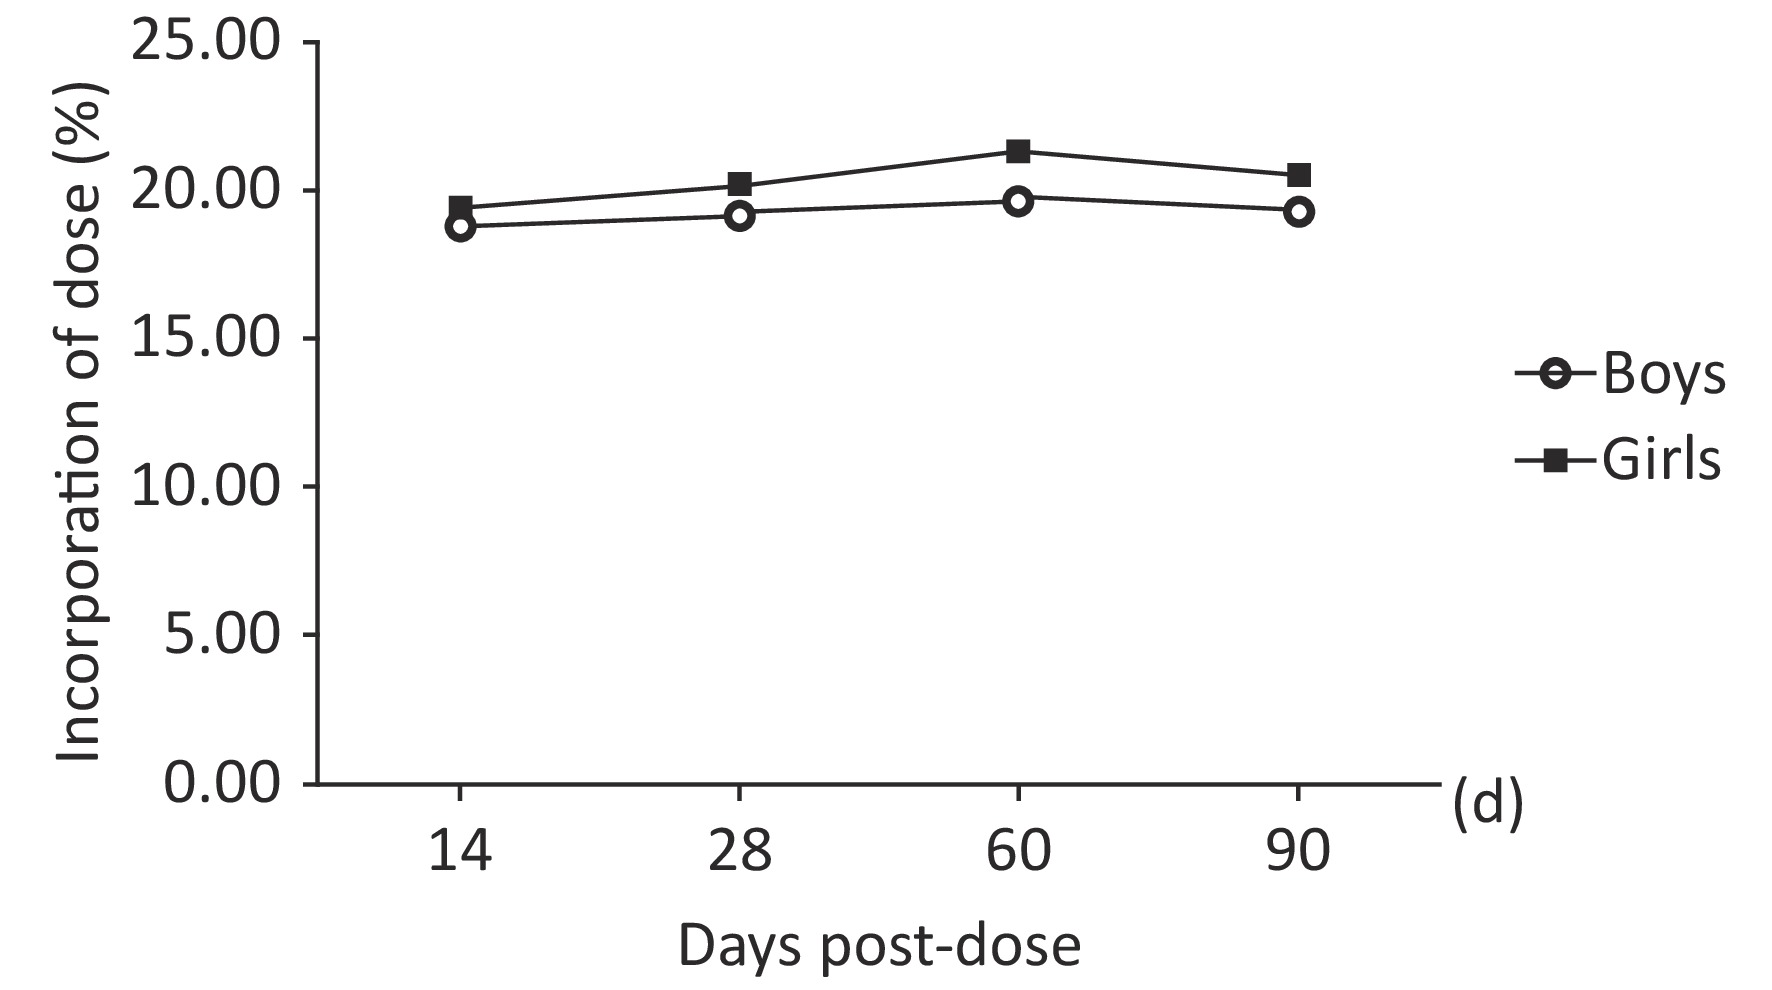
Figure 2. Trend obtained for the incorporation of 57Fe into erythrocytes over time (of dose) in prepubertal children according to sex.
Time (d) MIRt 57/56 57Feinc (mg) Erythrocyte incorporation of 57Fe
(percentage of dose, %)Boys (n = 30) 14th 0.026415 ± 0.000831 5.16 ± 0.75 18.79 ± 0.47 28th 0.026649 ± 0.001035 5.27 ± 0.77 19.20 ± 0.62# 60th 0.026987 ± 0.001142 5.40 ± 0.62 19.67 ± 0.56#* 90th 0.026698 ± 0.002414 5.32 ± 0.74 19.36 ± 0.44#*@ Girls (n = 27) 14th 0.026935 ± 0.001450 5.32 ± 0.88 19.49 ± 0.47 28th 0.027237 ± 0.001470 5.51 ± 0.66 20.19 ± 0.85# 60th 0.027750 ± 0.001336 5.82 ± 0.43 21.33 ± 0.59#* 90th 0.027391 ± 0.001273 5.60 ± 0.62 20.52 ± 0.68#*@ Note. #The mean value is significantly different from that obtained at 14 d (P < 0.0001); *The mean value is significantly different from that obtained at 28 d (P < 0.0001); @The mean value is significantly different from that obtained at 28 d (P < 0.0001). Table 3. Erythrocyte 57Fe incorporation over time according to sex (mean ± SD)
-
The incorporation of iron into erythrocytes after its administration can be calculated as an index of iron utilization, which was widely used[21,6]. In this study, we explored the iron utilization in prepubertal children using stable isotope technique. Results showed that the percentage of erythrocyte 57Fe incorporation increased starting 14th day after oral administration, reached a peak at 60 d (boys: 19.67% ± 0.56%, girls: 21.33% ± 0.59%) and then decreased. The erythrocyte incorporation rates of 57Fe obtained for girls in 60th day was significantly higher than those obtained for boys.
At present, studies from other countries have reported large variations in the mean of erythrocyte iron incorporation in infant and children (range: 7.8%–24.7%), indicating the lack of agreement in relation to erythrocyte iron incorporation. In the study of Shah et al.[22] the median iron incorporation was 7.78% in 3 to 6 years of age healthy children, Fomon et al.[23] showed that 12.5% of the 58Fe dose was incorporated into RBCs after 2 week administered in nine (age 165–215 d) normal infants, a study reported that the mean of erythrocyte incorporation of 58Fe was 24.7% for girls and 14.8% for boys in (age 86 months to 139 months) healthy preadolescent children[24].
Several processes can influence erythrocyte incorporation of orally administered iron. Firstly, iron status is an important factor. Iron utilization exhibits a closer relationship with iron status than intakes, which iron deficiency can promote iron absorption and utilization[25]. Hb is most commonly used to screen for anemia as a proxy for iron deficiency because of its low cost, better performance than hematocrit, and the availability of easy and rapid procedures for measurement. At the same time, SF, a major iron storage protein, is predominantly utilized as a serum marker of total body iron stores in clinical medicine[26,27]. In this study the concentration of Hb and SF was normal and the iron status of all of the children was appropriate.
Considering the low absorption rate and the influence by daily iron intake, isotope dose should be well considered. According to Fomon et al.[7], after feeding a low-iron formula for 28 d, the 58Fe incorporation (percentage of dose) of infants were ranged from 13% to 16%, which is higher than those who feeding a high-iron formul. Kastenmayer et al.[28] found that the isotope amount should be equal 30% to 60% of the daily dietary iron. Domestic studies have also suggested the levels of iron fortification should be controlled to one third of the RNI[29]. Based on a dietary macronutrient analysis in this study, the dietary iron intake from a test meal was 7.3 mg (girls) and 8.1 mg (boys). After adding 6 mg of iron (given dose), the amount of iron intake daily were nearly met the requirement of the RNI, which should be 15–18 mg[20]. Our previous findings showed the average iron absorption in prepubertal children could equal nearly 30%[30]. Accordingly, the 57Fe level in blood was suitable for us to clearly observe the changes in erythrocyte incorporation in this study. In addition, this study was to observe the metabolism of stable isotope in vivo for a long time, considering the loss with time and oral route, so we increased the duration of oral 57Fe.
The change of Fe isotopic abundance in blood indirectly reflected the metabolism and distribution of Fe in the body. The mean 57Fe abundance on day 0 reflected the natural abundance and after a series of metabolic processes and transportation, the 57Fe was fully mixed with the iron in the body and redistributed to a steady state. Initial radioisotope studies have shown that nearly 80% of the label can be found in the circulation 10 to 14 d after dosing. Therefore, most studies selected 14 d as the observation endpoint, and several selected 28 days, all these resulting in a lack of consensus regarding the optimal endpoint. Vasquez et al.[16] found that 57Fe level continued to rise within 14 days and peaked in the 28th day. Fomon et al.[7] reported that the orally quantity of isotope in erythrocytes remained constant from 28th day to 84th day and started to decrease from the 112th day. Another study found that the circulating isotope levels increased progressively over a period of 90 d, in which 59Fe were intravenously administered to five infants[31]. Therefore, we hypothesize that different administration routes (intravenously or orally) may be related to different initial distributions of iron to temporary storage sites, and may also influence the distribution of isotope in the circulation. Orally isotope Fe will be first found in circulation after intestinal absorption, and then gradually mixed with the total iron pool and finally incorporated into erythrocytes, where it can be measured. The entire process may occur over a long period. Our study revealed a rapid increase within 14 d after administration, a peak in 60th day and decrease from 90th day. The observed trend was similar in both boys and girls, and also similar with other studies[24]. In further study, extending observation time may help to obtain more accurate erythrocyte iron incorporation.
It is well known that the number of subjects and compliance are important factors restricting the study. Due to the high price of isotope iron, the number of subjects has become one of the main factors restricting the relevant research at home and abroad. In this study, after comprehensive consideration of factors such as funding, comparability, sample shedding, etc., 30 subjects of each gender were determined by calculation, with a total of 60 subjects, which was also a relatively large sample size in relevant studies. All students were from nine-year boarding school and the school adopts closed management to facilitate dietary restriction and metabolite collection.
Sex could be another factor which influences erythrocyte incorporation. However, few studies have mentioned the sex and sexual maturity. As we know, prepubertal period is an important stage of growth and development, indeed, certain children may develop significantly faster and require more nutrients[32]. This hypothesis has been proven by Woodhead et al.[24], who found that erythrocyte incorporation in preadolescent children was significantly greater than other ages, and might also have relationship with sex. In our study, the erythrocyte incorporation of 57Fe at 14th day was 19.49% for girls and 18.79% for boys, which were greater not only than those infants[7] and younger children but also adults[33]. However, our results in 14th day were still lower than those obtained by Woodhead et al.[24], most likely because their subjects were given 58Fe without food during 2 h but with an additional 60 mL of Kool-Aid and 70 mg of vitamin C, which all have been proved can increase the absorption rate of iron[34,35]. In addition, the iron intake of boys were more than that of girls, but the absorption and erythrocyte incorporation rates for boys were lower in 28th day, 60th day, and 90th day. We anticipated that this difference might be related to hormonal differences and the puberty level, which was affected by rapid physical growth. Prepubertal girls often need more iron to meet their rapid growth, and this stage of development typically occurs much earlier in girls than boys. Once reaching adolescence, girls tend to need more iron due to menstrual loss, in which females present a high rate of anemia[36]. Yin et al.[37] also found a similar phenomenon that the absorption rate of iron was strongly correlated with the level of development, particularly in adolescence. They reported that boys always presented lower values than girls. Therefore, prepubertal girls should begin to increase the intake of iron to avoid the higher risk of iron deficiency and further studies should pay more attention to the iron status and health of preadolescent children.
There are some limitations in this study. Our study used a single-labeled stable isotope technique. Although dual-isotope tracer method which is more accurate and can eliminate the errors caused by gastrointestinal iron loss is used in most investigations, it still has some disadvantages. It requires a sufficient enrichment level in erythrocytes[38], means more cost for large amount of isotopes were needed, as well as the difficulties associated with sample collection[13]. In addition, the intravenous administration of stable iron is not suitable for specific populations, such as infants, children and pregnant women, particularly in China. Based on the premise that nearly 80% of the newly absorbed iron will be incorporated into erythrocytes within two weeks[39,9], single isotope can be used for the determination of iron absorption and utilization after oral administration. This method worked well in iron absorption studies of children and infants[10], partly because their erythrocyte iron pool is not large and easy to detect[5]. In the present study, 57Fe was selected not only because the administration of isotopes orally usually required a relatively large dose, but also the lower abundance and price. In order to reduce the potential impact of endogenous loss and extend observation time, we increased the administered duration and dose to obtain sufficient in vivo accumulation data to assess changes in abundance over time. Furthermore, it is more easily accepted by children and their families in China than intravenous. So our study can also reflect the iron utilization in the Chinese prepubertal children and provide a reference for further studies to assess the physiological needs of iron.
-
Our study determined the erythrocyte iron incorporation with a single dose of stable iron in the Chinese prepubertal children within 90 d. We found the erythrocyte incorporation rates of 57Fe obtained for girls in 60th day was significantly higher than those obtained for boys. Prepubertal girls should begin to increase the intake of iron to avoid the higher risk of iron deficiency and further studies should pay more attention to the iron status in prepubertal children.
-
We would like to thank National Institute of Metrology for their excellent technical assistance and advice during this study.
-
The authors declare that they have no conflict of interest.


Funds:
This work was supported by the National Natural Science Foundation of China [grant number 81330066]

 Quick Links
 DownLoad:
