


-
In China, the dramatic increase in the burden of ischemic heart disease has been accompanied by rapidly expanded use of coronary catheterization and percutaneous coronary intervention (PCI)[1-5]. Hospital readmission rates following PCI are considered as important measures of the quality of care and have important economic implications for the overall healthcare system[6-7]. Revascularization procedures are frequent, costly, and the earliest cause for rehospitalization of patients with acute coronary syndrome (ACS) who underwent PCI[8]. A multicenter data with 315,241 PCI procedures showed that among all the patients readmitted within 30 days after the index PCI, 27.5% had an associated revascularization procedure[9]. Therefore, it is meaningful to study the characteristics of the population readmitted for unplanned revascularization (UR), and the predictors of this adverse event to prevent its occurrence. Several studies have highlighted this area in China and abroad[10-12]. For example, it was reported that multivessel disease and in-hospital PCI with a bare metal stent were independently associated with rehospitalization for UR following acute myocardial infarction (AMI)[10]. However, large sample data is still limited regarding the risk or beneficial factors associated with UR after PCI in patients with coronary artery disease (CAD) in China. To address this gap in knowledge, we analyzed a large cohort of patients with all spectra of CAD who underwent PCI. The patients were prospectively enrolled in the largest cardiovascular center in China, wherein validated unplanned coronary revascularization procedures in two-year follow-up after discharge were collected.
-
Ethical approvals were obtained from the Fuwai Hospital Research Ethics Committees (No. 2013-449). The Institutional Review Board approved the study protocol, and all the patients signed a written informed consent before procedure, including a full set of risk-informed consent and information-use consent, for scientific purposes.
-
A total of 10,724 cases with CAD who underwent PCI were enrolled from January 2013 to December 2013 in Fuwai Hospital, Beijing, the largest cardiovascular center in China. This research was an all-comer cohort study without inclusion and exclusion criteria. Before selective PCI, if not taking long-term aspirin or clopidogrel, patients orally received aspirin and P2Y12 inhibitor with loading dose. Patients with ACS who underwent primary PCI received the same dose of aspirin and clopidogrel (loading dose of 300 or 600 mg depending on the bleeding risk) in the emergency department as soon as possible. Ticagrelor was seldom used in our center in 2013, and it was only applied when clopidogrel resistance was observed, and patients were willing to take the medicine at their own expense (loading dose of 180 mg or cumulative dose of 180 mg, followed by 90 mg twice a day). Dual antiplatelet therapy (DAPT) was prescribed for at least one year after drug-eluting stent (DES) implantation and at least one month after bare-metal stent implantation. All patients diagnosed with AMI received low-molecular-weight heparin (LMWH) or fondaparinux for seven days regardless of intervention therapy. Patients with non-ST segment elevation ACS (NSTE-ACS) who were recognized as high-ischemic-risk group were also treated with LMWH or fondaparinux before the following selective coronary angiography (CAG). Patients with stable CAD (SCAD) were treated with LMWH or fondaparinux for 2–3 days after PCI based on the nature of lesions and operational circumstances.
Before CAG, 3000 U heparin sodium was administered through an arterial sheath or intravenously. Before PCI, 100 U/kg heparin sodium was administered. The dose was lowered to 50–70 U/kg in patients over 70 years old to reduce the bleeding risk. If PCI proceeded for more than 1 h, an additional 1,000 U heparin sodium was administered. CAG results were read by experienced cardiologists. More than 50% stenosis of left main (LM) artery, left anterior descending artery (LAD), left circumflex artery (LCX), right coronary artery (RCA), and main branch of these vessels was defined as coronary artery stenosis. More than 70% stenosis of LAD, LCX, or RCA or more than 50% stenosis of LM artery along with ischemic symptoms or ischemic evidence shown by examinations were indicated for coronary stent implantation. Synergy Between Percutaneous Coronary Intervention with Taxus and Cardiac Surgery (SYNTAX) score (SS) and residual SS (RSS) were assessed by two of the three experienced cardiologists, who were blinded to clinical outcomes, in an independent angiographic core laboratory. Incomplete revascularization (ICR) was defined as RSS > 8, which was identified as a level strongly associated with increased mortality and other adverse ischemic events[13].
-
The patients who underwent PCI had follow-up appointments after 30 days, 6 months, and every 1 year thereafter. Information on in-hospital outcome was obtained through review of medical records, whereas the long-term clinical outcomes were collected from a survey completed by telephone follow-up, follow-up letter, or visit. A group of independent clinical physicians checked and confirmed all adverse events. Investigator training, blinded questionnaire filling, and telephone recording were performed to control the data quality.
Endpoints included all-cause death, cardiac death, UR, myocardial infarction (MI), stent thrombosis (ST), stroke, and bleeding. UR was defined as unplanned readmission for percutaneous transluminal coronary angioplasty (PTCA), PCI, or coronary artery bypass graft (CABG) driven by coronary ischemia. Staged revascularization procedures were all excluded. The 30-day, 1-, and 2-year revascularization groups were selected as analysis cohorts in accordance with the recorded revascularization time within 30, 395, and 760 days after PCI. ST was defined as definite, probable, and possible ST in accordance with the Academic Research Consortium criteria. All-cause death was considered as a competing event of revascularization. MI and ST were used to identify the causes of revascularization in this study.
-
Data statistics was applied using SPSS 22.0 (IBM Corp., Armonk, New York, USA) and Stata 12.0 (Stata Corp., College Station, Texas, USA). The continuous variables were all normally distributed and presented as mean ± standard deviation. The categorical variables were presented as frequency or ratio. The continuous variables were compared using Student’s t tests, whereas categorical variables were compared using Pearson chi-square tests between two groups.
We considered death as a competing event of UR. We constructed a series of multivariable Cox regression models (1) to identify specific predictors of 30-day revascularization in traditional COX regression model, considering that cases of deaths within the first month were excluded before follow-up; (2) to identify specific predictors of 1- and 2-year revascularization both in traditional COX regression models and competing risk models. Covariates selected for COX regression were the variables with significant differences or significant tendencies between the two groups in baseline analysis (Tables 1 and 2). All covariates were entered in regression functions. All P values were two-sided with a significance level of 0.05. The tendency of significant difference was assessed when 0.05 < P < 0.10. The model coefficients of the three cohorts were tested by Omnibus tests.
Variables Entire cohort
(n = 10,640)30-day UR
group
(n = 33)30-day non-UR
group
(n = 10,607)P value 1-year UR
group
(n = 691)1-year non-UR
group
(n = 9,949)P value 2-year UR
group
(n = 923)2-year non-UR
group
(n = 9,717)P value Demographic characteristics Male gender, % 8,222 (77.3) 22 (66.7) 8,200 (77.3) 0.145 547 (79.2) 7,675 (77.1) 0.221 743 (80.5) 7,479 (77.0) 0.014 Age, years 58.3 ± 10.3 62.3 ± 9.7 58.3 ± 10.3 0.027 57.7 ± 10.1 58.4 ± 10.3 0.121 57.6 ± 10.1 58.4 ± 10.3 0.037 BMI, kg/m2 25.9 ± 3.2 27.0 ± 3.2 25.9 ± 3.2 0.063 26.0 ± 3.2 25.9 ± 3.2 0.358 26.1 ± 3.2 25.9 ± 3.2 0.173 Coexisting conditions, % Hypertension 6,847 (64.4) 25 (75.8) 6,822 (64.3) 0.171 447 (64.7) 6,400 (64.3) 0.848 602 (65.2) 6,245 (64.3) 0.563 DM 3,221 (30.3) 10 (30.3) 3,211 (30.3) 0.997 230 (33.3) 2,991 (30.1) 0.075 306 (33.2) 2,915 (30.0) 0.046 Hyperlipidemia 7,159 (67.3) 17 (51.5) 7,142 (67.3) 0.053 474 (68.6) 6,685 (67.2) 0.447 646 (70.0) 6,513 (67.0) 0.067 Previous MI 2,044 (19.2) 6 (18.2) 2,038 (19.2) 0.881 139 (20.1) 1,905 (19.1) 0.532 190 (20.6) 1,854 (19.1) 0.267 Prior PCI or CABG 2,783 (26.2) 8 (24.2) 2,775 (26.2) 0.802 193 (27.9) 2,590 (26.0) 0.272 270 (29.3) 2,513 (25.9) 0.025 Family history of CAD 2,630 (24.7) 4 (12.1) 2,626 (24.8) 0.093 179 (25.9) 2,451 (24.6) 0.445 247 (26.8) 2,383 (24.5) 0.124 CVD 1,141 (10.7) 3 (9.1) 1,138 (10.7) 0.761 73 (10.6) 1,068 (10.7) 0.889 96 (10.4) 1,045 (10.8) 0.74 PVD 286 (2.7) 0 (0.0) 286 (2.7) 0.339 22 (3.2) 264 (2.7) 0.405 30 (3.3) 256 (2.6) 0.269 COPD 247 (2.3) 0 (0.0) 247 (2.3) 0.375 11 (1.6) 236 (2.4) 0.188 18 (2.0) 229 (2.4) 0.433 LVEF, % 62.8 ± 7.2 60.5 ± 7.5 62.8 ± 7.2 0.077 62.0 ± 7.5 62.8 ± 7.2 0.003 62.3 ± 7.4 62.8 ± 7.2 0.044 Clinical presentation, % Angina pectoris 0.167 0.161 0.236 Asymptomatic ischemia 864 (8.1) 1 (3.0) 863 (8.1) 42 (6.1) 822 (8.3) 60 (6.5) 804 (8.3) Stable angina 3,396 (31.9) 7 (21.2) 3,389 (32.0) 226 (32.7) 3,170 (31.9) 307 (33.3) 3,089 (31.8) Unstable angina pectoris 4,481 (42.1) 20 (60.6) 4,461 (42.1) 288 (41.7) 4,193 (42.1) 384 (41.6) 4,097 (42.2) AMI 1,899 (17.8) 5 (15.2) 1,894 (17.9) 0.687 135 (19.5) 1,764 (17.7) 0.225 172 (18.6) 1,727 (17.8) 0.503 Laboratory examination eGFR before PCI, mL/(min·1.73m2) 91.3 ± 15.1 90.5 ± 14.1 91.3 ± 15.1 0.756 91.3 ± 15.1 91.3 ± 15.1 0.99 91.7 ± 15.3 91.3 ± 15.1 0.510 HGB before PCI, g/L 141.1 ± 15.8 137.1 ± 16.0 141.1 ± 15.8 0.143 140.8 ± 15.4 141.1 ± 15.8 0.644 141.3 ± 15.4 141.1 ± 15.8 0.656 PLT before PCI, 109/L 203.5 ± 54.4 195.6 ± 36.9 203.6 ± 54.4 0.402 206.0 ± 57.6 203.4 ± 54.1 0.22 206.7 ± 57.0 203.2 ± 54.1 0.063 Uric acid, μmol/L 341.6 ± 84.7 311.8 ± 66.8 341.7 ± 84.8 0.043 349.0 ± 88.7 341.0 ± 84.4 0.017 348.1 ± 86.6 340.9 ± 84.5 0.014 HbA1c, % 6.6 ± 1.2 6.8 ± 1.4 6.6 ± 1.2 0.499 6.7 ± 1.2 6.6 ± 1.2 0.023 6.7 ± 1.2 6.6 ± 1.2 0.011 LDL-C, mmol/L 2.51 ± 0.90 2.73 ± 1.16 2.51 ± 0.90 0.156 2.51 ± 0.93 2.51 ± 0.90 0.894 2.54 ± 0.94 2.50 ± 0.90 0.269 ESR, mm/h 10.8 ± 11.3 9.5 ± 7.3 10.8 ± 11.3 0.497 11.5 ± 11.9 10.8 ± 11.2 0.076 11.4 ± 11.9 10.7 ± 11.2 0.072 Medication at discharge, % Aspirin 10,503 (98.7) 33 (100.0) 10,470 (98.7) 0.511 680 (98.4) 9,823 (98.7) 0.463 909 (98.5) 9,594 (98.7) 0.518 Clopidogrel 10,617 (99.8) 33 (100.0) 10,584 (99.8) 0.789 690 (99.9) 9,927 (99.8) 0.676 922 (99.9) 9,695 (99.8) 0.46 Ticagrelor 19 (0.2) 0 (0.0) 19 (0.2) 0.808 1 (0.1) 18 (0.2) 0.827 1 (0.1) 18 (0.2) 0.597 DAPT 10,501 (98.7) 33 (100.0) 10,468 (98.7) 0.508 680 (98.4) 9,821 (98.7) 0.494 909 (98.5) 9,592 (98.7) 0.556 Statin 10,206 (95.9) 32 (97.0) 10,174 (95.9) 0.760 660 (95.5) 9,546 (95.9) 0.576 887 (96.1) 9,319 (95.9) 0.774 Calcium antagonist 5,184 (48.7) 20 (60.6) 5,164 (48.7) 0.171 325 (47.0) 4,859 (48.8) 0.358 446 (48.3) 4,738 (48.8) 0.799 β-blocker 9,591 (90.1) 28 (84.8) 9,563 (90.2) 0.307 629 (91.0) 8,962 (90.1) 0.419 833 (90.2) 8,758 (90.1) 0.908 LMWH or fondaparinux 8,828 (83.0) 29 (87.9) 8,799 (83.0) 0.452 502 (72.6) 8,326 (83.7) < 0.001 687 (74.4) 8,141 (83.8) < 0.001 Note. AMI, acute myocardial infarction; BMI, body mass index; BMS, bare metal stent; CAD, coronary artery disease; CABG, coronary artery bypass grafting; COPD, chronic obstructive pulmonary disease; CVD, cerebral vascular disease; DES, drug-eluting stent; DM, diabetes mellitus; DAPT, dual anti-platelet therapy; eGFR, estimated glomerular filtration rate; ESR, erythrocyte sedimentation rate; HGB, hemoglobin; HbA1c, hemoglobin A1c; LAD, left anterior descending artery; LM, left main; LMWH, low molecular weight heparin; LDL-C, low density lipoprotein cholesterol; LVEF, left ventricular ejection fraction; MI, myocardial infarction; PCI, percutaneous coronary intervention; PLT, platelet; PTCA, percutaneous transluminal coronary angioplasty; PVD, peripheral vascular disease; SYNTAX, Synergy Between Percutaneous Coronary Intervention With Taxus and Cardiac Surgery; TC, total cholesterol; UR, unplanned revascularization.
Data are expressed as mean ± standard deviation; or counts (percentage).
BMI was defined as weight in kilograms divided by height in meters squared (kg/m2), using the Cooperative Meta-analysis Group of China Obesity Task Force BMI classification.Table 1. The clinical characteristics of 30-day, 1-year and 2-year UR groups
Variables Entire cohort
(n = 10,640)30-day UR
group
(n = 33)30-day non-UR
group
(n = 10,607)P value 1-year UR
group
(n = 691)1-year non-UR
group
(n = 9,949)P value 2-year UR
group
(n = 923)2-year non-UR
group
(n = 9,717)P value Angiographic and procedural characteristics SYNTAX score 11.7 ± 8.1 16.9 ± 8.7 11.7 ± 8.1 < 0.001 14.8 ± 9.0 11.5 ± 8.0 < 0.001 14.1 ± 9.0 11.5 ± 8.0 < 0.001 High SYNTAX scores (≥ 33), % 169 (1.6) 1 (3.0) 168 (1.6) 0.507 21 (3.0) 148 (1.5) 0.002 28 (3.0) 141 (1.5) < 0.001 Residual SYNTAX score 3.4 ± 5.7 6.7 ± 7.5 3.4 ± 5.7 0.018 5.7 ± 7.1 3.2 ± 5.5 < 0.001 5.6 ± 7.1 3.2 ± 5.5 < 0.001 Incomplete revascularization, % 1,526 (14.3) 12 (36.4) 1,514 (14.3) < 0.001 183 (26.5) 1,343 (13.5) < 0.001 238 (25.8) 1,288 (13.3) < 0.001 LM or three-vessel disease, % 453 (4.3) 4 (12.1) 449 (4.2) 0.025 24 (3.5) 429 (4.3) 0.291 31 (3.4) 422 (4.3) 0.157 LAD involvement, % 9,626 (90.5) 25 (75.8) 9,601 (90.5) 0.004 592 (85.7) 9,034 (90.8) < 0.001 793 (85.9) 8,833 (90.9) < 0.001 Number of target lesions 1.40 ± 0.66 2.36 ± 1.56 1.40 ± 0.66 0.001 1.47 ± 0.76 1.40 ± 0.66 0.025 1.46 ± 0.73 1.40 ± 0.66 0.014 Number of stents per patient 1.81 ± 1.11 2.21 ± 1.92 1.80 ± 1.10 0.231 1.84 ± 1.16 1.80 ± 1.10 0.472 1.82 ± 1.15 1.80 ± 1.10 0.667 Time of procedure, min 36.6 ± 31.4 90.9 ± 78.2 36.4 ± 31.0 < 0.001 42.7 ± 39.6 36.2 ± 30.7 < 0.001 41.1 ± 37.4 36.2 ± 30.7 < 0.001 Transradial approach, % 9,677 (90.9) 28 (84.8) 9,649 (91.0) 0.221 614 (88.9) 9,063 (91.1) 0.047 827 (89.6) 8,850 (91.1) 0.135 IVUS, % 592 (5.6) 7 (21.2) 585 (5.5) < 0.001 41 (5.9) 551 (5.5) 0.661 51 (5.5) 541 (5.6) 0.957 Procedure and stent type, % < 0.001 < 0.001 < 0.001 PTCA 233 (2.2) 1 (3.0) 232 (2.2) 31 (4.5) 202 (2.0) 39 (4.2) 194 (2.0) BMS 63 (0.6) 0 (0.0) 63 (0.6) 5 (0.7) 58 (0.6) 6 (0.7) 57 (0.6) First-generation durable polymer DES 594 (5.6) 1 (3.0) 593 (5.6) 35 (5.1) 559 (5.6) 47 (5.1) 547 (5.6) Second-generation durable polymer DES 6,055 (56.9) 15 (45.5) 6,040 (56.9) 0.183 299 (43.3) 5,756 (57.9) < 0.001 424 (45.9) 5,631 (57.9) < 0.001 Domestic biodegradable polymer DES 1,555 (14.6) 1 (3.0) 1,554 (14.7) 99 (14.3) 1,456 (14.6) 128 (13.9) 1,427 (14.7) Mixed implantation of DES 1,685 (15.8) 7 (21.2) 1,678 (15.8) 156 (22.6) 1,529 (15.4) 192 (20.8) 1,493 (15.4) Others (Janus, Yinyi) 164 (1.5) 0 (0.0) 164 (1.5) 16 (2.3) 148 (1.5) 24 (2.6) 140 (1.4) Procedure unsuccess 291 (2.7) 8 (24.2) 283 (2.7) 50 (7.2) 241 (2.4) 63 (6.8) 228 (2.3) Note. BMS, bare metal stent; DP-DES, durable polymer drug-eluting stent; ICR, incomplete revascularization; IVUS, intravascular ultrasound; LAD, left anterior descending artery; LM, left main; PTCA, percutaneous transluminal coronary angioplasty; SYNTAX, Synergy Between Percutaneous Coronary Intervention With Taxus and Cardiac Surgery; UR, unplanned revascularization.
Data are expressed as mean ± standard deviation; or counts (percentage).Table 2. The procedural characteristics of 30-day, 1-year and 2-year UR groups
-
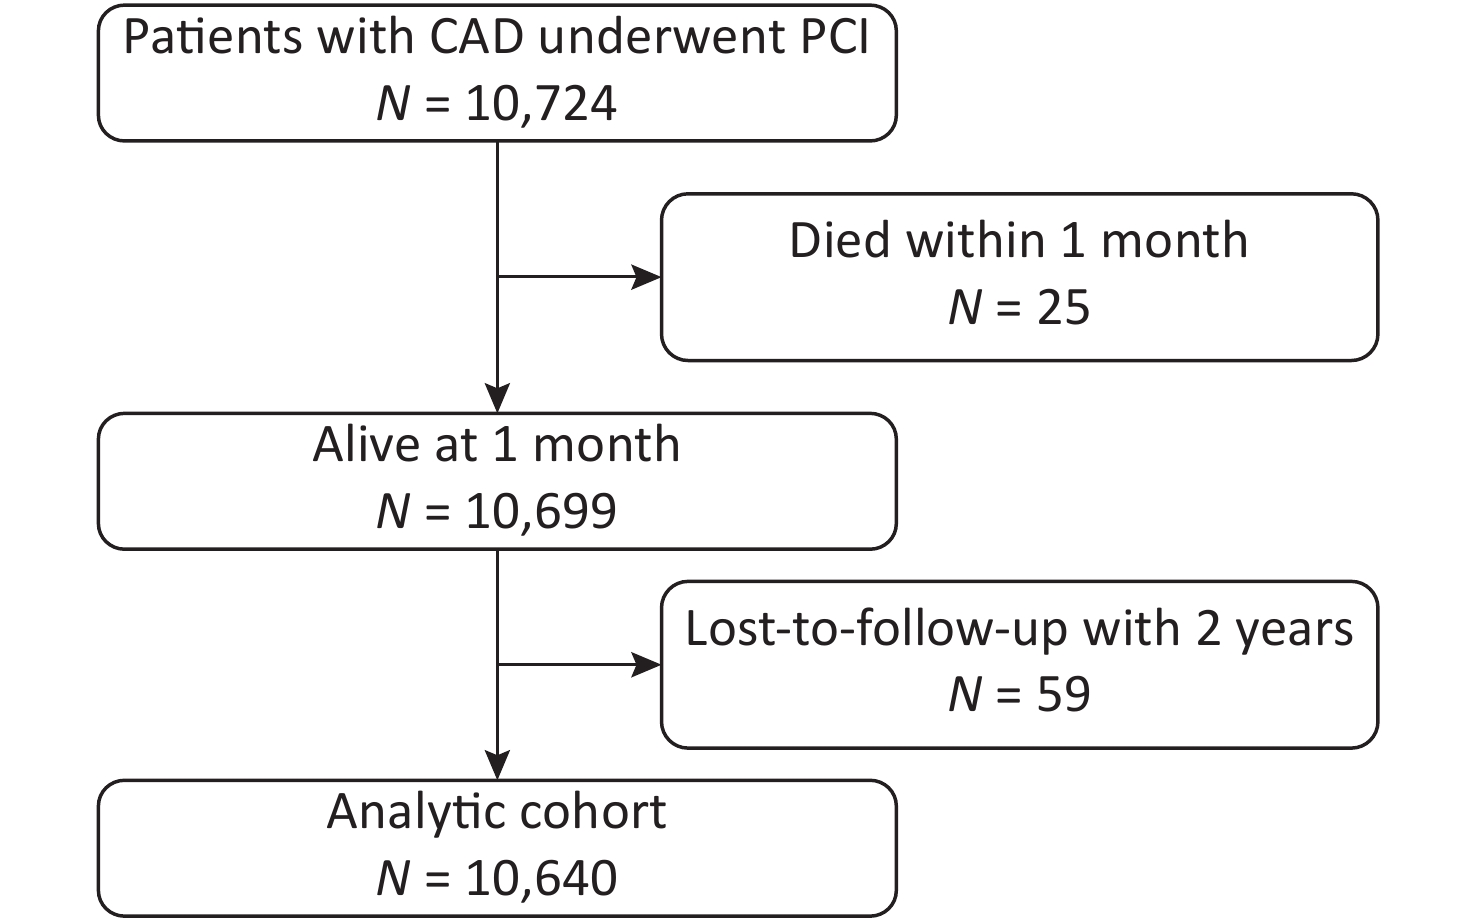
Among the 10,724 patients enrolled, 25 died within the first month and had not been followed-up. Of the 10,699 patients eligible for follow-up, 59 (0.55%) were lost to follow-up. The final analytic cohort comprised the remaining 10,640 patients (Figure 1).
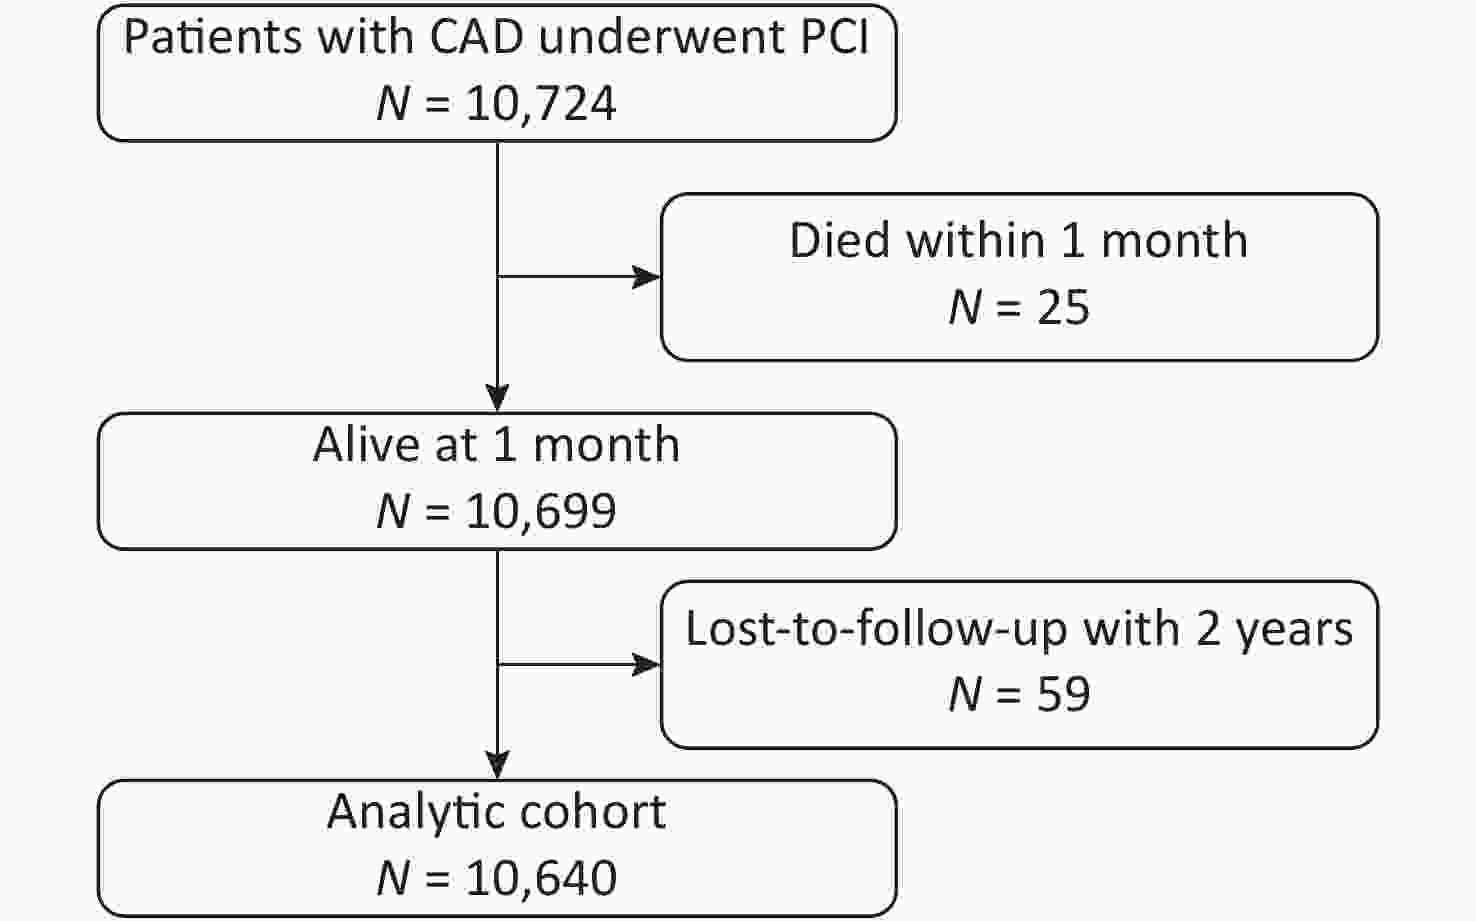
Figure 1. Flowchart.
The patients readmitted for UR in 30 days, 1 year and 2 years accounted for 0.3%, 6.5%, and 8.7% of the analyzed cohort, respectively. The UR group presented a set of characteristics. Compared with the 30-day non-UR group, the 30-day UR group presented with older age (62.3 ± 9.7 vs. 58.3 ± 10.3, P = 0.027), lower uric acid level (311.8 ± 66.8 vs. 341.7 ± 84.8, P = 0.043), higher SS and RSS (16.9 ± 8.7 vs. 11.7 ± 8.1, P < 0.001; 6.7 ± 7.5 vs. 3.4 ± 5.7, P = 0.018), more cases with ICR (36.4% vs. 14.3%, P < 0.001), more LM or three-vessel diseases (12.1% vs. 4.2%, P = 0.025), less LAD involvement (75.8% vs. 90.5%, P = 0.004), more target lesions (2.36 ± 1.56 vs. 1.40 ± 0.66, P = 0.001), longer time of procedure (90.9 ± 78.2 vs. 36.4 ± 31.0, P < 0.001), and more intravascular ultrasound application (21.2% vs. 5.5%, P < 0.001). The 1-year UR group showed higher uric acid (349.0 ± 88.7 vs. 341.0 ± 84.4, P = 0.017) and HbA1c levels (6.7 ± 1.2 vs. 6.6 ± 1.2, P = 0.023), a lower left ventricular ejection fraction (62.0 ± 7.5 vs. 62.8 ± 7.2, P = 0.003), less LMWH or fondaparinux use (72.6% vs. 83.7%, P < 0.001), higher SS and RSS (14.8 ± 9.0 vs. 11.5 ± 8.0, P < 0.001; 5.7 ± 7.1 vs. 3.2 ± 5.5, P < 0.001), more cases with high SS and ICR (3.0% vs. 1.5%, P = 0.002; 26.5% vs. 13.5%, P < 0.001), less LAD involvement (85.7% vs. 90.8%, P < 0.001), more target lesions (1.47 ± 0.76 vs. 1.40 ± 0.66, P = 0.025), longer time of procedure (42.7 ± 39.6 vs. 36.2 ± 30.7, P < 0.001), less transradial approach (88.9% vs. 91.1%, P = 0.047), and less second-generation durable polymer DES (DP-DES) implantation (43.3% vs. 57.9%, P < 0.001) compared with the 1-year non-UR group. The 2-year UR group exhibited younger age (57.6 ± 10.1 vs. 58.4 ± 10.3, P = 0.037), more male (80.5% vs. 77.0%, P = 0.014), more cases had diabetes mellitus (33.2% vs. 30.0%, P = 0.046) and prior PCI/CABG history (29.3% vs. 25.9%, P = 0.025), higher uric acid (348.1 ± 86.6 vs. 340.9 ± 84.5, P = 0.014) and HbA1c levels (6.7 ± 1.2 vs. 6.6 ± 1.2, P = 0.011), less LMWH or fondaparinux use (74.4% vs. 83.8%, P < 0.001), higher SS and RSS (14.1 ± 9.0 vs. 11.5 ± 8.0, P < 0.001; 5.6 ± 7.1 vs. 3.2 ± 5.5, P < 0.001), more cases with high SS and ICR (3.0% vs. 1.5%, P < 0.001; 25.8% vs. 13.3%, P < 0.001), less LAD involvement (85.9% vs. 90.9%, P < 0.001), more target lesions (1.46 ± 0.73 vs. 1.40 ± 0.66, P = 0.014), longer time of procedure (41.1 ± 37.4 vs. 36.2 ± 30.7, P < 0.001), and less second-generation DP-DES implantation (45.9% vs. 57.9%, P < 0.001) compared with the 2-year non-UR group (Tables 1 and 2).
-
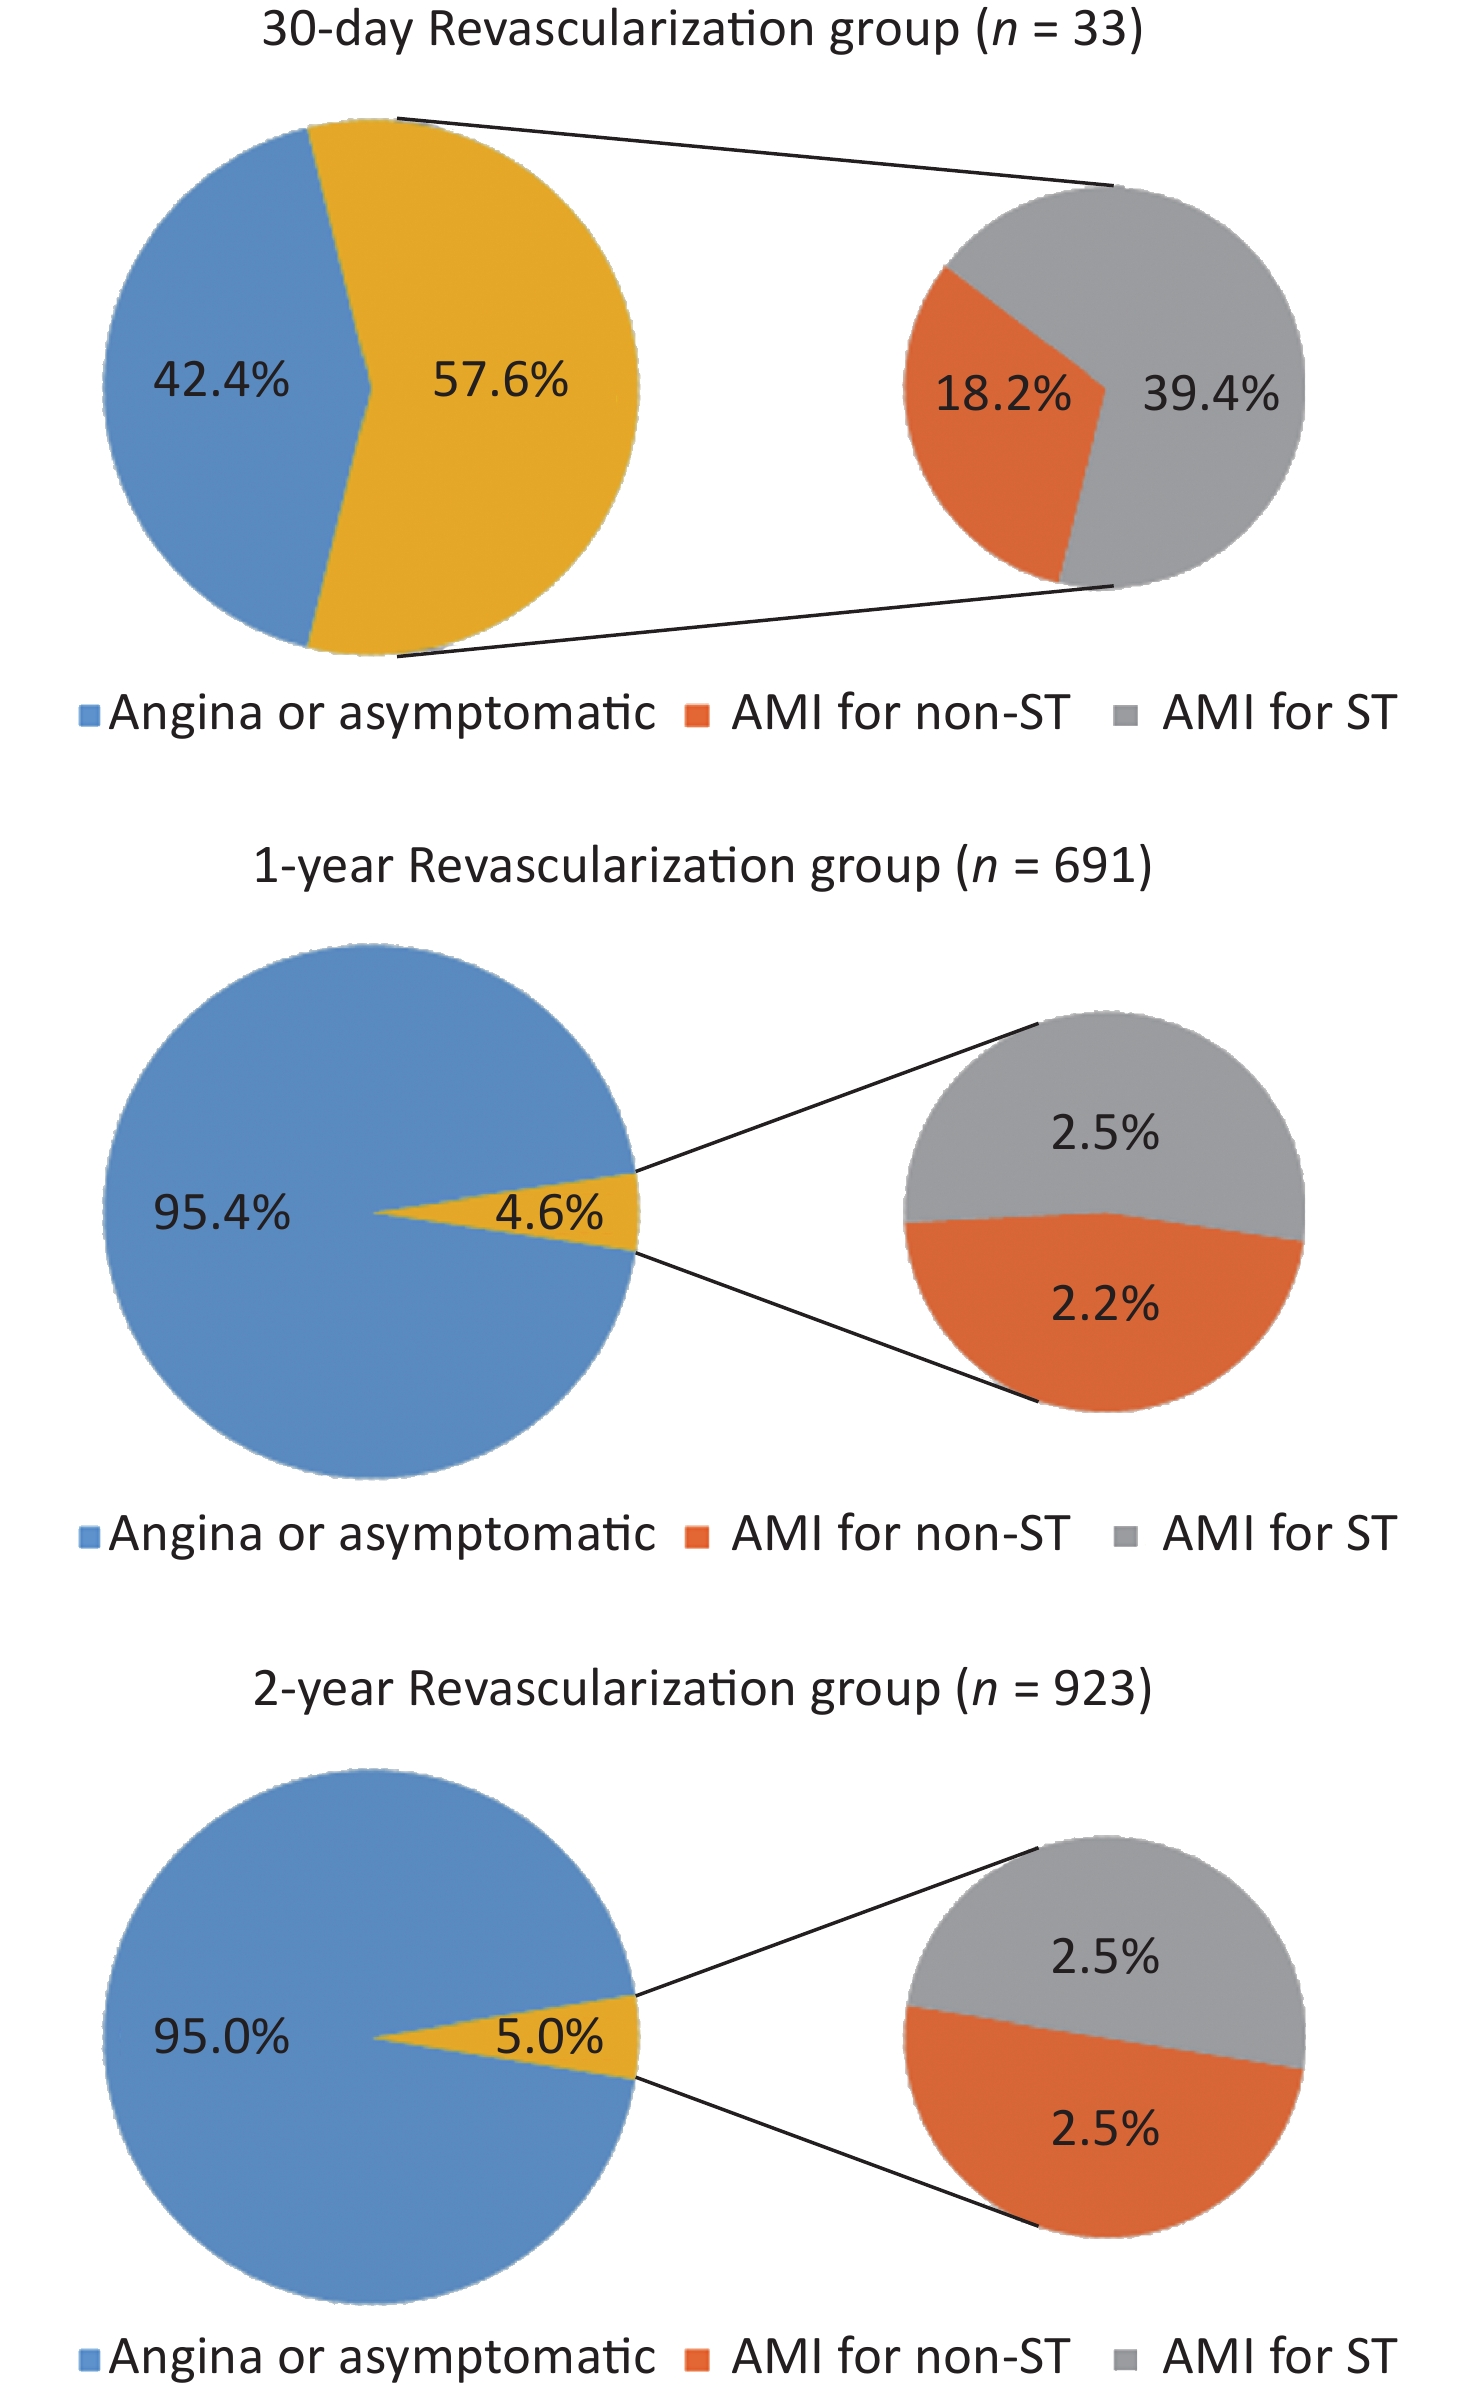
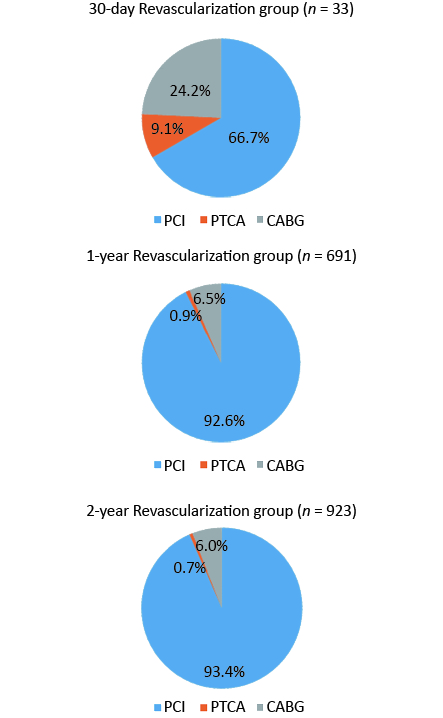
AMI was a more important cause of 30-day UR compared with the 1- and 2-year UR groups (57.6%, 4.6%, and 5.0%, respectively; P < 0.05). ST accounted for 68.4%, 54.3%, and 50% of AMIs (39.4%, 2.5%, and 2.5% of 30-day, 1-, and 2-year UR, respectively) (P < 0.05). CABG and PTCA were the more frequent forms in the 30-day UR group than in the 1- and 2-year UR groups [24.2%, 6.5%, and 6.0%, P < 0.05 (CABG); 9.1%, 0.9%, and 0.7%, P < 0.05 (PTCA)](Figures 2 and 3).
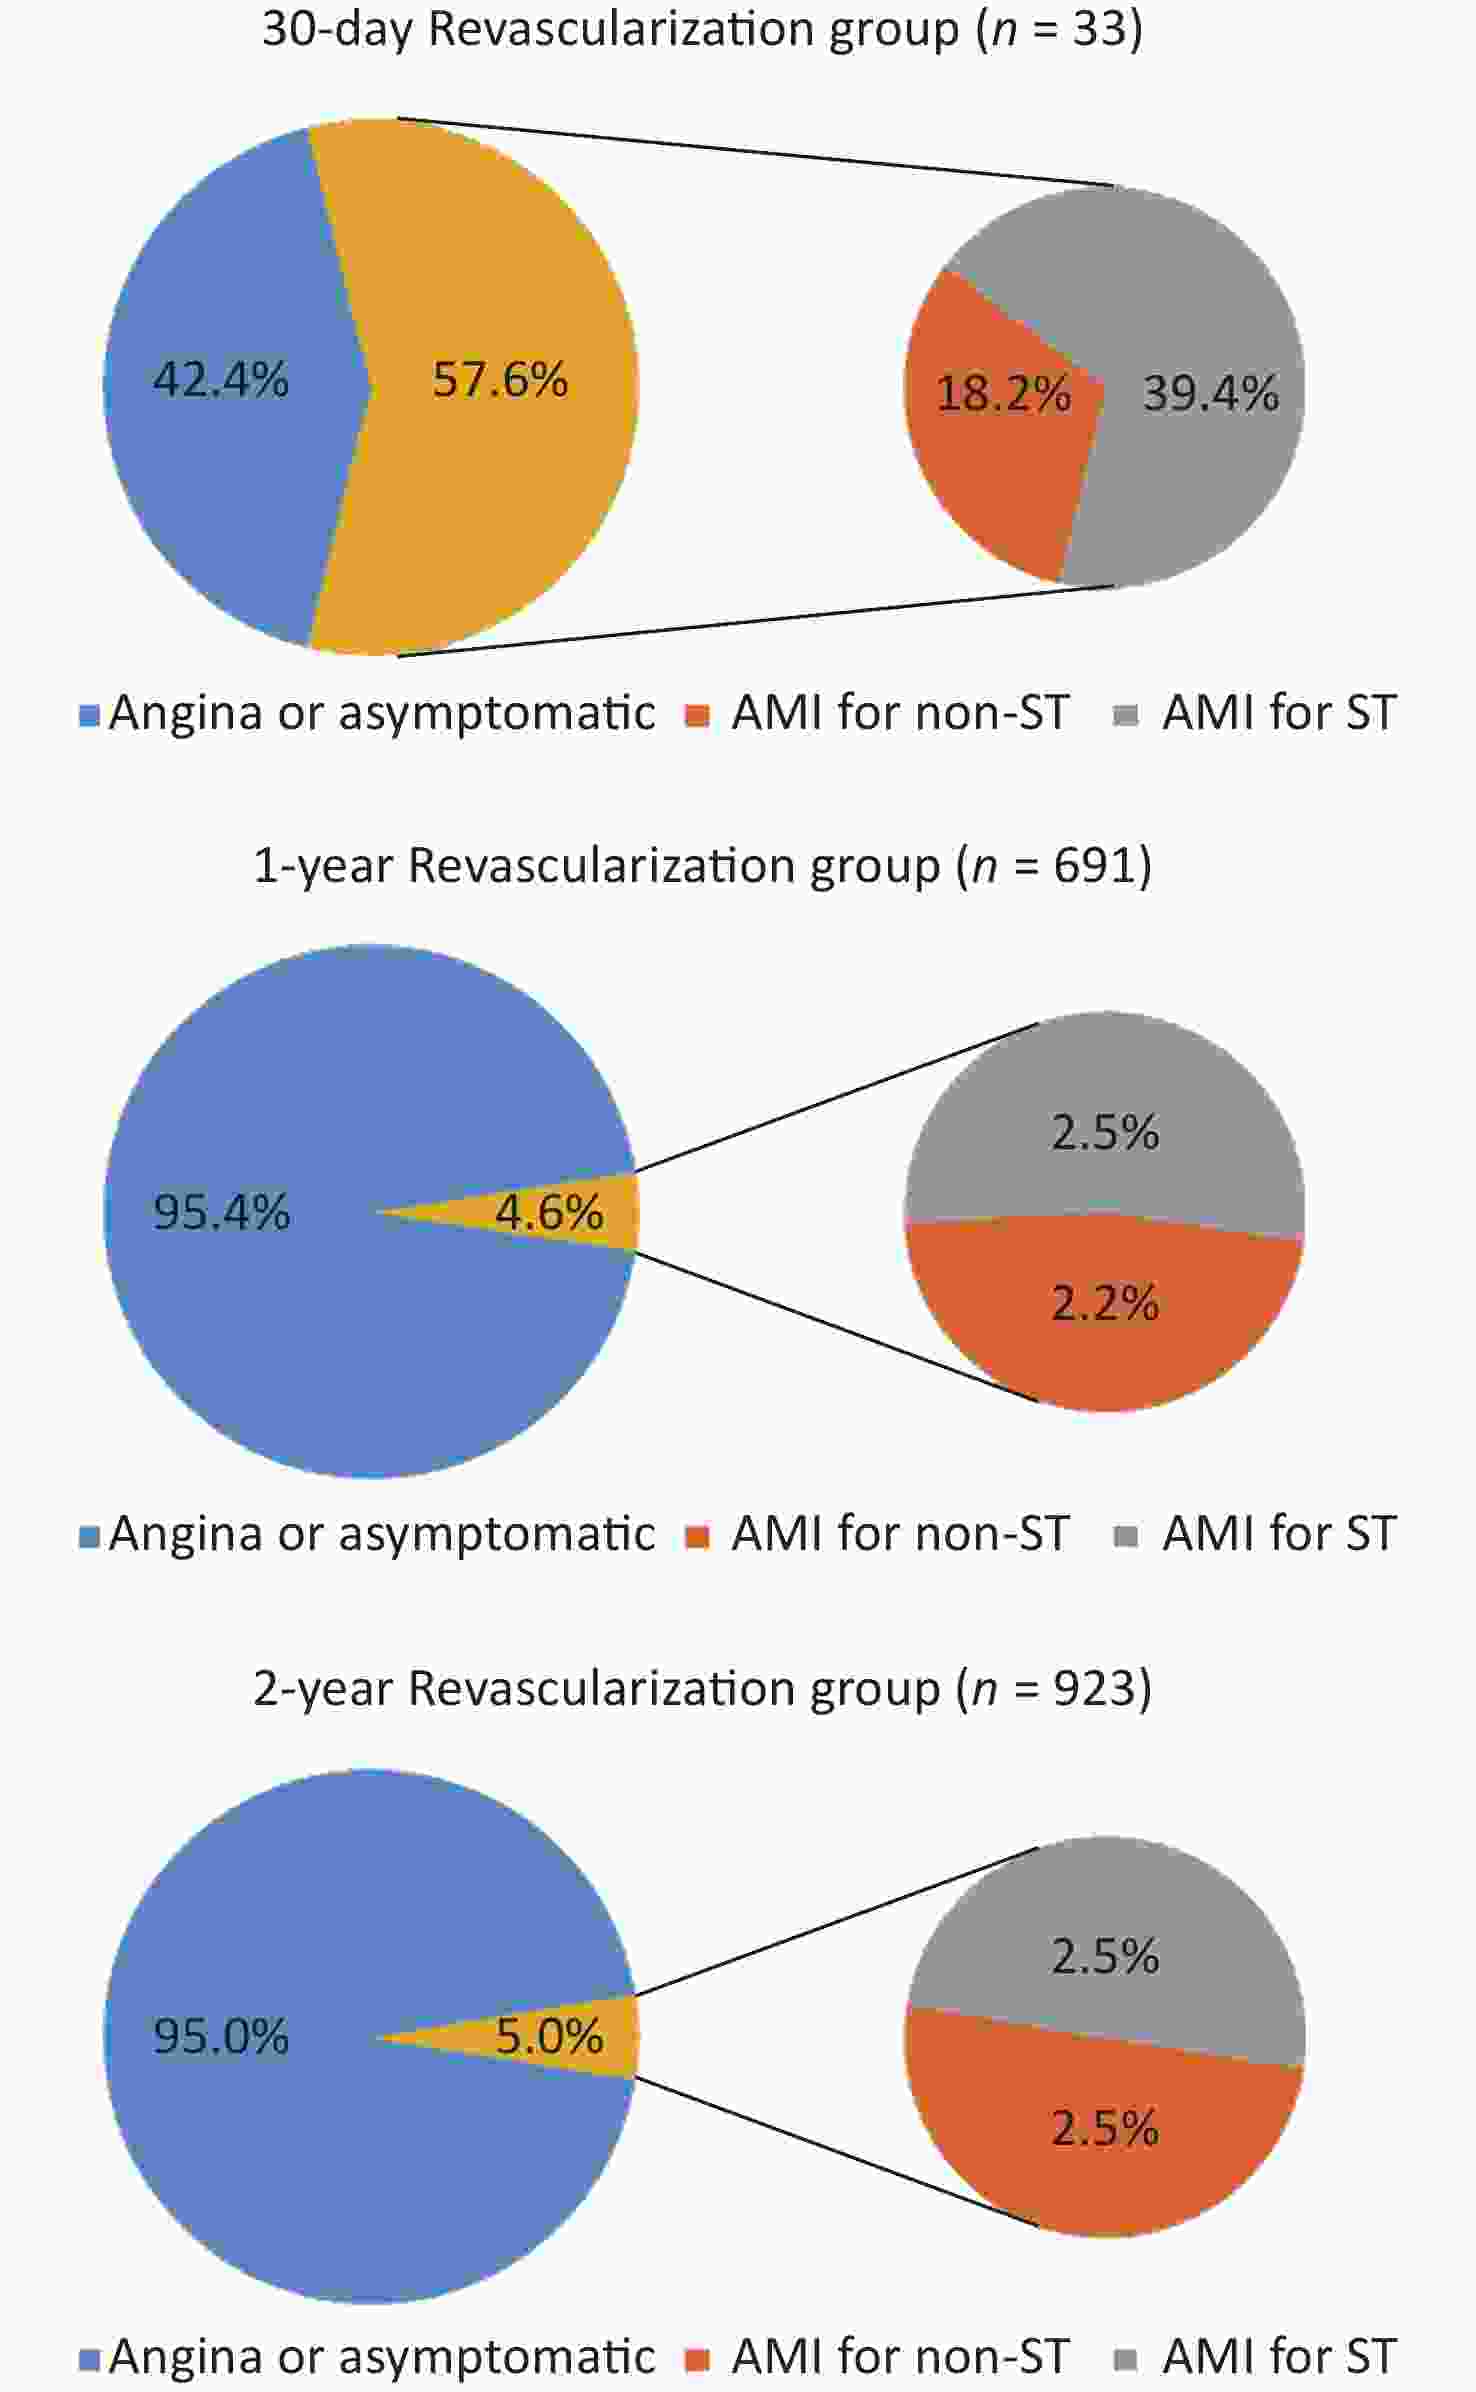
Figure 2. Causes of 30-day, 1-year and 2-year unplanned revascularization.
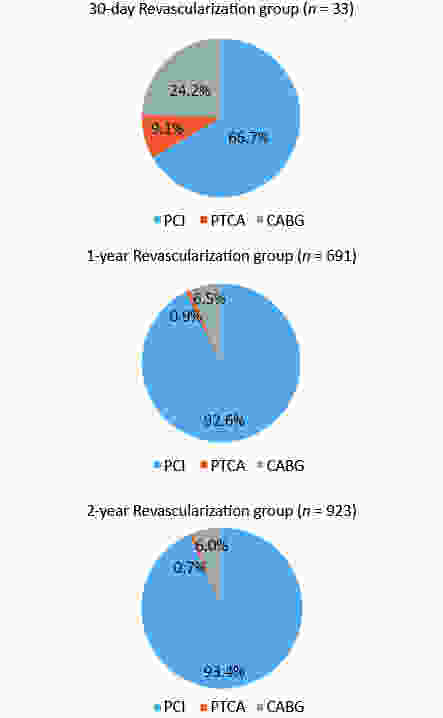
Figure 3. Forms of 30-day, 1-year and 2-year unplanned revascularization.
-
After multivariate adjustment, number of target lesions (HR = 2.320; 95% CI: 1.640–3.277; P < 0.001), time of procedure (HR = 1.006; 95% CI: 1.001–1.010; P = 0.014), body mass index (BMI) (HR = 1.104; 95% CI: 1.006–1.210; P = 0.036), ICR (HR = 2.476; 95% CI: 1.030–5.952; P = 0.043), and age (HR = 1.037; 95% CI: 1.000–1.075; P = 0.048) were determined as independent risk factors of 30-day UR. The patients with hyperlipidemia history showed a significantly lower risk of 30-day UR than those without (HR = 0.429; 95% CI: 0.211–0.872; P = 0.019) (Table 3).
Independent predictor (ordered by Wald value) 30-day UR Wald value HR (95% CI) P value Number of target lesions 22.9 2.320 (1.643–3.277) < 0.001 Time of procedure 6.1 1.006 (1.001–1.010) 0.014 Hyperlipidemia 5.5 0.429 (0.211–0.872) 0.019 BMI 4.4 1.104 (1.006–1.210) 0.036 ICR 4.1 2.476 (1.030–5.952) 0.043 Age 3.9 1.037 (1.000–1.075) 0.048 Note. The following variables were included in multivariable COX regression model: age, BMI, hyperlipidemia, family history of CAD, LVEF, uric acid, SYNTAX score, incomplete revascularization, LM or three-vessel disease, LAD involvement, number of target lesions, time of procedure, IVUS. Abbreviations as in Table 1 and Table 2. Table 3. Factors independently associated with 30-day UR risk
In the 1-year cohort, LMWH or fondaparinux (HR = 0.572; 95% CI: 0.482–0.679; P < 0.001), second-generation DP-DES (HR = 0.661; 95% CI: 0.566–0.771; P < 0.001), and LAD involvement (HR = 0.617; 95% CI: 0.484–0.785; P < 0.001), were independently associated with decreased 1-year UR risk. SS (HR = 1.033; 95% CI: 1.022–1.043; P < 0.001), ICR (HR = 1.382; 95% CI: 1.122–1.701; P = 0.002), time of procedure (HR = 1.002; 95% CI: 1.001–1.004; P = 0.011), and uric acid (HR = 1.001; 95% CI: 1.000–1.002; P = 0.019) were negatively associated with 1-year UR risk. These factors showed consistent effects in the competing risk model. Unexpectedly, number of target lesions (HR = 0.859; 95% CI: 0.741–0.997; P = 0.046) was an independent protective factor of 1-year UR after adjustment of death risk in the competing risk model, despite of just a weak association (Table 4).
Multivariate COX regression Competing risk regression Independent predictor (ordered by Wald value) 1-year UR Independent predictor (ordered by |Z| value) 1-year UR Wald value HR (95% CI) P value |Z| SHR (95% CI) P value LMWH or fondaparinux 41.1 0.572 (0.482–0.679) < 0.001 LMWH or fondaparinux 6.4 0.567 (0.477–0.674) < 0.001 SYNTAX score 38.4 1.033 (1.022–1.043) < 0.001 SYNTAX score 6.4 1.034 (1.024–1.045) < 0.001 Second-generation durable polymer DES 27.7 0.661 (0.566–0.771) < 0.001 Second-generation durable polymer DES 5.4 0.650 (0.556–0.760) < 0.001 LAD involvement 15.4 0.617 (0.484–0.785) < 0.001 LAD involvement 3.7 0.629 (0.491–0.806) < 0.001 Incomplete revascularization 9.3 1.382 (1.122–1.701) 0.002 Incomplete revascularization 2.7 1.356 (1.091–1.684) 0.006 Time of procedure 6.5 1.002 (1.001–1.004) 0.011 Uric acid 2.5 1.001 (1.000–1.002) 0.013 Uric acid 5.5 1.001 (1.000–1.002) 0.019 Time of procedure 2.3 1.002 (1.000–1.004) 0.020 Number of target lesions 2.0 0.859 (0.741–0.997) 0.046 Note. The following variables were included in multivariable COX regression model: DM, LVEF, uric acid, HbA1c, ESR, SYNTAX score, incomplete revascularization, LAD involvement, number of target lesions, time of procedure, transradial approach, second-generation durable polymer DES, LMWH or fondaparinux. Abbreviations as in Table 1 and Table 2. Table 4. Factors independently associated with 1-year UR risk
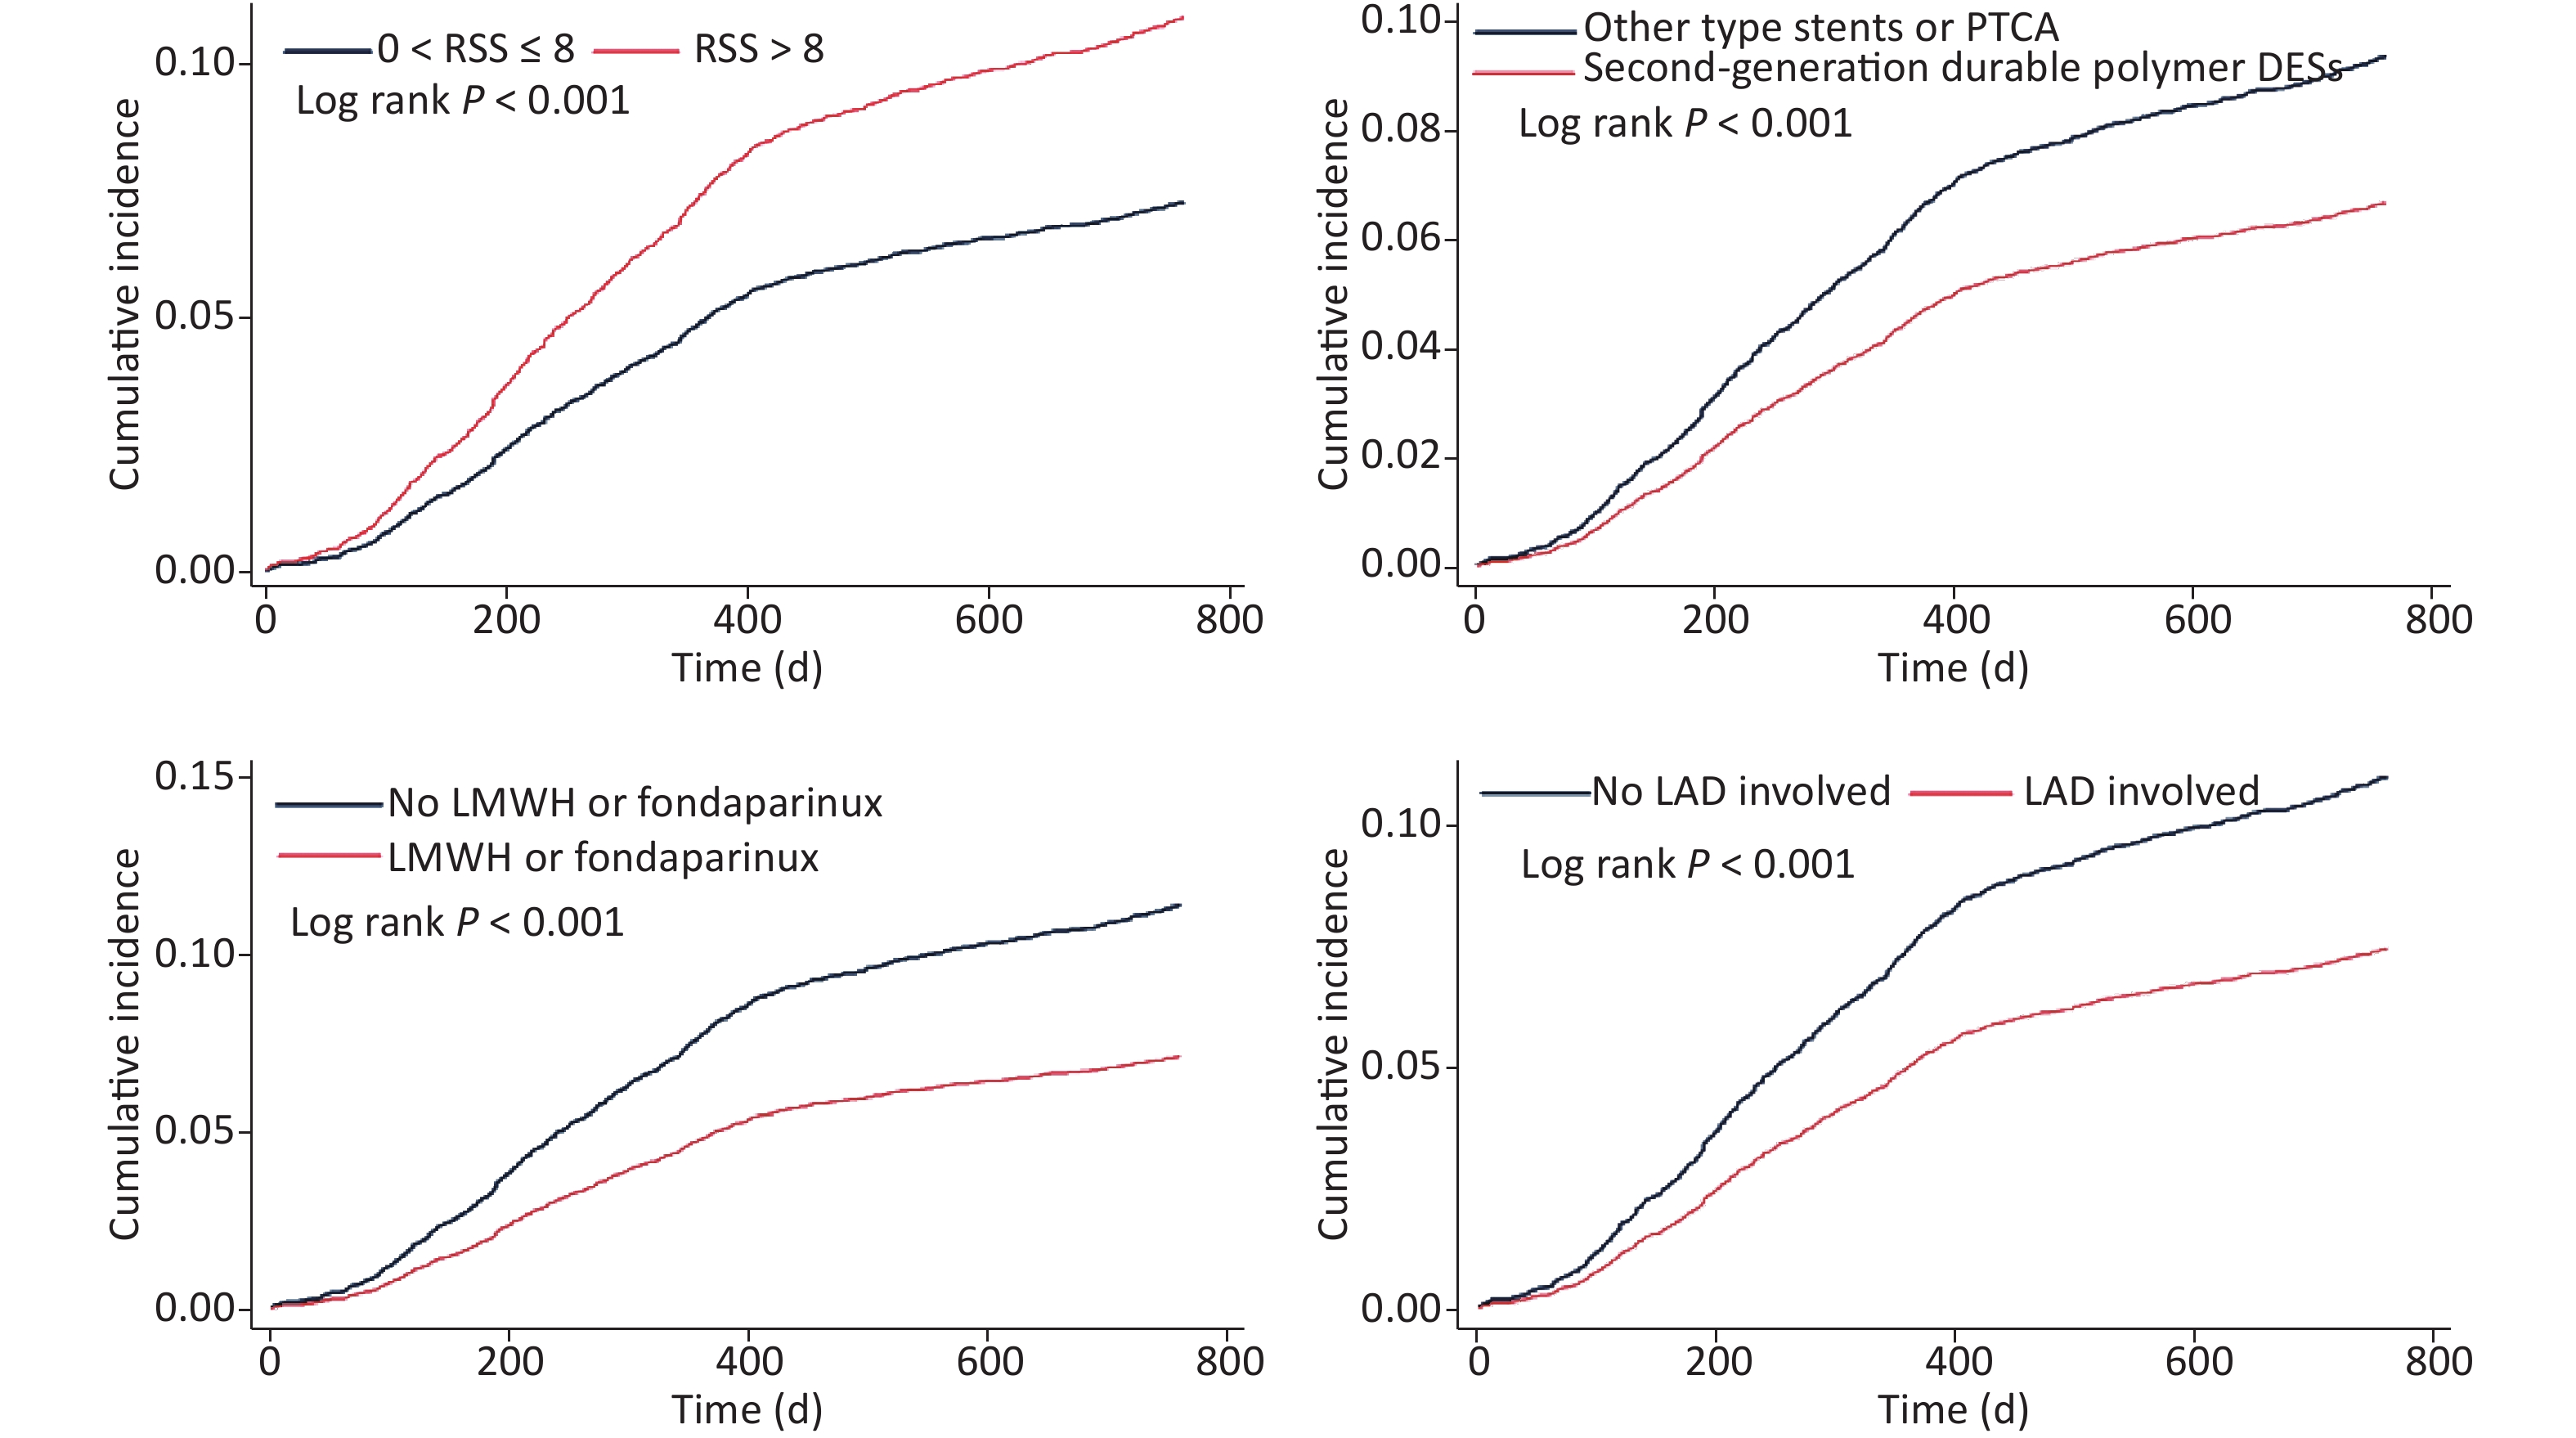
In 2-year cohort, LMWH or fondaparinux (HR = 0.618; 95% CI: 0.531–0.719; P < 0.001), second-generation DP-DES (HR = 0.713; 95% CI: 0.624–0.814; P < 0.001), LAD involvement (HR = 0.654; 95% CI: 0.530–0.807; P < 0.001), and age (HR = 0.992; 95% CI: 0.985–0.998; P = 0.014) were independently associated with decreased 2-year UR risk. SS (HR = 1.024; 95% CI: 1.014–1.033; P < 0.001), ICR (HR = 1.549; 95% CI: 1.290–1.860; P < 0.001), and time of procedure (HR = 1.002; 95% CI: 1.000–1.004; P = 0.042) were negatively associated with 2-year UR risk. In the competing risk model, LMWH or fondaparinux, second-generation DP-DES, SS, ICR, LAD involvement, and age remained significant at the indicated p level, whereas the time of procedure was not. Kaplan–Meier curves in the competing risk model showed that 2-year UR cumulative event rates significantly differed between groups, which were grouped by the variates of ICR, second-generation DP-DES, LMWH or fondaparinux, and LAD involvement (Table 5 and Figure 4).
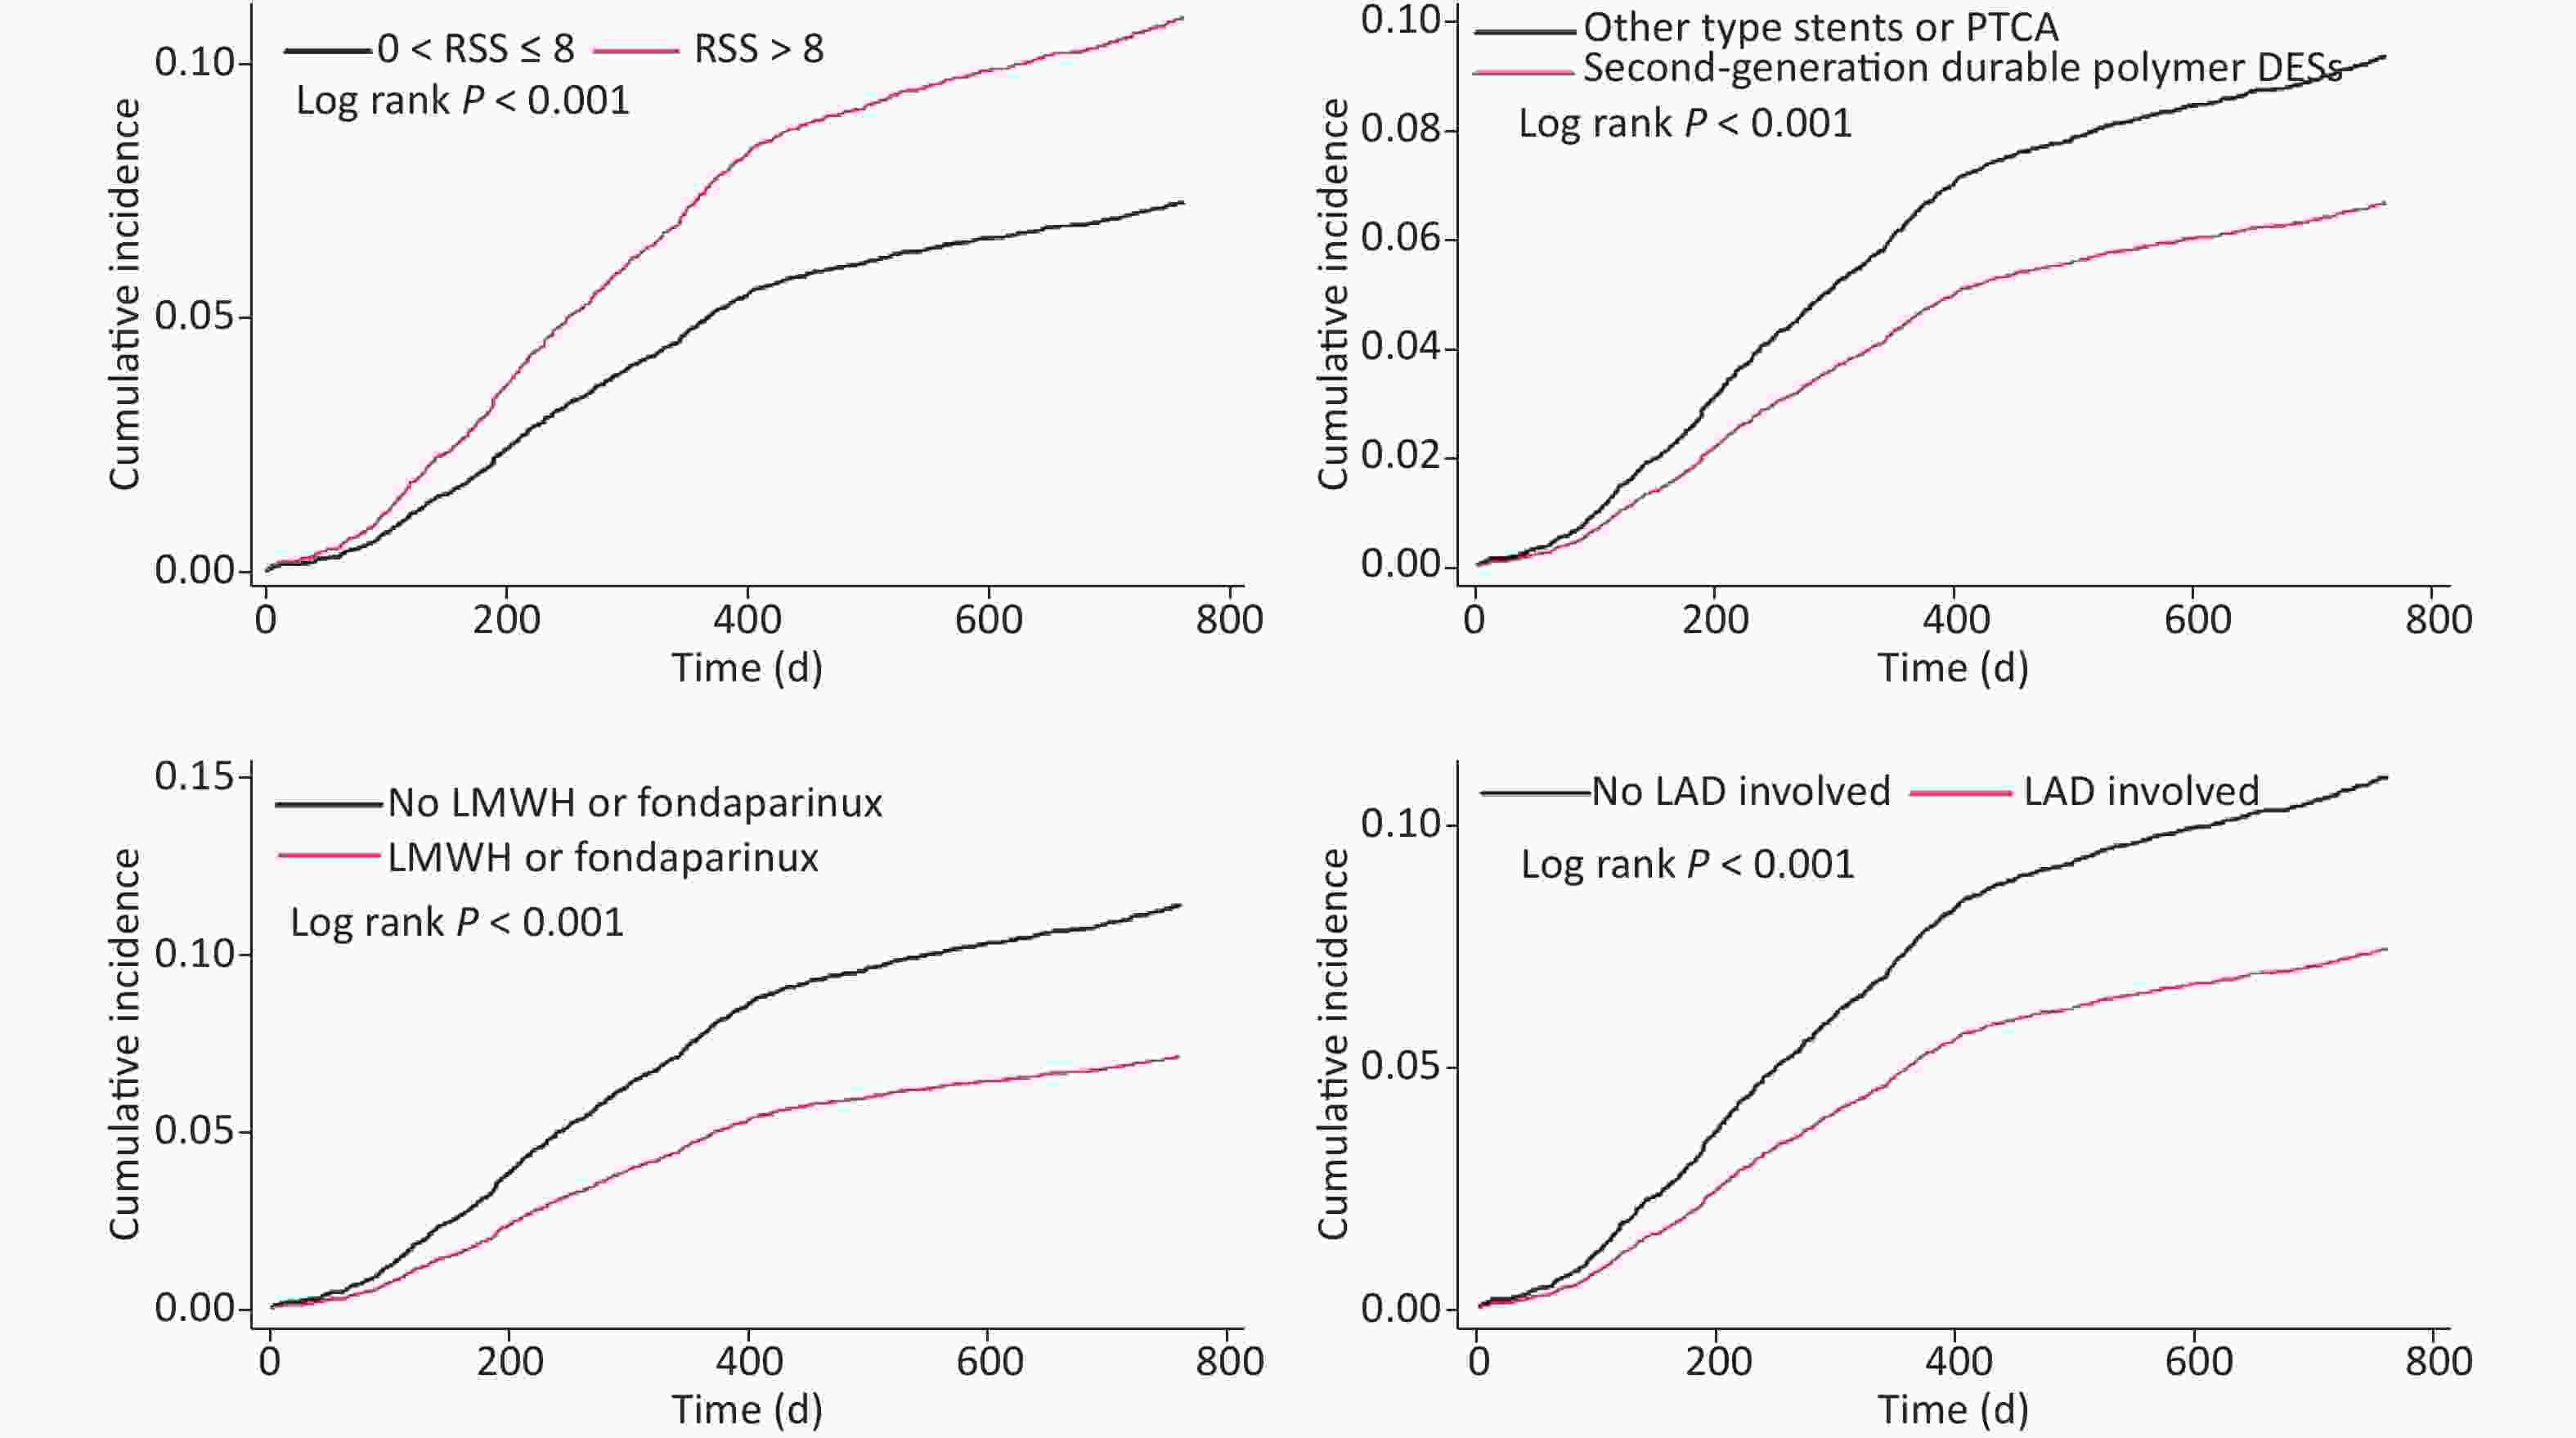
Figure 4. Kaplan–Meier curves of cumulative incidence of 2-year unplanned revascularization, given the competing risk of 2-year all-cause death.
Multivariate COX regression Competing risk regression Independent predictor (ordered by Wald value) 2-year UR Independent predictor (ordered by |Z| value) 2-year UR Wald value HR (95% CI) P value |Z| SHR (95% CI) P value LMWH or fondaparinux 38.7 0.618 (0.531–0.719) < 0.001 LMWH or fondaparinux 6.3 0.613 (0.526–0.714) < 0.001 Second-generation durable polymer DES 25.0 0.713 (0.624–0.814) < 0.001 Second-generation durable polymer DES 5.2 0.704 (0.617–0.805) < 0.001 SYNTAX score 24.7 1.024 (1.014–1.033) < 0.001 SYNTAX score 5.1 1.025 (1.015–1.035) < 0.001 Incomplete revascularization 21.9 1.549 (1.290–1.860) < 0.001 Incomplete revascularization 4.4 1.527 (1.265–1.844) < 0.001 LAD involvement 15.7 0.654 (0.530–0.807) < 0.001 LAD involvement 3.7 0.665 (0.537–0.824) < 0.001 Age 6.0 0.992 (0.985–0.998) 0.014 Age 2.7 0.991 (0.985–0.998) 0.008 Time of procedure 4.1 1.002 (1.000–1.004) 0.042 Note. The following variables were included in multivariable COX regression model: male gender, age, DM, hyperlipidemia, prior PCI or CABG, LVEF, PLT before PCI, uric acid, HbA1c, ESR, SYNTAX score, incomplete revascularization, LAD involvement, number of target lesions, time of procedure, second-generation durable polymer DES, LMWH or fondaparinux. Abbreviations as in Table 1 and Table 2. Table 5. Factors independently associated with 2-year UR risk
-
The study revealed the following findings. 1) The 30-day UR following PCI accounted for 0.3% of the analyzed cohort, more than half of which were caused by AMI; ST was still an important cause of short-term UR. 2) The forms of 30-day UR significantly differed from those of medium-long-term UR. 3) A set of factors had positive or negative associations with short-term or medium-long-term UR. The possible explanations for the lower ischemia-driven revascularization rates in this study compared with the values reported elsewhere were as follows. 1) The whole cohort had an overall low risk with a mean SS of 11.7 ± 8.1. The relatively low values of SS and low prevalence of LM or three-vessel disease in the study population were mainly due to the strict indication of PCI and CABG under international guidelines and expert consensus in China. A small portion of patients who rejected CABG subjectively or could not withstand surgery owing to poor general conditions received PCI after comprehensive informed consent was provided. 2) Secondary prevention medication was normal, as exhibited by DAPT use in 98.7% of patients and statin use in 95.9% of patients at discharge. And persistence of DAPT was recorded till 3 months in 99.4% of patients and 12 months in 69.0% of patients. 3) Patients with purely second-generation DES implantation accounted for more than half of the whole cohort, which is higher than that reported in other large centers in China in 2013[14, 15].
Data on rehospitalizations after PCI showed that approximately 50% of all readmitted PCI patients underwent a repeat revascularization procedure[16]. An analysis of a cohort including 315,241 PCI procedures performed at 1,108 hospitals in 2005 reported that the 30-day all-cause readmission rate of AMI patients was significantly higher than that of non-AMI patients[8]. Baseline analysis showed that the 30-day, 1-, and 2-year readmission rates for UR were similar between AMI patients and non-AMI patients and among patients with subtypes of angina pectoris in this study. These results indicate that UR was not related to admission diagnosis, different from the result of study on all-cause readmission.
This study also showed that AMI accounted for more than half of 30-day UR but less than 5% of medium-long-term UR. ST accounted for more than half of the short-term AMIs after PCI. This result indicates that non-ST-related AMI was also an important cause for short-term UR. Most of ST can be explained by stent or procedure defects, individual gene polymorphisms, or poor medication compliance[17]. Non-ST-related AMI may be more associated with ICR and vulnerability of unstable plaques. On the other hand, for those who underwent medium-long-term revascularization, complaint of recurrent angina after PCI required attention. About 15% of patients who underwent PCI or CABG suffered from recurrent angina; their prognosis should be brought to the forefront[18]. In type II diabetes patients who underwent elective PCI, long-term oral nitrate therapy was needed to control angina symptoms in 42.6% of the patients[19]. The rates of recurrent angina at one and two years in this study were approximately 6.2% and 8.2%, respectively, which are lower than those previously reported; these findings were probably due to relatively low ischemic risk and normal secondary prevention medication in the whole cohort.
The use of LMWH or fondaparinux perioperatively was positively associated with UR risk. Given that patients treated with LMWH or fondaparinux included those diagnosed with ACS or SCAD, determining which subgroup contributed to the significance was difficult. However, this result implies that the benefit brought by perioperative anticoagulation may be underestimated. In cases with NSTE-ACS, enoxaparin or fondaparinux had similar effects in terms of survival or residual angina pectoris[20]. For PCI, meta-analysis showed that LMWH could be considered as a preferred anticoagulant across the spectrum of ACS and as an adjunct to PCI[21, 22]. However, the evidence determining whether patients with SCAD who underwent PCI can benefit from the use of LMWH or fondaparinux following PCI remains insufficient. LMWH or fondaparinux following PCI should be backed up by more evidence in patients with SCAD.
ICR is considered as an important cause of recurrent angina following PCI. Furthermore, it was reported that complete revascularization with PCI during index hospitalization was independently associated with improved early and long-term prognosis in comparison with ICR in patients with multivessel CAD and NSTE-ACS[23]. RSS was a strong independent predictor of one-year UR for ischemia in patients with moderate- and high-risk ACS who underwent PCI[24]. Our study group reported that despite an increase in revascularization, cases who received reasonable ICR had similar mortality and MI risk, compared with cases who received complete revascularization; RSS is a prognostic indicator after PCI in daily practice, and it may be used to determine a reasonable level of revascularization[13]. The results of this study showed independent association between ICR (RSS > 8) and medium-long-term UR, consistent with the results of previous studies. The 2017 European Society of Cardiology Guidelines for the management of AMI in patients presenting with ST-segment elevation mentioned that, 'Revascularization of non-infarct-related artery lesions should be considered in ST-segment elevated MI patients with multivessel disease before hospital discharge'[25]. Therefore, combining the results of this study in all-spectrum CAD, complete revascularization is considered as an optimum choice to prevent UR and other adverse cardiovascular events not only in patients with ACS but also those with SCAD whose ischemia cannot be controlled by optimal drugs. Patients with ICR or recurrent angina should be treated with strong medication, educated, and followed up with more attention[26].
BMI is considered as one of the several standards of weight and health. This variable cannot completely reflect obesity given that fat percentage is not included. Previous studies reported controversies on whether higher-BMI patients suffered lower in-hospital and long-term mortality than normal BMI patients[27-30]. Our study group also reported that overweightness, compared with normal weight, was an independent protective factor of the two-year all-cause mortality in patients undergoing PCI but was not independently associated with in-hospital or two-year target-vessel revascularization[31]. This study showed that BMI was independently associated with the 30-day UR risk, which increased by 10% as BMI increased by one unit. This result might be associated with the effect of adipocytokines secreted by adipocytes and requires further research[32-34].
The effect of time of procedure on UR risk was first analyzed in a large sample of Chinese population; the 30-day UR risk increased by 0.6%, whereas the one-year UR risk increased by 0.2% as the time of procedure increased by 1 min. Given that the time of procedure is decided based on various aspects, such as complexity of lesions, operators’ experience, patient compliance, teamwork proficiency, development of complications, and so on, whether this variable might be useful as an integrating indicator for prognostic assessment remains to be studied. For patients who underwent a relatively longer procedure, stronger medication, more education, and surveillance should be necessary to prevent recurrent ischemic symptoms and UR. Radial approach and radial experience affect the outcomes of PCI significantly[35, 36]. In this study, radial approach only showed a significant difference between the one-year UR group and the corresponding control group. The difference diminished after multivariate adjustment. Therefore, radial or femoral approach was not independently associated with either short-term or long-term UR risk.
Second-generation DP-DESs, represented by zotarolimus-eluting stents and cobalt-chromium everolimus-eluting stents, exhibit improved stability and lipotropism of eluting drugs compared with first-generation DESs[37-39]. Furthermore, improvements in the polymer biocompatibility coupled with a well-proportioned and slim frame reduce endothelial damage and proliferation[37-43]. This study showed that patients implanted with second-generation DP-DES had a decreased medium-long-term UR risk by 33%–39%, consistent with the results of previous studies[44].
The number of target lesions was negatively associated with 30-day UR, positively associated with one-year revascularization, and neutrally associated with two-year revascularization. The unstable attribute of this factor probably means that it is unsuitable for risk assessment of UR. History of hyperlipidemia and LAD involvement were also independently associated with low UR risk. Given that more lesions with LAD involvement were treated by second-generation DESs (58.1% vs. 41.9%, P < 0.001), stent type was an important confounder and had been adjusted in the model. However, searching for explanations for these independent associations was difficult. Possible explanations may be better education and compliance, including medication and reviewing in those patients who had LAD involvement or history of hyperlipidemia, which were not adjusted in the model, thus requiring further research to confirm.
This study achieved certain understanding on how to minimize UR. Alterable risk and feasible positive factors, including BMI, uric acid level, ICR, perioperative use of LMWH or fondaparinux, and second-generation DP-DES, can be used. Advisable measurements include BMI control, reduction of uric acid, complete revascularization, perioperative application of LMWH or fondaparinux, and second-generation DP-DES implantation. Given the reasonable inferences from our study, BMI control may reduce short-term UR. Patients may benefit from the perioperative application of LMWH or fondaparinux, second-generation DP-DES implantation, and uric acid control to reduce medium-long-term UR risk. Meanwhile, complete revascularization is positively associated with both short-term and medium-long-term UR risk. These unalterable risk or protective factors help in the identification of patients at high risk of UR, who may require intensified secondary prevention medication and closer post‐PCI follow‐up.
Admittedly, several limitations should be considered. First, we did not collect the data of other secondary prevention drugs besides DAPT during follow-up. Second, causes of UR were divided into AMI, angina, or asymptomatic ischemia, and more detailed classification data were not obtained during follow-up. Third, the study population was mainly composed of Han Chinese, who were enrolled from a single center in the Northern China, which influenced the extrapolation of the conclusions to a certain extent. Nevertheless, this study was the first to analyze the independent predictors of short-term and medium-long-term UR in a large sample of patients with all-spectrum CAD who underwent PCI in China. We believe that we have accounted for the most clinically relevant variables in our model. The collection of five-year follow-up data is ongoing for this cohort, and the analysis of long-term prognosis will provide further information on UR risk assessment.
-
Causes and forms of revascularization differ among groups of patients who underwent short-, medium-, and long-term UR. Specific factors are positively or negatively associated with short- and medium-long-term UR. These multivariable predictors may help PCI operators to modify treatment strategies and identify patients at high risk of UR, who may require intensified secondary prevention therapies or closer post‐PCI follow‐up.
-
There are no conflicts of interest to declare.
-
We are grateful to the staff in the Department of Cardiology and Catheterization Laboratory, Fu Wai Hospital for their research contributions.
The data used to support the findings of this study are available from the corresponding author upon request.
Funds:
National Natural Science Foundation of China [No. 81770365]; National Key Research and Development Program of China [No. 2016YFC1301301]; Beijing United Heart Foundation [No. BJUHFCSOARF201901-19]

 Quick Links
 DownLoad: