


-
Hepatitis A is a common acute infectious disease caused by the hepatitis A virus (HAV). The HAV is primarily transmitted by the fecal-oral route, usually through the ingestion of contaminated food or water or through contact with an infectious person[1]. Hepatitis A is usually self-limited and can cause patients to be asymptomatic to severe illness[2]. The infection of HAV usually causes more severe symptoms in older children and adults. HAV patients, particularly older than 40 years old, may experience several weeks of jaundice and may be at risk of acute liver failure and death[3, 4]. The epidemic of hepatitis A is primarily determined by sanitary and socioeconomic conditions, and the consequent burden of medical care can be substantial, especially in developing countries[5].
In recent decades, the epidemiology of hepatitis A has changed significantly. With the improvement of hygienic conditions in several resource-poor countries, the global incidence of hepatitis A continues to decrease and the average age at infection continues to increase[1,6]. Consequently, the incidence of severe illnesses related to hepatitis A—including fulminant hepatitis, hospitalizations, and deaths—is increasing, despite a reduction in the rate of HAV transmission[6].
Prevention of hepatitis A is preferable to symptomatic treatments, as no specific anti-HAV drug is currently available[7]. In the 1990s, several HAV vaccines became available and the protective efficacies of these vaccines have been demonstrated in different trials[8-10]. Among these studies, the cumulative rates of protective efficacy have been found to be 95%–100%. Long-term immunogenicity and immune persistence of inactivated hepatitis A vaccines have also been investigated in post-marketing studies[11-19]. Mosites et al.[15] performed a 22-year follow-up study and showed that more than 90% of subjects maintained protective levels of anti-HAV.
Although there is accumulated evidence of long-term immune persistence of hepatitis A vaccines, the precise duration of immune protection after vaccination remains unknown. This is because the estimate of duration requires decades of follow-ups to obtain individual immune-duration data. Alternatively, statistical-modeling approaches have been applied to provide a mathematical prediction of the duration of immune protection. Van Herck et al.[20] as well as Van Herck and Van Damme[21] used exponential models with fixed rates for serum-antibody kinetics to estimate the long-term persistence of inactivated HAV vaccines; these two studies yielded predictions of immune persistence of at least 10 years and 20–25 years, respectively. Another common framework for predictive modeling includes fractional-polynomial modeling and linear-mixed modeling with changepoints. In this framework, multiple phases with different antibody-decay rates are considered. A group of models are then fitted and selected based on fitting statistics. One or more models with the best fitting(s) would be used to perform the prediction. Using this framework, Hens et al.[22] predicted that at least 95% of subjects would remain anti-HAV seropositive for more than 25 years based on up to 17 years of follow-up data from two clinical trials. López et al.[23] reported a similar prediction that 88% of subjects would remain seroprotected for at least 30 years based on 15-year follow-up data. Models considering B-cell population kinetics have also been applied in predicting long-term antibody responses. Fraser et al.[24] proposed a power-law model that considering B-cells as two subpopulations, namely, active and memory B cells. Andraud et al.[25] applied the ‘plasma-cell imprinted lifespan’ model[26] on 10-year immune-persistence data and estimated that at least 95% of subjects would remain anti-HAV seropositive for more than 25 years.
China has been classified as a low-HAV endemic country[1], where resources have remained invested into the prevention of infectious disease, including hepatitis A. Healive (Sinovac Biotech, Beijing, China), a new inactivated, preservative-free hepatitis A vaccine, was licensed in China in 2001. The protective efficacy and safety of Healive have been demonstrated in adults and children[27,28]. A five-year follow-up study showed that the seroprotection of Healive was consistent with that of a control vaccine[29]. However, information on the long-term persistence of immune protection of Healive remains limited.
The aim of the present study was to fit statistical models to the predicted long-term persistence of antibodies induced by HAV vaccines (Healive or Havrix), based on five-year follow-up data from a randomized positive-controlled trial[28, 29], and to predict the duration of immune protection in Chinese children after a two-dose vaccination schedule.
-
The present analysis was based on a double-blind, randomized controlled trial (NCT00534885). The objective of the study was to evaluate the immunogenicity, safety, and lots-consistency of Healive. Details of the study design and outcomes of the trial have been described elsewhere[28, 29]. Briefly, a total of 400 healthy children (1–8 years old; 203 males and 197 females, respectively) were randomly assigned into the following four treatment groups: three consecutive lots of Healive, and Havrix as a control vaccine. Participants were scheduled for vaccination according to a 0, 6 months schedule, among which 392 participants received the second dose. A total of 94, 95, and 94 subjects received lot 1, lot 2, and lot 3 of Healive, respectively, and 92 subjects received Havrix. Blood samples were collected at 1, 6, and 7 months after the first dose. Among the participants who complete the second vaccination, 375 volunteers participated in the follow-up phase, in which immunogenicity was monitored annually over the following five years.
A microparticle enzyme immunoassay (MEIA; AxSYM HAVAB 2.0 quantification kit, Abbott, Wiesbaden, Germany) was used to measure the serum anti-HAV antibody titers. Results are expressed in mIU/mL. The minimum detectable titer of anti-HAV was 5 mIU/mL, and titers above 20,000 mIU/mL were recorded as 20,000 mIU/mL. Anti-HAV ≥ 20 mIU/mL was categorized as seroconversion.
The protocol was reviewed and approved by the ethics review committee of the Changzhou Center for Disease Control and Prevention. Written informed consent was obtained from parents or guardians of participants prior to their enrollment.
-
Anti-HAV titers at 1, 12, 24, 36, 48, and 60 months after the second HAV vaccination were used to model the long-term duration of antibody responses induced by hepatitis A vaccines. Considering the fact that low-level antibodies may persist up to a life-long period after vaccination, models that accounted for a turnover of memory B-cell pools or long-lived plasma cells would be preferable when predicting the long-term immune duration.
In the present study, we used two nonlinear mixed-effects models—namely, the power-law model and a modified power-law model proposed by Fraser et al.[24]—that took into account the rates of B-cell decay to describe antibody kinetics. For simplicity, we refer to these two models as model 1 (i.e., the power-law model) and model 2 (i.e., the modified power-law model). Assuming that the rate of B-cell decay follows a gamma distribution, model 1 is given by the following:
$$ f\left( t \right) = k - a\;{\text{log} _{10}}\left( {c + t} \right) $$ where f(t) is the log10 antibody titer at time t, k is the peak antibody titer (log10 mIU/mL), a is the decay rate, and c is an arbitrary small constant (often set to zero).
Fraser et al.[24] proposed a modified power-law model, in which B cells are considered to be comprised of two subpopulations, namely activated and memory B-cells. The model assumes that the amount of activated B cells decreases over time, while the amount of memory B cells is constant over time due to a rapid turnover of memory B cells[30]. By including the component that accounts for memory B cells, the model would allow for a long-term antibody plateau. Model 2 is given by the following:
$$ f\left( t \right) = k + {\text{log} _{10}}\left[ {\left( {1 - \pi } \right){t^{ - a}} + \pi } \right] $$ where π is the relative level of antibodies produced in the long-term plateau, ranging from 0 to 1. Parameter π is an indicator of long-term antibody persistence. Thus, a long-term seroprotective effect could be tested based on interval analysis of π.
In both models, k and a are assigned as random effects and follow a bivariate normal distribution. The parameter π in the modified power-law model is assigned as a fixed effect. In this way, the participant-specific time-antibody functions would be obtained to perform predictions of antibody dynamics for each participant. To analysis the influence of age at vaccination and gender, supportive analyses were conducted: in both models, age at vaccination and gender were included as covariates of the peak antibody titer (k) and the decay rate (a).
Models were fitted independently for each vaccine. Model parameters were estimated through dual Quasi-Newton algorithms using the SAS nlmixed procedure. Goodness of fit was evaluated by Akaike’s Information Criterion (AIC), Schwarz’s Bayesian Information Criterion (BIC), and the adjusted coefficient of determination (
$\text{R} ^2_{\text{adj} } $ ), which is given by the following:$$ \text{R}_{\text{adj}}^2 = 1 - \frac{{\mathop \sum \nolimits_{j = 1}^m \left[ {\mathop \sum \nolimits_{i = 1}^{{n_j}} {{\left( {{y_{ij}} - {{\hat y}_{ij}}} \right)}^2}/\left( {{n_j} - p - 1} \right)} \right]}}{{\mathop \sum \nolimits_{j = 1}^m \left[ {\mathop \sum \nolimits_{i = 1}^{{n_j}} {{\left( {{y_{ij}} - {{\bar y}_j}} \right)}^2}/\left( {{n_j} - 1} \right)} \right]}} $$ where yij and
$ {\hat y_{ij}}$ are the observed and predicted log10 antibody titer of ith participant at jth time point, respectively;$ {\bar y_j}$ and nj are the mean of observed antibody titer and corresponding number of participants at jth time point; m is the number of time points; and p is the number of parameters in the prediction model. The parameter$\text{R} ^2_{\text{adj} } $ ranges from 0 to 1, where a larger value of$\text{R} ^2_{\text{adj} } $ indicates a higher agreement of observed data and predicted values. Models with lower AIC and BIC, and larger$\text{R} ^2_{\text{adj} } $ , would be preferable.Geometric mean titers (GMTs) of predicted antibody titers and corresponding 95% confidence intervals, as well as the predicted proportion of participants maintaining antibody titers above seroconversion thresholds (Anti-HAV ≥ 20 mIU/mL) and corresponding 95% confidence intervals (95% CI), were calculated.
-
Among the 400 participants who were initially enrolled, 375 participants completed the two-dose vaccination and participated in the follow-up phase. The average age of the Healive and Havrix groups were 3.8 and 3.7 years old, respectively. The male/female ratio was 142/141 for the Healive group and 48/44 for the Havrix group. At each timepoint of the follow-up phase, the Healive group showed higher antibody titers and the differences between the two groups were statistically significant. Since the antibody titers of most subjects in both the Healive and Havrix groups are above 20 mIU/mL, the seroconversion rates of both groups were around 100%. The differences in seroconversion rate were not statistically significant[28,29].
-
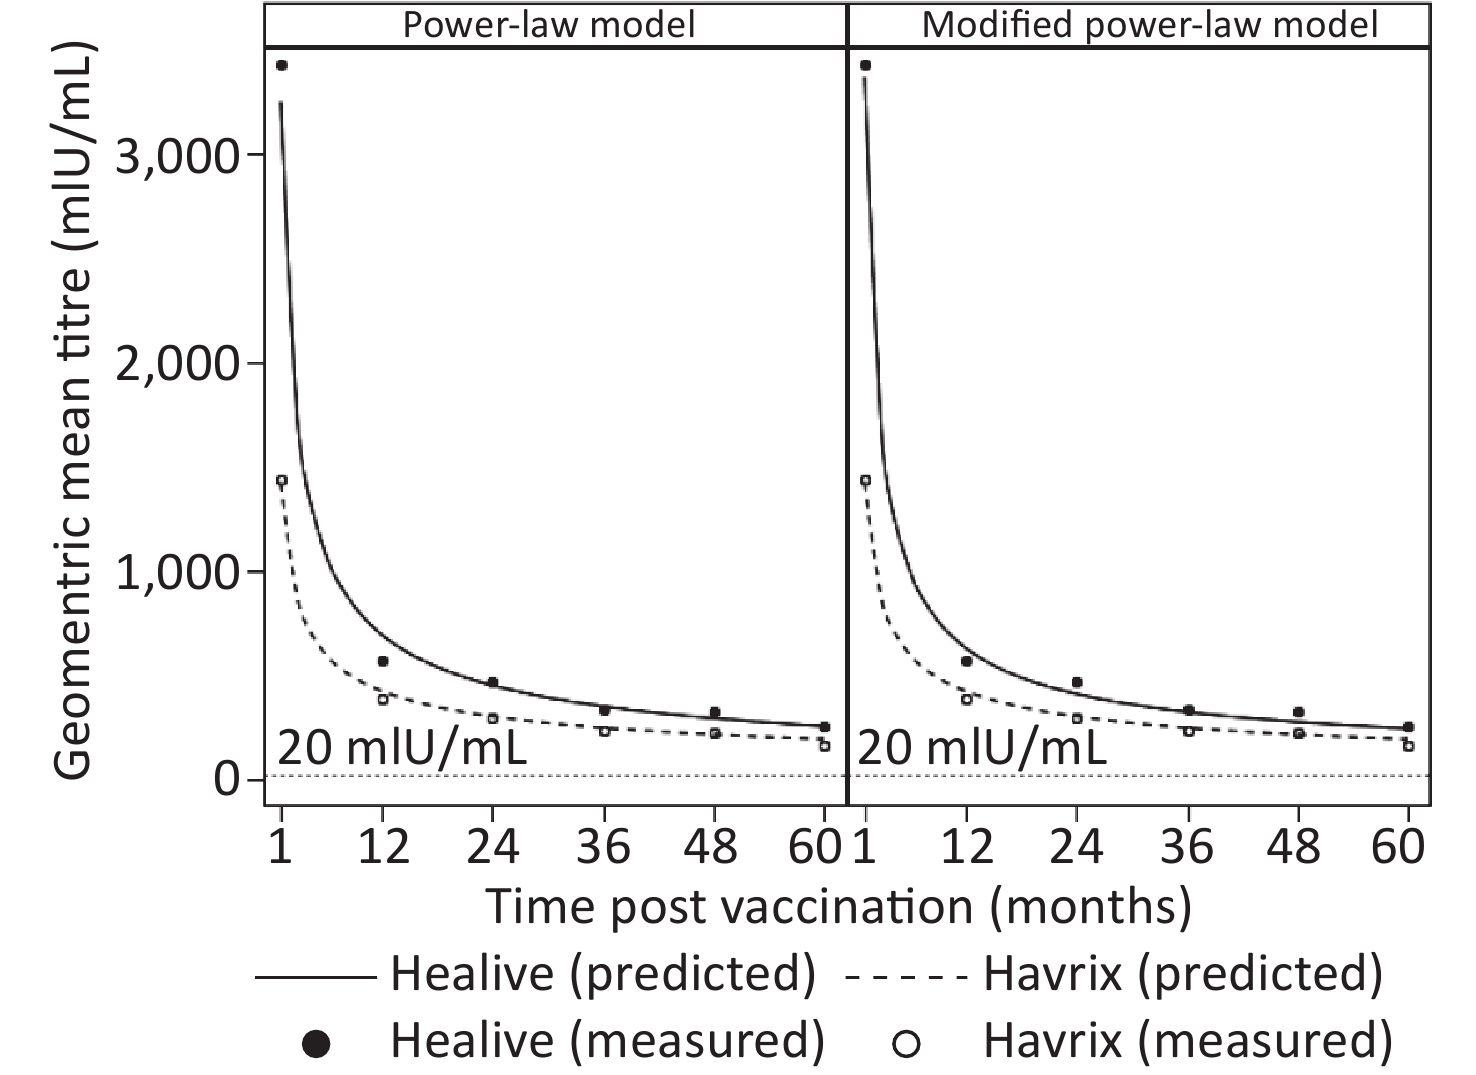
To estimate the duration of antibody protection, two models (model 1 and model 2) considering long-term antibody responses were fitted based upon five years of antibody titers. Model parameters and fitting statistics are presented in Table 1. AIC and BIC of model 2 were slightly lower than those of model 1. The adjusted coefficients of determination of both models were very close with one another. Figure 1 shows the observational plots and curves for each model. Model 2 showed better fitting, as the curve overlaid the observed data points more closely than that of model 1.
Group Model parameters Goodness of fit k a π R2 AIC BIC Power-law model Healive 3.5115 0.6211 − 0.8786 204.88 226.75 Havrix 3.1530 0.4879 − 0.9118 −66.59 −51.46 Modified power-law model Healive 3.5270 0.7097 0.0190 0.8851 156.82 182.33 Havrix 3.1532 0.4890 0.0005 0.9106 −64.60 −46.95 Table 1. Model parameters and fitting statistics

Figure 1. Observed and model-based prediction of geometric mean titers over time.
For each vaccine, the peak antibody titers (k), as well as decay rates (a), were close between the two models. In both models, the peak antibody titers of Healive were higher than those of Havrix, while the antibody-decay rates were higher for Healive, compared with those of Havrix. The half-lives and durations of immune protection were also derived from the models. Model 1 estimated half-lives of 91.58 d and 124.21 d for Healive and Havrix, respectively. Model 2 yielded similar outcomes, as presented in Table 2. Note that in both models, the 95% confidence intervals of Healive and Havrix did not overlap, which indicated that the decay rates of the two vaccines were significantly different from one another.
Group Half-life of antibody decay (d) Duration of immune protection (years) Estimate 95% CI Estimate 95% CI Power-law model Healive 91.58 87.06–96.11 301.92 208.66–395.18 Havrix 124.21 107.03–141.40 521.24 128.20–914.28 Modified power-law model Healive 81.89 76.82–86.96 − − Havrix 123.95 105.31–142.59 553.41 −471.41–1578.24 Table 2. Model-based estimation of half-lives of antibody decays and durations of immune protection
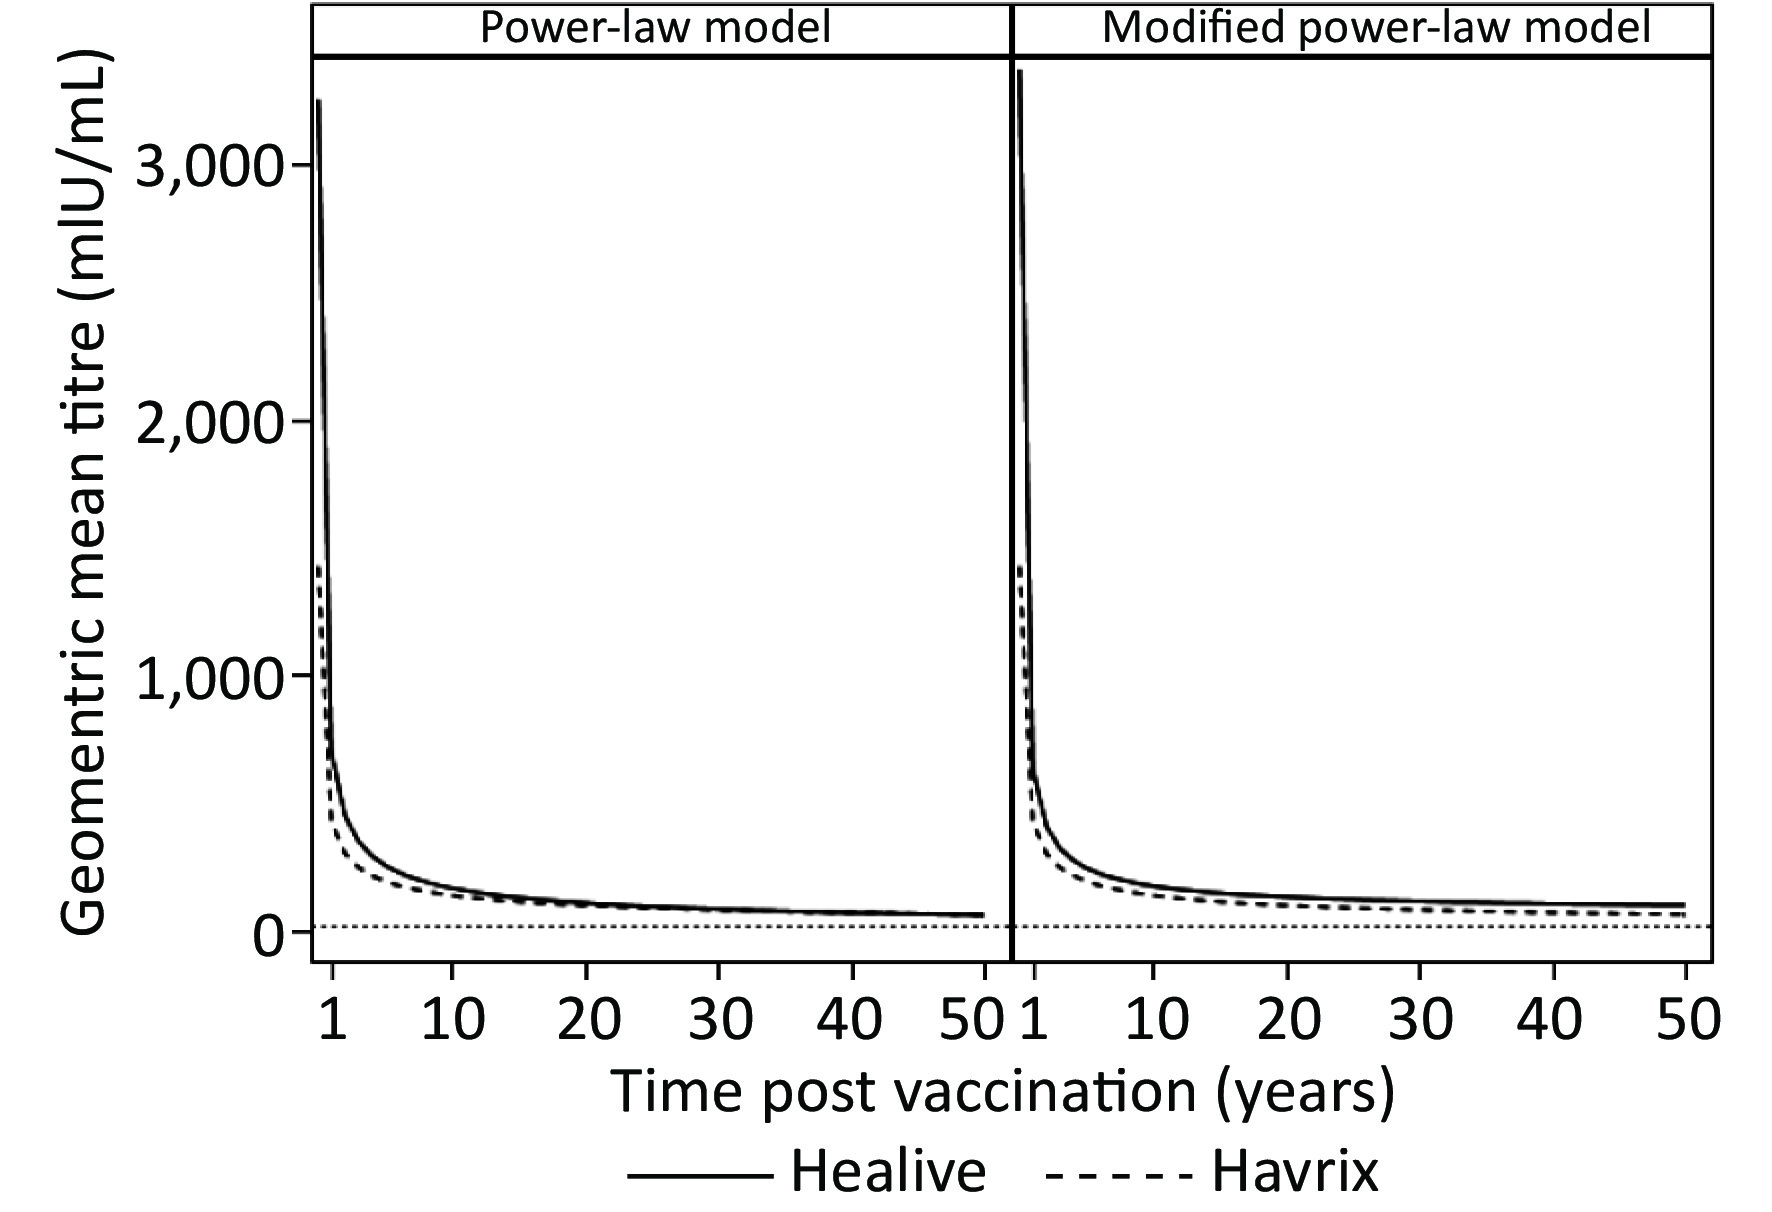
Figure 2 presents the predictions of long-term antibody responses. Both models predicted life-long durations of immune protection (Table 2 and Figure 2), as the predicted geometric means of both Healive and Havrix remained larger than 20 mIU/mL at 50 years. The curves of Healive were above those of Havrix (Figure 2). Model 1 predicted that the antibody titers of both Healive and Havrix would decline rapidly over the first 10 years after two-dose vaccinations, and would then decline slowly in the following decades. Model 2 predicted similar antibody-decline curves but predicted that the antibody titers would reach a plateau level at nearly 15 years after the two-dose vaccination. The estimated long-term antibody plateaus were 63.866 mIU/mL (95% CI: 43.4359–84.2961 mIU/mL) for Healive and 0.7681 mIU/mL (95% CI: 20.3874–21.9237 mIU/mL) for Havrix.
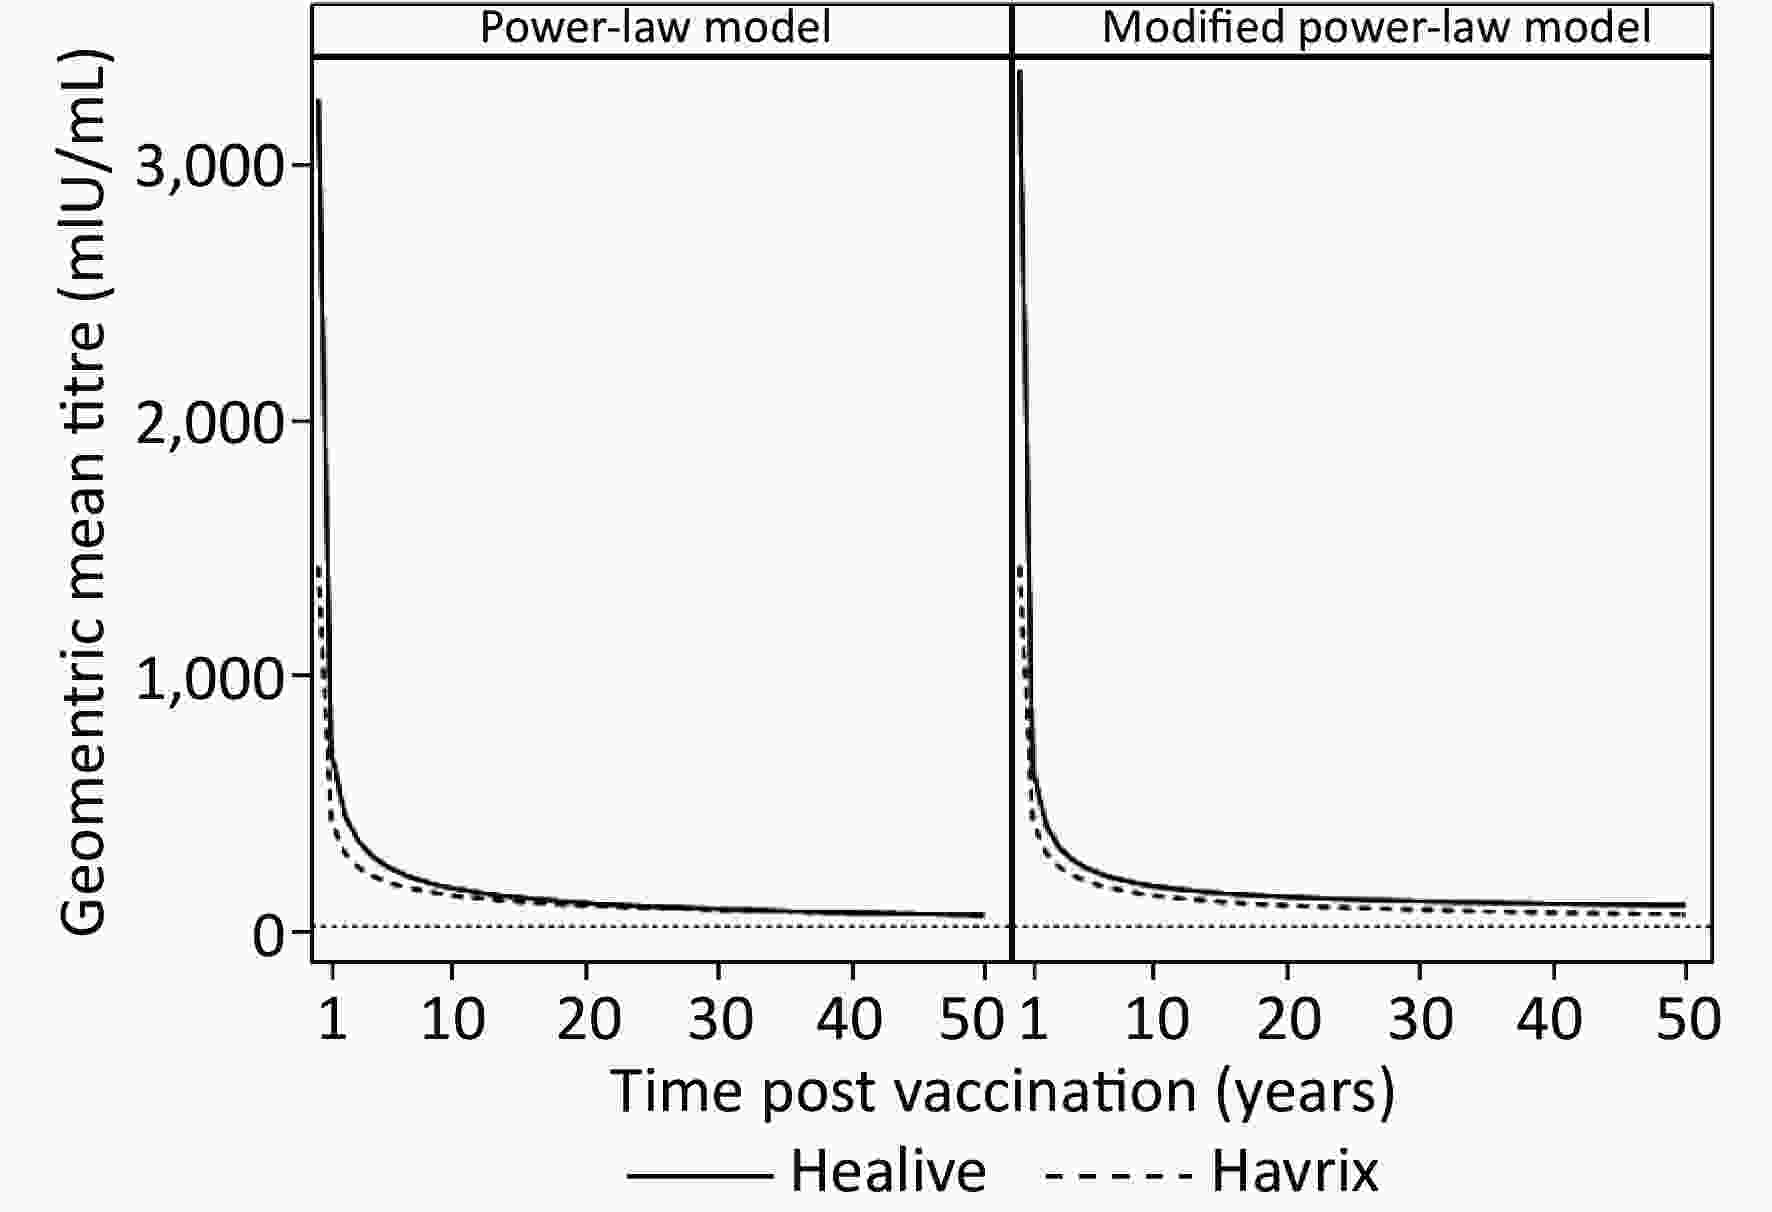
Figure 2. Model-based prediction of geometric mean titers for up to 50 years.
In both models, age at vaccination and gender were not statistically significant for the peak antibody titers, as well as decay rates, for both Healive and Havrix, as presented in Supplementary Table S1 available in www.besjournal.com.
Parameter Power-law model Modified power-law model Healive Havrix Healive Havrix k 3.4625 (3.2697, 3.2697) 3.2136 (2.9105, 2.9105) 3.4614 (3.2612, 3.2612) 3.2138 (2.9105, 2.9105) Gender 0.0227 (−0.0751, −0.0751) 0.0010 (−0.1591, −0.1591) 0.0234 (−0.0784, −0.0784) 0.0010 (−0.1592, −0.1592) Age 0.0040 (−0.0265, −0.0265) −0.0168 (−0.0654, −0.0654) 0.0081 (−0.0237, −0.0237) −0.0168 (−0.0654, −0.0654) a 0.6112 (0.5031, 0.5031) 0.6500 (0.4739, 0.4739) 0.6783 (0.5294, 0.5294) 0.6524 (0.4680, 0.4680) Gender −0.0006 (−0.0556, −0.0556) −0.0543 (−0.1475, −0.1475) 0.0026 (−0.0726, −0.0726) −0.0546 (−0.1487, −0.1487) Age 0.0029 (−0.0144, −0.0144) −0.0222 (−0.0506, −0.0506) 0.0075 (−0.0162, −0.0162) −0.0224 (−0.0510, −0.0510) Table S1. Model parameters of age at vaccination and gender
-
Predictions of antibody titers of each individual participant were also estimated, as well as proportions of seroconversion. As shown in Table 3, the geometric means of predicted antibody titers by both models were close to the observed data over five years in both Healive and Havrix groups. Up to five years after the two-dose vaccination, the seroconversion rate of Healive and Havrix were 99.13% and 97.47%, respectively. Both models yielded similar predictions to the observed seroconversion rates (Table 3).
Models GMT, mIU/mL (95% CI) SR, % (95% CI) Healive Havrix Healive Havrix 1 month Observed 3427.18 (3036.53–3868.10) 1441.88 (1191.08–1745.49) 100.00 (98.69–100.00) 100.00 (96.07–100.00) Power-law model 3247.03 (2949.59–3574.46) 1422.40 (1206.28–1677.24) 100.00 (98.70–100.00) 100.00 (96.07–100.00) Modified power-law model 3300.66 (2984.44–3650.39) 1422.53 (1206.36–1677.44) 100.00 (98.70–100.00) 100.00 (96.07–100.00) 1 year Observed 571.95 (519.59–629.59) 385.98 (323.68–460.28) 100.00 (98.57–100.00) 100.00 (95.85–100.00) Power-law model 693.80 (633.04–760.38) 423.20 (359.94–497.58) 100.00 (98.70–100.00) 100.00 (96.07–100.00) Modified power-law model 650.78 (592.92–714.29) 422.87 (359.64–497.21) 100.00 (98.70–100.00) 100.00 (96.07–100.00) 2 years Observed 468.66 (423.21–518.99) 300.12 (250.21–360.00) 100.00 (98.51–100.00) 100.00 (95.55–100.00) Power-law model 451.10 (410.20–496.07) 301.78 (254.31–358.09) 100.00 (98.70–100.00) 100.00 (96.07–100.00) Modified power-law model 435.10 (395.28–478.95) 301.64 (254.19–357.95) 100.00 (98.70–100.00) 100.00 (96.07–100.00) 3 years Observed 341.16 (298.91–389.38) 234.28 (187.20–293.21) 99.59 (97.73–99.99) 100.00 (95.65–100.00) Power-law model 350.67 (317.98–386.73) 247.61 (207.20–295.91) 100.00 (98.70–100.00) 100.00 (96.07–100.00) Modified power-law model 350.32 (317.70–386.28) 247.61 (207.20–295.91) 100.00 (98.70–100.00) 100.00 (96.07–100.00) 4 years Observed 322.26 (284.35–365.23) 222.26 (179.06–275.90) 100.00 (98.40–100.00) 100.00 (95.32–100.00) Power-law model 293.30 (265.33–324.21) 215.19 (179.05–258.62) 100.00 (98.70–100.00) 98.91 (94.09–99.97) Modified power-law model 303.34 (274.80–334.84) 215.29 (179.14–258.73) 100.00 (98.70–100.00) 98.91 (94.09–99.97) 5 years Observed 257.14 (226.89–291.42) 168.12 (135.64–208.38) 99.13 (96.89–99.89) 97.47 (91.15–99.69) Power-law model 255.34 (230.53–282.82) 193.00 (159.83–233.05) 99.65 (98.05–99.99) 98.91 (94.09–99.97) Modified power-law model 272.91 (247.06–301.48) 193.17 (159.99–233.24) 100.00 (98.70–100.00) 98.91 (94.09–99.97) Note. Predictions are based on the estimated participant-specific functions. GMT: geometric mean titer; SR: seroconversion rate. Table 3. Observed and predicted geometric mean titers and seroconversion rates for up to five-years post vaccination
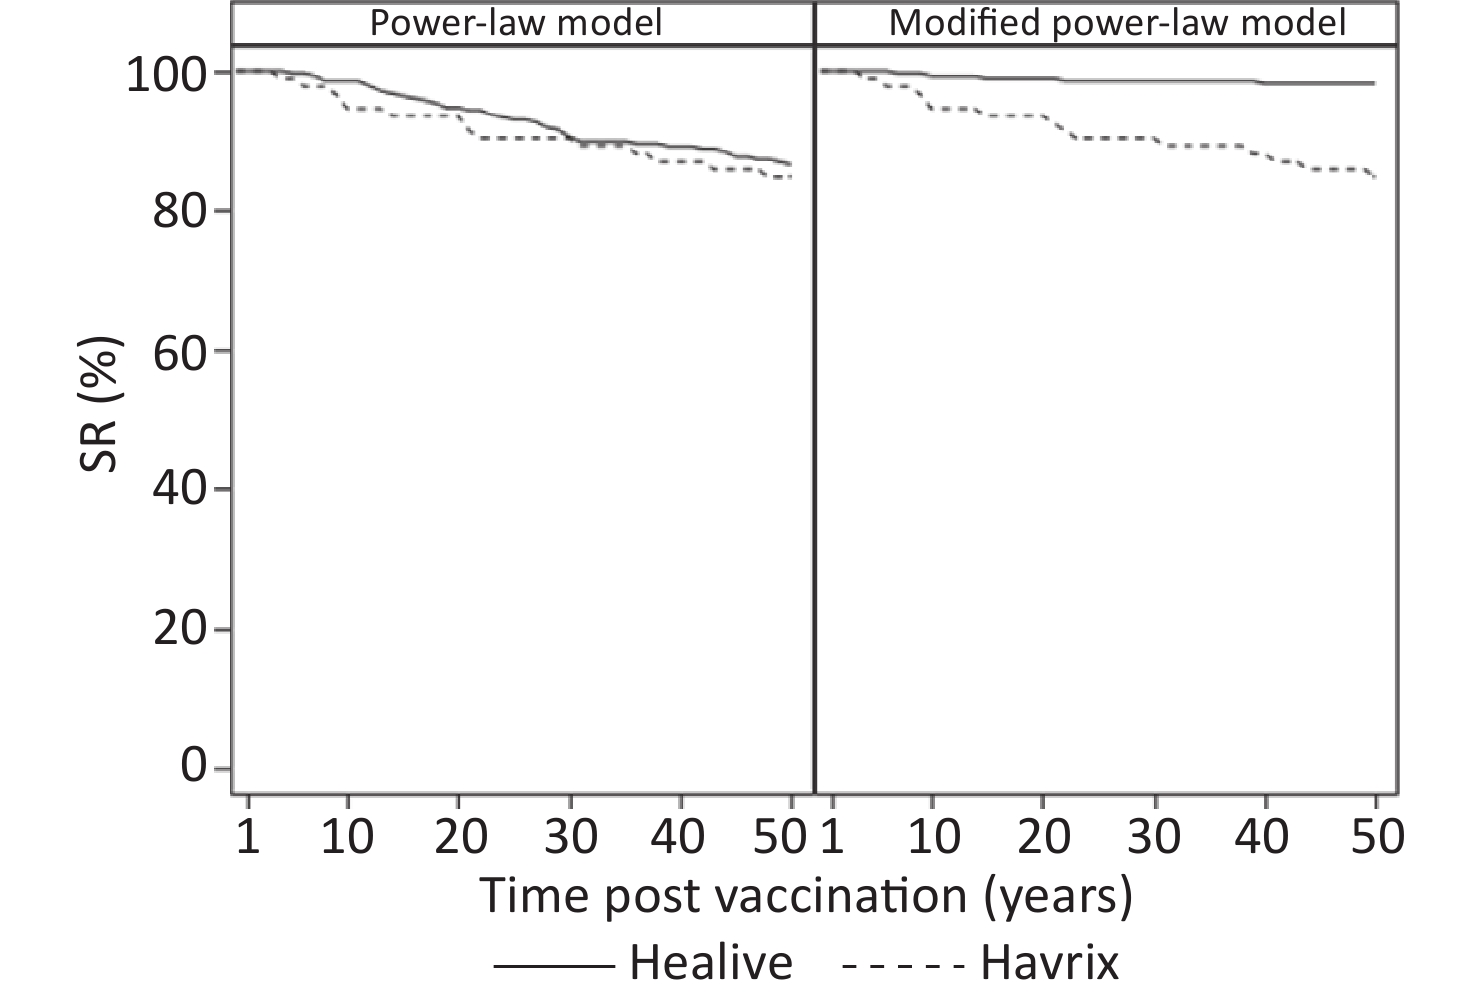
Table 4 presents the long-term prediction of the geometric mean of antibody titers and the proportion of seroconversion based on the estimated participant-specific functions. Model 1 predicted that at 30 years, more than 90% of participants would have seroconversion (anti-HAV ≥ 20 mIU/mL). In model 2, which showed better fitting, the predicted seroconversion rate of Healive remained above 95% for at least up to 35 years (Table 4 and Figure 3).

Figure 3. Predicted seroconversion rate based on the estimated participant-specific functions.
Years GMT, mIU/mL (95% CI) SR, % (95% CI) Healive Havrix Healive Havrix Power-law model 10 166.02 (148.82–185.20) 137.62 (112.12–168.92) 98.59 (96.42–99.61) 94.57 (87.77–98.21) 15 129.06 (115.14–144.66) 112.92 (91.03–140.08) 96.47 (93.60–98.29) 93.48 (86.34–97.57) 20 107.94 (95.96–121.42) 98.14 (78.49–122.70) 94.70 (91.41–97.00) 93.48 (86.34–97.57) 25 93.97 (83.30–106.01) 88.01 (69.96–110.74) 92.93 (89.30–95.63) 90.22 (82.24–95.43) 30 83.91 (74.20–94.89) 80.52 (63.67–101.84) 90.46 (86.42–93.62) 90.22 (82.24–95.43) 35 76.25 (67.29–86.41) 74.69 (58.79–94.89) 89.75 (85.62–93.03) 89.13 (80.92–94.66) Modified power-law model 10 203.48 (183.91–225.14) 138.04 (112.51–169.37) 99.29 (97.47–99.91) 94.57 (87.77–98.21) 15 175.60 (158.62–194.40) 113.49 (91.55–140.68) 98.94 (96.93–99.78) 93.48 (86.34–97.57) 20 159.84 (144.35–176.99) 98.81 (79.11–123.41) 98.94 (96.93–99.78) 93.48 (86.34–97.57) 25 149.45 (134.94–165.51) 88.77 (70.65–111.54) 98.59 (96.42–99.61) 90.22 (82.24–95.43) 30 141.96 (128.17–157.23) 81.35 (64.42–102.72) 98.59 (96.42–99.61) 90.22 (82.24–95.43) 35 136.25 (123.01–150.92) 75.57 (59.59–95.83) 98.59 (96.42–99.61) 89.13 (80.92–94.66) Note. GMT: geometric mean titer; SR: seroconversion rate. Table 4. Predicted geometric mean titers and seroconversion rates based on the estimated participant-specific functions
-
Clinical evidence on the duration of HAV vaccine protection has been rare due to difficulties in obtaining decade-long follow-ups after patients have received vaccines. Therefore, modeling methods have been the primary approach for investigating long-term immune persistence[20-24,31]. In the present study, we used the power-law model and a modified power-law model to investigate the long-term antibody responses to Healive, an inactivated preservative-free HAV vaccine, among Chinese children. Both models were well-fitted with five-year follow-up data, as indicated by fitting statistics (AIC, BIC, and
$\text{R} ^2_{\text{adj} } $ ).Based on statistical modeling on the five-year follow-up data after the original trial, we projected a duration of antibody protection of at least 30 years for more than 90% of vaccinated individuals. Moreover, both models predicted that Healive would induce stronger immunogenicity compared with that of Havrix, as the peak of antibody response induced by Healive was larger than that of Havrix. The antibody-decay rate of Healive was also larger than that of Havrix. Over a life-long period, participants vaccinated with Healive were predicted to have close but slightly higher antibody titers than those of individuals vaccine with Havrix. The modified power-law model indicated that both Healive and Havrix may induce memory B-cells and would lead to a plateau of antibody titers, which may maintain a life-long period of immune protection. The predicted plateau-antibody titer of Healive was 63.866 mIU/mL (P < 0.001), which was larger than the threshold of seroconversion (20 mIU/mL) and indicated that Healive may trigger a protective anamnestic response.
Long-term follow-up studies of immune persistence have revealed that most vaccines remain seropositive for nearly 20 years. The predictions in the present work are in line with the outcomes of these previous studies. Van Herck et al.[20] evaluated antibody persistence using data from two of the longest documented follow-up studies and showed that 100% of vaccinated individuals remained seropositive for up to 17 years following a 0, 6 months vaccination schedule. A 22-year follow-up study carried out by Mosites et al.[15] found that 15 out of 16 vaccinated individuals maintained protective levels of anti-HAV following a 0, 6 months vaccination schedule. López et al.[23,32] investigated long-term persistence of anti-HAV in children less than 15 years old and showed that 100% of vaccinated individuals maintained seroconversion for at 15 years after vaccination.
The advantage of the power-law model is that the kinetics of B-cell turnover is accounted for and may lead to a reasonable interpretation for the long-term duration of antibody persistence[33,34]. The modified power-law model further considers a memory-B-cell subpopulation and an antibody plateau[24], which are important in modeling the long-term antibody memory. The suitability of the modified power-law model is supported by the long-term persistence of HAV-specific memory B cells, which has been verified in a cohort study[11]. Additionally, inter-subject variabilities are accounted for in both models.
In this study, antibody titers above 20 mIU/mL were considered as seroconversion for conservative concern, although the detection limit was 5 mIU/mL. The cut-off value of 20 mIU/mL was referred from the minimal detectable concentrations in previous studies[19,35]. The minimal detectable concentrations were generally derived from animal studies. Lower cut-off value for seroconversion, such as 10 mIU/mL and 15 mIU/mL, are used in some studies in which more sensitive assays were applied[18,36,37].
The primary limitation of the present study is in its absence of longer follow-up data. A longer follow-up period would increase the precision of prediction for long-term immune persistence. Additionally, models considering immunosenescence[25] could be applied if long-term data are available.
In conclusion, our modeling study suggests that Healive may adequately induce long-term immune responses following a 0, 6 months vaccination schedule in children. Additionally, our model suggests that memory B cells may be induced to provide stable and durable immune protection. Finally, based on statistical modeling on the five-year follow-up data, we could predict that more than 90% of participants would maintain seroconversion for at least 30 years.
-
We thank LetPub (www.letpub.com) for its linguistic assistance during the preparation of this manuscript.
-
YPY performed the data analysis and drafted the manuscript. JTC conceived of research questions and revised the manuscript. ZWJ, LW, and CKY involved in data analysis and commented the manuscript. XYY and CY critically commented and revised the manuscript. JLX revised the manuscript. All authors read and approved the final version of the manuscript.
-
JTC is an employee of Sinovac Biotech. The other authors declare no conflicts of interest.


Funds:
This work was supported by sub-project of National Major Scientific and Technological Special Project of China for ‘Significant New Drugs Development’ [2015ZX09501008-004]
&These authors contributed equally to this work
 Quick Links
 DownLoad: