


-
Kashin-Beck Disease (KBD) is an endemic, chronic and deformative osteoarthropathy[1] that mainly occurs in children aged 5–15 years, and whose primary pathological changes are chondrocyte degeneration, necrosis and absence in the deep zone of articular cartilage and growing plate cartilage[2]. It is clinically characterized by joint pain, enlargement, and deformation; muscle atrophy; shortened fingers, toes, and limbs; and most seriously, pygmyism and malformation[3]. Areas with a high prevalence of KBD in China are mainly distributed in a long, narrow zone from Tibet to Heilongjiang province. At present, new cases are predominantly discovered in western regions [4].
Despite more than 160 years of research, the etiology and pathogenesis of KBD are unclear[4]. An important class of tools for in-depth understanding of an unknown disease is biomarkers. Previous studies have demonstrated a significant difference in various metabolic indicators in patients with KBD compared with healthy controls, but no single index specific to the diagnosis of the disease has yet been found [5]. Therefore, a more feasible strategy may involve identifying species of metabolites whose levels are altered and select related biomarker groups or clusters for further identification of disease cases.
Biological fluids such as urine and blood contain large quantities of metabolites[6], which can provide a large amount of biological information about bodily metabolism. Specifically, the occurrence of diseases in the body leads to metabolic responses in cells, tissues, and organismal level, leading to changes in the type, proportion, and concentration of endogenous metabolites, which in turn are ultimately reflected in changes in the composition of biological fluids.
Metabonomics describes the collection of small molecules produced by cells and/or organisms and is therefore a form of analysis that provides a unique opportunity to identify corresponding biological and/or pathological changes associated with diseases[7]. As a consequence, metabolites could potentially serve as biomarkers in many diseases, since they represent the biochemical end products of the genetic pathways, providing an accurate representation of the physiological state of an individual[8].
Accordingly, this study aims to determine the potential metabolic biomarkers or biomarker clusters in serum of pediatric KBD using metabolomic methods that exploit metabolic spectrum differences. The study conformed to a two-stage design consisting of discovery (non-targeted study) and validation (targeted study) stages. In the discovery study, the distinct serum metabolites or metabolite clusters were selected and preliminarily confirmed. In the validation study, candidate metabolites identified in the discovery stage were verified by another independent study.
-
In recent years the incidence of KBD has been markedly reduced, but new pediatric KBD patients are still being identified in some regions of Qinghai Province[9-10]. With reference to Chinese KBD monitoring data from 2010, we selected relatively active endemic and non-endemic KBD areas including Shang, Zhong and Xia villages in Xinghai county, Xiemalang and Xinjianping villages in Guide County and Xin and Zhide villages in Tongde county as the discovery study site; and using data from 2014 we selected Tangnaihai and Qushian villages of Xinghai county and Gandu Village of Hualong county as the verification study site. In the two-stage study, the economic level and living habits of each research site were approximately matched.
Regular health examinations, including radiological examinations and dietary surveys were performed for all children aged 7–15 years who were living and studying in boarding schools in the locations listed above. The diagnosis of KBD was performed according to the Chinese radiological and clinical diagnostic criteria for KBD[11]. Following examinations, eligible individuals were selected. Children with other joint diseases (such as joint inflammation, metabolic bone diseases, neoplasia, osteoporosis, or osteomalacia); with joint damage and injury; subject to progressive joint surgery within the past year; that had taken arthritis drugs within the past month; suffering from chronic systemic diseases and acute inflammation; and those who declined to participate in this survey were excluded. Ultimately, a total of 157 children entered the first-stage study cohort: 56 KBD children were in the case group, 51 healthy children from KBD endemic areas were in the internal control group and 50 healthy children from non-KBD endemic areas comprised the external control group. In the second-stage study cohort, 122 children were selected, 31 KBD children in the case group, 41 healthy children from KBD endemic areas in the internal control group, and 50 healthy children from non-KBD endemic areas in the external control group.
All subjects were boarding school students, and their diet was standardized and uniquely supplied by the Chinese government.
-
Fasting morning blood samples (not less than 2 mL/person) from children were collected in 5 mL sterile tubes. The blood samples were left at room temperature for 1 h and centrifuged at 3,000 rpm/min for 10 min to separate the serum. The serum was centrifuged at 8,000 rpm/min for 5 min and the supernatant was dispensed in 50 μL volumes into microcentrifuge tubes and stored at −80 °C until ready for assay.
Discovery Study Pretreatment of serum, cryopreserved serum was thawed at room temperature before detection, and then serum (40 μL) and methanol (160 μL) were sequentially added into centrifugal tubes. The mixture was eddied for 1 min before being centrifuged at 10,000 rpm/min for 5 min at 4 °C, then the supernatant was transferred to an autosampler for UPLC-MS analysis. For serum sample detection, ultra-high performance liquid chromatography (HPLC, Agilent Technologies Inc., USA) and quadrupole time of flight (Q-TOF) mass spectrometry (MS, Bruker Corporation, Germany) were used for the detection. Chromatographic separation was carried out on an Agilent ZORBAX SB-C18 (2.1 ×150 mm, 5 μm). Analytes were eluted from the column using a gradient of deionized water (A) and methyl alcohol (B), as the mobile phase. Gradient elution conditions were as follows: 0.0 min, 50% A and 50% B; 5.0 min, 50% A and 50% B; 5.1 min, 95% A and 5% B; 40.0 min, 95% A and 5% B. The column temperature was controlled at 25 °C, and the injection volume was 20 µL with a flow rate of 0.25 mL/min. The detection wavelength was 420 nm. Tandem mass-spectrometric conditions were as follows: mass-spectrometric full-scan data were acquired in positive ESI modes from 50 to 1,000 Da. The main detection parameters were as follows: −500 V end plate offset, 3,500 V capillary voltage, 6.0 l/min dry gas, 180 °C dry temperature, 200 Vpp funnel RF, 5 eV ion energy, 7 eV collision energy, 150 Vpp collision RF, 100 μs transfer time and sodium formate calibration.
Validation Study Seven candidate metabolites, including kynurenic acid, N-alpha-acetylarginine, 6-hydroxymelatonin, sphinganine, glycine, sphingosine-1-phosphate (sphingosine-1P) and spermidine were quantitative detected and identified by analyzing the corresponding veridical chemical standard substances using ultra-HPLC (Dionex, USA)- quadrupole ion trap (Q-TRAP)-MS (AB SCIEX, USA) under positive ESI. Glycine was separated using the chromatographic column MSLab-AA-C18 (150 × 4.6 mm, 5 μm, Beijing mass spectrometry medical research co. LTD, China), while other substances were separated using the chromatographic column GP-C18 (150 × 4.6 mm, 5 μm, 120 A, Suzhou Sepax Technologies co. LTD, China). The column temperature was controlled at 50 °C and the injection volume was 5 µL with a flow rate of 1 mL/min. The scanning mode of MS is multiple-reaction monitoring.
The standard substances (kynurenic acid, N-alpha-acetylarginine, 6-hydroxymelatonin, sphinga-nine, sphingosine-1P and spermidine) were purchased from Aladdin Industrial Corporation (Shanghai, China). The glycine standard substance was purchased from Beijing mass spectrometry medical research co. LTD., China.
Serum pretreatment of glycine detection was carried out as follows: serum (50 μL) and protein precipitators (50 μL) were mixed and eddied, centrifuged at 13,200 rpm/min for 4 min at 4 °C, collected supernatant. Volumes of 10 μL of supernatant and 50 μL of marker buffer were briefly centrifuged before adding 20 μL derivative solution which was mixed, briefly centrifuged, and subjected to derivatization at a constant temperature of 55 °C for 15 min. Derived samples were cooled at 4 °C, mixed, before being briefly centrifuged, at which point they were ready for detection.
Serum pretreatment of sphinganine and sphingosine-1P detection was performed as follows: serum (100 μL) and CHCL3-CH3OH (2:1, 500 μL) were mixed and eddied then deionized water (200 μL) was added. The mixture was eddied for 1 min before being centrifuged at 3,000 rpm/min for 5 min at 4 °C to separate the organic solvent layer. After vacuum drying, acetonitrile (200 μL) was added to aid redissolution, at which point the mixture was ready for detection.
Serum pretreatment of kynurenic acid, N-α-acetylarginine, spermidine and 6-hydroxymelatomin detection was carried out as follows: serum (50 μL) and acetonitrile (150 μL) were mixed and eddied, then centrifuged at 3,000 rpm/min for 5 min at 4 °C to separate the supernatant, at which point the mixture was ready for detection.
-
Discovery Study 1) The preprocessing and transformation of original MS data was carried out as follows: raw data were processed using Analyst 1.5 software, including baseline correction, denoising, deconvolution, alignment, and normalization. Next, the data were converted to EXCEL spreadsheet format, which included the ID of the sample, mass-to-charge ratio (m/z), retention time (RT) and integral area. 2) Principal component analysis (PCA) and partial least-squares discriminant analysis (PLS-DA) was performed as follows: SIMCA-P 13.0 software was used for PCA and PLS-DA. Metabolites whose variable importance in the projection (VIP) was greater than 1 were regarded as potential principal components and screened out. 3) Statistical analysis was performed as follows: data were analyzed using SPSS 20.0 software. Testing for normality was done using a Kolmogorov-Smirnov test. Normally distributed data were described with mean and standard deviation, and the homogeneity test of variance and significant differences were performed using an ANOVA or chi-square test. Data that were not normally distributed were described with median and interquartile range. Normally distributed data with unequal variances non-normally distributed data were analyzed using a Kruskal-Wallis test. The LDS (parametric test) and Nemenyi (non-parametric test) tests were used for the comparison of any two given groups. All the tests were two-tailed, and P < 0.05 was considered statistically significant. 4) Candidate metabolite identification was performed as follows: metabolites were searched based on their m/z and RT in Metlin (http://metlin.scripps.edu/) and HMDB (http://www.hmdb.ca/) databases. The candidate metabolites were required to be endogenous and have at least 2-3 peaks in their secondary mass spectrogram matching the databases. Taking into account its biological significance, candidate metabolite was preliminarily chosen.
Validation Study 1) Data processing was performed as follows: the HPLC-MS data of standard substances and samples was processed using Analyst 1.62 software. The content of metabolites in samples was quantified by drawing a standard curve. The resulting data included name of sample, peak area, internal standard area, and quantitative result. 2) Statistical analysis was performed as follows: most statistical methods in this part were the same as the methods in the non-targeted test. The only unique method in this stage is the receiver operating characteristic curve (ROC) analysis, in which the area under the curve (AUC) indicates the metabolite’s disease recognition ability. 3) Metabolic pathway attribution and network construction of candidate metabolites was performed as follows: MetaboAnalyst 3.0 software was used, using the hypergeometric test and relative betweenness centrality, to analyze the metabolic pathways of candidate metabolites. Results included a metabolic pathway map and impact value of metabolic pathway based on the KEGG database (http://www.kegg.com/) most relevant to the selected candidate metabolites. Raw P < 0.01 and impact > 0.01 meant the metabolic pathway was of statistical significance. The research flow chart is shown in Figure 1.
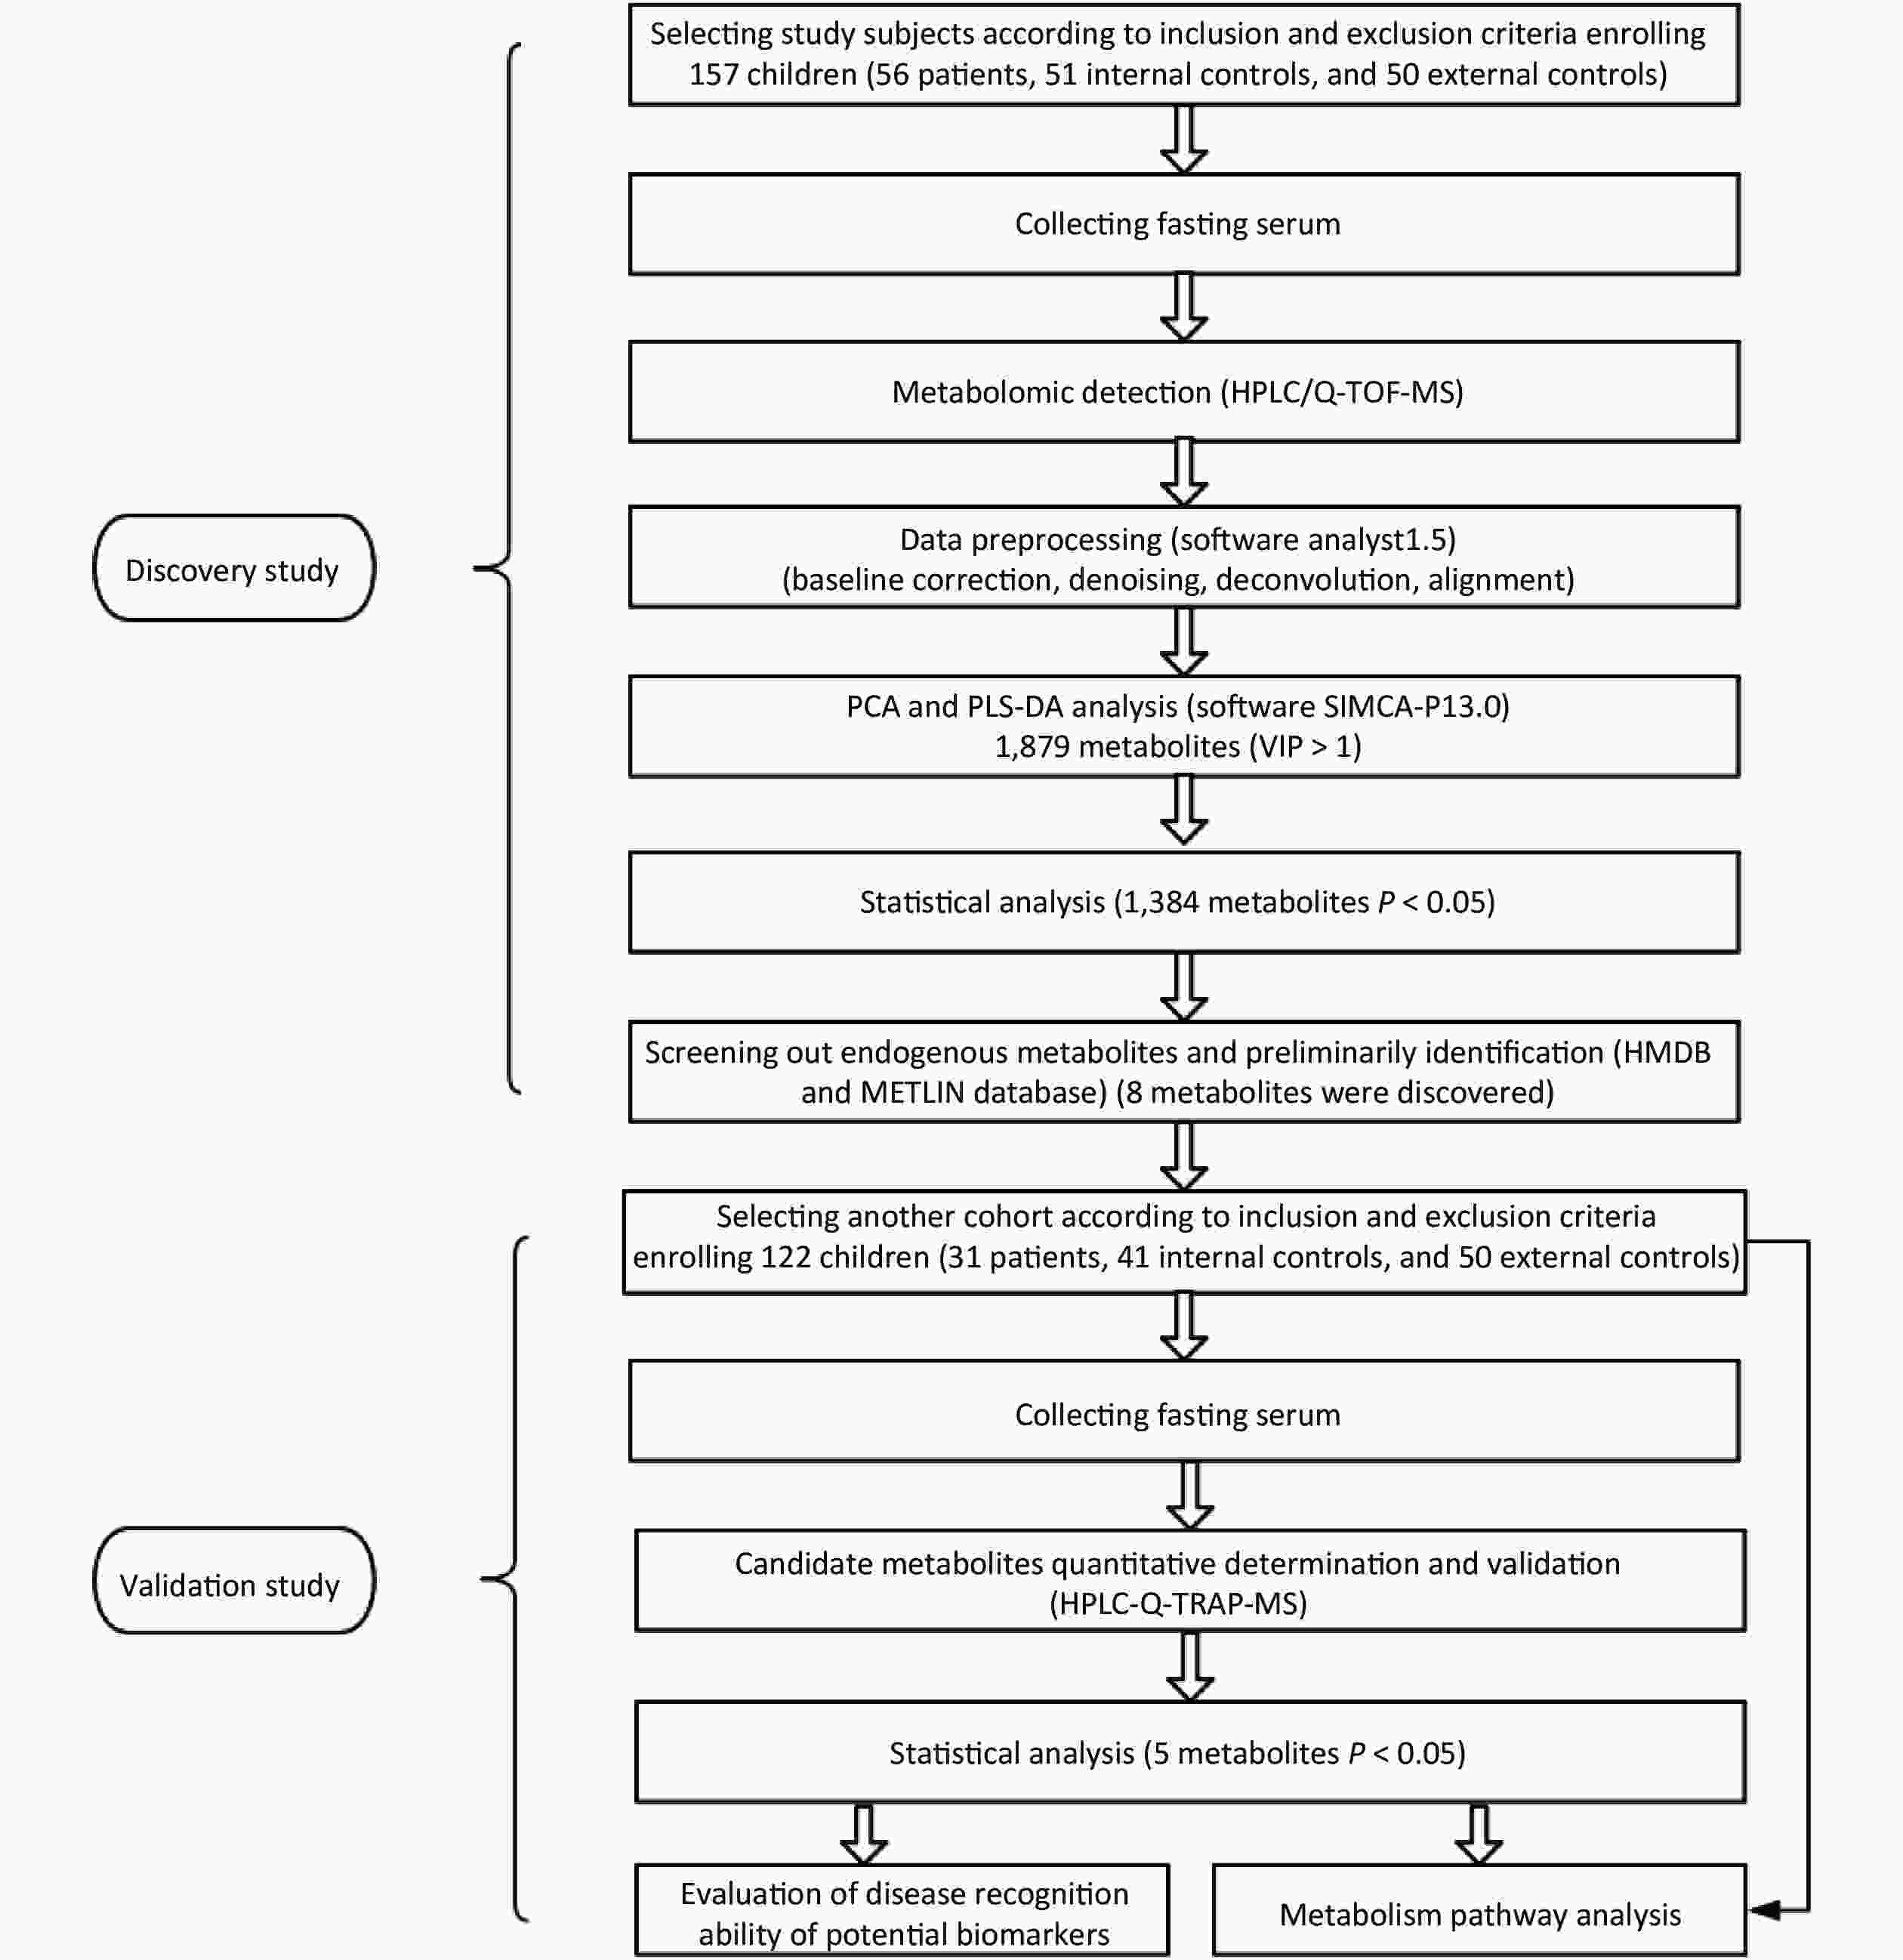
Figure 1. Research flow chart.
-
The basic demographic characteristics of subjects included age, sex, height, and weight. In the discovery study, all of the data in three groups conformed to a normal distribution, and no statistical differences existed among groups. In the validation study,
the basic characteristics in three groups were not normally distributed (P < 0.05) because there were fewer subjects in the internal control and case groups. The basic characteristics of children were shown in Table 1. Cohort Indexes External control group Internal control group Case group Discovery cohort* Total number 50 51 56 Sex (male/female) 28/22 30/21 25/31 Age (years) 12.5 ± 1.09 12.09 ± 1.21 12.24 ± 1.55 Height (cm) 142.68 ± 6.84 141.63 ± 6.19 142.89 ± 6.26 Weight (kg) 34.36 ± 5.22 33.84 ± 4.83 34.50 ± 4.96 Validation cohort# Total number 50 41 31 Sex (male/female) 25/25 24/17 14/17 Age (years) 10.0 (8.0, 10.0) 11.0 (10.0, 12.0) 12.0 (10.0, 13.0) Height (cm) 129.5 (122.2, 135.0) 136.0 (129.0, 140.0) 137.0 (132.5, 154.5) Weight (kg) 26.0 (23.0, 29.0) 30.5 (26.0, 35.0) 32.0 (25.5, 39.5) Note. *The age, height and weight of the subjects in the three groups all followed the normal distribution and had the same variance, with no statistical difference (P > 0.05). #The age, height and weight of the three groups were not subject to normal distribution, with statistically significant differences (P < 0.05). Table 1. The demographic characteristics of subjects in two-stage study
-
The detection stage in serum identified 7,064 metabolites and 1,879 metabolites with VIP > 1. Using non-parametric tests, 1,384 metabolites with statistical significance among three groups (P < 0.05) were selected. By searching online databases (Metlin and HMDB), eight endogenous metabolites potentially closely associated with KBD were discovered, namely, kynurenic acid, N-α-acetylarginine, 6-hydroxymelatonin, sphinganine, ceramide, sphingosine-1P, spermidine, and glycine. The details of metabolites can be seen in Table 2.
Metabolites m/z (Da) RT (min) VIP Variation trends P value Kynurenic acid 190.084 4.526 2.492 + < 0.0001 N-α-acetylarginine 217.098 1.626 1.573 − 0.0040 6-hydroxymelatonin 249.158 14.695 1.578 − < 0.0001 Sphinganine 302.306 1.056 2.596 − < 0.0001 Ceramide 330.332 16.913 1.935 + < 0.0001 Glycine 362.241 8.784 2.835 − < 0.0001 Sphingosine 1-phosphate 394.232 19.232 2.318 − < 0.0001 Spermidine 674.258 10.697 1.907 + 0.0010 Note. +: The metabolite level of the case group was higher than that of the control groups; -: The metabolite level of the case group was lower than that of the external control group. Table 2. Endogenous difference metabolites in serum associated with KBD selected in discovery study
-
Except for ceramide, seven substances selected in the discovery study were determined by HPLC-Q-TRAP-MS. Five candidate metabolites were validated and they were kynurenic acid, N-α-acetylarginine, sphinganine, spermidine, and sphingosine-1P. The levels of these substances and statistical analysis results are shown in Table 3. With the exception of spermidine, the other four substances showed low expression in the case group. Between the two control groups, with the exception of sphinganine the levels of the other four substances showed higher expression in the internal control group. The details are presented in Figure 2.
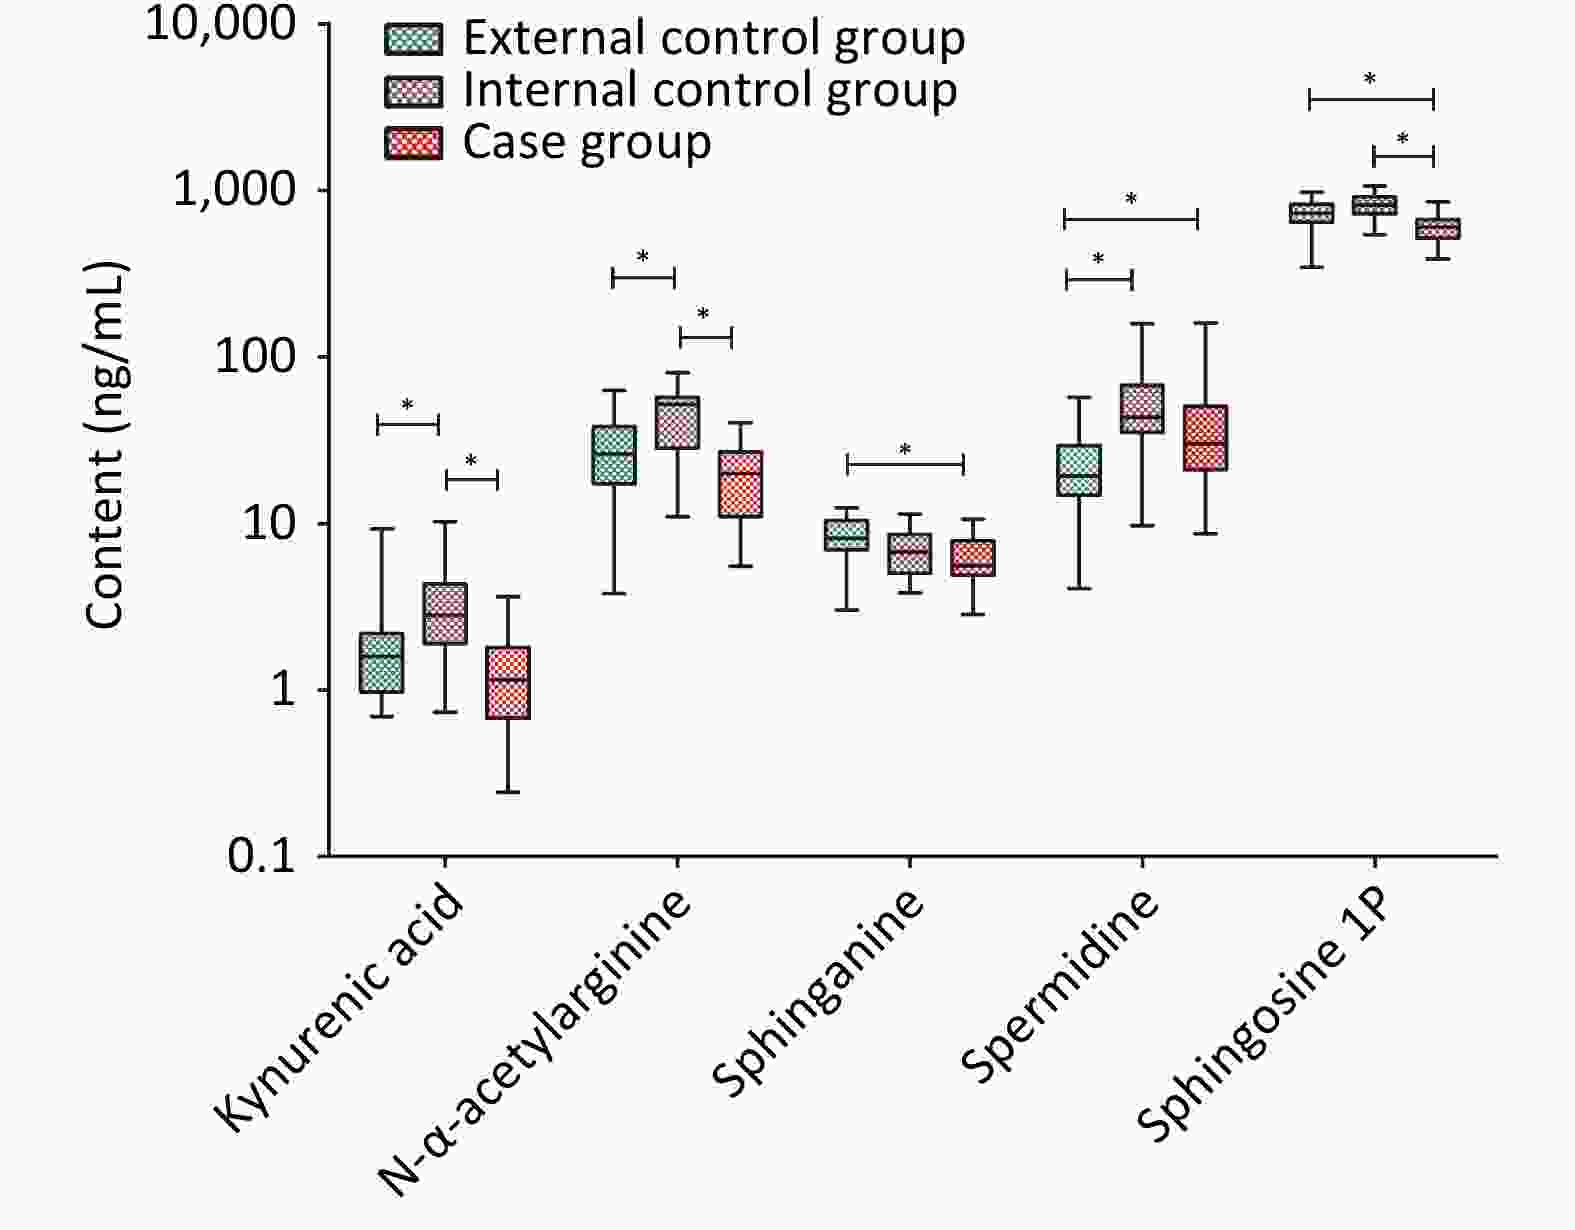
Figure 2. Quantitative results of difference metabolites in validation cohort. *Means P < 0.05.
Metabolites External control group Internal control group Case group P value Kynurenic acid* 1.60 (0.97, 2.18)a 2.82 (1.90, 4.32)b 1.15 (0.68, 1.81)a < 0.0001 N-α-Acetylarginine 28.41 ± 17.12a 47.36 ± 19.57b 19.98 ± 9.17a < 0.0001 Sphinganine 8.22 ± 2.43a 6.94 ± 2.37ab 6.20 ± 2.05b 0.0240 Spermidine* 19.20 (14.78, 29.38)a 43.70 (35.38, 67.48)b 30.10 (21.00, 50.53)b < 0.0001 Sphingosine 1P 709.25 ± 149.73a 799.30 ± 139.61a 591.75 ± 115.31b < 0.0001 Note. *The data did not conform to the normal distribution and was described by the median (quartile); other data conformed to normal distribution, expressed as mean ± standard deviation. a and b represented statistically significant among case group, external control group and internal control group, respectively, different letter means difference and one same letter means no-difference. Table 3. Verified difference metabolites and the level among three groups in validation cohort (ng/mL)
-
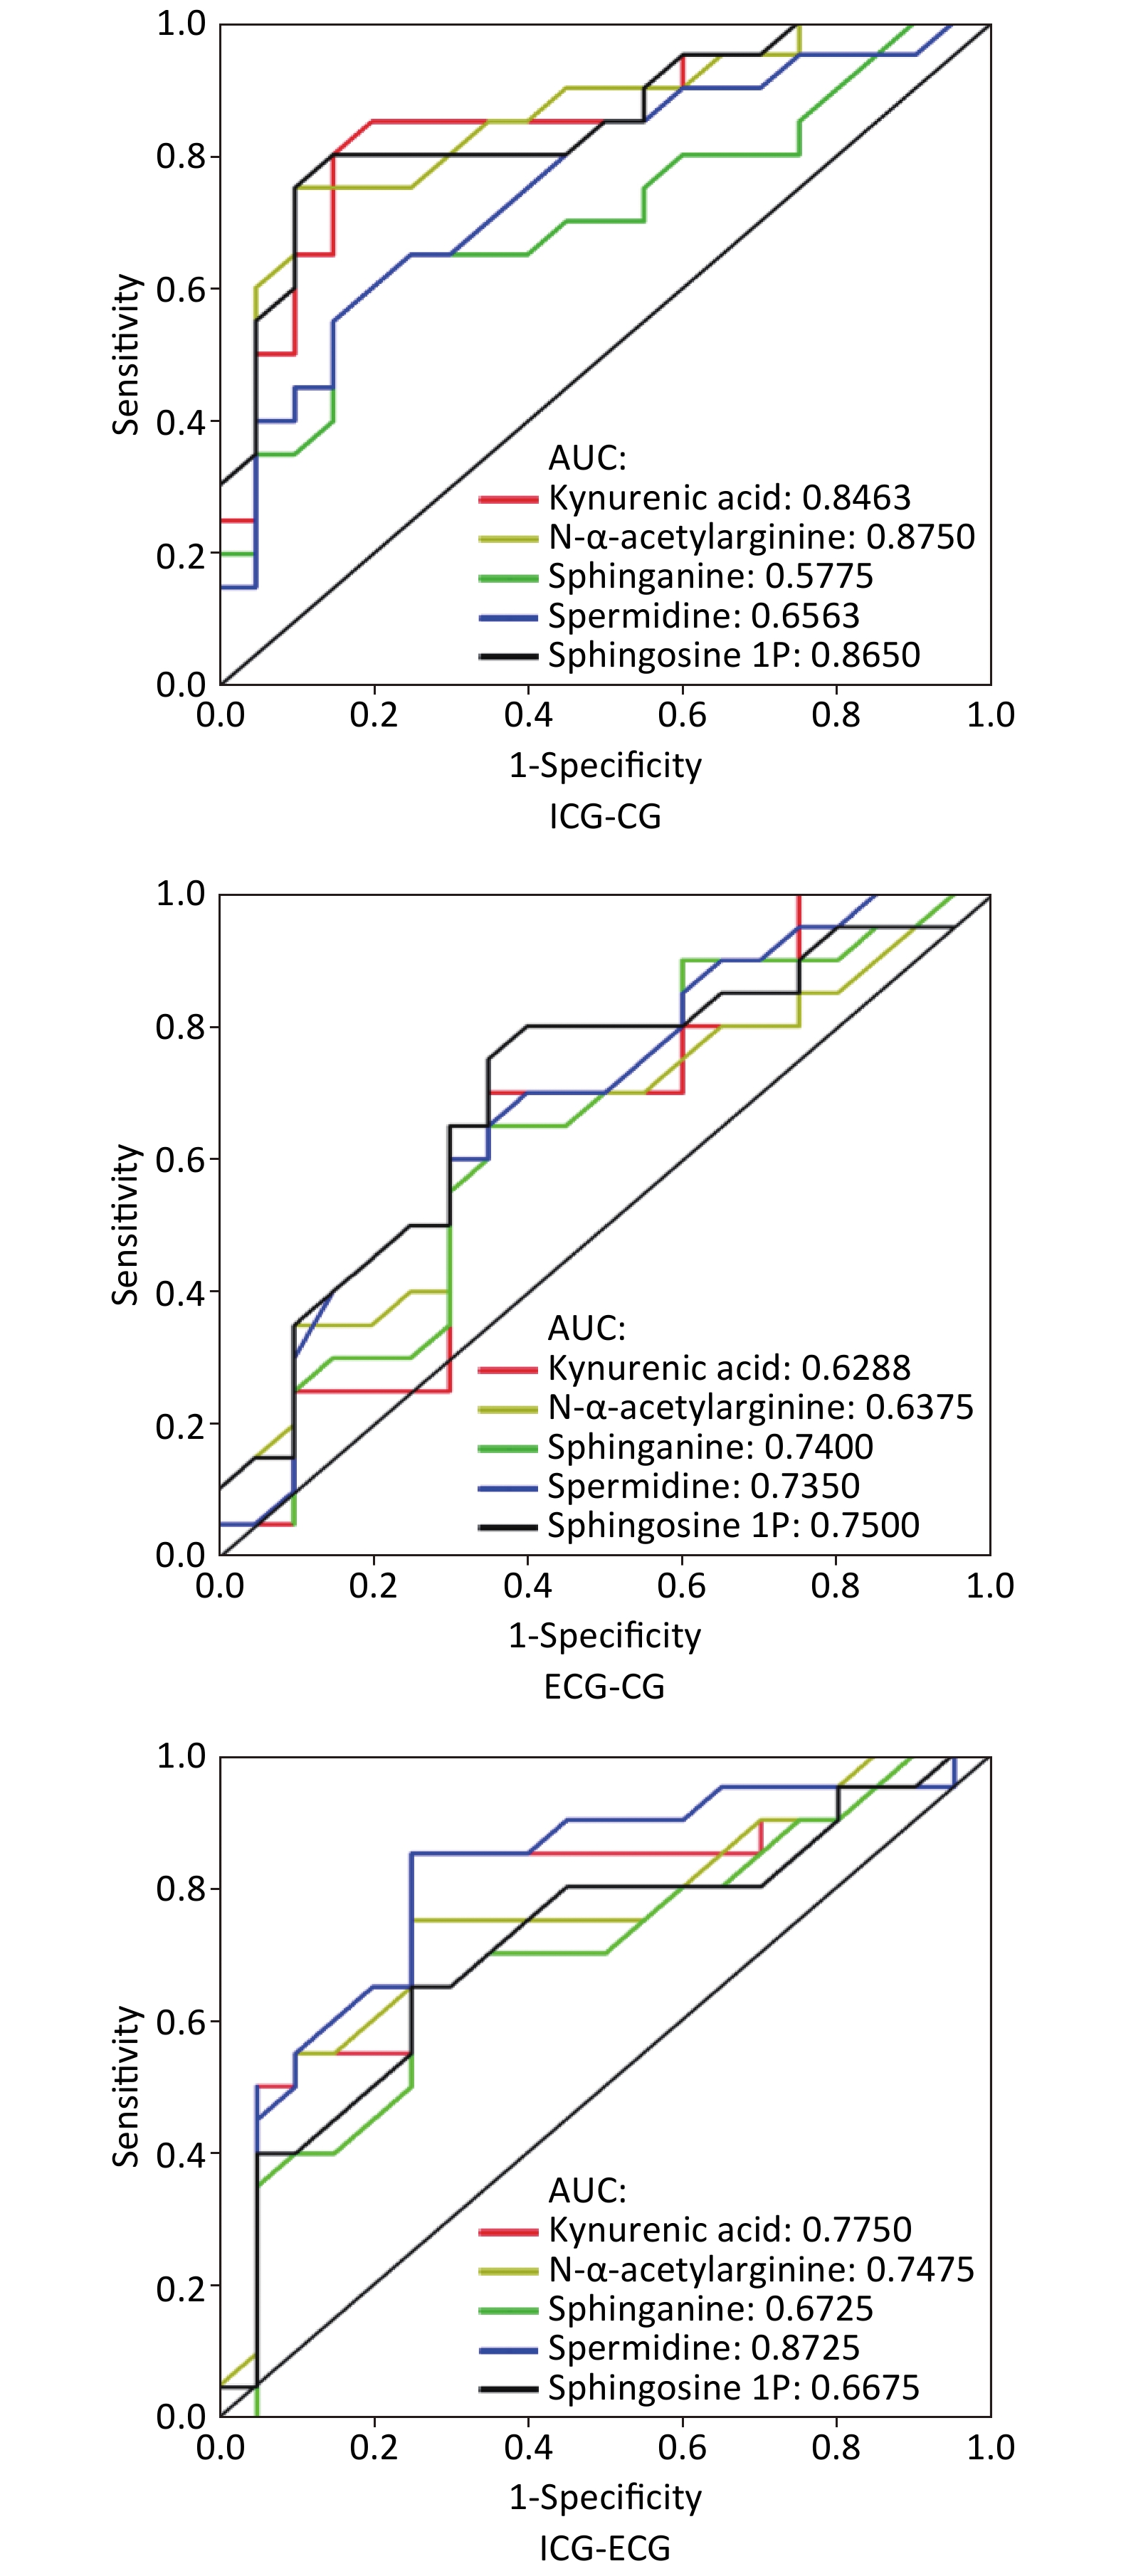
An ROC curve was constructed in order to evaluate the potential of single metabolites validated in the second cohort for disease recognition. The results were as follows: between the internal control group and case group, the AUC of kynurenic acid, N-α-acetylarginine, sphinganine, spermidine, and sphingosine-1P was 0.85, 0.88, 0.58, 0.66, and 0.87, respectively; between the external control group and case group, the AUC of five metabolites was 0.63, 0.64, 0.74, 0.74, and 0.75, respectively; between the two control groups, the AUC of five metabolites was 0.78, 0.75, 0.67, 0.87, and 0.67, respectively. Details are shown in Figure 3.
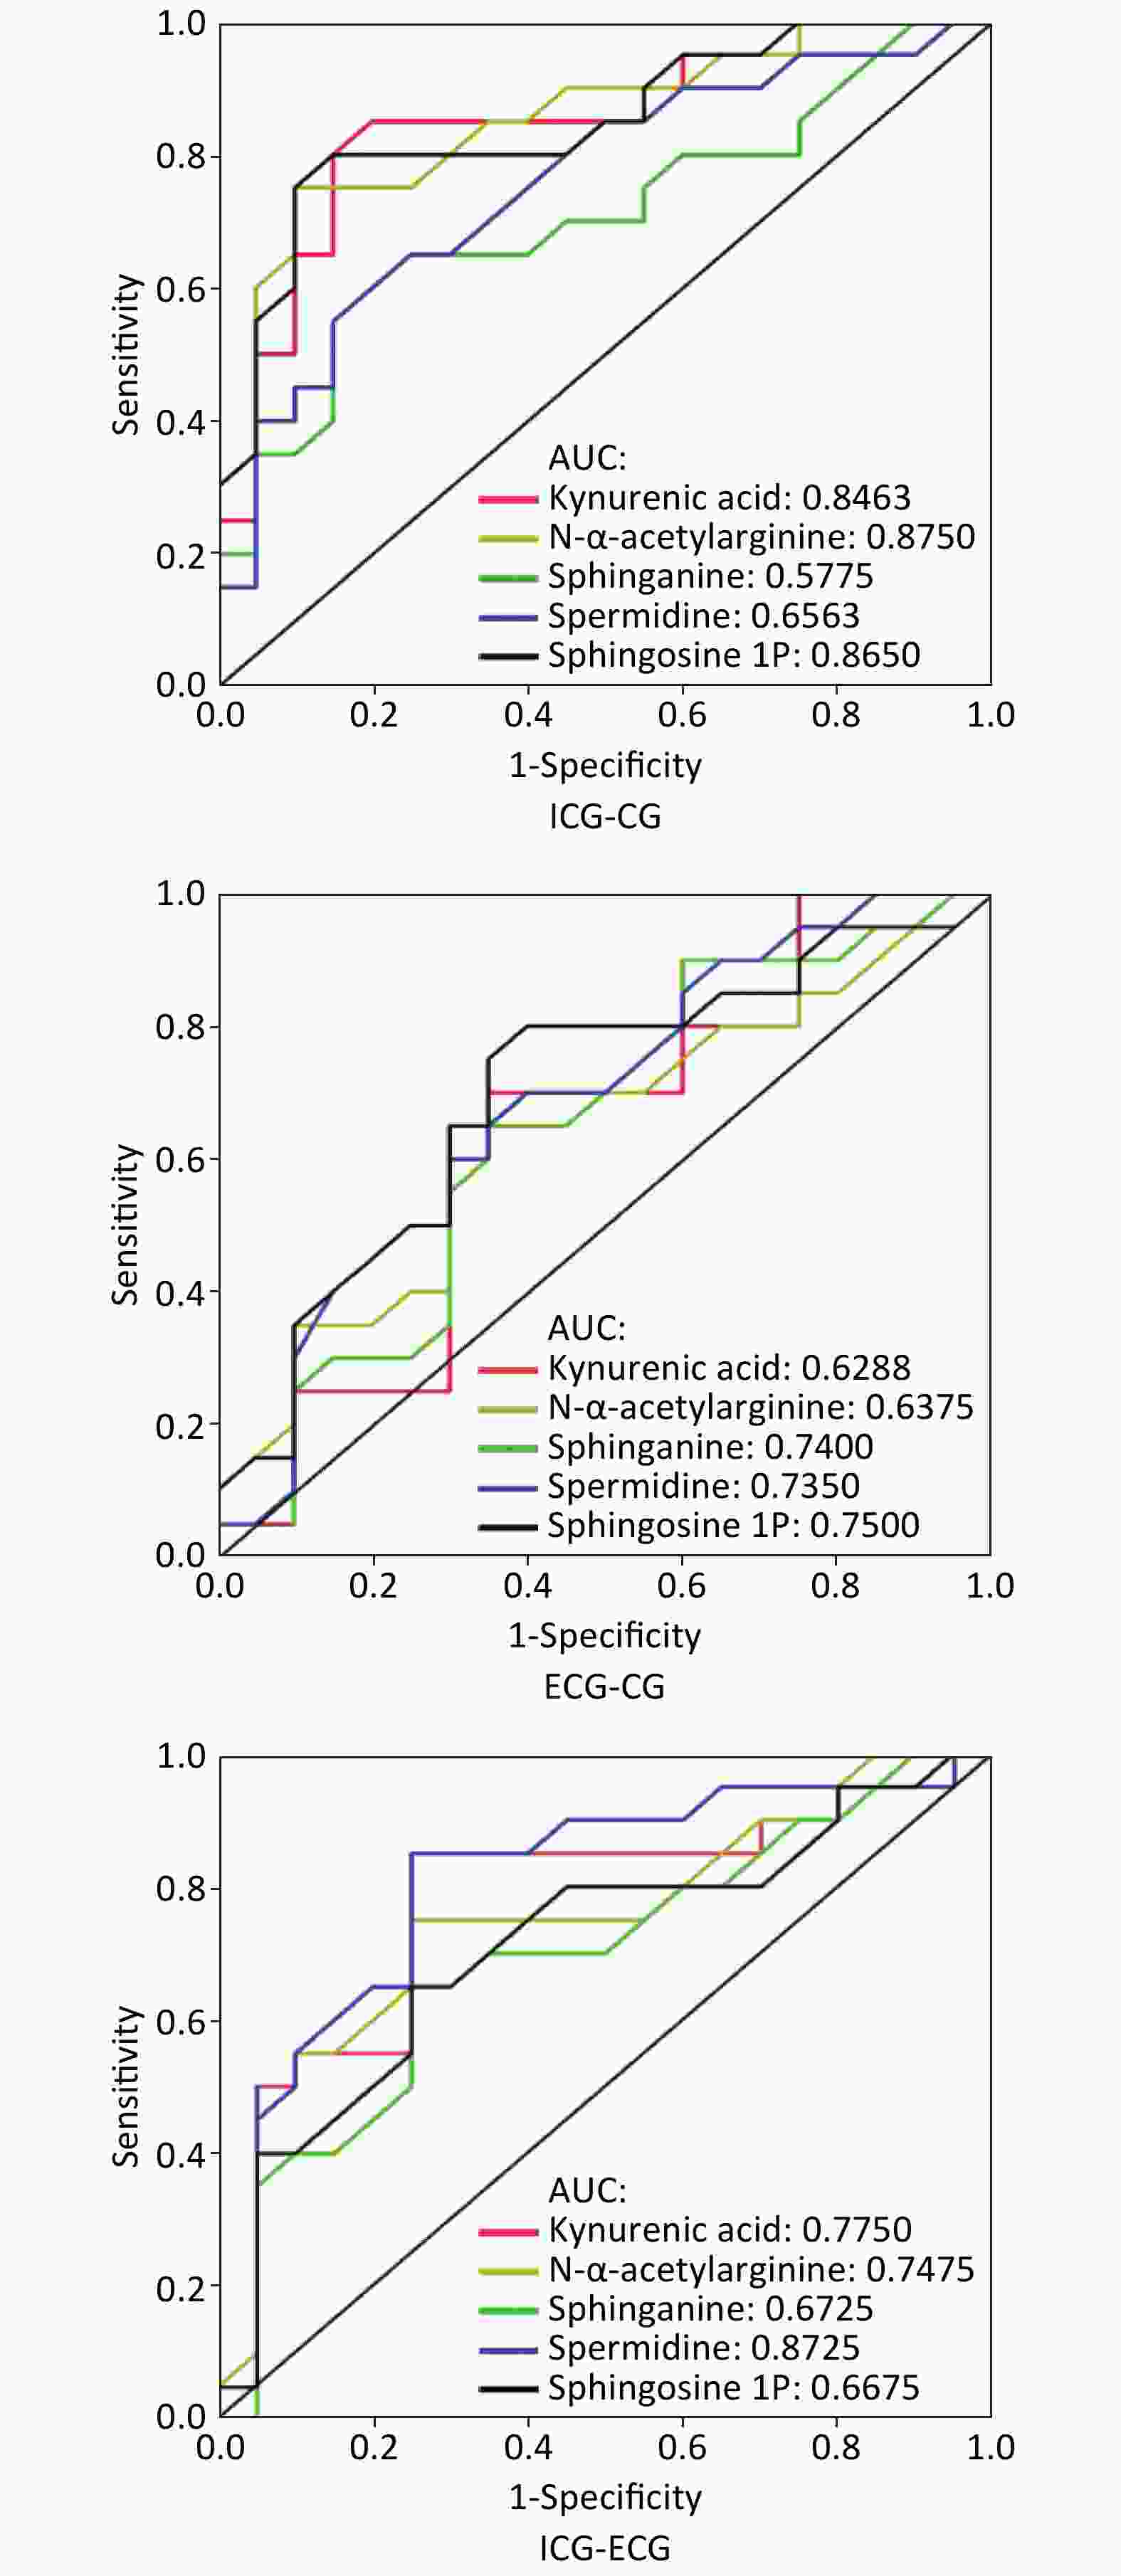
Figure 3. The ROC curve between groups. ICG is internal control group; ECG is external control group; CG is case group. AUC is area under the curve. Sensitive = true positives/ (true positives + false negatives); specificity = true negatives/(true negatives + false positives).
-
In this study, the metabolic pathways in which the eight metabolites found in the discovery study were identified and analyzed. Results showed that these metabolites were mainly involved in three metabolic pathways, namely sphingolipid metabolism, glutathione metabolism and tryptophan metabolism, in which, the impact value of sphingolipid metabolism was maximal (up to 0.46; Table 4). The sphingolipid metabolism pathway included sphinganine, ceramide, and sphingosine-1P; the glutathione metabolism pathway included spermidine and glycine; and kynurenic acid and 6-hydroxymelatonin were included in the tryptophan metabolism pathway.
Pathways Total Hits Raw P -Log (P) Holm adjust P FDR PI Sphingolipid metabolism 25 3 0.0010 6.9000 0.08 0.08 0.4602 Glutathione metabolism 38 2 0.0386 3.2600 1.00 0.91 0.0361 Tryptophan metabolism 79 3 0.0259 3.6500 1.00 0.91 0.0114 Note. Total means the total number of compounds in the pathway; Hits means the number of actual matches between the input metabolites and the compounds in the pathway; Raw P is the original P value derived from the enrichment analysis and < 0.05 means significance; PI means the impact factor of the pathway, which is obtained through topological analysis and it is significant when PI > 0.01. Table 4. The results of metabolic pathways analysis
-
In this research, we identified and validated serum metabolites associated with KBD using a two-stage study. These results provide the most comprehensive analysis of serum metabonomics in KBD performed to date, and led to the identification of new potential biomarkers of KBD, as well as providing strong evidence of potential metabolic pathways involved in the disease.
Due to decreasing incidence of KBD, the number of patients in the validation study was small and the average age of patients was higher, which resulted in an unbalance of age, height, and weight among groups. However, these differences had little influence on the research results. In addition, all subjects in this study were boarding school students, and their diets were standardized and rationed by the Chinese government. Thus, the influence of different diets on metabolites was considered to be minor.
Supervised PLS-DA is often used to predict the quality of mathematical models in data analysis. The model parameter R2 is goodness of fit and Q2 is predictability. When both R2 value and Q2 value exceed 0.8, the model is considered to be a good fit with strong predictive power [12]. In the discovery study, the PLS-DA model parameters exceeded 0.9 (R2 = 0.987 and Q2 = 0.93), indicating that the model was stable and had good predictive power. Finally, eight endogenous candidate metabolites closely associated with KBD were identified, and five metabolites were validated in the second-stage study. Between the case group and external control group, the changes in the levels of three metabolites were consistent across the two-stage study. Specifically, levels of sphinganine and sphingosine-1P decreased but spermidine increased in the case group, and the differences were statistically significant. The findings of the validation study verified the results of the discovery study well. Therefore, we believe that these three metabolites could potentially serve as biomarkers of KBD.
To our knowledge, this is the first time that sphinganine, sphingosine-1P, and spermidine have been described in the context of KBD. Sphinganine and sphingosine-1P are sphingolipids that can jointly regulate cell growth, differentiation and programmed cell death [13]. Sphingosine-1P is a signaling molecule that regulates cell growth and suppresses apoptosis [14,15], which can inhibit IL-1β-induced MMP-1, MMP-3, MMP-13 and MMP-14 mRNA expression and proteoglycans degradation in human chondrocytes in a dose-dependent manner [16]. In this study, the content of sphinganine and sphingosine-1P in KBD children decreased markedly. Since excessive chondrocyte apoptosis is one of major changes of KBD[17,18], this reduction may represent one facet of the pathogenesis of KBD. At the same time, the low level of sphingosine-1P might increase the activity of MMPs, promote the ECM destruction of articular cartilage and the progression of KBD.
The third key metabolite is spermidine, a species of polyamine. Polyamines are best known as essential factors for cell proliferation, but they are also involved in other cellular responses, such as differentiation, hypertrophy and apoptosis[19-20]. Research by the Stanic group demonstrated that a minimum level of polyamines is required for a normal apoptotic response in human chondrocytes[21]. Previous evidence indicates that polyamines play multiple physiological roles and that alteration of their metabolism and levels may be involved in many diseases [22]. In this study, the spermidine content of KBD children was found to be significantly elevated, and this unusual increase was assumed to promote apoptosis and/or necrosis of chondrocytes, consequently leading to a change in cartilage structure.
Together, the results of this study provide strong evidence that three metabolites could potentially serve as biomarkers of KBD.
The situation in the internal control group was more complex. In the discovery study, the levels of most candidate metabolites were between those in the external control group and those of the case group. In the validation study, with the exception of sphinganine, the levels of other substances were higher than those in the external control and case groups. As a typical endemic disease, KBD must have unique causes in disease areas. In this sense, there are two kinds of situations in children living in KBD areas but not suffering from this disease: they are either exposed, or not exposed, to the pathogenic factors. The abnormal increase of four metabolites in the internal control of this study might be related to the small dose of stimulation or compensatory response of pathogenic factors, and this phenomenon also reflected the potential disease recognition ability of these metabolites. In the future, they could be used as biomarkers for early diagnosis of diseases for further study.
KBD is endemic, and the disease area contains pathogenic factors. The internal control lives in the ward. Although the person is not a patient, they may also be affected by pathogenic factors that cause changes in metabolite levels. The external control is completely healthy and is not affected by the ward. In this study, the results of pairwise analysis of the three groups of ROC curves showed that sphingosine-1P has better disease recognition ability, while spermidine has better ability to distinguish diseased areas (Figure 3).
In this study, three metabolic pathways, namely the sphingolipid, tryptophan, and glutathione metabolic pathways, were closely related to KBD, especially the sphingolipid metabolic pathway. In addition to sphinganine and sphingosine-1P, another important substance in the sphingolipid metabolism pathway was ceramide. Ceramide, as a pivotal member of the sphingolipids, is a second messenger responsible for regulating cellular activities whose major function is to transmit growth-inhibiting signals such as apoptotic signals[23]. Sphinganine and sphingosine-1P is the precursor and downstream metabolite of ceramide, respectively. There is ample evidence to suggest that the balance between ceramide and sphingosine-1P levels in cells is an important determinant of cell fate. When the content of sphingosine-1P is higher and ceramide is lower, the cells maintain proliferation and survival, whereas otherwise the cells tend to apoptosis. In the first stage of this study, the relative content of ceramide in the case group was highest, and the relative content of sphingosine-1P was lowest. This imbalance may be one factor in the pathogenesis of pediatric KBD. In the validation study, the content of sphinganine and sphingosine-1P in case group was still at a low level, consistent with the results in the discovery study. Therefore, although there are too many isomers of ceramides to detect in the validation study, our results still supported the view that sphinganine, sphingosine-1P and ceramide can be collectively considered as a potential biomarker cluster. In the future, further studies are necessary in order to determine the credibility and utility of this metabolite cluster as a diagnostic biomarker for KBD.
In this study there are some limitations. First, the samples were only detected with positive ESI, a technique which may miss some metabolites with negative ESI. Secondly, the sample size of this study was comparatively small and only met the basic statistical requirements. The statistical efficiency could have been improved if the sample size had been appropriately increased. Therefore, we will continue to conduct further study in the future to verify the conclusions of this study.
-
In summary, our study was unique for two main reasons. First, we found that sphinganine, sphingosine-1P, and spermidine in serum could be used as potential biomarkers of pediatric KBD. They were involved in three metabolic pathways. Besides, a potential biomarker cluster including sphinganine, ceramide, and sphingosine-1P was preliminarily confirmed, and may be a valuable metabolite cluster to diagnose KBD.
-
We thank the Centers for Disease Control and Prevention of Guide, Xinghai, Tongde, and Hualong Countries, Qinghai Province for their assistance. We also gratefully acknowledge the parents and guardians of the subjects for their cooperation.
-
This study was conducted in accordance with the Helsinki Declaration II, and was approved by the Institutional Review Boards of Harbin Medical University (HMUIRB 2012001) and the Administration Village Committee. Written informed consent was obtained from the parents or guardians of all children.
-
The datasets used and/or analyzed during the current study are available from the corresponding author on reasonable request.
-
All authors declare that they have no competing interests.
-
Study conception and design: WANG Li Hua. Acquisition of the data: WANG Yu Meng, WANG Wei Yi, and WANG Li Hua. Literature search: SUN Li Yan, WANG Wei Yi, ZHANG Rong Yu and WANG Yu Meng. Analysis and interpretation of the data: WANG Wei Yi, HU Jian, and WANG Yu Meng. Sample collection: ZHAO Zhi Jun. X-ray examination: LI Qiang. Drafting or revising the article: WANG Yu Meng, WANG Wei Yi, and SUN Li Yan. Final approval of the version to be submitted: WANG Li Hua.
Funds:
This work was supported by the National Natural Science Foundation [NO.81372937]
$WANG Yu Meng and WANF Wei Yi contributed equally to this work.
 Quick Links
 DownLoad: