


-
Minerals are inorganic micronutrients present in small concentrations in the body tissues and fluids; their presence is necessary to meet physiological needs and maintain homeostasis. Minerals are used by the body in many ways[1], and every form of living matter requires these elements[2]. Trace elements are the most important class of minerals[3]. They are involved in many body mechanisms, such as structural components of body tissues, maintenance of acid-base balance, regulation of body fluids, muscle contractions, and transport of gases[3]. These elements also play important roles in health and disease states of humans and animals. Nutrition research has identified essential four trace elements: zinc, copper, iron, and selenium.
Selenium (Se) is usually considered to be a major constituent of glutathione (GSH) peroxidase (GPx)[3]. This element is an antioxidant that increases the immune function and protects an organism from oxidative damage in cell membranes[4]. Additionally, Se has a positive influence on male reproductive system[5,6]. Zinc (Zn) is a mineral component involved in physical performance functions, including the maintenance of DNA and RNA, energy production, cell metabolism, and adjustment of defence reactions. This element is important for immunity, reproduction, and hormonal activity in dairy cattle and rats[7]. Zn administration can prevent metal toxic effects on the testis of rats[8]. Messaoudi et al.[9] have suggested that Se and Zn can have a synergistic role against toxicity due to the interactions between Se and Zn compounds. However, we can suggest that the antioxidant properties of Zn and Se can be at least in part, involved in their synergistic role. Iron is an essential element in human nutrition; it performs several crucial functions in the human body. Essential compounds with iron constituents include peroxidase, catalases, cytochromes, hemoglobin, and myoglobin[10]. Copper (Cu) is a cofactor in various redox enzymes and causes the formation of radical oxygen species (ROS) and lipid oxidation. This element is indispensable for the formation and growth of bones and synthesis of myelin and sheaths. Cu also interferes with the incorporation, absorption, and transfer of Fe[3]. Biological tests on animal models had shown the importance of trace elements in nutrition[11]. These ions are essential for reproductive organ development and the spermatogenesis process[12,13]. Several disturbances, such as gonad dysfunction, decrease in testis weight, contraction of seminiferous tubules, testicular cancer distribution, and infertility, have been induced by mineral deficiencies[13].
Meanwhile, many chemicals, mainly pesticides, have been considered as having reproductive-disrupting function[14-16]. Among such pesticides, tebuconazole (TBZ) is a systemic fungicide used in agriculture and in human and veterinary medicine to treat a broad spectrum of fungal diseases. TBZ is designed to inhibit fungal cytochrome P450 (CYP) to block cell membrane synthesis. As a side effect, TBZ may inhibit mammalian CYP enzymes in an unspecific manner. Thus, TBZ may cause adverse effects related to this mode of action[17,18,19]. Yang et al.[20] demonstrated that the treatment of rats with TBZ affected the antioxidant defence in testis and decreased testosterone concentration and cauda epididymal sperm count. Zhou et al.[21] indicated that triazole fungicide disturbed the normal cell cycle distribution of human trophoblast cells and reduced cell viability via disrupting protease systems, angiogenic factors, hormones, cytokines, and growth factors. Human contamination by TBZ may occur via dermal contact[22]. Fustinoni et al.[22] demonstrated that total dermal exposure of agricultural workers to TBZ showed median levels of 6,180 and 1,020 mg TBZ. The amount of metabolites excreted in urine accounted for 17% of the total dermal TBZ exposure. The contribution of TBZ in diet is negligible in comparison with that of occupational exposure[22].
This study aimed to gather evidence on the possible correlation between exposure to TBZ and the reproductive system and the protective effects of essential trace elements (selenium, zinc, copper, and iron) against TBZ-induced reprotoxicity.
-
A total of 48 pubertal male Wistar rats (3 months old, 180 ± 10 g) were obtained from the Central Pharmacy of Tunisia and placed in polypropylene cages (PP-R5 model; size: 545 × 395 × 200 mm3; 21.5 × 15.6 × 7.9 mm3; material: polypropylene rodent cage; stainless steel lid; 1,000 mL polypropylene bottle) in a ventilated vivarium. The rats were submitted to a photoperiod of 12 h light and 12 h dark. The experimental procedures, handling, sampling, and scarification of animals were performed in accordance with the Natural Health Institute of Health Guidelines for Animal Care approved by the ‘Institute Ethical Committee Guidelines’ Council of European Communities[23] and the use of laboratory animals of our institution.
-
Adult rats were divided into 6 groups with 8 rats in each group and were treated for 4 consecutive weeks as follows: (1) The control group rats were treated with corn oil; (2) one group intraperitoneally received TBZ (99.5% pure) dissolved in corn oil at a dose of 100 mg/kg body weight (b.w.); (3) another group was co-treated with TBZ associated to Cu + Zn + Se + Fe; (4) one group was co-treated with TBZ + (Zn + Se); (5) one group was co-treated with TBZ + Cu; (6) the final group was co-treated with TBZ + Fe. The combination of Zn and Se was used to examine the synergistic role of these elements. TBZ, Se, Zn, Cu, and Fe doses and mode of administration were selected on the basis of available literature data[24,4,25,26]. Although extrapolating the dose of TBZ that can be used for humans is difficult, several methods can be used to achieve such goal[27,28]. The dose varied between 0.1 and 0.3 g/kg b.w.
During the experimental period, daily food, and water consumptions were investigated in accordance with the method described by Brzóska and Moniuszko-Jakoniuk[29]. On the last day of treatment, rats from different groups were killed by cervical decapitation. Blood (4 mL each rat) was immediately collected into heparinised tubes and centrifuged at 5,000 rpm for 5 min at 4 °C to obtain the plasma. The testes and seminal vesicles were excised and weighed for determination of relative weight. A total of 0.8 g of each testis were kept at −20 °C for mineralization and oxidative stress estimation[30]; 0.4 g sample was flash frozen in liquid nitrogen and stored at −80 °C until genotoxicity analysis[31]. A total of 0.8 g testis was immediately fixed in 10% buffered formaldehyde solution, dehydrated in graded alcoholic solutions, and embedded in paraffin for subsequent histological studies[32]. Cauda epididymis was removed for sperm analysis (counts, motility, viability, and morphology)[32].
-
In accordance with the method used by Ial[33], Zn, Cu, Fe, Mg, Ca, K, Na, Pb, and Ni concentration in plasma and testes were measured by atomic absorption spectroscopy (Thermo-Scientific ICE 3000, Sherwood Scientific Ltd., Cambridge, UK) after nitroperchloric mineralisation (2/1 V). The wavelengths of mineral elements were defined on the device: Mg (285.2 nm), K (766.5 nm), Ca (422.7 nm), Na (589 nm), Zn (213.9 nm), Ni (232 nm), Cu (324.8 nm), Fe (248.3 nm), and Pb (283.3 nm).
-
Sperm Motility and Count Spermatozoa were obtained by small cuts in the cauda epididymis and placed in 0.05 M phosphate buffered saline (pH 7.4) in accordance with the methods of Anderson et al.[34] and Wyrobek et al.[35]. Sperm suspension was evaluated for percent motility and sperm content. The percentage of mobility was determined by the slow and fast movements of spermatozoa (progressive movements) and any kind of flagellar or head movement. The sperm count was determined by using a Neubauer hemocytometer.
Sperm Viability Sperm viability analysis was performed using eosin/nigrosin staining. The staining was assessed on a microscope slide, with one drop of fresh semen to two drops of staining solution. A smear was made and allowed to dry on another slide. Unstained spermatozoa and spermatozoa with damaged membrane were counted under the microscope at 3100X. In accordance with the work of Eliasson[36], the percentage of intact cells corresponded to sperm viability.
Sperm Morphology Sperm suspension was stained with eosin; smears were made on slides, air-dried, and made permanent to calculate the abnormalities in spermatozoa. The slides were observed under the microscope using X100 and oil immersion objectives. Morphologically abnormal spermatozoa were counted, and their percentage was calculated[37].
-
Plasma samples of different groups were analysed for concentrations of testosterone, LH, and FSH by previously validated radioimmunoassays[38,39]. The testosterone count was expressed as ng/mL, whereas the LH and FSH amounts were expressed as IU/mL.
-
In accordance with method of Sambrook and Russell[40], DNA quantification in the testis samples was determined spectrophotometrically under 260 nm ultraviolet light.
-
The DNA was extracted using a commercial kit (Pure Link Genomic DNA Invitrogen, ref K 182001) and in accordance with the standard procedures. The procedures consisted of electrophoresis of full genomic extracted DNA resolved in agarose gel. The gel was observed under an ultraviolet lamp and photographed.
-
Rat testes were dissected and homogenized in physiological saline solution (pH = 7.4) and centrifuged for 15 min at 10,000 rpm. The supernatants were preserved for biochemical tests:
Protein Quantification Protein contents were determined following the method used by Lowry et al.[41], using Folin’s reagent and with bovine serum albumin as a standard.
Oxidative Stress Assays Lipid peroxidation (LPO) in the testis homogenate was measured as malondialdehyde (MDA) production assayed in thiobarbituric acid reaction, as described by Draper and Hadley[42]. The MDA contents were determined by using a spectrophotometer and expressed as nmoles of MDA/g tissue.
Advanced oxidation protein product (AOPP) of testis homogenates was calculated by the extinction coefficient [261 (cm·mmol/L)−1]. The results were expressed as µmol/mg protein in accordance with Witko’s method[43].
Antioxidant Defences Superoxide dismutase (SOD) activity was estimated by using a spectrophotometer and in accordance with the method of Beauchamp and Fridovich[44]. This activity was determined as the amount of enzyme necessary to inhibit the reduction of nitrobluetetrazolium by 50%. The result was measured as µmol/mg protein.
GPx activity was measured spectrophotometrically and in accordance with the method used by Ellman[45]. The results were expressed as nmoles of GSH oxidized/min/mg protein.
The GSH levels were estimated in the testis homogenate using 5,5’-dithiobis (2-nitrobenzoic acid), whose absorption was recorded at 412 nm[46]. The results were expressed as µg/g tissue.
-
The testis tissue was dissected. Tissue sections were fixed in phosphate-buffered formalin solution (10%) at room temperature. After washing overnight, the samples were dehydrated in ethanol, clarified in xylene, and embedded in paraffin. Pathological changes in the testis were observed by haematoxylin and eosin (H&E) staining. Six slides were prepared from each testicle. The sections were examined under an optical microscope to improve the resolution and sample contrast and photographed with a digital camera.
Testis sections were evaluated for semi-quantitative degree of testis injury[47].
-
All the results were expressed as the mean ± standard deviation (SD). Significant differences between groups were analysed using two-way factorial analysis of variance (ANOVA), followed by Duncan’s multiple-range test using SPSS 20.0 as a post hoc test for comparison between groups. Differences were considered significant if P < 0.05.
-
The b.w. and food and water intake of each rat were weighed using an analytical balance with an accuracy of 0.001. No significant b.w. modification was noted during the first week of treatment by TBZ. A week later, the b.w. of the TBZ-treated group was slightly lower than that of the control group and groups co-treated with trace elements. Two-way ANOVA test demonstrated the significant effect of TBZ (P < 0.001).
Meanwhile, the b.w. increased in all co-treated groups, with the most significant change occurring in the fourth week (Table 1). In the TBZ + Cu-treated group, the b.w. increased after four days of treatment and remained almost constant throughout the treatment period. Post hoc comparisons revealed that in the TBZ + (Se + Zn), TBZ + Fe, and TBZ + (Se + Fe + Cu + Zn) groups, a significant increase in b.w. was noted compared with the TBZ-treated rats.
Parameters Groups Control TBZ TBZ + (Se + Fe + Zn + Cu) TBZ + (Se + Zn) TBZ + Cu TBZ + Fe Initial body weights (g) 192 ± 1.08 193.25 ± 2.31 195 ± 0.98 199.75 ± 1.92 194.75 ± 1.95 197.5 ± 4.66 Final body weights (g) 198.75 ± 2.21 172.5 ± 1.19 212.5 ± 1.09 218 ± 2.47 209 ± 4.65 213.05 ± 4.81 Change in body weights (%) +6b −20a +17c +18c +14c +16c Absolute testes weights (g) 2.04 ± 0.51 1.94 ± 0.12 2.24 ± 0.11 2.14 ± 0.10 2.09 ± 0.24 2.15 ± 0.09 Relative testes weight (g/g BW) 1.08 ± 0.13 1.02 ± 0.1 1.08 ± 0.2 1.07 ± 0.15 0.91 ± 0.22 0.96 ± 0.15 Food consumption (g/day/rat) 17.05 ± 3.52 15.72 ± 3.54 16.57 ± 3.75 16.31 ± 3.67 16.57 ± 3.82 16.43 ± 3.70 Drinking water intake (mL/d per/rat) 19.13 ± 2.83 24.45 ± 6.28 18.91 ± 4.24 18.20 ± 6.18 21.56 ± 5.53 22.29 ± 6.51 Note. Values were expressed as means ± SD. The number of determinations was N = 8. Different superscript letters (a, b, c) indicate significant differences at P < 0.05. Table 1. Initial and final body weights, absolute and relative testes weights, daily food and water consumption by control and treated rats with TBZ (100 mg/kg) and TBZ + (Cu + Zn + Fe + Se), TBZ + (Se + Zn), TBZ + Cu, or TBZ + Fe
Similarly, food intake in the first week was comparatively small for all groups. The slight decrease in the second week and distinct decreases in the third and fourth weeks after TBZ treatment were recovered by Se, Zn, Cu, and Fe to a certain extent (Table 1).
-
Table 2 shows the concentrations of minerals in the plasma and testis of rats. Two-way ANOVA demonstrated a significant perturbation in mineral composition induced by TBZ. The calcium, iron, zinc, potassium, magnesium, and sodium concentrations significantly increased in the plasma and decreased in the testis of TBZ exposed-rats when compared with the control animals (P < 0.001). Phosphorus concentration was significantly lower in the plasma and higher in the testis.
Parameters and treatments Controls TBZ TBZ + (Cu + Zn + Fe + Se) TBZ + (Se + Zn) TBZ + Cu TBZ + Fe Plasma levels (mg/L) Calcium 48.42 ± 3.32a 71.43 ± 9.44cd 66.84 ± 1.37b 72.22 ± 9.10d 69.98 ± 2.43bc 68.54 ± 2.15b Phosphorus 45.14 ± 1.30d 12.18 ± 4.80a 56.57 ± 5.15e 32.35 ± 3.65c 56.33 ± 4.80e 15.71 ± 4.56b Iron 0.49 ± 0.07a 0.99 ± 0.05e 0.78 ± 0.03d 0.52 ± 0.02b 0.69 ± 0.06c 1.20 ± 0.01e Zinc 0.020 ± 0.01a 0.44 ± 0.02d 0.049 ± 0.01b 0.92 ± 0.02f 0.36 ± 0.02c 0.24 ± 0.02e Magnesium 0.28 ± 0.02a 1.56 ± 0.01e 0.43 ± 0.03b 0.82 ± 0.11c 1.32 ± 0.01d 0.83 ± 0.02c Potassium 132 ± 0.77b 350.92 ± 5.94f 176.39 ± 0.36d 150 ± 0.82c 227.5 ± 6.37e 83.21 ± 2.89a Sodium 107.09 ± 0.12b 147.21 ± 2.45f 85.01 ± 1.55a 137.08 ± 1.47d 144.20 ± 4.56e 120.93 ± 2.65c Copper 0.09 ± 0.01b 0.11 ± 0.06c 0.16 ± 0.02d 0.22 ± 0.01e 0.18 ± 0.02e 0.04 ± 0.01a Testes levels (mg/L) Calcium 61.32 ± 3.20c 15.71 ± 4.40a 73.58 ± 3.42d 58.80 ± 0.79b 56.33 ± 1.49b 58.58 ± 1.04b Phosphorus 57.48 ± 2.80a 73.38 ± 6.16c 69.98 ± 3.74b 66.84 ± 1.79b 71.34 ± 2.39c 61.32 ± 3.49a Iron 0.60 ± 0.03c 0.030 ± 0.01a 0.73 ± 0.01d 0.32 ± 0.07b 0.56 ± 0.09c 0.89 ± 0.05e Zinc 0.12 ± 0.01b 0.06 ± 0.01a 0.25 ± 0.02c 0.40 ± 0.02a 0.17 ± 0.02b 0.18 ± 0.05b Magnesium 53.35 ± 1.20d 29.48 ± 0.15a 30.05 ± 4.75a 45.78 ± 2.40c 32.76 ± 0.92b 41.35 ± 7.40c Potassium 83.21 ± 0.62d 24.82 ± 3.55a 61.43 ± 2.12c 28.51 ± 2.27a 30.34 ± 0.1ab 34.71 ± 1.23b Sodium 93.83 ± 8.50e 25.21 ± 5.10a 87.67 ± 5.40d 26.07 ± 1.10a 30.82 ± 0.45b 43.65 ± 1.45c Copper 0.04 ± 0.01d 0.01 ± 0.06a 0.03 ± 0.02c 0.02 ± 0.09b 0.03 ± 0.7c 0.02 ± 0.01b Note. Values are expressed as means ± SD for 3 animals in each group.
Different superscript letters (a, b, c, d, e) indicate significant differences at P < 0.05.Table 2. Mineral levels in plasma and testis of controls and rats treated with TBZ (100 mg/kg) and TBZ + (Cu + Zn + Fe + Se), TBZ + (Se + Zn), TBZ + Cu, or TBZ + Fe
Post hoc comparisons revealed that trace elements treatment attenuated the changes in mineral levels compared with the TBZ-treated rats. Upon supplementation with Se, Fe, Cu, and Zn, modulations and improvements in mineral contents, especially calcium and phosphorus, were determined compared with the TBZ-treated group (Table 2).
-
Two-way ANOVA of sperm mobility, sperm viability, and sperm count in the testes demonstrated the significant effect of TBZ (P < 0.001). Post hoc comparison revealed that sperm motility significantly decreased (P < 0.001) in the TBZ-treated group, along with a significant increase in the abnormal morphology of spermatozoa (Table 3). Trace elements (Se, Cu, Zn, and Fe) associated to TBZ significantly offset the decrease in functional sperm parameters (motility, viability, and count) when compared with the TBZ-treated rats (Table 3).
Parameters Groups Control TBZ TBZ + (Se + Fe + Cu + Zn) TBZ + (Se + Zn) TBZ + Cu TBZ + Fe SPZ count X 106 per mL 32.67 ± 7.39a 12.05 ± 1.56a 18.87 ± 5.76bc 19.76 ± 6.76bc 20.54 ± 3.87bc 19.78 ± 6.87ab Motility (%) 76.87 ± 5.75e 43.5 ± 7.87a 59.87 ± 4.87b 62.7 ± 9.4d 55.54 ± 4c 54.67 ± 6.87c Viability (%) 82.5 ± 6.76f 44.7 ± 8.9a 61.4 ± 4,22d 68.9 ± 7.76e 57.87 ± 5.87c 52.78 ± 3.76b Abnormal morphology (%) 7.9 ± 1.56a 22.6 ± 3.89C 13.56 ± 1.45b 12.1 ± 2.6b 12.6 ± 4.6b 11.8 ± 1.4b Note. Values are expressed as means ± SD for 6 animals in each group.
Different superscript letters (a, b, c, d, e) indicate significant differences at P < 0.05.Table 3. Sperm function in spermatozoa of rats controls and treated with TBZ (100 mg/kg) and TBZ + (Cu + Zn + Fe + Se), TBZ + (Se + Zn), TBZ + Cu, or TBZ + Fe during 30 d
-
Figure 1 presents the sexual hormone concentrations in the plasma of experimental rats. Statistical analysis of sexual hormones levels in the plasma showed the significant effect of TBZ (P < 0.001). Two-way ANOVA of data showed a significant decrease in testosterone and an increase in FSH and LH levels compared with the control (P < 0.001).
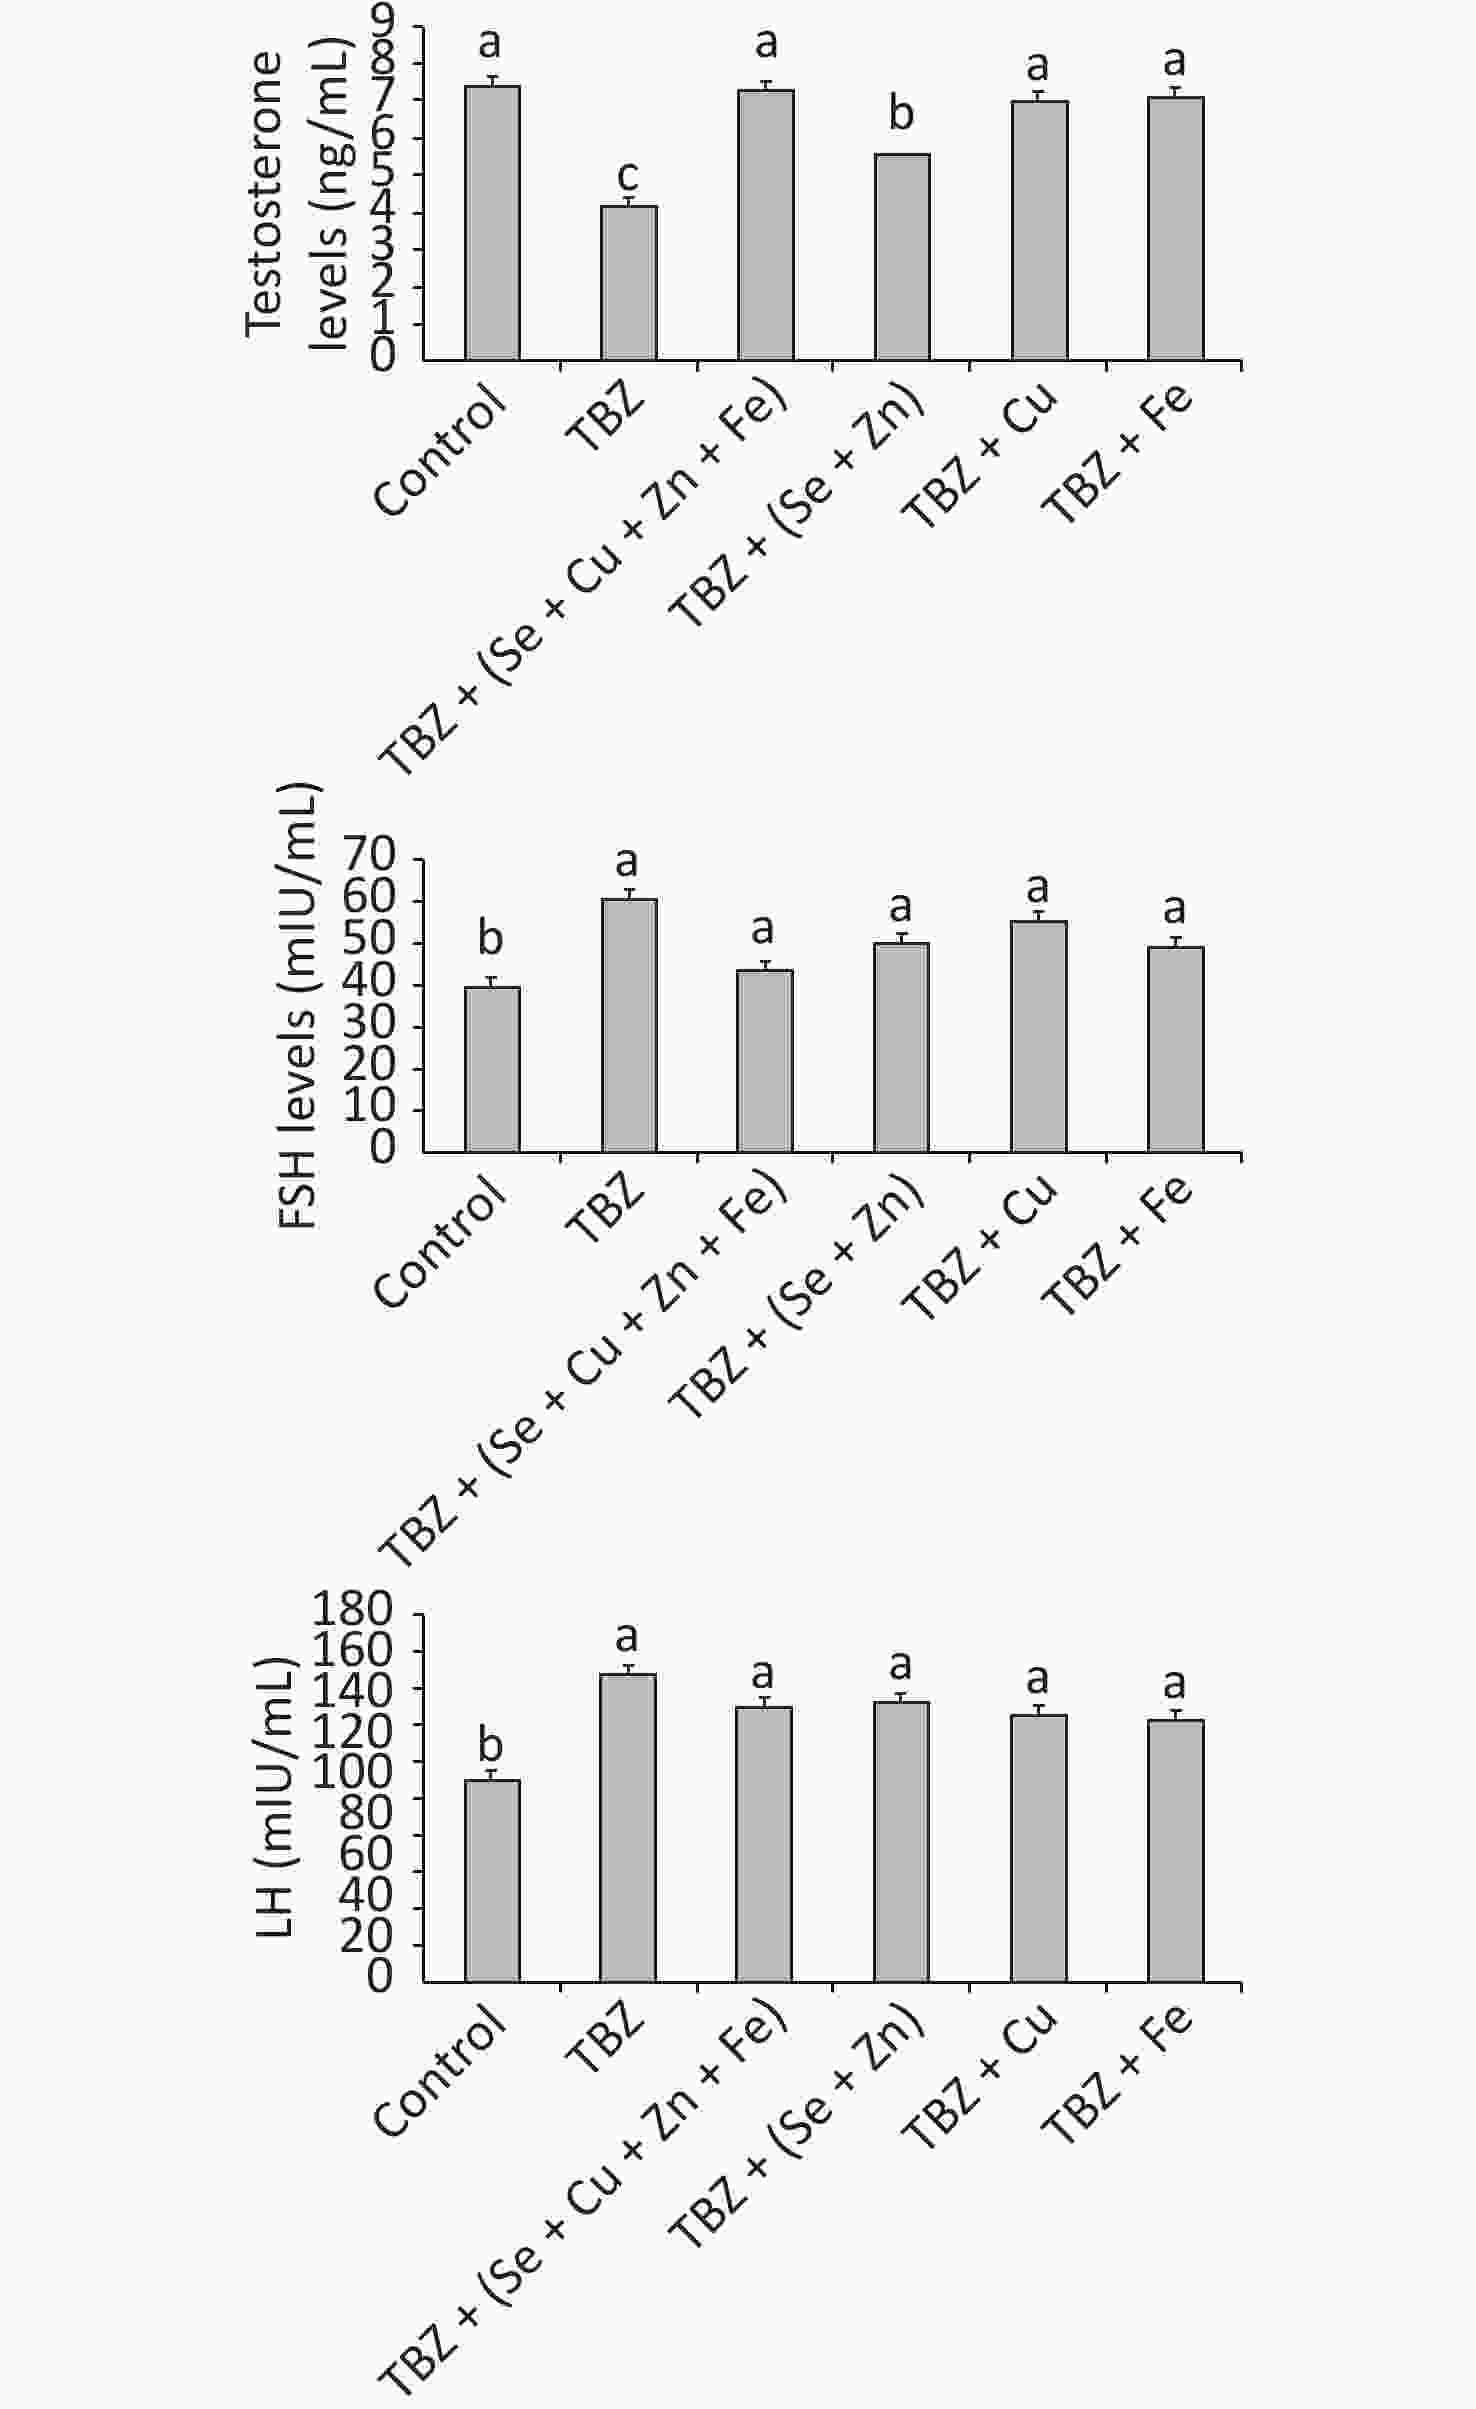
Figure 1. Testosterone, FSH, and LH levels in the plasma of TBZ, TBZ + (Se + Fe + Zn + Cu), TBZ + (Se + Zn), TBZ+ Cu, or TBZ + Fe during 30 d of treatment.
Post hoc comparisons showed that the changes in testosterone levels observed in the plasma of TBZ-treated rats were markedly abrogated by trace elements treatment without reaching the control values (P < 0.05). No significant differences were observed between the trace elements and TBZ-treated group in terms of LH and FSH levels.
-
The oxidative stress induced by TBZ was tested initially in the rat models by measuring the MDA and AOPP levels in the testis tissue injected with TBZ (Table 4). Statistical analysis showed an increase in MDA and AOPP levels by TBZ treatment compared with the vehicle group (P < 0.001) (Table 4).
Parameters Groups Control TBZ TBZ + (Se + Fe + Cu + Zn) TBZ + (Se + Zn) TBZ + Cu TBZ + Fe MDA 89.43 ± 7.39a 129.35 ± 6.89e 91.49 ± 8.71ab 96.98 ± 7.88c 99.78 ± 8.27d 92.83 ± 9.19b AOPP 0.53 ± 0.03a 0.84 ± 0.02c 0.58 ± 0.03a 0.70 ± 0.02b 0.82 ± 0.16c 0.67 ± 0.19b GSH 292.65 ± 43.7a 477.2 ± 98.14f 320.57 ± 26.6c 367.6 ± 24.2d 312.49 ± 14.31b 384.32 ± 10.22e GPX 6.94 ± 0.75b 3.96 ± 0.62a 5.50 ± 0.41ab 5.15 ± 0.69ab 5.76 ± 0.78ab 5.23 ± 1.23ab SOD 92.44 ± 5.87d 53.29 ± 6.04a 72.42 ± 6.24c 70.24 ± 8.38c 66.29 ± 6.43b 64.33 ± 7.11b Note. Values are expressed as means ± SD for 6 animals in each group.
Different superscript letters (a,b,c,d,e) indicate significant differences at P < 0.05.
MDA: nmol of MDA/g tissue.
AOPP: μmol/mg protein.
GSH: μg/g tissue.
GPX: nmol of GSH/min/mg of Protein.
SOD: μmol/mg of protein.Table 4. Levels of MDA, GSH and activities of SOD, and GPx in the testes of controls and rats treated with TBZ (100 mg/kg) and TBZ + (Cu + Zn + Fe + Se), TBZ + (Se + Zn), TBZ + Cu, or TBZ + Fe in the testes during 30 d
Post hoc comparisons demonstrated a difference between TBZ- and trace elements-treated rats (P < 0.001). Se, Fe, and Zn addition restored the MDA and AOPP concentrations compared with the TBZ-injected rats (P < 0.001). However, Cu addition caused no effect on the AOPP levels compared with TBZ treatment.
-
Two-way ANOVA test showed that injection of 100 mg/kg b.w. TBZ caused a decrease in GPx and SOD activities and an increase in GSH level compared with the untreated group (P < 0.001) (Table 4).
Post hoc comparison demonstrated that trace element administration protected against antioxidant status changes by reversing the increase in SOD and GPx activities and decrease in GSH level compared with the TBZ-treated rats.
-
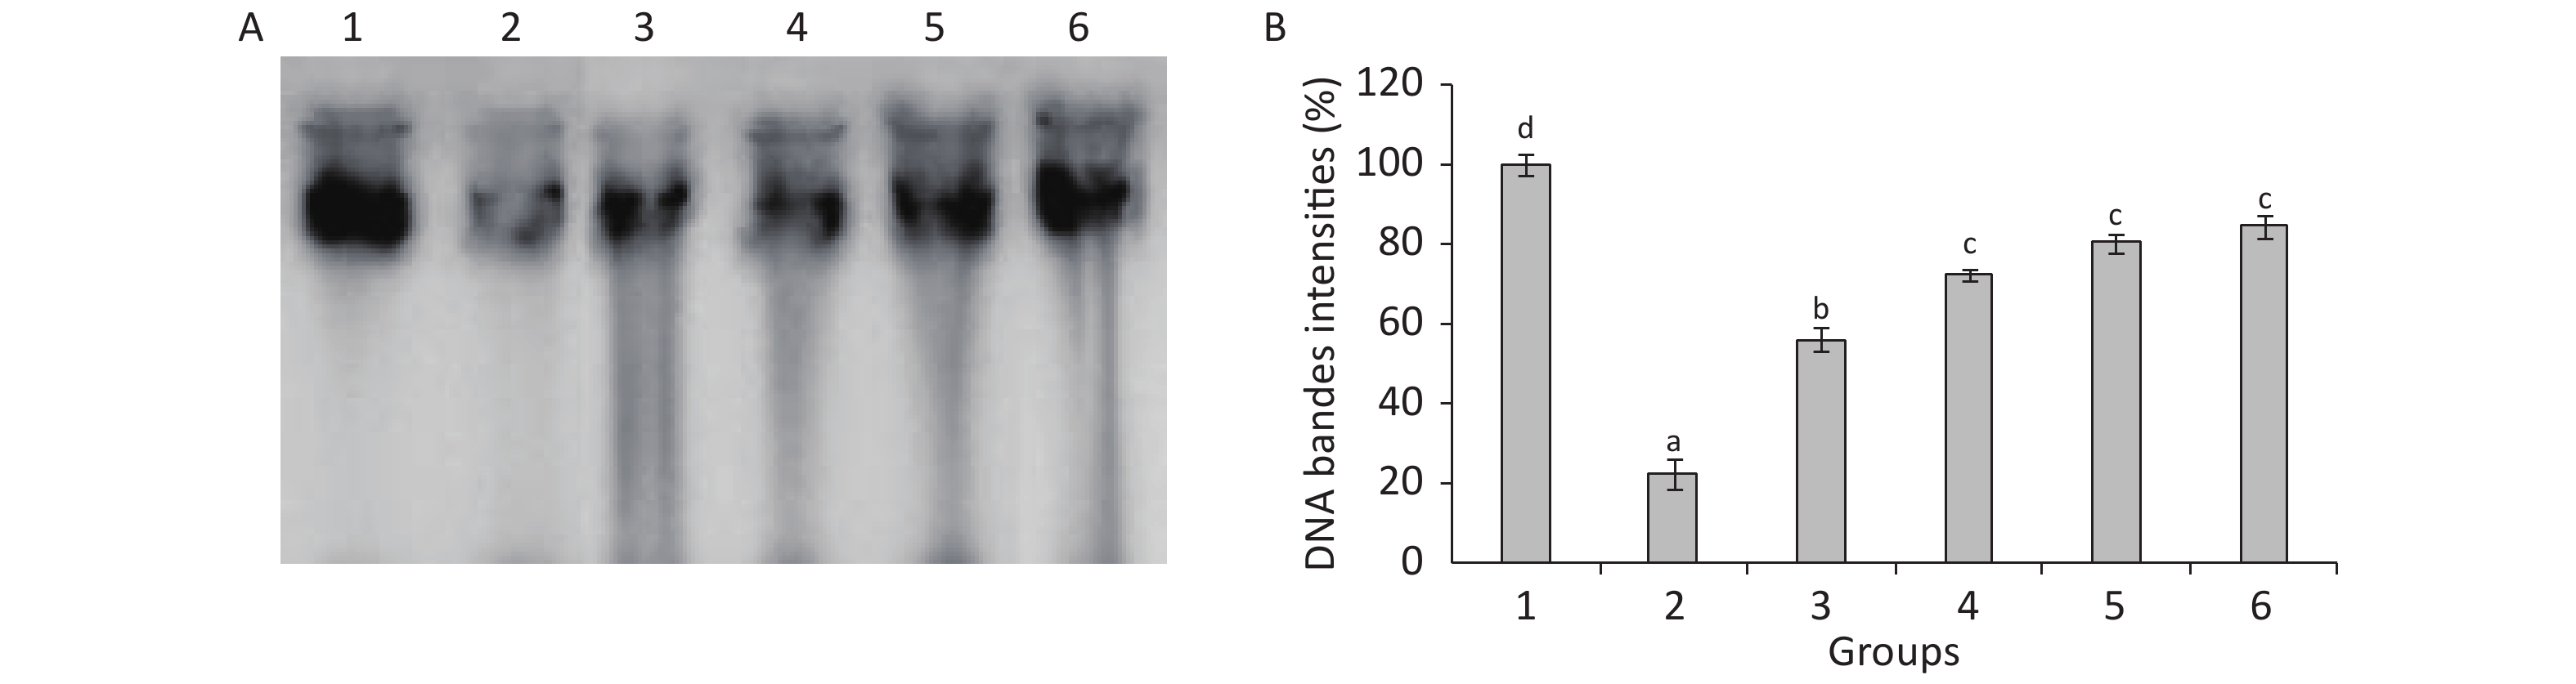
The statistical analysis results presented in Figure 2 show the decrease in DNA contents in the testes of TBZ-treated rats compared with the control animals. Meanwhile, Se, Cu, Zn, and Fe administration showed an increase in DNA contents and reached normal values compared with the TBZ-treated group (Figure 2).
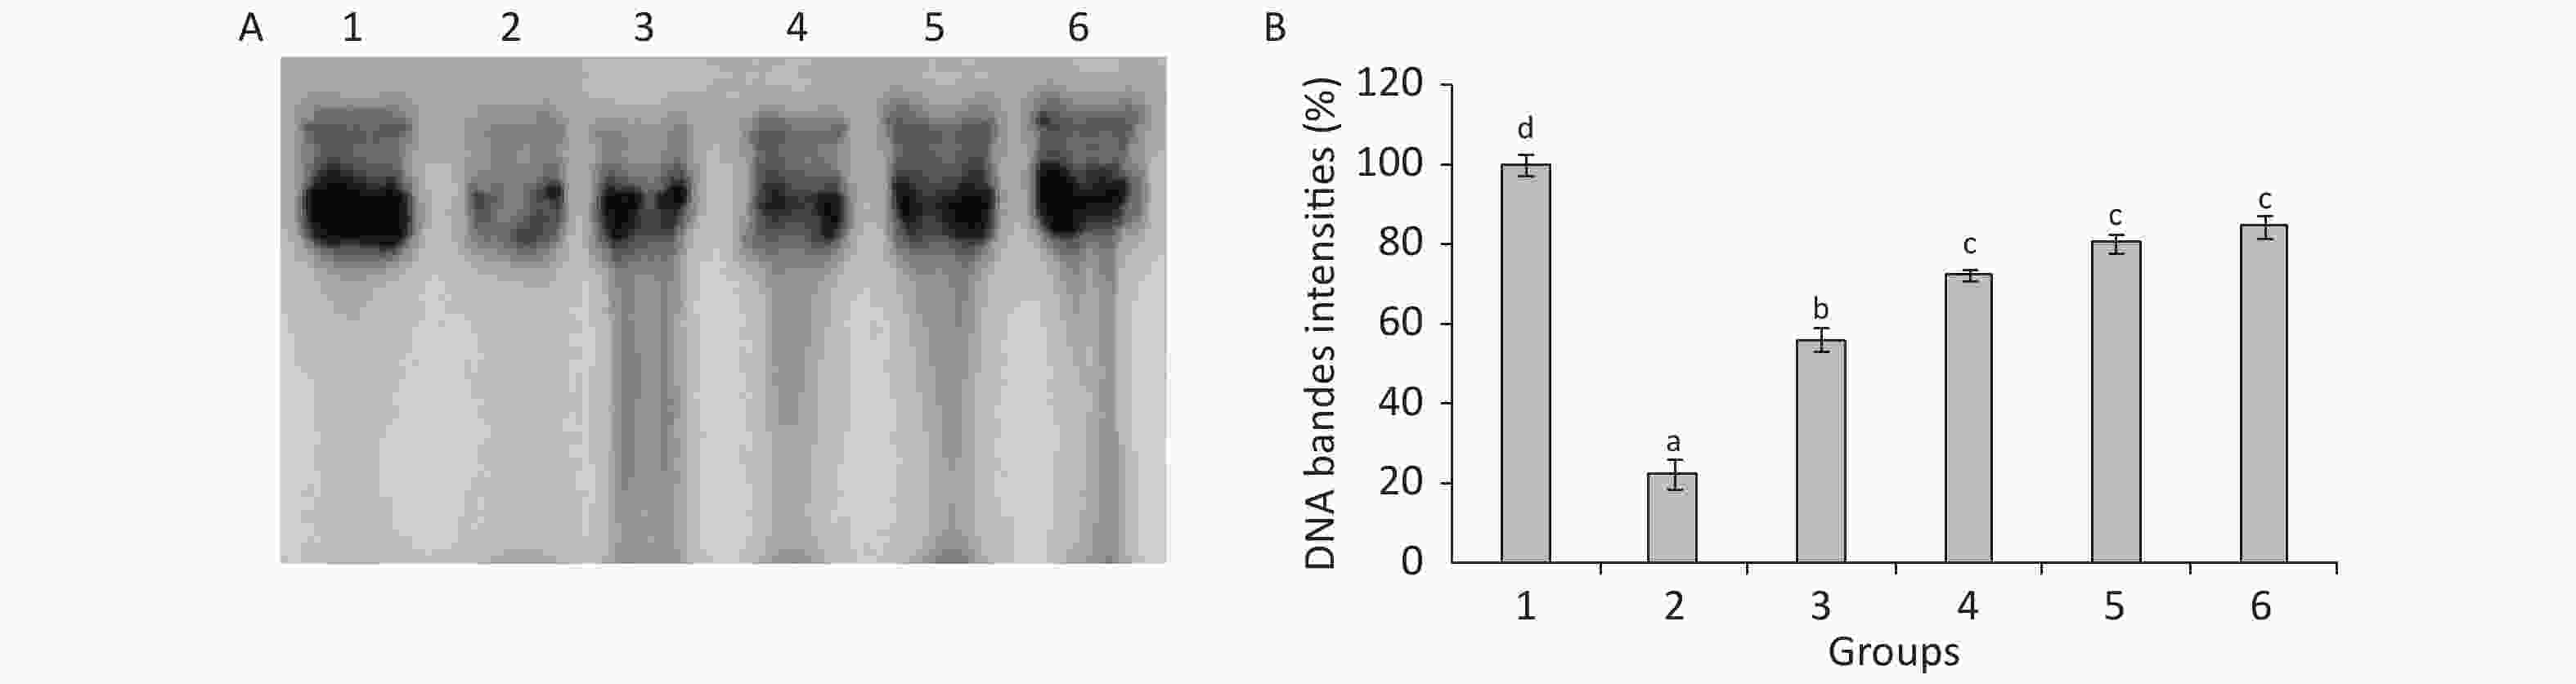
Figure 2. (A): Agarose gel electrophoresis of DNA fragmentation. Lane 1: control group, lane 2: TBZ-treated group, lane 3: TBZ + (Cu + Zn + Fe + Se)-treated group, lane 4: TBZ + (Se + Zn), lane 5: TBZ + Cu, lane 6: TBZ + Fe. (B): testicle DNA quantity.
Agarose gel electrophoresis demonstrated an undetectable DNA scale in the testes of control rats. The DNA intact band was condensed near the application point with no DNA smearing, suggesting that no DNA fragmentation occurred in the control group, whereas a smear without ladder formation on agarose gel was observed in the TBZ-treated rats. The supplementation of trace elements associated to TBZ resulted in the absence of DNA smearing (Figure 2).
-
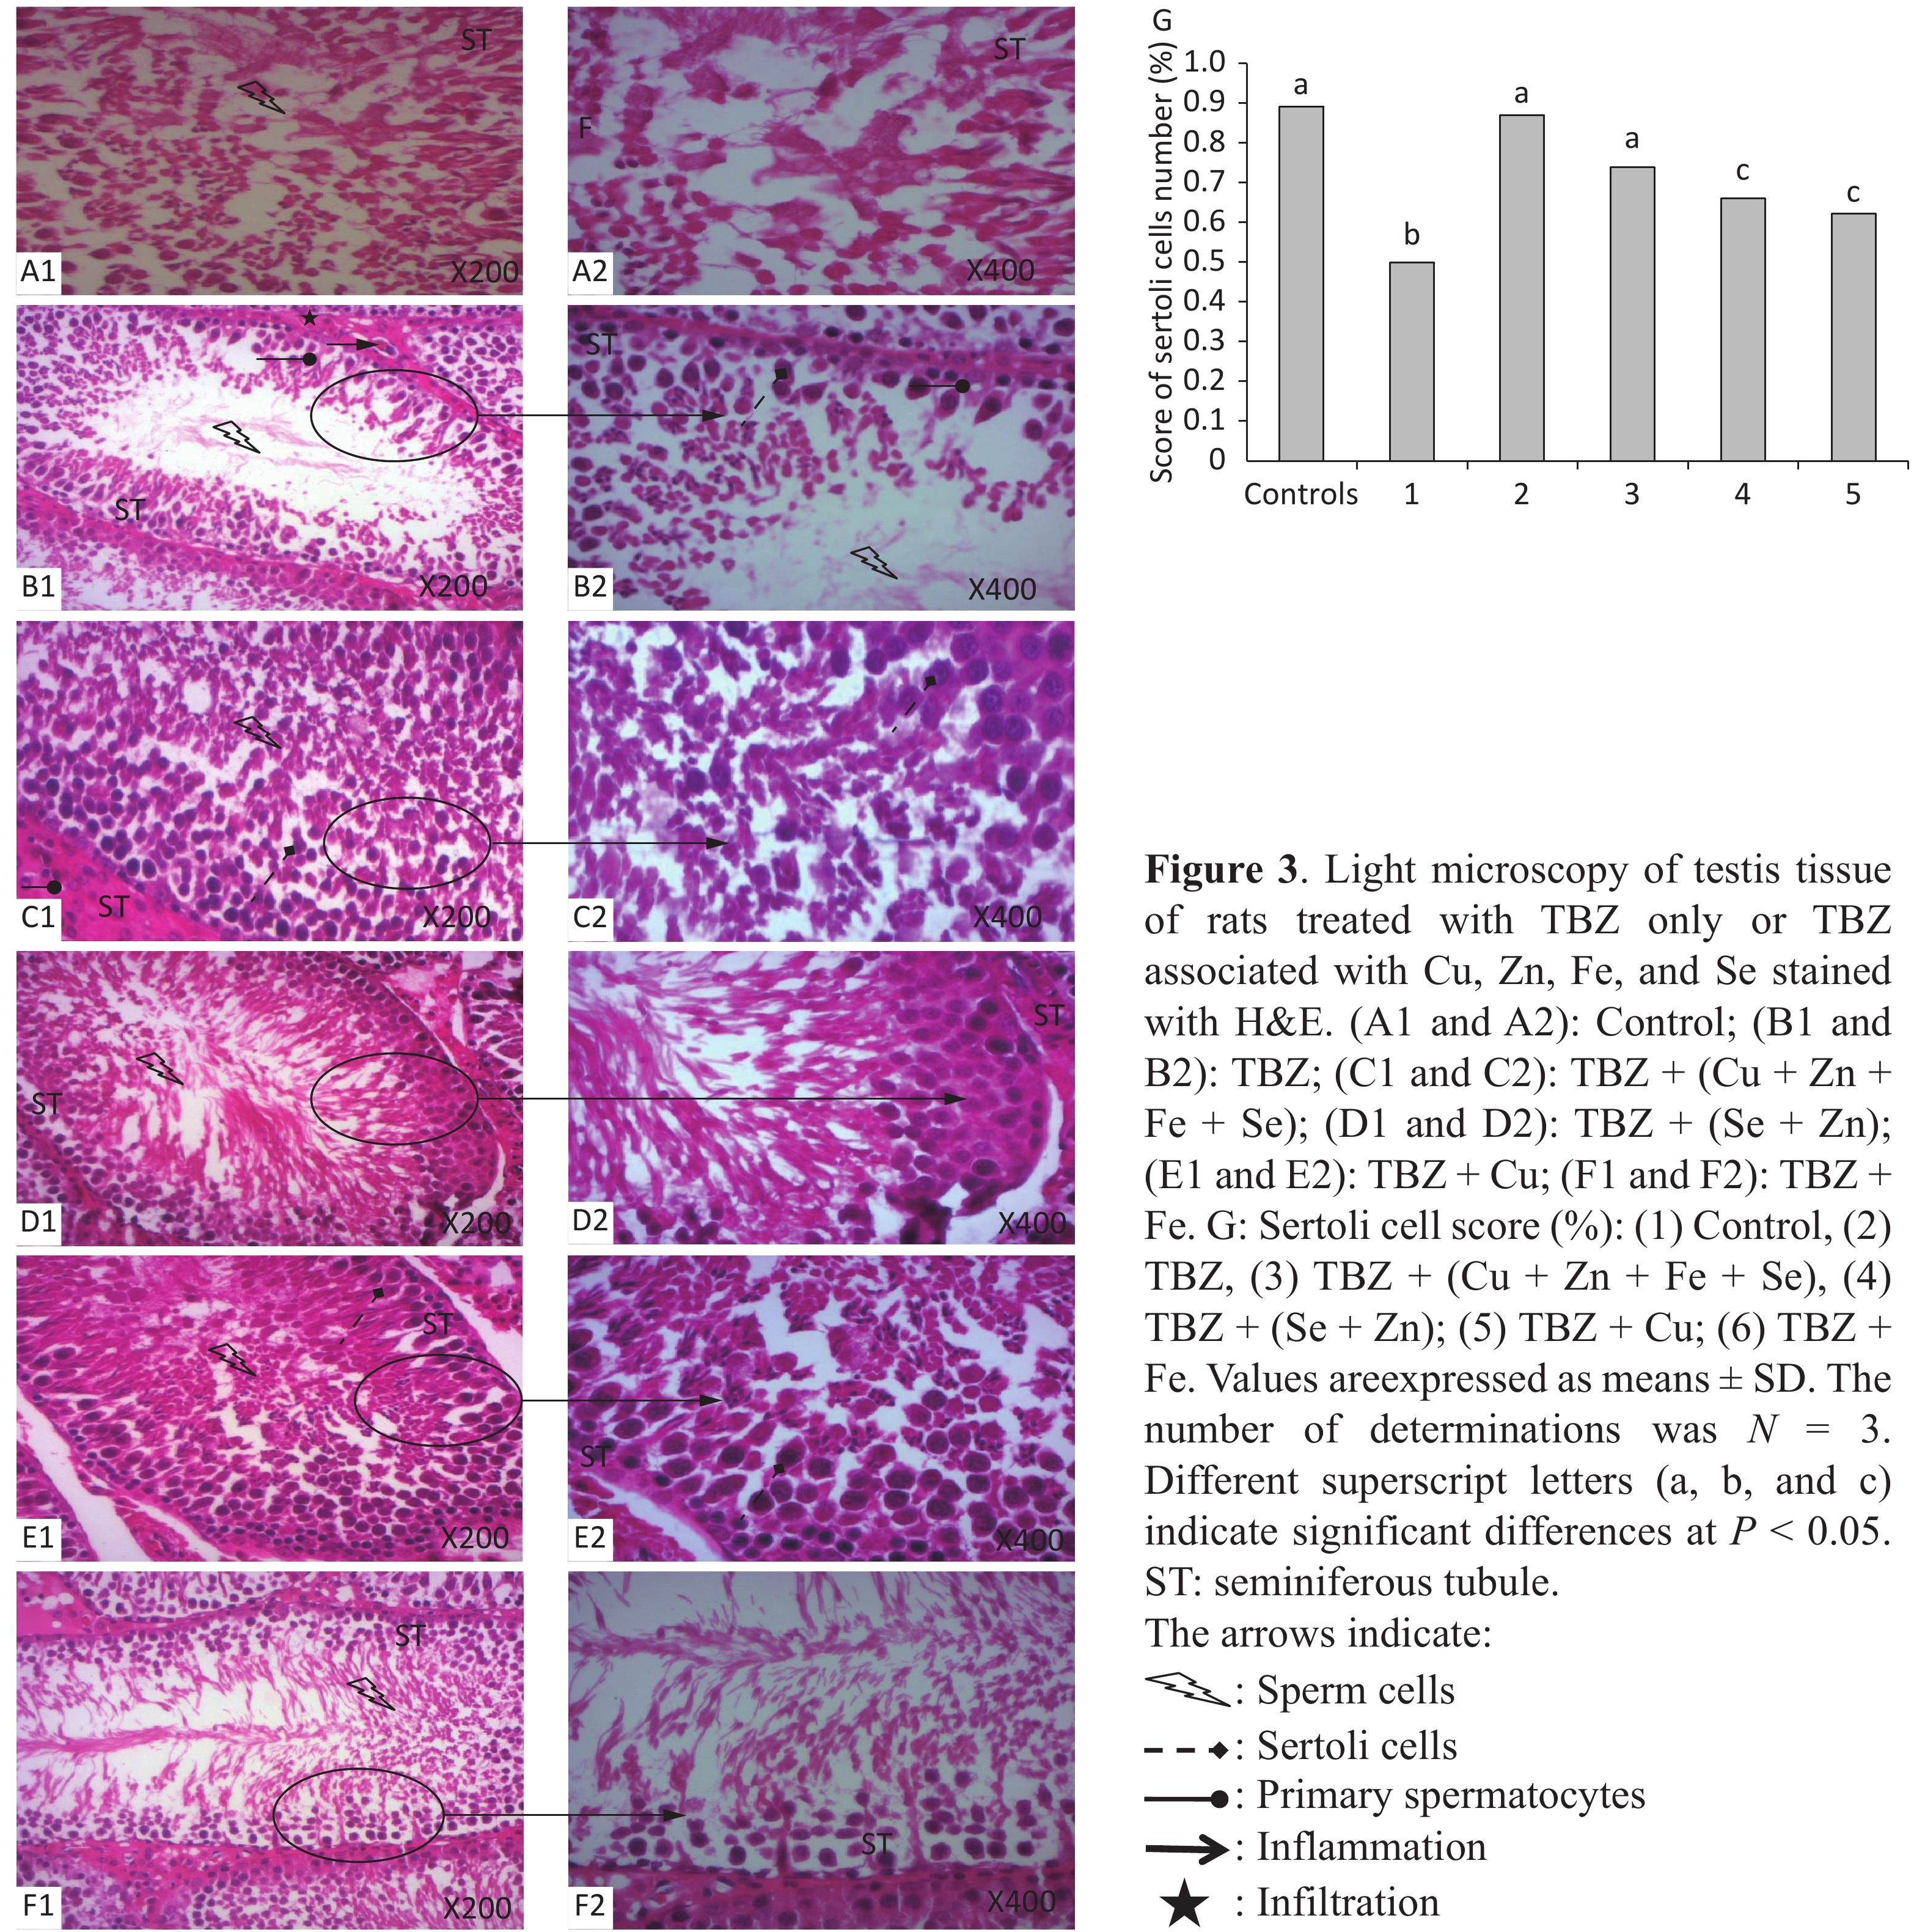
Figure 3 displays the representative histopathological sections of the testes. H&E-stained testis sections of control rats showed an intact and smooth structure, indicating the normal morphology and organization of seminiferous tubule with all successive stages of spermatogenesis, lumen filled with spermatozoa, and presence of Sertoli cells (Figure 3A). On the contrary, the testes of rats treated with TBZ showed degenerated germinal epithelium and lumen with less sperms. Further, decreases in tubular diameter, numbers of spermatocytes, Leydig and Sertoli cells, and increase of intertubular space and lumen with cellular debris were observed in the testes of TBZ-treated rats. In the same manner, inflammatory infiltration was observed in the interstitium of the group that received TBZ (Figure 3B). These modifications were inhibited by Se, Fe, Zn, and Cu co-administration, resulting in highly regular seminiferous tubules showing spermatogenesis at the level of spermatocytes with normal interstitial tissue (Figures 3C, 3D, 3E, and 3F).
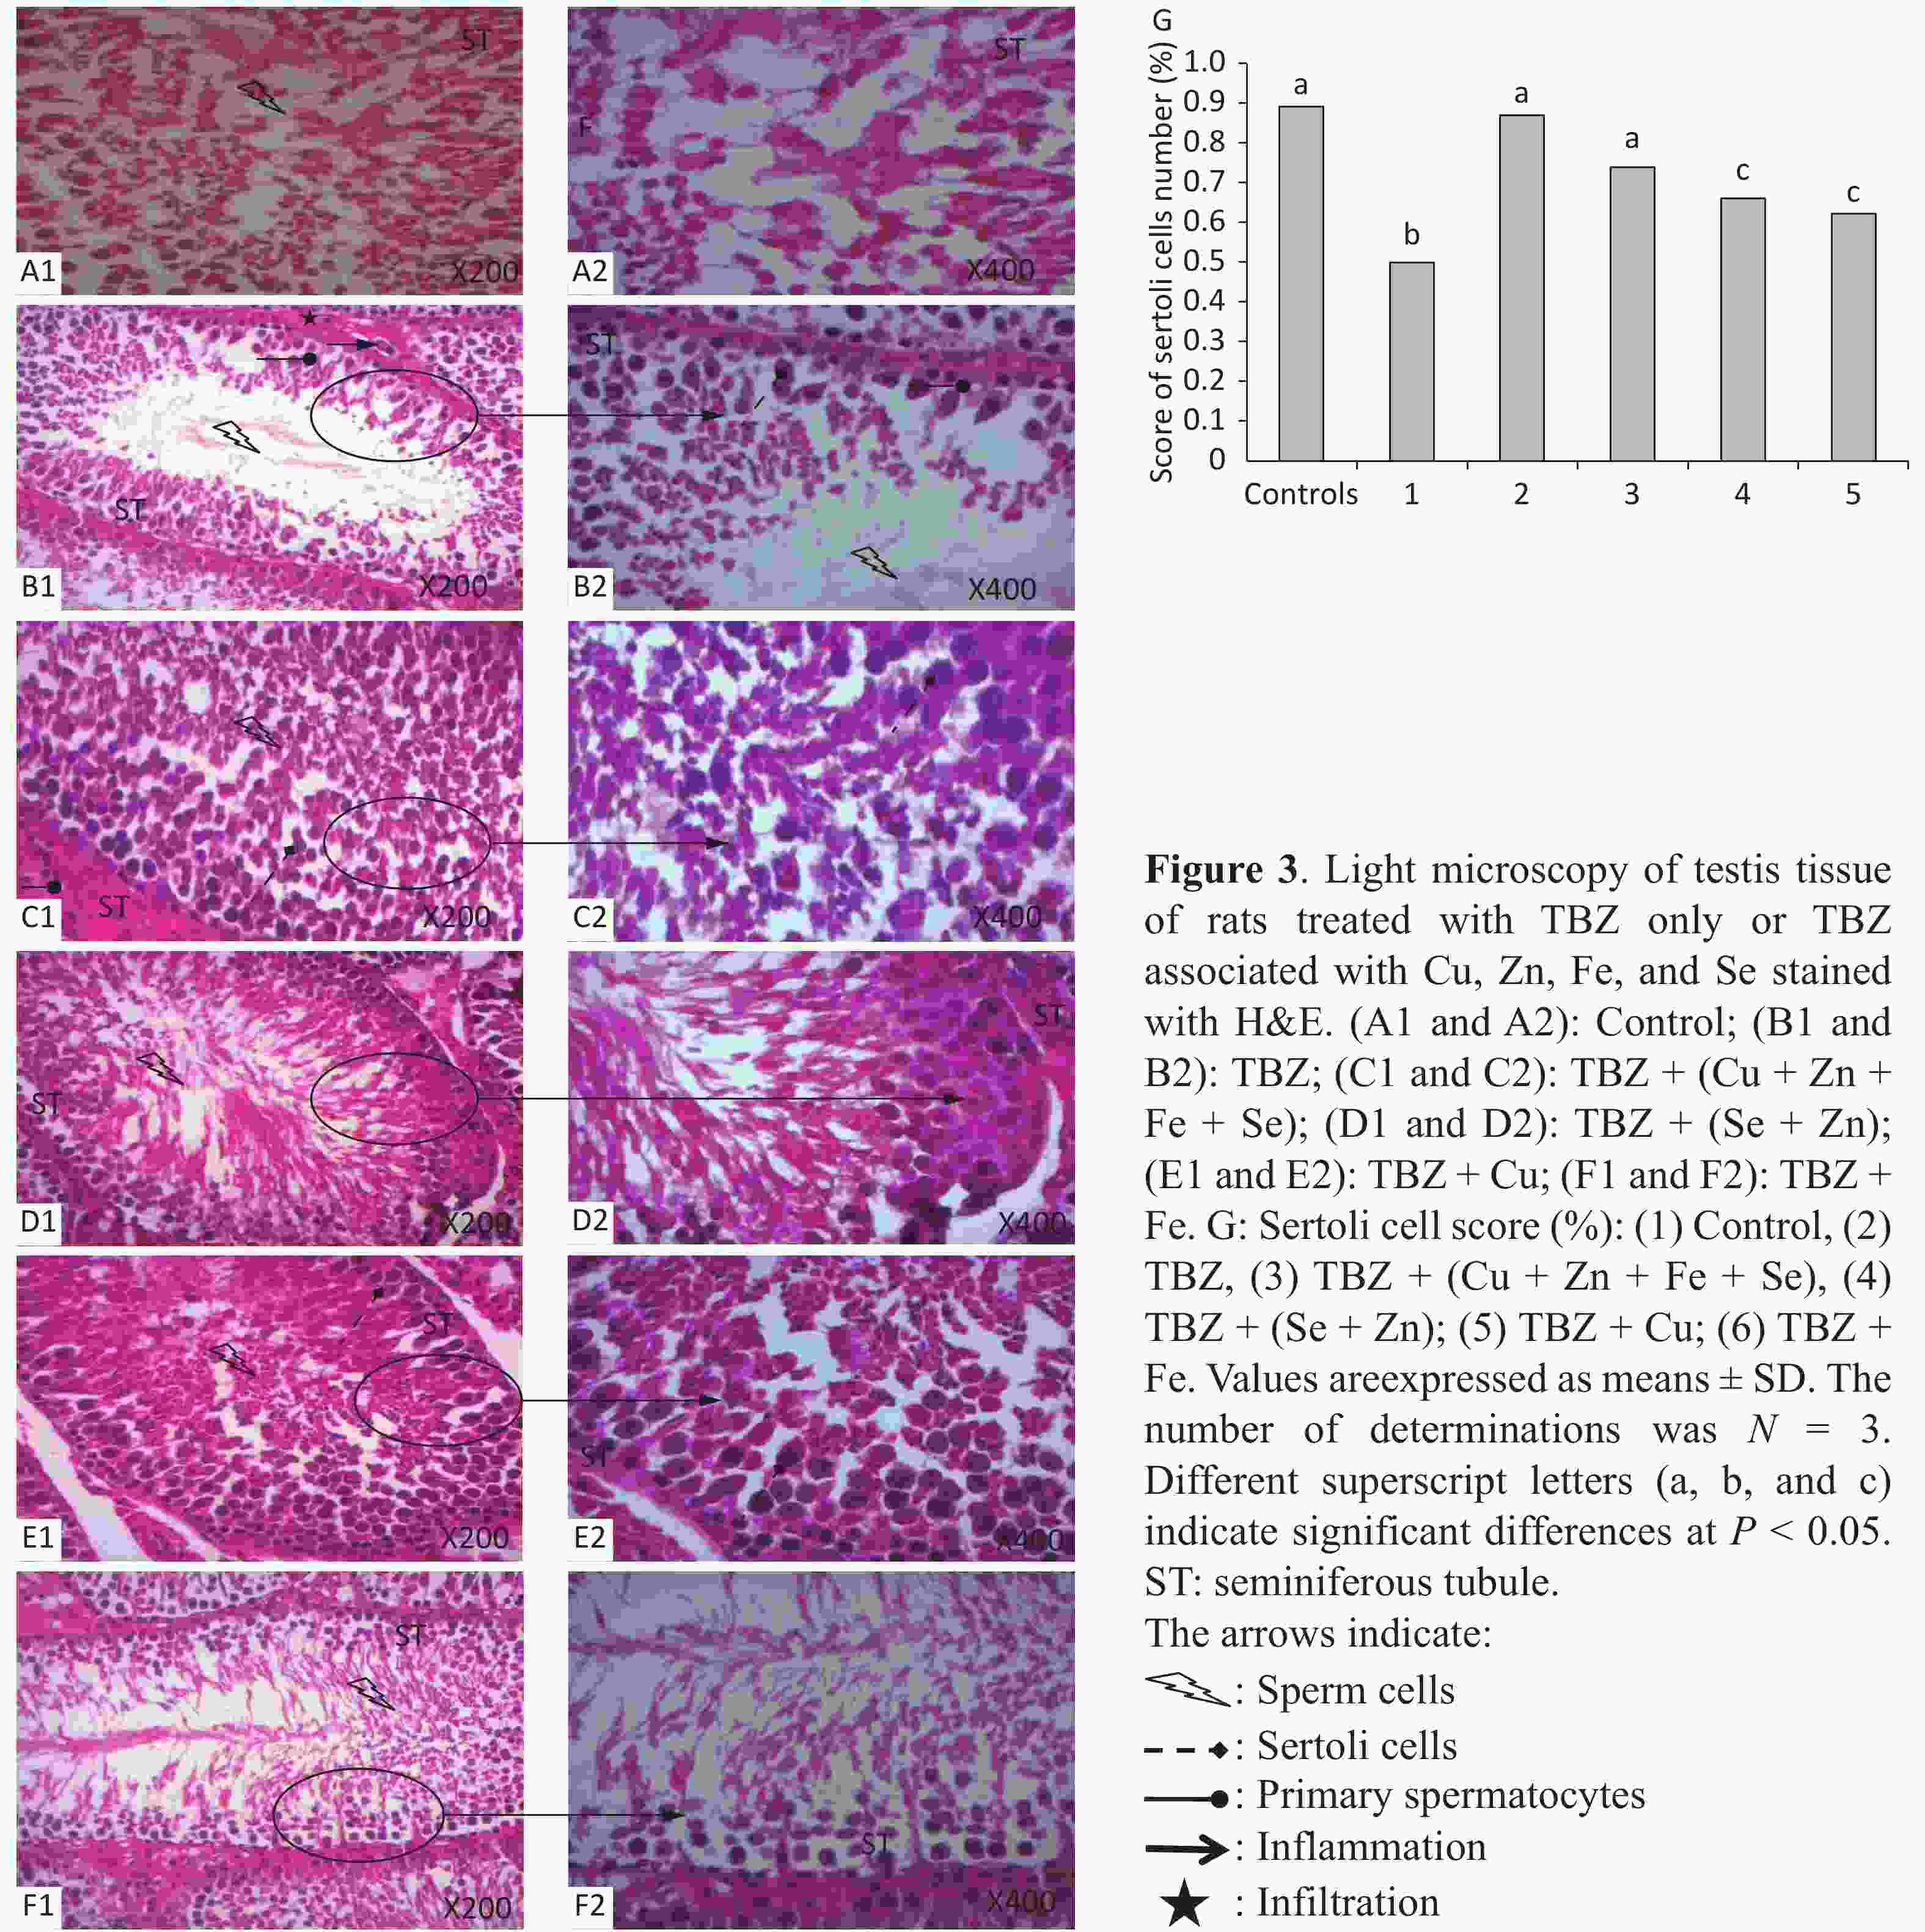
The co-administration of all trace elements, provoked a marked improvement in the testicular structure, especially in the (Zn + Se) + TBZ-treated group (Figures 3C and 3E).
-
Studies concerning the effect of TBZ on the reproductive organs and fertility of male rats are limited. Hence, this research was conducted to evaluate the effect of TBZ on male reproductive function and to assess the ameliorative effects of the combination of Se, Cu, Fe, and Zn.
Our results indicate that the b.w. of TBZ-exposed rats significantly decreased after four weeks of treatment. This effect was associated to diminished food and water intake. Weight loss can occur due to the direct cytotoxic effect of pesticides[32]. Organ weight is a fundamental benchmark for toxicological studies. The administration of TBZ caused a significant reduction in testis weight. These results agree with the findings of Anderson et al.[48] and El-Sharkawy et al.[49], who showed the reduction of testicular weight of rats treated by Deltamethrin and penconazole, respectively. Se, Cu, Zn, and Fe could effectively inhibit the loss of b.w. compared with the TBZ group. The action of TBZ may be mediated by alterations in Zn, Cu, Fe, and Se metabolisms. Messaoudi et al.[9] demonstrated that supplementation of dietary trace elements resulted in enhanced growth performance and economic benefits in the animal feed industries. The testis weights are principally dependent on the mass of differentiated spermatogenic cells, tubule size, the number of germ cells, spermatogenic processes, and synthesis of steroid by Leydig cells[50,51]. Our study revealed that rats treated with TBZ had markedly impaired sperm quality. Other pesticides, such malathion and diazinon, significantly lower sperm count, motility, and viability and increase sperm abnormalities[52]. The histological observation of the diameters of germinal cells and spermatozoa has shown a significant reduction after TBZ treatment. Our results also showed a decrease in the germinal cell number and an inflammation of spermatogonia and Sertoli cells. The inflammation may be due to the smooth endoplasmic reticulum dilatation[53]. The reduction in spermatozoa number is a result of the inhibition of spermatocyte division and the suppressive role of TBZ in spermatogenesis. Similar results were noted in other studies after treatment with low doses of pesticides[54]. The harmful effect of TBZ on spermatogenesis could be ascribed to either the changes in plasma testosterone, LH, and FSH levels[55] or TBZ-induced LPO. Testosterone maintains the function and structure of sex glands. Moreover, a decrease in testosterone disrupts spermatogenesis[56]. TBZ treatment caused a significant reduction in plasma testosterone levels. In the same way, we have demonstrated that TBZ induced a significant increase in the LH and FSH amounts. FSH has important effects on Sertoli cells. Inhibin and various factors synthesized by Sertoli cells cause the increase in circulating FSH levels by pituitary feedback. TBZ causes changes in reproductive functions by altering the synthesis and secretion of hormones[20].
LPO is an essential marker of oxidative damages. Sperm is extremely sensitive to LPO due to structural disturbances, loss of membrane fluidity, abundance of unsaturated fatty acids, and low activities of antioxidants[57]. TBZ-treated rats demonstrated an increase in MDA concentration in the testicular tissue, indicative of ROS overproduction. Co-administration of Cu, Zn, Fe, and Se effectively decreased the MDA and AOPP levels in the testes by protecting critical proteins and lipids from oxidation. This condition could be explained by the induced increase in lipid levels of the cell membrane through the addition of trace elements, especially Fe, which aided in the regulation of the structure of membrane lipids and proteins. When produced in excess, ROS cause tissue injury, including protein oxidation and DNA damage[31]. The reduction of DNA damage in the groups co-treated with trace elements is an interesting and important result because it reinforces the minerals’ capability to protect the integrity of DNA, as shown in recent studies[58,59]. This result is justified by two possible explanations: First, these elements may have acted as a shield and/or repaired the DNA damage caused by TBZ. Second, the association of minerals and toxin may have potentiated the cellular damage, thus aggressively triggering the super activation of the DNA repair response. Se and Zn are pivotal elements that play a key role in many bodily processes, including building of DNA and RNA, cell metabolism, and immune system regulation[30].
TBZ-induced escalation of LPO in testis might be a consequence of the reduction in antioxidant defenses[30]. In comparison with other tissues, the testis contains important levels of glutathione, which plays an important role in the proliferation and differentiation of spermatogenic cells by protecting these cells from ROS damage[60]. Immune cells require an adequate supply of trace elements to preserve their structure and to protect them against ROS[61]. In the present investigation, GSH was consumed for detoxification of TBZ-induced toxicity. GPx and SOD activities were also reduced by TBZ treatment. Se, Zn, Cu, and Fe are part of antioxidant enzymes[62]. Se is essential in GSH/Px activities[62], which are involved in organ antioxidant defences. Se plays an important role in the catalytic activities of major antioxidant enzymes. Cu and Zn are an integral part of Cu–Zn SOD[63]. Co-treatment with trace elements, particularly Se and Zn, reduced the GSH levels, GPx, and SOD activities.
The reproductive problems and antioxidant alterations caused by TBZ can be due to mineral deficiency[63]. Environmental factors show great influence on the mineral composition in animals[30,64]. The mineral elements in our experimental rats were estimated by atomic absorption spectrophotometry. Sodium, potassium, calcium, and phosphorus serve separately or jointly in body fluids. Under stress conditions, a decrease in sodium concentration may be compensated by an increase in potassium. The major losses of sodium lead to a significant lowering of osmotic pressure, loss of water, and dehydration. The symptoms of magnesium deficiency in the testis resemble those of low calcium contents. Deficiencies in trace elements, such as copper, magnesium, and zinc, have been implicated in reproductive events, including congenital anomalies, infertility, and pregnancy wastage[11]. The addition of Cu, Zn, Fe, and Se could maintain the concentration of all minerals in the testis and blood. Several possible mechanisms encompass the protective actions of these trace elements against TBZ toxicity: they may directly act on the testis by ameliorating the antioxidant statute; they may protect the pituitary, maintain hormone contents, and subsequently stimulate spermatogenesis.
-
This study demonstrated the toxicity of TBZ in the structure and functions of rat reproductive organs, suggesting an oxidative stress state, and the ameliorative effects of zinc, copper, selenium, and iron. Our findings emphasize the necessity of trace elements for male reproductive health. However, their supplementation should be delicately controlled given the negative effects of these elements when present at high concentrations.
-
The present work was supported by grants from Direction Générale de la Recherche Scientifque et Technique-Tunisie. Laboratory of Enzyme Engineering and Microbiology, National Engineering School in Sfax, University of Sfax, Tunisia.
-
The authors declare no conflicts of interest.
Funds:
This work was supported by the laboratory of Enzyme Engineering and Microbiology, National Engineering School in Sfax, University of Sfax, Tunisia

 Quick Links
 DownLoad: