


-
Currently, obesity has become a main public health concern. Obesity is characterized by excessive lipid accumulation[1] and is associated with non-alcohol fatty liver disease.
Hepatocyte steatosis models in vitro have advantages, including controllable influencing factors, short experimental times and favorable homogenization. A study by Luo compared different cell models of lipid accumulation, such as L02 hepatocytes, HepG2 cells, 3T3-L1 cells and BRL cells, and found that the changes in total cholesterol and triglyceride vary among models[2] . Therefore, further optimization of hepatocyte steatosis models is needed. L02 hepatocytes are immortalized normal liver cells that are commonly used in hepatocyte steatosis models[2].
IL-6 has been confirmed to play roles in obesity-related chronic inflammation[1]. However, the effects of IL-6 on lipogenesis vary by the IL-6 dosage, animal model or cell type[1]. Carey's study has shown that IL-6 increases fatty acid oxidation in muscle cells by activating adenosine 5'-monophosphate (AMP)-activated protein kinase[1,3]. In the preadipocyte cell lines 3T3-F442A and 3T3-L1, long-term (8 day) treatment with IL-6 decreases insulin-induced lipogenesis and glucose transport[1,4]. However, IL-6 is high in adipose tissues. IL-6, instead of tumor necrosis factor-alpha (TNF-α), induces lipogenesis in rat hepatocyte primary culture[5]. In the L02 hepatocyte steatosis model, IL-6 expression is significantly elevated, and its downstream signaling molecules are widely activated[6].
This study sought to examine the dose and time dependence of IL-6/lipid accumulation on sodium oleate, to elucidate the relationship between IL-6 and lipid accumulation.
L02 hepatocytes were purchased from the Cell Bank of the Chinese Academy of Sciences. Kits detecting free fatty acids (FFAs) and ELISA kits detecting IL-6 were purchased from Abcam (Cambridge, MA, USA). The medium, fetal bovine serum, trypsin, boron-dipyrromethene (BODIPY) 493/503 (green), penicillin/streptomycin, EVOSTM M7000 Imaging System and CO2 incubator were purchased from Thermo Fisher (Waltham, MA, USA). The Oil Red O staining kit was purchased from Solarbio® (Beijing, China).
Different concentrations of L02 hepatocytes (1 × 10⁶/mL, 5 × 10⁵/mL, 2.5 × 10⁵/mL, 1 × 10⁵/mL, 5 × 10⁴/mL, or 2.5 × 10⁴/mL) were seeded on 96-well plates. Cell viability was detected on the first, second, third and fourth days with the CCK-8 method at OD 450 nm using a microplate reader (Molecular Devices, LLC., San Jose, CA, USA).
Sodium oleate was dissolved to 3 × 10⁵ μmol/L in incomplete medium containing 10% bovine serum albumin in a 70 ℃ water bath. A 3 × 10⁴ μmol/L concentration of sodium oleate in complete medium was generated through 10-fold dilution, 1,200 μmol/L sodium oleate in complete medium was generated through 25-fold dilution, 600 μmol/L sodium oleate was generated in complete medium through 2-fold dilution, 300 μmol/L sodium oleate was generated in complete medium through 2-fold dilution, and so on.
Different concentrations of sodium oleate (0, 37.5, 75, 150, 300, 600, and 1,200 μmol/L) were incubated with 1 × 10⁵/mL L02 hepatocytes for 24 h. Cell viability was detected and IL-6 levels were detected in the supernatant.
In Zhang’s study, oleic acid at ≤ 0.5 mmol/L, did not significantly inhibit HepG2 cell growth and was used in the experiment[7]. In Wang’s study, the fasting serum FFA concentration was (567.2 ± 180.1) μmol/L in the hypertensive obesity group, (471.1 ± 233.5) μmol/L in the normal blood pressure obese group and (455.5 ± 190.4) μmol/L in the normal blood pressure non-obese group[8]. In combination with this study, 75, 150, and 300 μmol/L sodium oleate was chosen.
Chankeaw’s study reported a significant increase in the lipid accumulation ratio for all doses of OA at 2 h[9]. In Zhang’s study, the lipid accumulation model was induced by oleic acid for 24 h[7]. Incubation times of 0, 0.5, 1, 1.5, 2, 4, 6, 8, 10, 12, 16, 20, 22, and 24 h were chosen.
Sodium oleate (0, 75, 150, or 300 μmol/L) was added to L02 hepatocytes in complete culture medium for 0, 0.5, 1, 1.5, 2, 4, 6, 8, 10, 12, 16, 20, 22, or 24 h. Cell viability was detected, FFA and IL-6 levels were detected in the supernatant. Lipid droplets in L02 hepatocytes were labeled by BODIPY 493/503 (green). The images were obtained with an EVOSTM M7000 Imaging System, and the influence intensity area with lipid accumulation was obtained using ImageJ software (NIH, USA). Oil Red O staining was performed according to the manufacturer’s instructions.
FFAs were detected according to the manufacturer’s instructions (Abcam, Cambridge, MA, USA): the standard was prepared as described in Supplementary Table S1 (available in www.besjournal.com). Standards and samples were added to reaction wells; 2 μL ACS reagent was added into all sample or standard wells; and the reactions were mixed and incubated at 37 ℃ for 30 min. Reaction mix was prepared as described in Supplementary Table S2 (available in www.besjournal.com). A volume of 50 μL of reaction mix was added to all wells and incubated at 37 ℃ for 30 min in the dark. The absorbance was measure immediately with a microplate reader at OD 570 nm.
Standard number Standard volume (μL) Assay buffer (μL) FFA concentration (μmol/L) 1 0 150 0 2 6 144 40 3 12 138 80 4 18 132 120 5 24 126 160 6 30 120 200 Note. Cited by [Abcam/Cardiovascular/Lipids/Lipoprotein>Fatty Acids>Synthesis. Available on line: https://www.abcam.com/ab65341 (accessed on 20 February, 2021)]Table S1. FFA standard configuration
Component Reaction mix (μL) Assay Buffer 44 Fatty Acid Probe 2 Enzyme Mix 2 Enhancer 2 Note. Cited by [Abcam/Cardiovascular/Lipids/Lipoprotein>Fatty Acids>Synthesis. Available on line: https://www.abcam.com/ab65341 (accessed on 20 February, 2021)]Table S2. Reaction mix configuration
Data are shown as the mean ± standard deviation. Normality and homogeneity were analyzed. A P-value < 0.05 indicated statistical significance. One-way ANOVA in SPSS 25.0 (SPSS Inc., Chicago, IL, USA) was used to determine the statistical differences, and Dunnett or LSD tests were used for further comparisons in each group. If the data were not normally distributed or homogeneous, they were transformed into other variables with normal distributions and homogeneity. Transformed data were used for analysis; when the transformed data were not normally distributed or homogeneous, other statistical methods were used for analysis, such as Brown-Forsythe or Welch tests. The graphs were drawn in GraphPad prism 8 (GraphPad Software, San Diego, CA, USA).
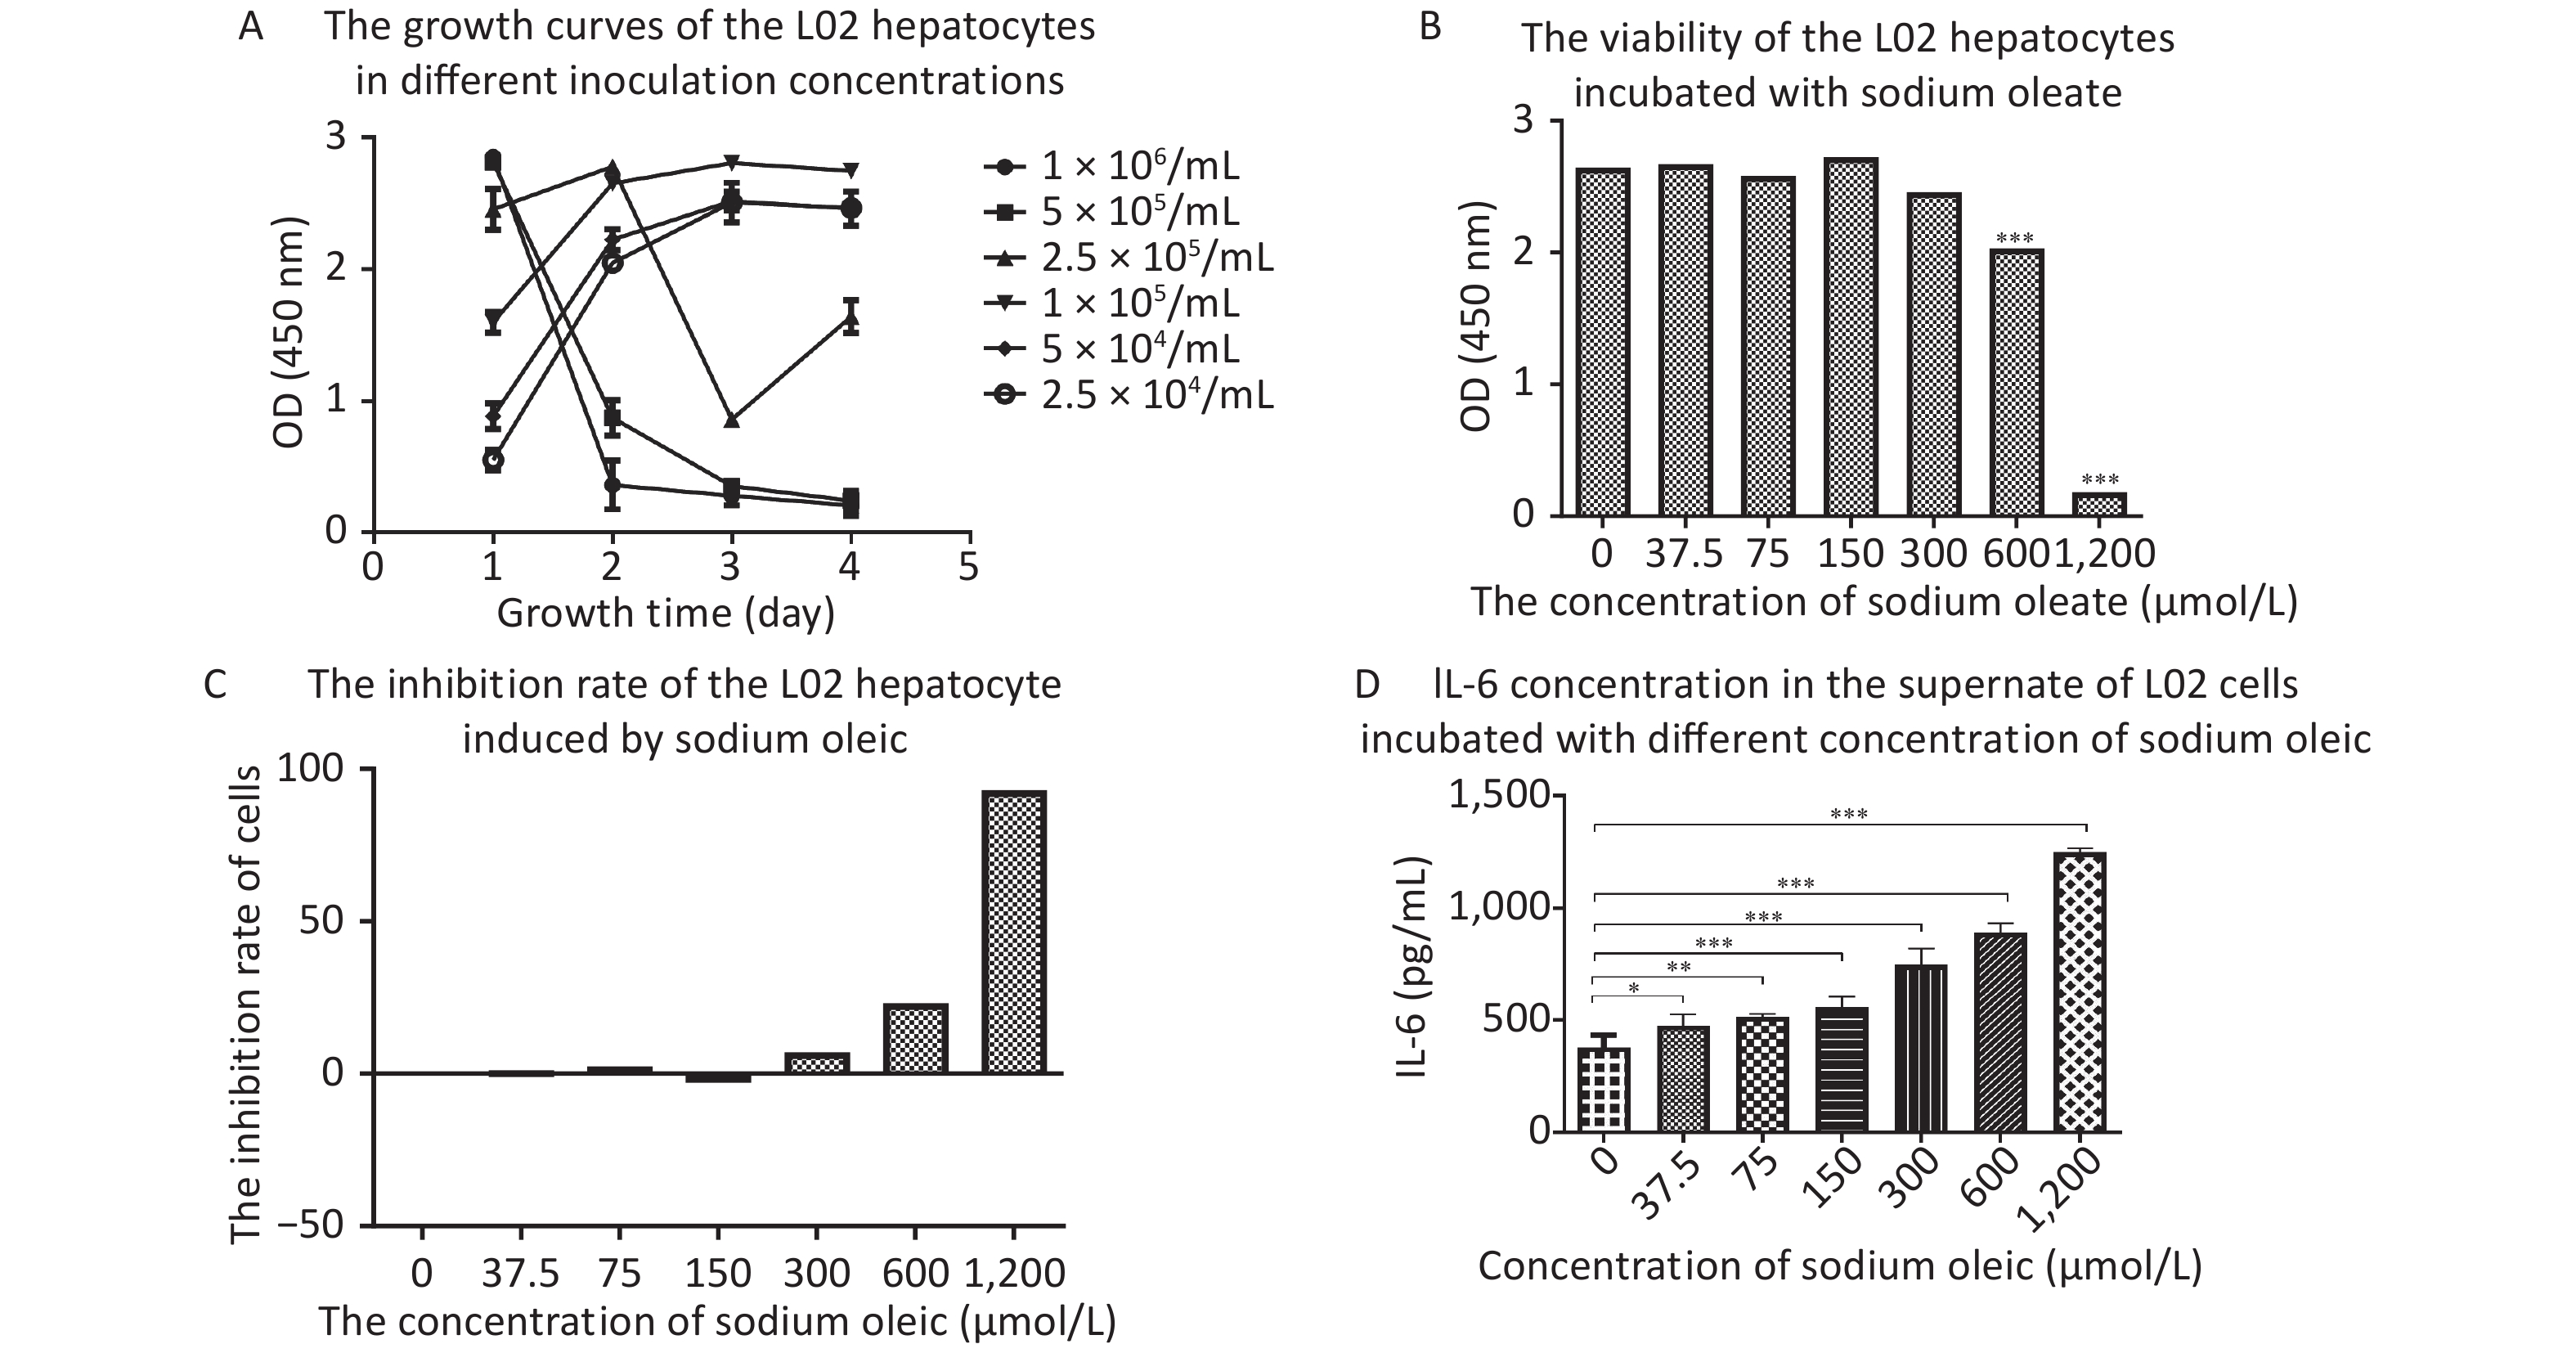
The best seeding concentration was determined to be 1 × 10⁵/mL (Figure 1A). Sodium oleate levels above 600 μmol/L were toxic to hepatocyte proliferation (P < 0.001 for 600/1,200 μmol/L compared with 0 μmol/L sodium oleate). IL-6 concentrations in the supernatant of L02 hepatocytes with sodium oleate were significantly higher than those with 0 μmol/L sodium oleate (P < 0.05 for 37.5 μmol/L, P < 0.01 for 75 μmol/L and P < 0.001 for 150 μmol/L or higher sodium oleate).
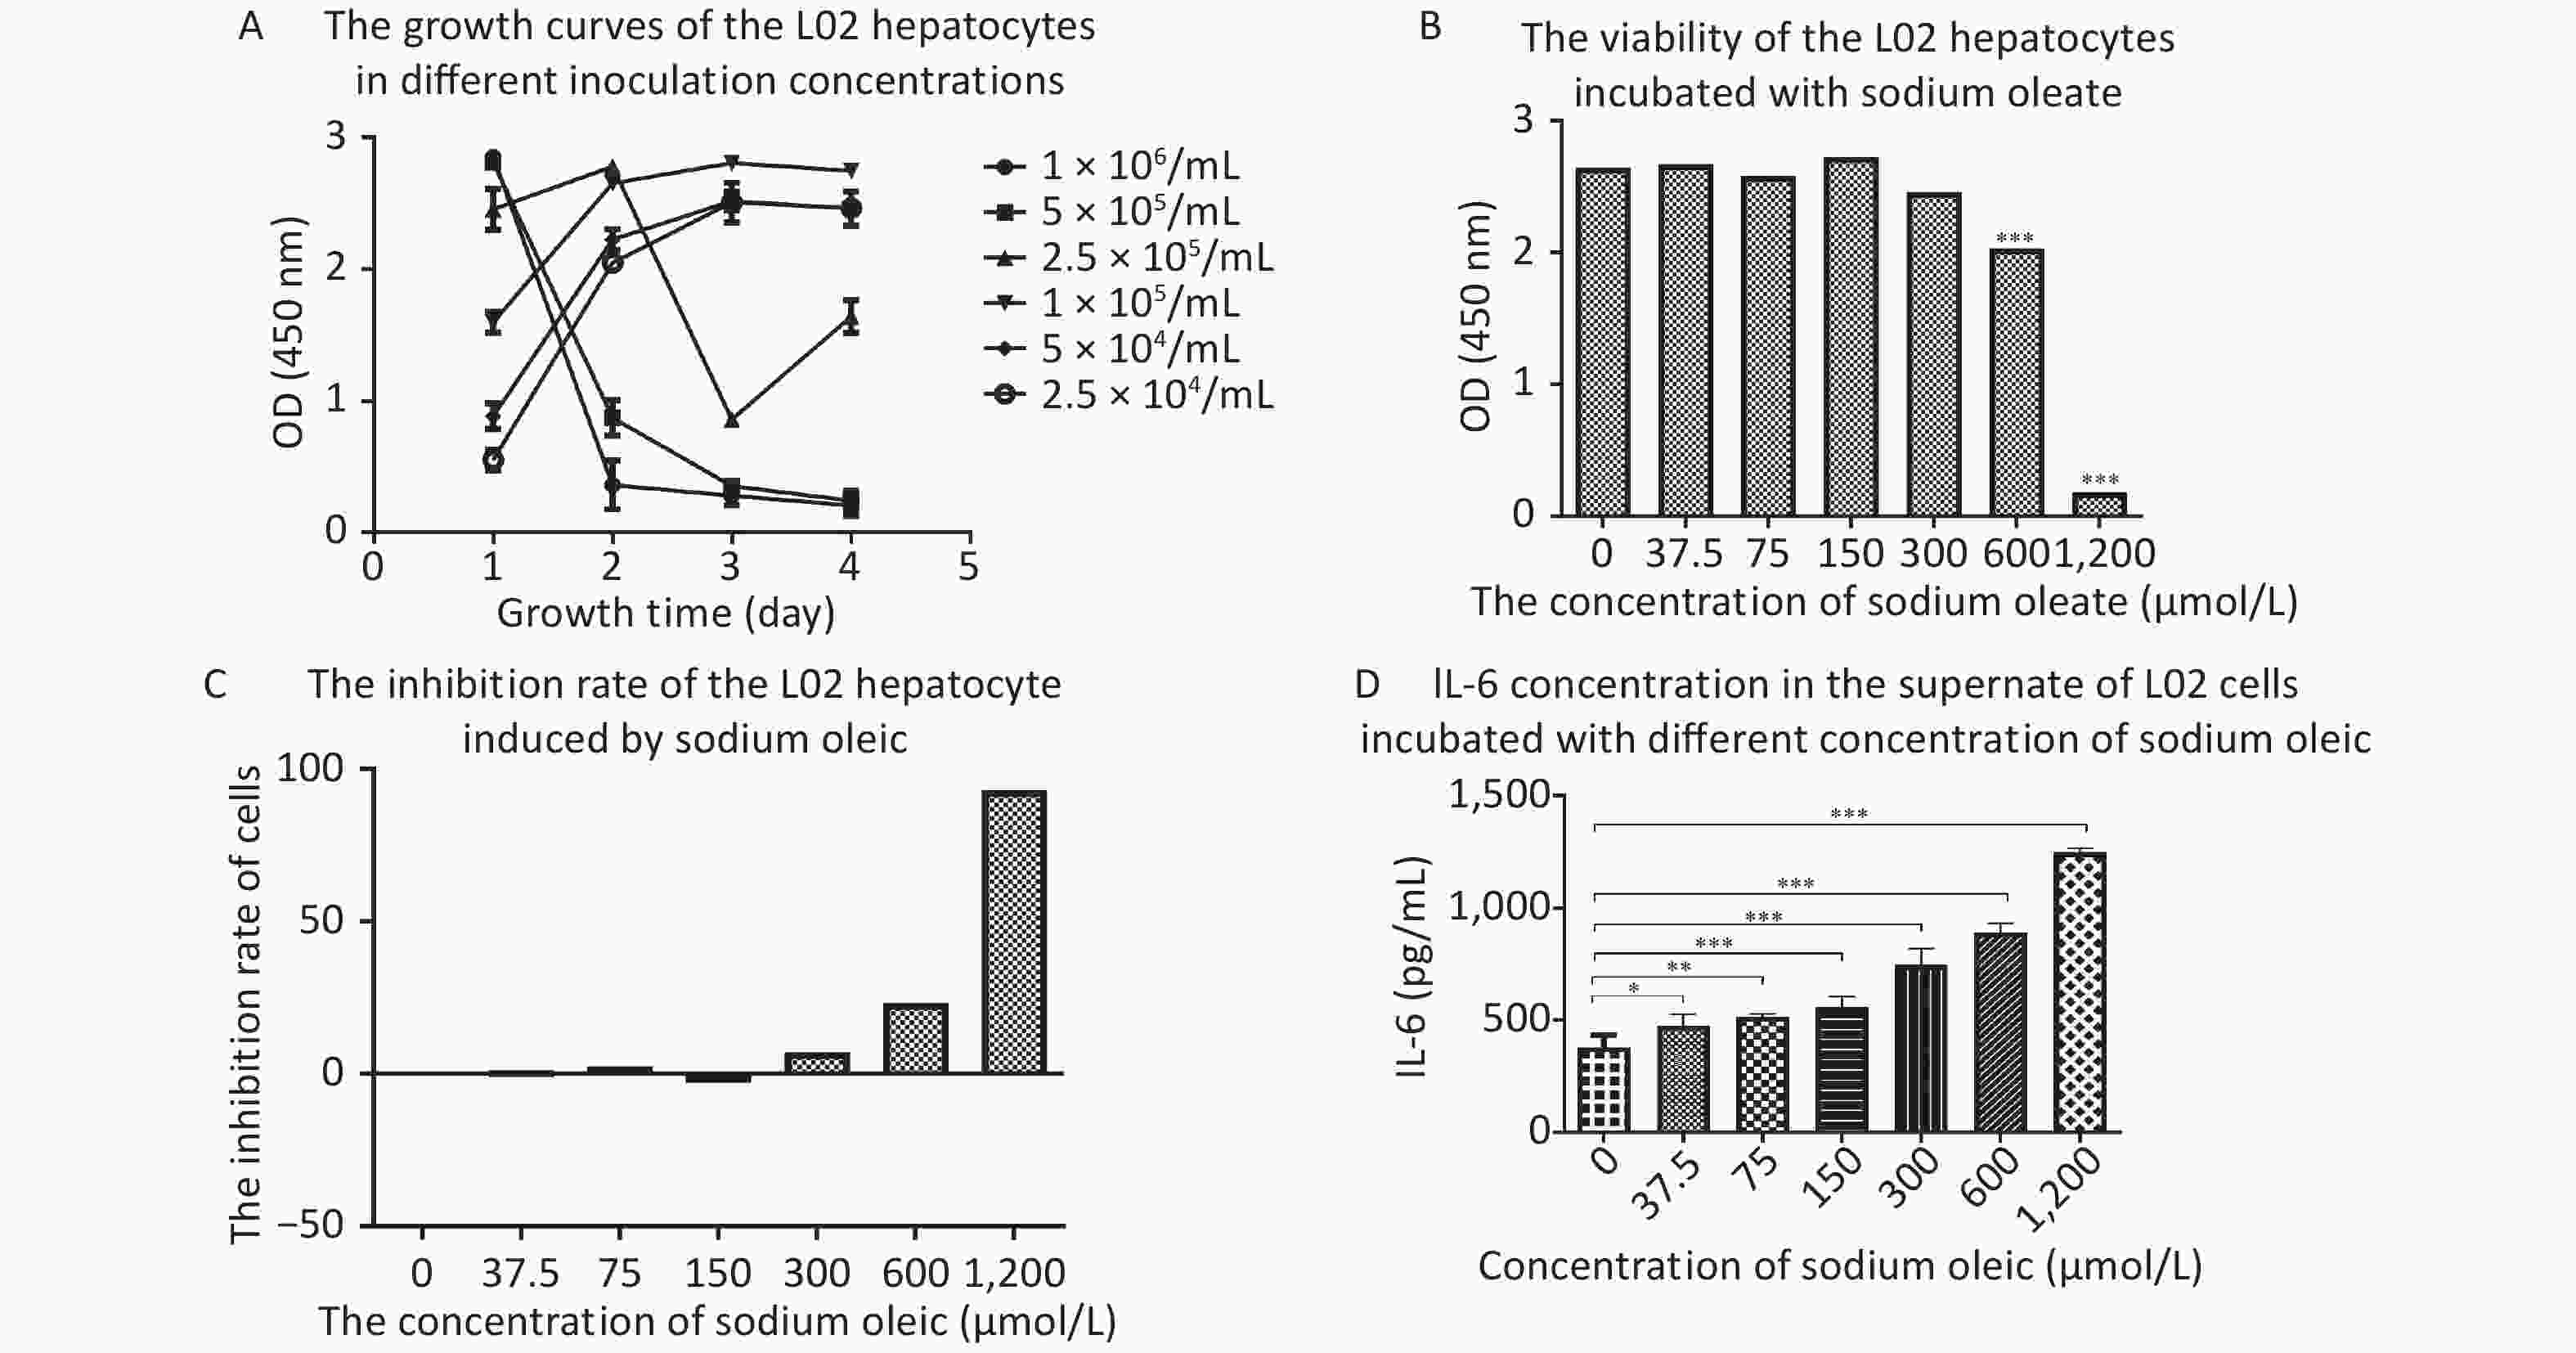
Figure 1. The growth curves of the L02 hepatocytes, the IL-6 in the supernatant and the viability/inhibition rate of the L02 hepatocytes incubated with sodium oleate of different concentrations. L02 hepatocytes were seeded on the 96-well plate in different cell concentrations (2.5 × 10⁴−1 × 10⁶/mL) for day 1 to day 4. L02 hepatocytes were treated with different doses of sodium oleate (0 to 1,200 μmol/L) for 24 h. Cell viability was measured using CCK-8 kit for growth curves, n = 6 (A) and for growth inhibition situation, n = 6 (B). The growth inhibition rate was calculated and drawn, n = 6 (C). IL-6 was detected by ELISA kits, n = 6 (D). Data were expressed as mean ± SD for equal variance. *P < 0.05, **P < 0.01, ***P < 0.001, significantly different vs. 0 sodium oleate.
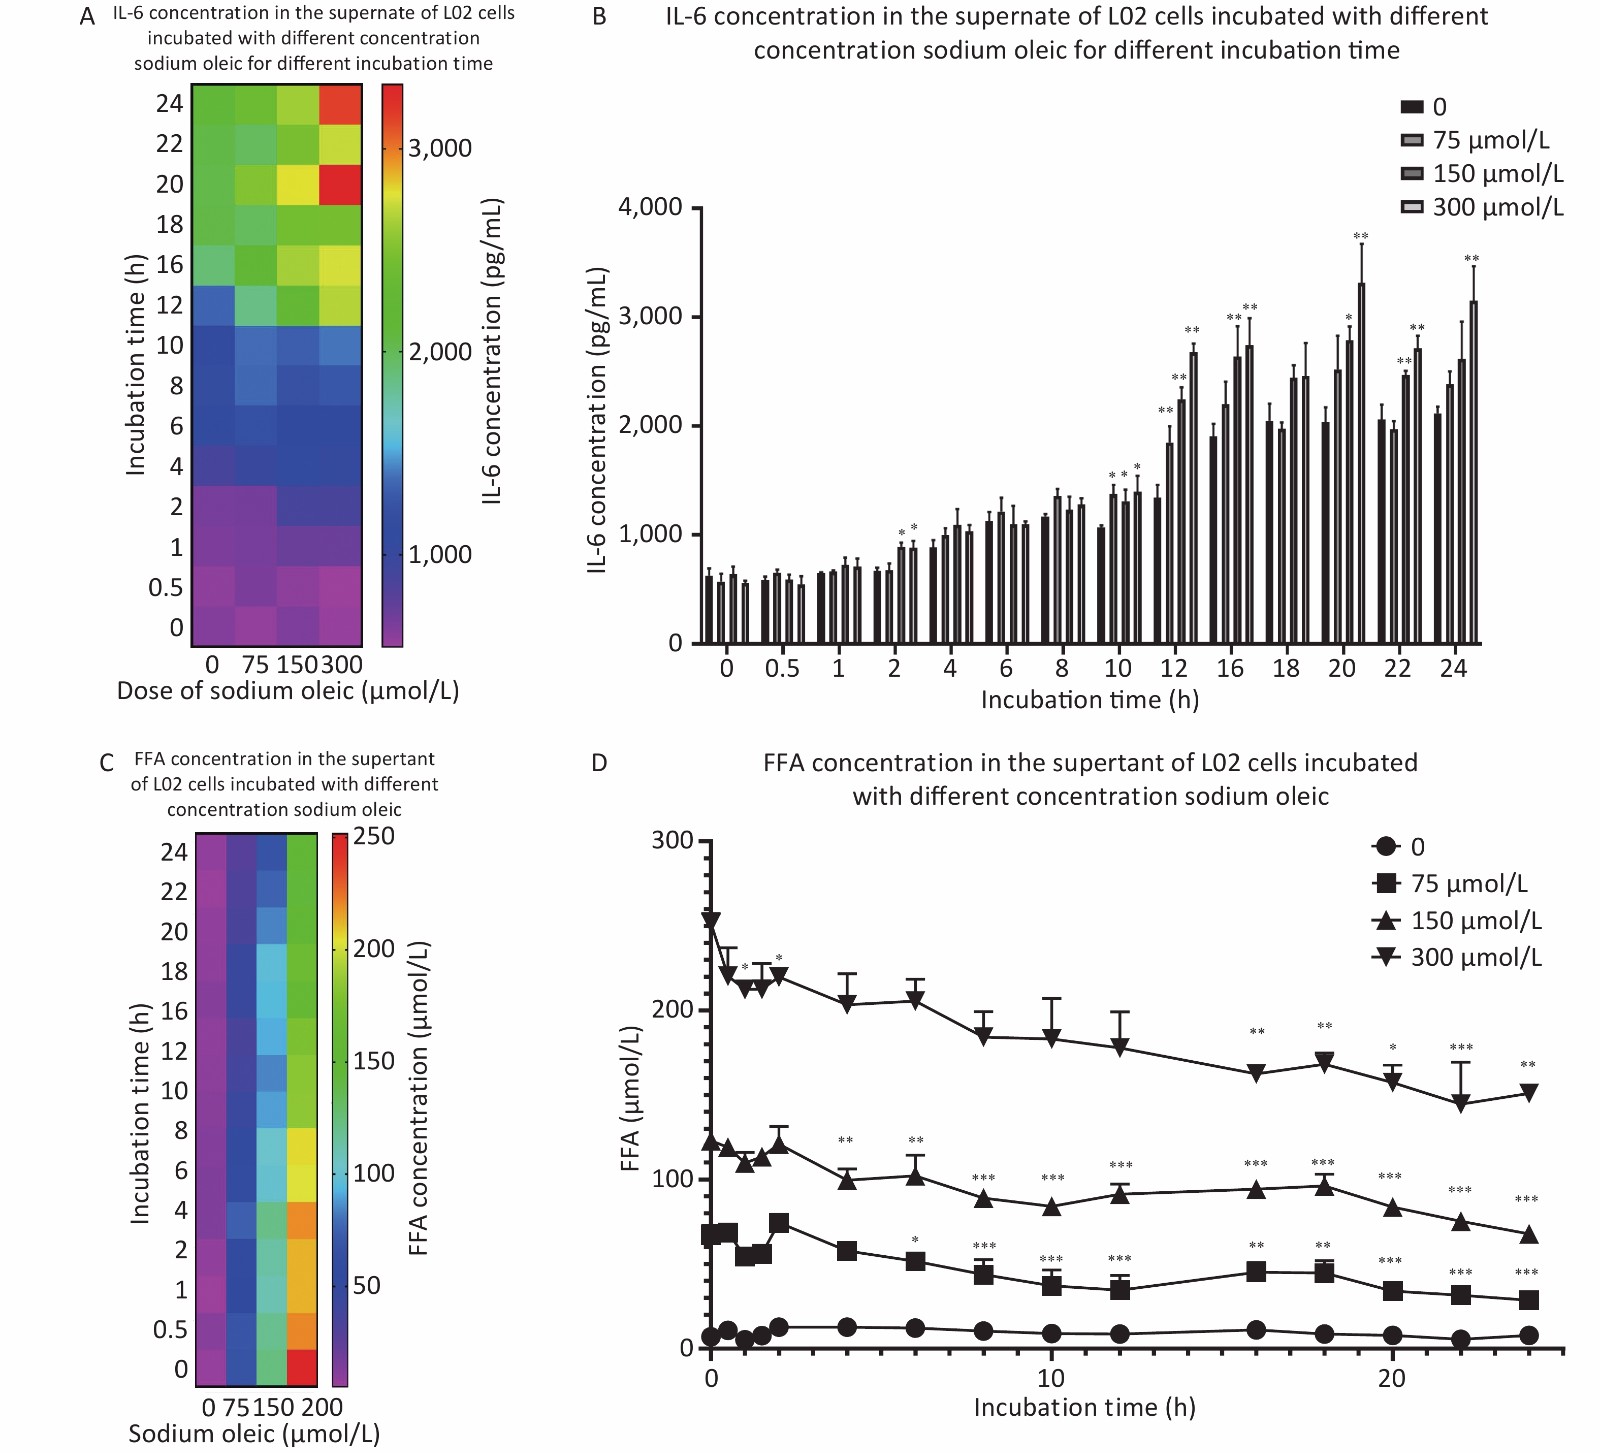
In agreement with the results above, Chankeaw et al. reported that treatment with 500 μmol/L OA, PA and stearic acid had the strongest effects on cell viability (P < 0.05) of bovine endometrial epithelial cells; IL-6 production was not consistent with the decreased cell viability, and was high with 150 and 300 μmol/L OA[9]. The results suggested that IL-6 was associated with sodium oleate and was not associated with cell viability. As shown in Figure 2A/B, 300 μmol/L and 150 μmol/L sodium oleate resulted in significantly higher IL-6 levels than 0 μmol/L sodium oleate levels for 2, 16, 20, or 22 h (P < 0.05 for 2 h, P < 0.01 for 16 h, P < 0.05 for 150 μmol/L and P < 0.01 for 300 μmol/L at 20 h, and P < 0.01 for 22 h). Sodium oleate at 75, 150, and 300 μmol/L resulted in significantly higher IL-6 levels than 0 μmol/L sodium oleate for 10 or 12 h (P < 0.05 for 10 h, P < 0.01 for 12 h). Sodium oleate at 300 μmol/L resulted in significantly higher IL-6 levels than 0 μmol/L sodium oleate for 24 h (P < 0.01). For 12, 16, 20, and 24 h, the IL-6 levels increased as the sodium oleate concentration increased. Clearly, the IL-6 concentration increased as the sodium oleate incubation time was extended.

Figure 2. IL-6 production and FFA concentration change in the supernatant of L02 hepatocytes on different sodium oleate incubation time. IL-6 and FFA were detected by kits. The results of IL-6 were shown as heat map (A) or column chart (B), and FFA results were shown as heat map (C) or line chart (D). Data were shown as mean ± SD, n = 6 (B). *P < 0.05, **P < 0.01, ***P < 0.001, significantly different vs. 0 sodium oleate (B)/0 hour (D).
As shown in Figure 2C/D, no significant differences were observed in FFAs in the supernatant of L02 hepatocytes without sodium oleate. FFA levels in the supernatant of L02 hepatocytes incubated with 75 μmol/L sodium oleate for 6–24 h were significantly lower than those with 0 h incubation time (P < 0.05 for 6 h; P < 0.001 for 8, 10, 12, 20, 22, and 24 h; P < 0.01 for 16/18 h). Incubation with sodium oleate at 150 μmol/L for 4–24 h resulted in significantly lower FFA concentrations than those at 0 h (P < 0.01 for 4/6 h; P < 0.001 for 8, 10, 12, 16, 18, 20, 22, and 24 h); 300 μmol/L sodium oleate treatment for 1, 2, or 16–24 h incubation time resulted in significantly lower FFA concentrations than those at 0 h (P < 0.05 for 1, 2, and 20 h; P < 0.01 for 16, 18, and 24 h; P < 0.001 for 22 h).
The fluorescence intensity area increased as the sodium oleate concentrations increased (Figure 3A/B) or incubation time was extended. Oil Red O staining intensified as the incubation time was extended (Figure 3G/H). Sodium oleate at 300 μmol/L induced significantly higher lipid accumulation at 1.5, 6, 8, 10, 12, 16, 18, 20, 22, and 24 h (P < 0.05 for 1.5, 6, 8, and 10 h; P < 0.01 for 12, 16, 18, 20, 22, and 24 h). Sodium oleate at 150 μmol/L induced significantly higher lipid accumulation at 12, 16, 20, and 24 h (P < 0.05 for 16 h; P < 0.01 for 12, 20, and 24 h). Sodium oleate at 75 μmol/L induced significantly higher lipid accumulation at 8, 12, 16, 20, 22, and 24 h (P < 0.05 for 8, 16, 20, and 22 h; P < 0.01 for 12 and 24 h). The fluorescence images after treatment with 300, 150, 75, and 0 μmol/L sodium oleate are shown in Figure 3C, D, E, F, respectively. At 1.5, 6, 8, 10, 16, 18, and 20 h, the lipid accumulation increased with increasing sodium oleate concentration (Figure 3B).
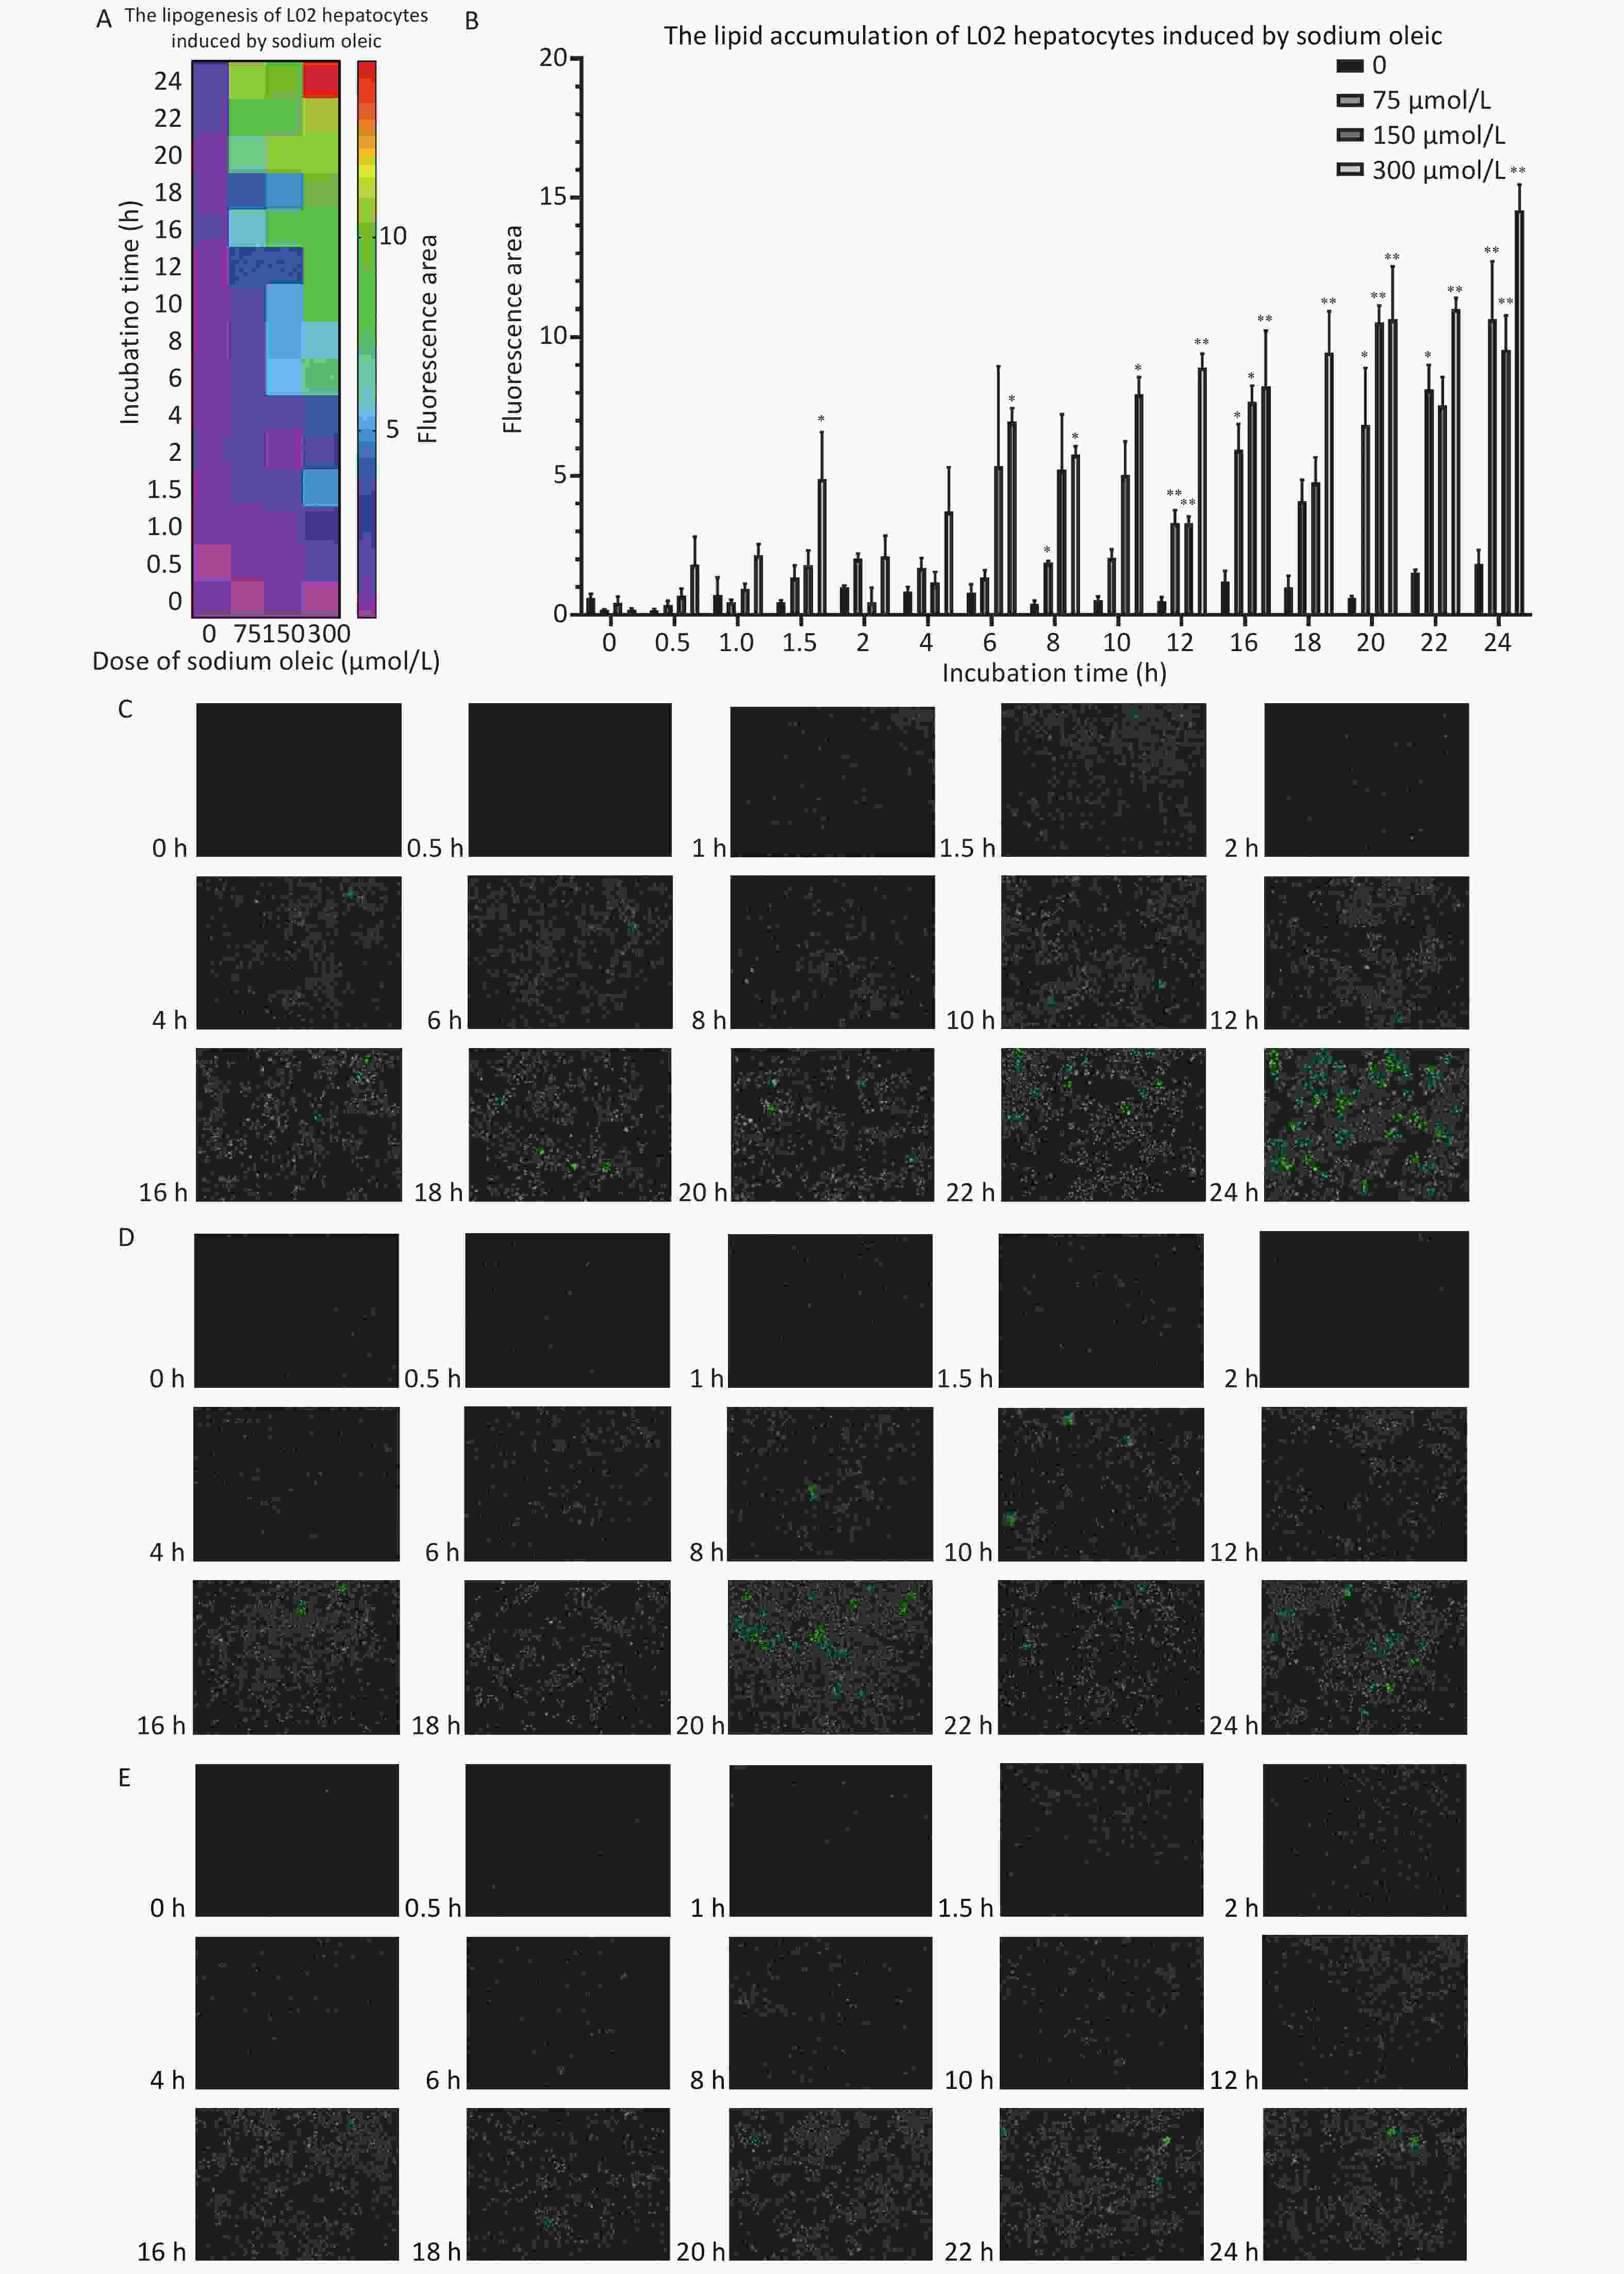
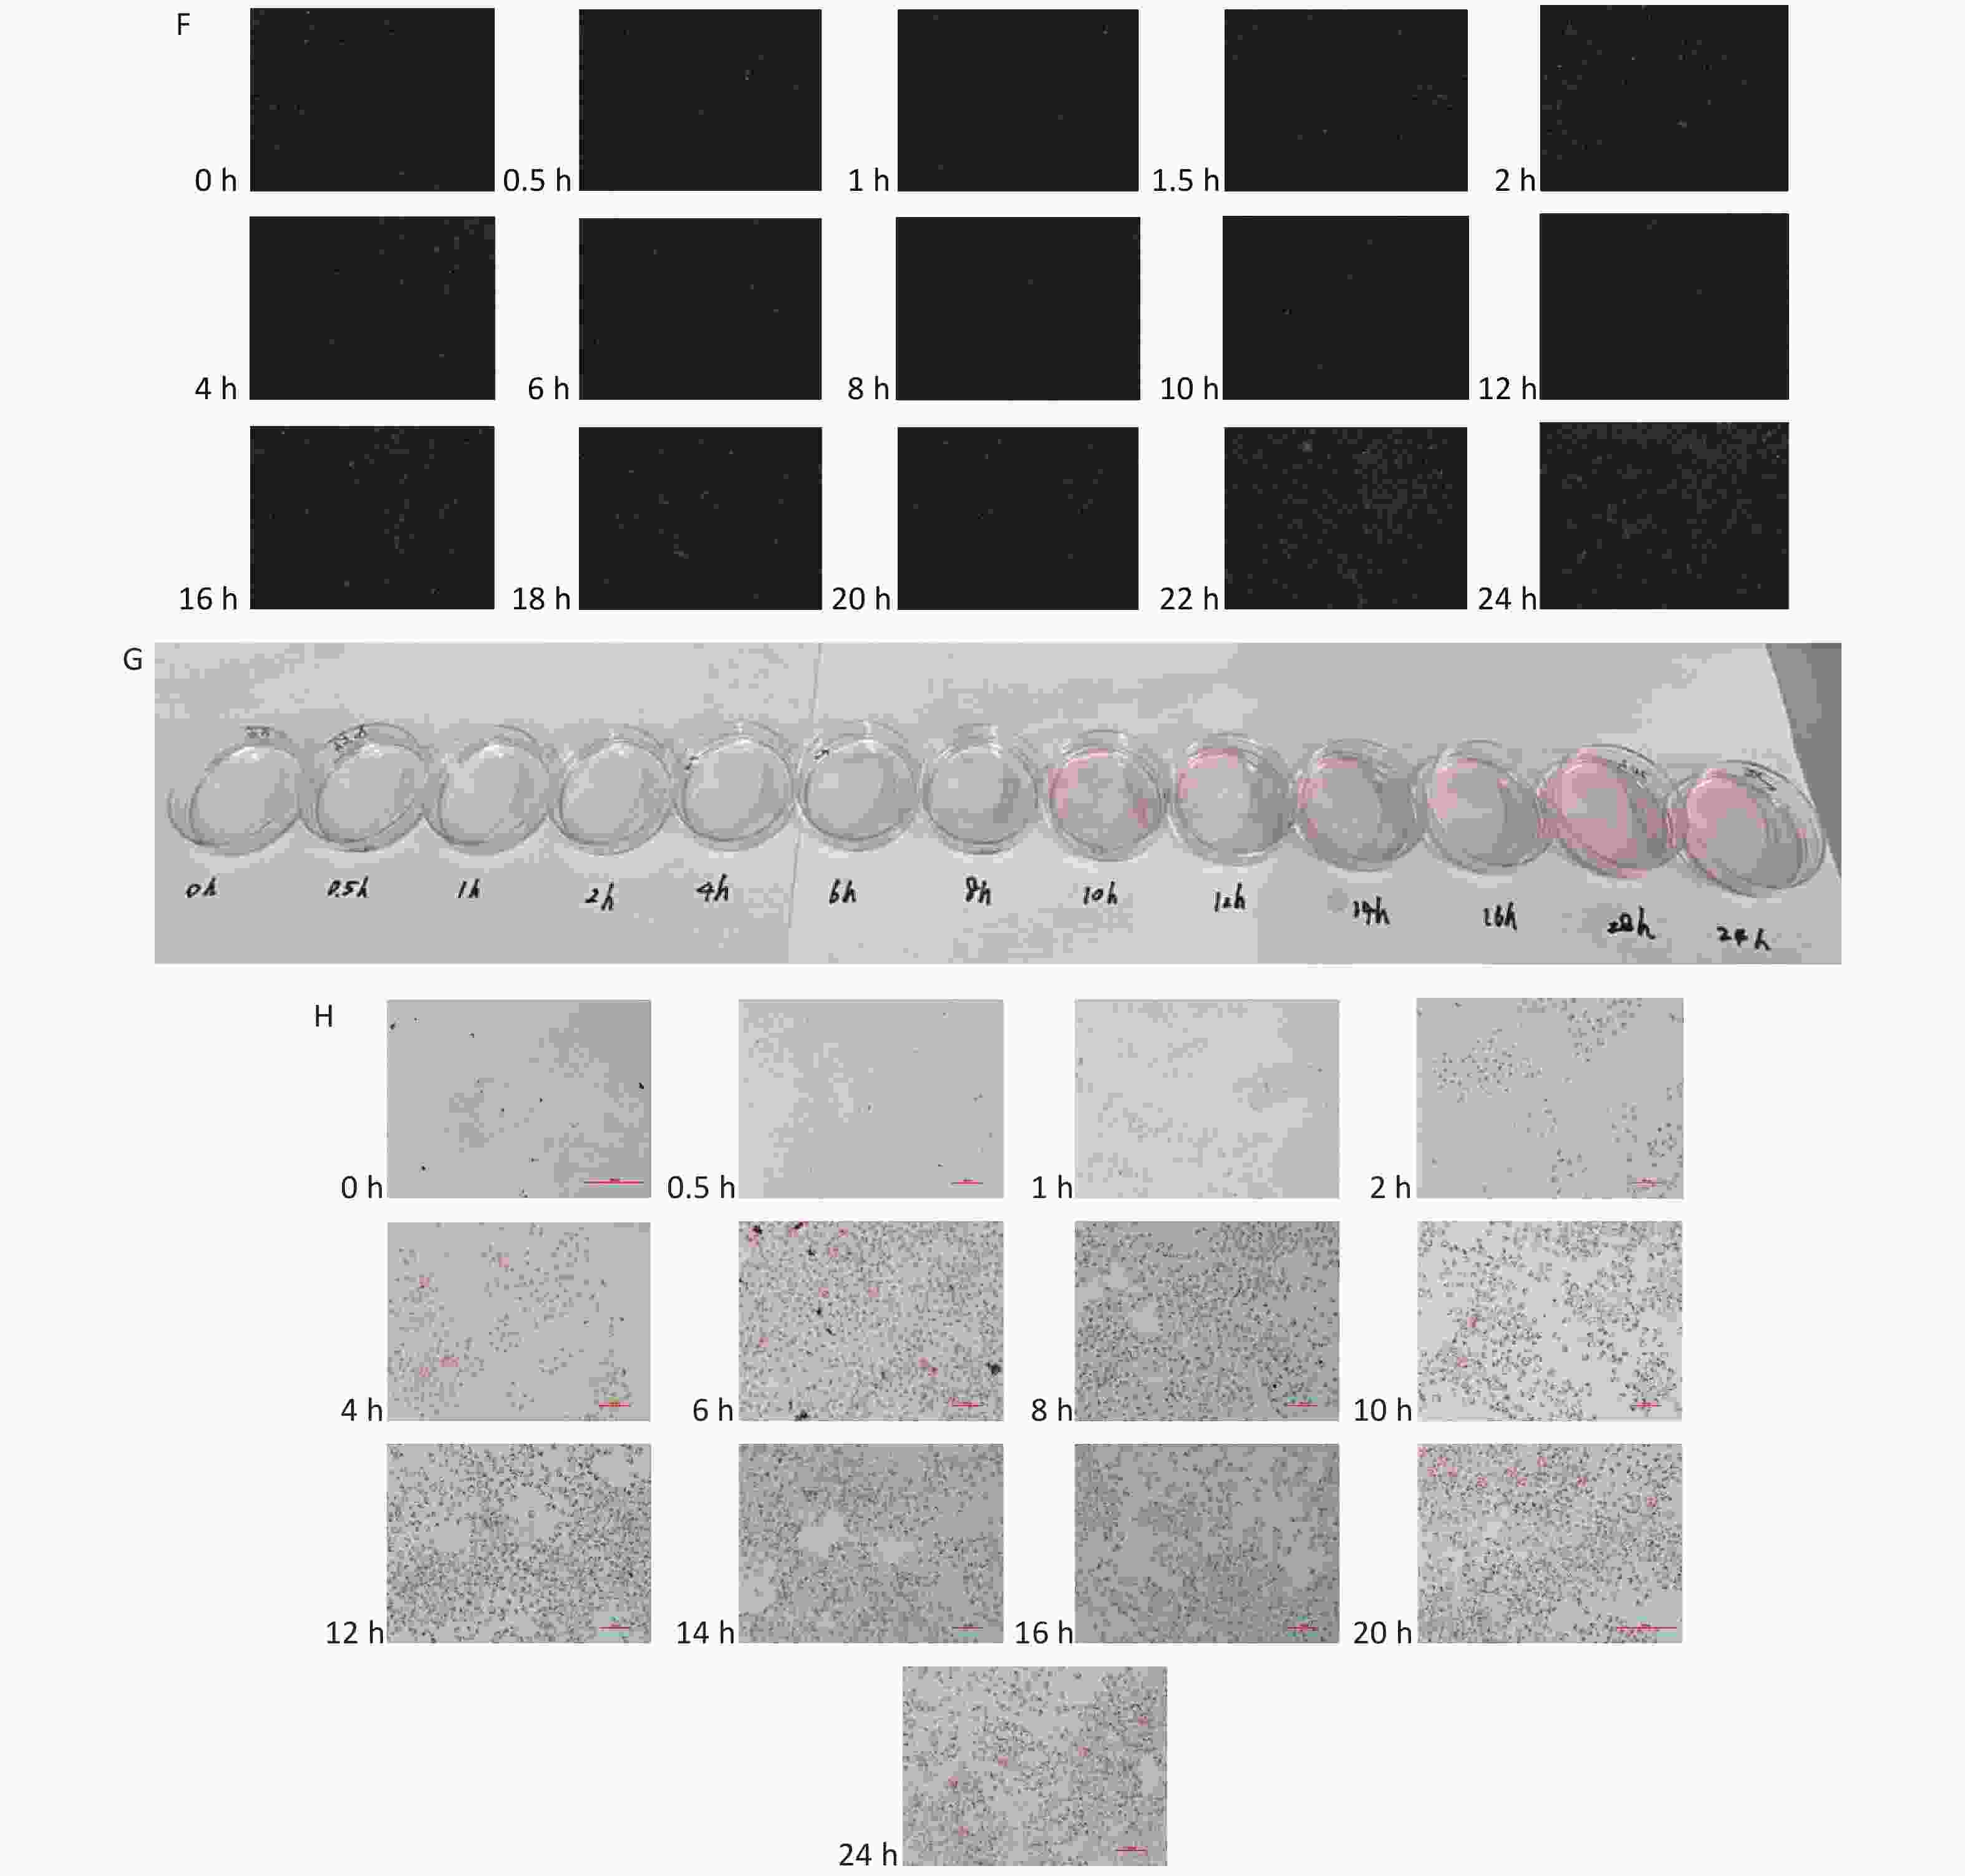
Figure 3. The lipid accumulation effects of L02 hepatocytes as sodium oleate incubation time change. The results of the lipid accumulation were shown as heat map (A) or column chart (B). Data were shown as mean ± SD, n = 6 (B). *P < 0.05, **P < 0.01, significantly different vs. 0 sodium oleate. Fluorescence images of L02 hepatocytes treated with sodium oleate were shown at different incubation concentration: 300 μmol/L (C), 150 μmol/L (D), 75 μmol/L (E), 0 (F). Oil red O staining for lipid accumulation of L02 hepatocytes induced by 300 μmol/L sodium oleate was shown as pictures by naked eyes (G) or pictures by microscopy (200×) (H).
In line with the results above, treatment with PA and OA increased IL-6 levels in bovine endometrial epithelial cells[9]. Importantly, IL-6 enhanced lipogenesis in normal physiology[5]. Wathes’s study showed that the increased production of IL-6 by sodium oleate may be associated with lipid accumulation and may lead to foam cell formation[10].
The strengths of this study are the comprehensive evaluation of lipid accumulation in L02 hepatocytes induced by sodium oleate. The parameters were lipid accumulation in L02 hepatocytes, and FFA and IL-6 concentrations in the cell supernatant. The influencing factors were incubation time and the concentration of sodium oleate.
The limitations of this study were that the possible mechanism linking IL-6 levels and lipid accumulation was not explored, and IL-6 and FFAs were detected only in the supernatant, but not in the L02 hepatocytes.
In this study, IL-6 increased with increasing sodium oleate concentration after 12, 16, 20 and 24 h. After 6, 8, 10, 16, 18 and 20 h, the lipid accumulation increased with increasing sodium oleate concentration. FFA levels in the supernatant of L02 hepatocytes incubated with sodium oleate for 6 h were lower than those at 0 h. From 2-hour incubation times onward, Oil Red O stained cells were significantly more abundant than they were at 0 h. IL-6 production and lipid accumulation in L02 hepatocytes were affected by sodium oleate in a time- and dose-dependent manner. Sodium oleate concentrations as low as 37.5 μmol/L induced an IL-6 increase in L02 hepatocytes after a 24 h incubation. Decreased incubation times and sodium oleate concentrations could be chosen in further experiments.
Author Contributions JSH designed the experiment and obtained funding; CC conducted the experiments and wrote the manuscript; QZ, XDJ and YL performed manuscript review and editing; and YM and JBW conducted the experiments.
Conflicts of Interest All authors declare no conflicts of interest.
HTML
 21099Supplementary Materials.pdf
|

|

 Quick Links
 DownLoad: