

-
The metabolic syndrome (MetS), which comprises of a variety of metabolic disorders, including obesity, hyperglycemia, hypertension, dyslipidemia, hyperviscosity, hyper uric acid, fatty liver, and hyperinsulinemia[1], has impacted all nations and races, becoming a significant challenge for public health institutions worldwide. MetS is associated with cardiovascular disease, type 2 diabetes morbidity and mortality, and all-cause mortality[2]. However, the diagnostic criteria of MetS are complex to implement, which makes early screening of individuals with metabolic syndrome challenging.
Waist-to-height ratio (WHtR) and lipid accumulation product (LAP) proved to be better indicators for screening MetS[2]. Unlike the Western population, the Asian population has more abdominal fat distribution. Waist Circumference (WC) and WHtR are known to be important indicators of abdominal obesity. They are straightforward, low-cost, and quickly acquired anthropometric parameters that are generally adopted as effective indicators of MetS[3]. The use of multiple indicators in combination to screen for metabolic syndromes can have a broader application, avoiding the limitations of geographical, age, and gender gaps[4].
Logistic regression prediction model is the method which uses a linear combination of indicators to maximize the disease state or outcome judged by the independent variable to predict the gold standard, it can improve the sensitivity and specificity of the diagnosis, thereby increasing the area under the diagnostic curve. It is to be assessed whether the probability variable generated by LAP and WC or WHtR can prove to be an effective tool for the screening of metabolic syndrome. This study aimed to investigate the ability of the improved LAP for predicting metabolic syndrome.
The study was approved by the Institutional Ethics Review Board (IERB) of the First Affiliated Hospital of Shihezi University School of Medicine (IERB No. SHZ2010LL01). All the participants signed informed consent forms.
The survey was performed from 2009 to 2010 in Yili, Shihezi and Kashi prefectures, which belong to Xinjiang province. Participants were selected using the multistage stratified cluster random sampling method. First, we selected the representative prefecture based on the geographical distributions of the minority populations in Xinjiang, a province in northwestern China. Second, we randomly selected one county in the prefecture and one township from the county. Finally, a stratified sampling method was used to select the corresponding villages in each township. We successfully interviewed a total of 10,020 individuals aged ≥ 18 years who had resided on-the-ground for over 12 months. Details of each participant were collected in the form of a questionnaire. The questionnaire contained basic information (gender, age, etc.).
A physical examination, including measurements of height, weight, waist circumference, hip circumference, systolic and diastolic blood pressure, was performed. Waist and hip circumference were measured using a stretch resistant tape and standardised operating procedure. Blood samples were drawn from the cubital vein into tubes containing heparin sodium in the morning after an overnight fast and measured using a biochemical auto-analyzer (Olympus AU 2700; Olympus Diagnostics, Hamburg, Germany) in the clinical laboratory. Body mass index (BMI) was calculated as weight divided by the square of height. WHtR was calculated by dividing the waist circumference by height. Body adiposity index (BAI) was calculated by the formula: BAI = [(hip circumference)/(height (m)1.5) – 18]. LAP was calculated by the formula: LAP = [waist circumference (cm) – 65] × triglycerides (TG) (mmol/L) for males, and [waist circumference (cm) – 58] × TG (mmol/L) for females. The index of triglycerides and glucose index (TyG) was calculated by formula: Ln [TG (mg/dL) × fasting blood glucose (FBG) (mg/dL)/2]. Visceral adiposity index (VAI) was calculated as [WC (cm)/39.68 + (1.88 × BMI)] × [TG (mmol/L)/1.03] × (1.31/high-density lipoprotein (HDL) for males, and [WC (cm)/36.58 + (1.89 ×BMI)] × [TG (mmol/L)/0.81] × (1.52/HDL) for females.
MetS diagnosed by the Joint Interim Statement (JIS) criteria included central obesity (waist circumference ≥ 85 cm in males or ≥ 80 cm in females), in addition to any two of following factors: Elevated TG level (> 150 mg/dL or 1.70 mmol/L), reduced high-density lipoprotein cholesterol (HDL-C) (< 40 mg/dL or 1 mmol/L in men, < 50 mg/dL or 1.30 mmol/L in women), elevated systolic blood pressure (BP) (≥ 130 mmHg) or diastolic BP (≥ 85 mmHg), and FBG (≥ 100 mg/dL or 5.6 mmol/L)[5].
The logistic regression model was established according to the MetS-JIS definition, and the predicted probability was used as the analysis indicator. LAP and WC were incorporated into the multivariate logistic regression model to generate new probability variables. Each sample will have a corresponding P-value. The probability model is shown in the following equation, which can be used to calculate the probability of getting sick in a sample, according to the level of LAP and WC of the sample.
$$\begin{split} &{\rm{Logit}}\left( {{\rm{LAP}} - {\rm{WC}}} \right) = -8.480 \;+\;\\ &\;\;\;\;\; 0.048\;\times\;{\rm{LAP}} \;+\; 0.062\;\times\;{\rm{WC}} \end{split}$$ (1) $$\begin{split} &{\rm{Logit}}\left( {{\rm{LAP}} - {\rm{WHtR}}} \right) = - 9.424 \;+\\ &\;\;\;\;\;0.047\;\times\;{\rm{LAP}} \;+\; 11.796\;\times\;{\rm{WHtR}} \end{split}$$ (2) Data were analyzed using SPSS (version 21.0, Chicago, IL, USA) between 2017 and 2018. Continuous variables were evaluated as mean ± standard deviation (
${{\bar {\rm{x}}}}$ ± SD) using the t-test. Categorical variables were analyzed as percentages (%) using the Chi-square test. The plots of indicators and MetS components were presented as mean with standard deviations and trend tests. The screening ability of TyG, LAP, BAI, VAI, LAP-WC, and LAP-WHtR for metabolic syndrome was explored using the receiver operating characteristic curve (ROC) analysis. The plots of ROC were depicted using Medcla software, and the area under the curve (AUC) of indicators was compared using the Z test. P-value < 0.05 was considered statistically significant.The prevalence of MetS (JIS criteria) was 20.7% in all participants. However, the prevalence of MetS (JIS criteria) was 16.2% in males and 24.3% in females. Baseline characteristics are shown in Supplementary Table S1 (available in www.besjournal.com), according to the MetS-JIS definition. Participants with MetS showed significantly higher values for age, weight, height, WC, hip circumference, systolic BP, diastolic BP, TG, FBG, BMI, WHtR, BAI, VAI, LAP, LAP-WC, LAP-WHtR, and lower HDL-C level compared to participants without MetS, in both males and females (P < 0.05 for all) (Supplementary Table S1).
Parameters Men (n = 4,389) Women (n = 5,640) MetS group Non-MetS group t/χ2 P-value* MetS group Non-MetS group t/χ2 P-value* Age (years) 51.7 ± 12.3 44.8 ± 15.2 13.1 < 0.001 51.8 ± 12.5 42.7 ± 13.6 22.8 < 0.001 Height (cm) 169 ± 7.06 168 ± 7.14 4.51 < 0.001 157 ± 6.81 156 ± 6.47 3.08 0.002 Weight (kg) 77.0 ± 11.0 65.5 ± 10.2 25.9 < 0.001 64.2 ± 10.9 57.0 ± 9.61 21.9 < 0.001 BMI (kg/m2) 27.0 ± 3.21 23.3 ± 3.12 28.8 < 0.001 26.1 ± 3.96 23.0 ± 3.12 26.1 < 0.001 WC (cm) 97.4 ± 6.47 84.3 ± 8.62 46.6 < 0.001 90.5 ± 8.32 79.8 ± 9.75 39.7 < 0.001 Hip circumference (cm) 102 ± 6.24 95.6 ± 6.72 24.9 < 0.001 100 ± 8.23 94.2 ± 7.50 25.0 < 0.001 Systolic BP (mmHg) 140 ± 20.7 126 ± 19.3 16.3 < 0.001 138 ± 23.6 120 ± 19.7 25.3 < 0.001 Diastolic BP (mmHg) 90.2 ± 13.0 81.0 ± 12.5 17.8 < 0.001 87.7 ± 13.4 77.4 ± 12.4 25.4 < 0.001 FBG (mmol/L) 5.61 ± 1.92 4.78 ± 1.20 11.1 < 0.001 5.48 ± 1.77 4.67 ± 0.95 16.2 < 0.001 TG (mmol/L) 1.84 ± 0.73 1.24 ± 0.69 20.2 < 0.001 1.54 ± 0.71 1.06 ± 0.58 22.3 < 0.001 HDL-C (mmol/L) 1.26 ± 0.58 1.33 ± 0.54 −3.20 0.001 1.37 ± 0.61 1.50 ± 0.61 - 6.98 < 0.001 VAI 2.28 ± 1.15 1.36 ± 0.90 20.4 < 0.001 2.42 ± 1.21 1.48 ± 0.91 26.3 < 0.001 LAP 59.0 ± 24.1 24.1 ± 17.2 36.8 < 0.001 49.2 ± 24.2 24.1 ± 17.2 37.1 < 0.001 TYG 8.87 ± 0.56 8.29 ± 0.66 24.8 < 0.001 8.64 ± 0.66 8.13 ± 0.61 25.2 < 0.001 BAI 28.8 ± 3.84 26.2 ± 3.64 16.7 < 0.001 33.3 ± 4.91 29.8 ± 4.26 23.8 < 0.001 LAP-WC 0.57 ± 0.25 0.16 ± 0.17 40.8 < 0.001 0.40 ± 0.27 0.13 ± 0.16 35.4 < 0.001 LAP-WHtR 0.52 ± 0.26 0.14 ± 0.16 38.5 < 0.001 0.44 ± 0.28 0.14 ± 0.17 37.2 < 0.001 Note. *P-difference between MetS group and Non-MetS group. Abbreviation: BMI: body mass index; WC: waist circumference; TG: triglycerides; HDL-C: high-density lipoprotein cholesterol; FBG: fasting blood glucose; WHtR: waist-to-height ratio; VAI: visceral adiposity index; LAP:lipid accumulation product; TyG: triglycerides and glucose index; BAI: body adiposity index; LAP-WC: the model of lipid accumulation product and waist circumference; LAP-WHtR: ipid accumulation product and and waist-to-height ratio. Table S1. Characteristics of the study population according to the Joint Interim Statement criteria
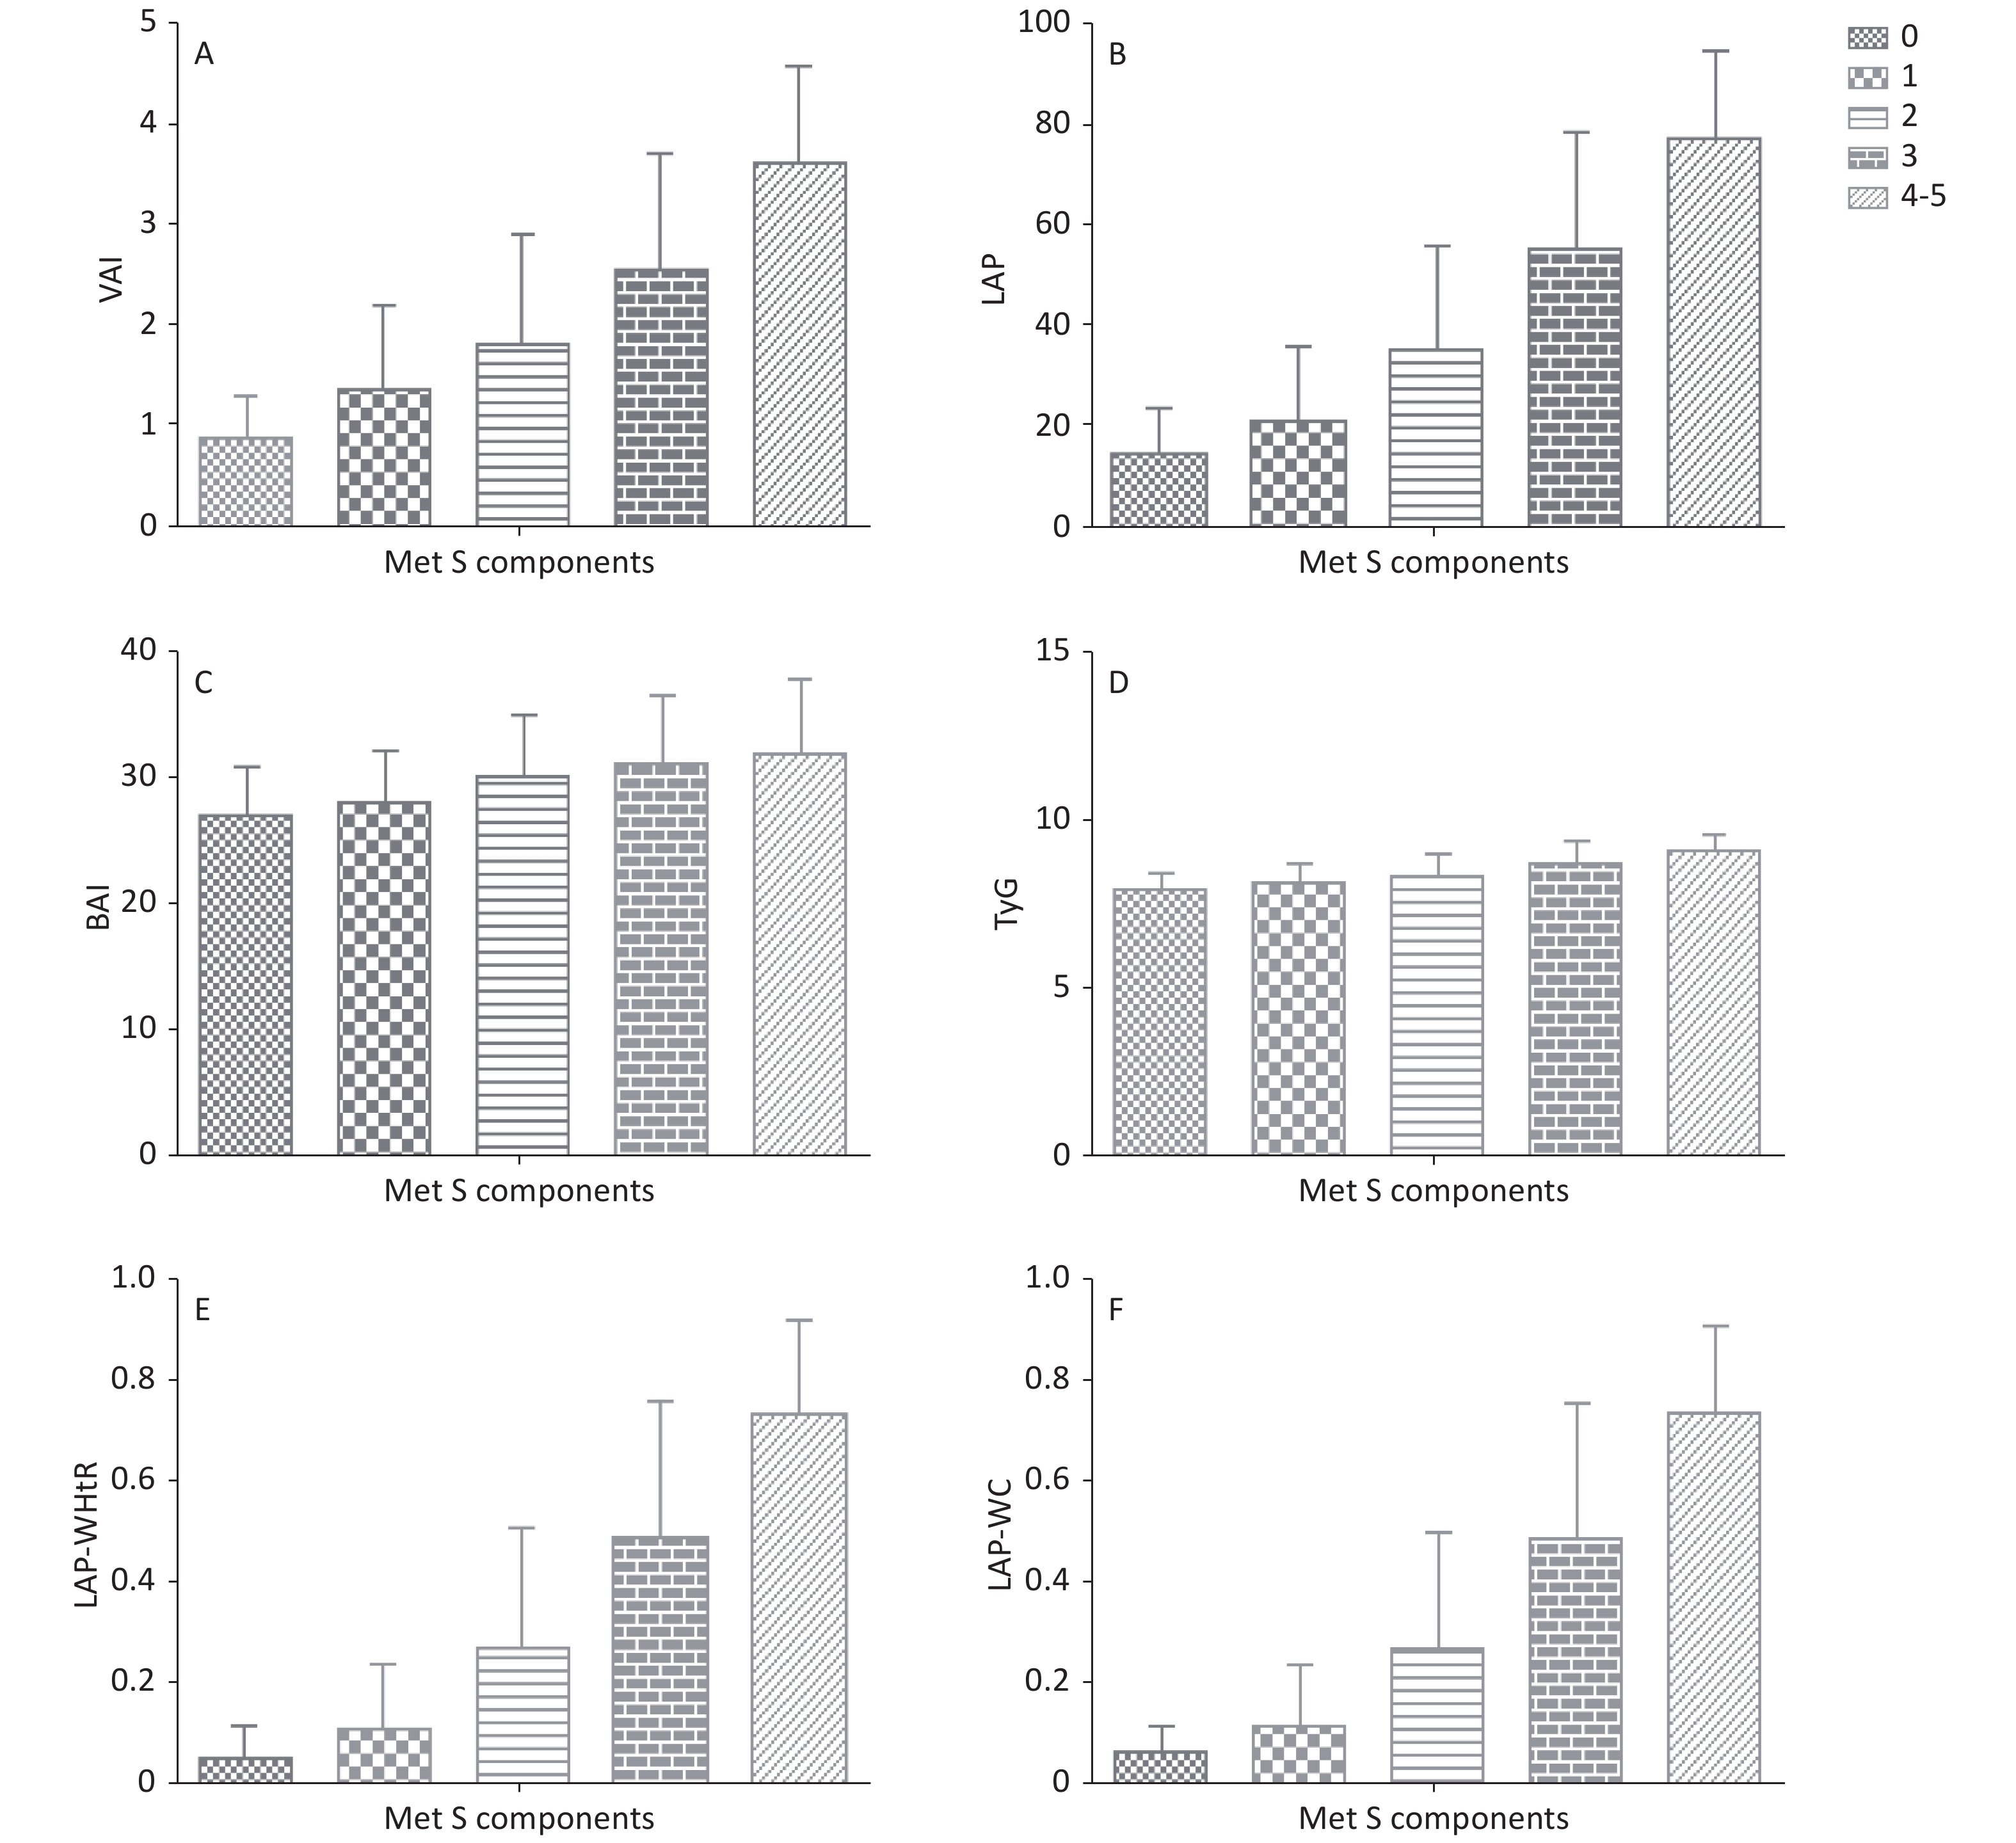
Correlation analysis between screening indicators and MetS components found the values of LAP, TyG, VAI, BAI, LAP-WC, and LAP-WHtR changed according to the metabolic syndrome components. The values of VAI, LAP, and LAP-WC, LAP-WHtR increased according to the increase in the MetS components (P for trend < 0.001) (Supplementary Figure S1 and Supplementary Table S2 available in www.besjournal.com).
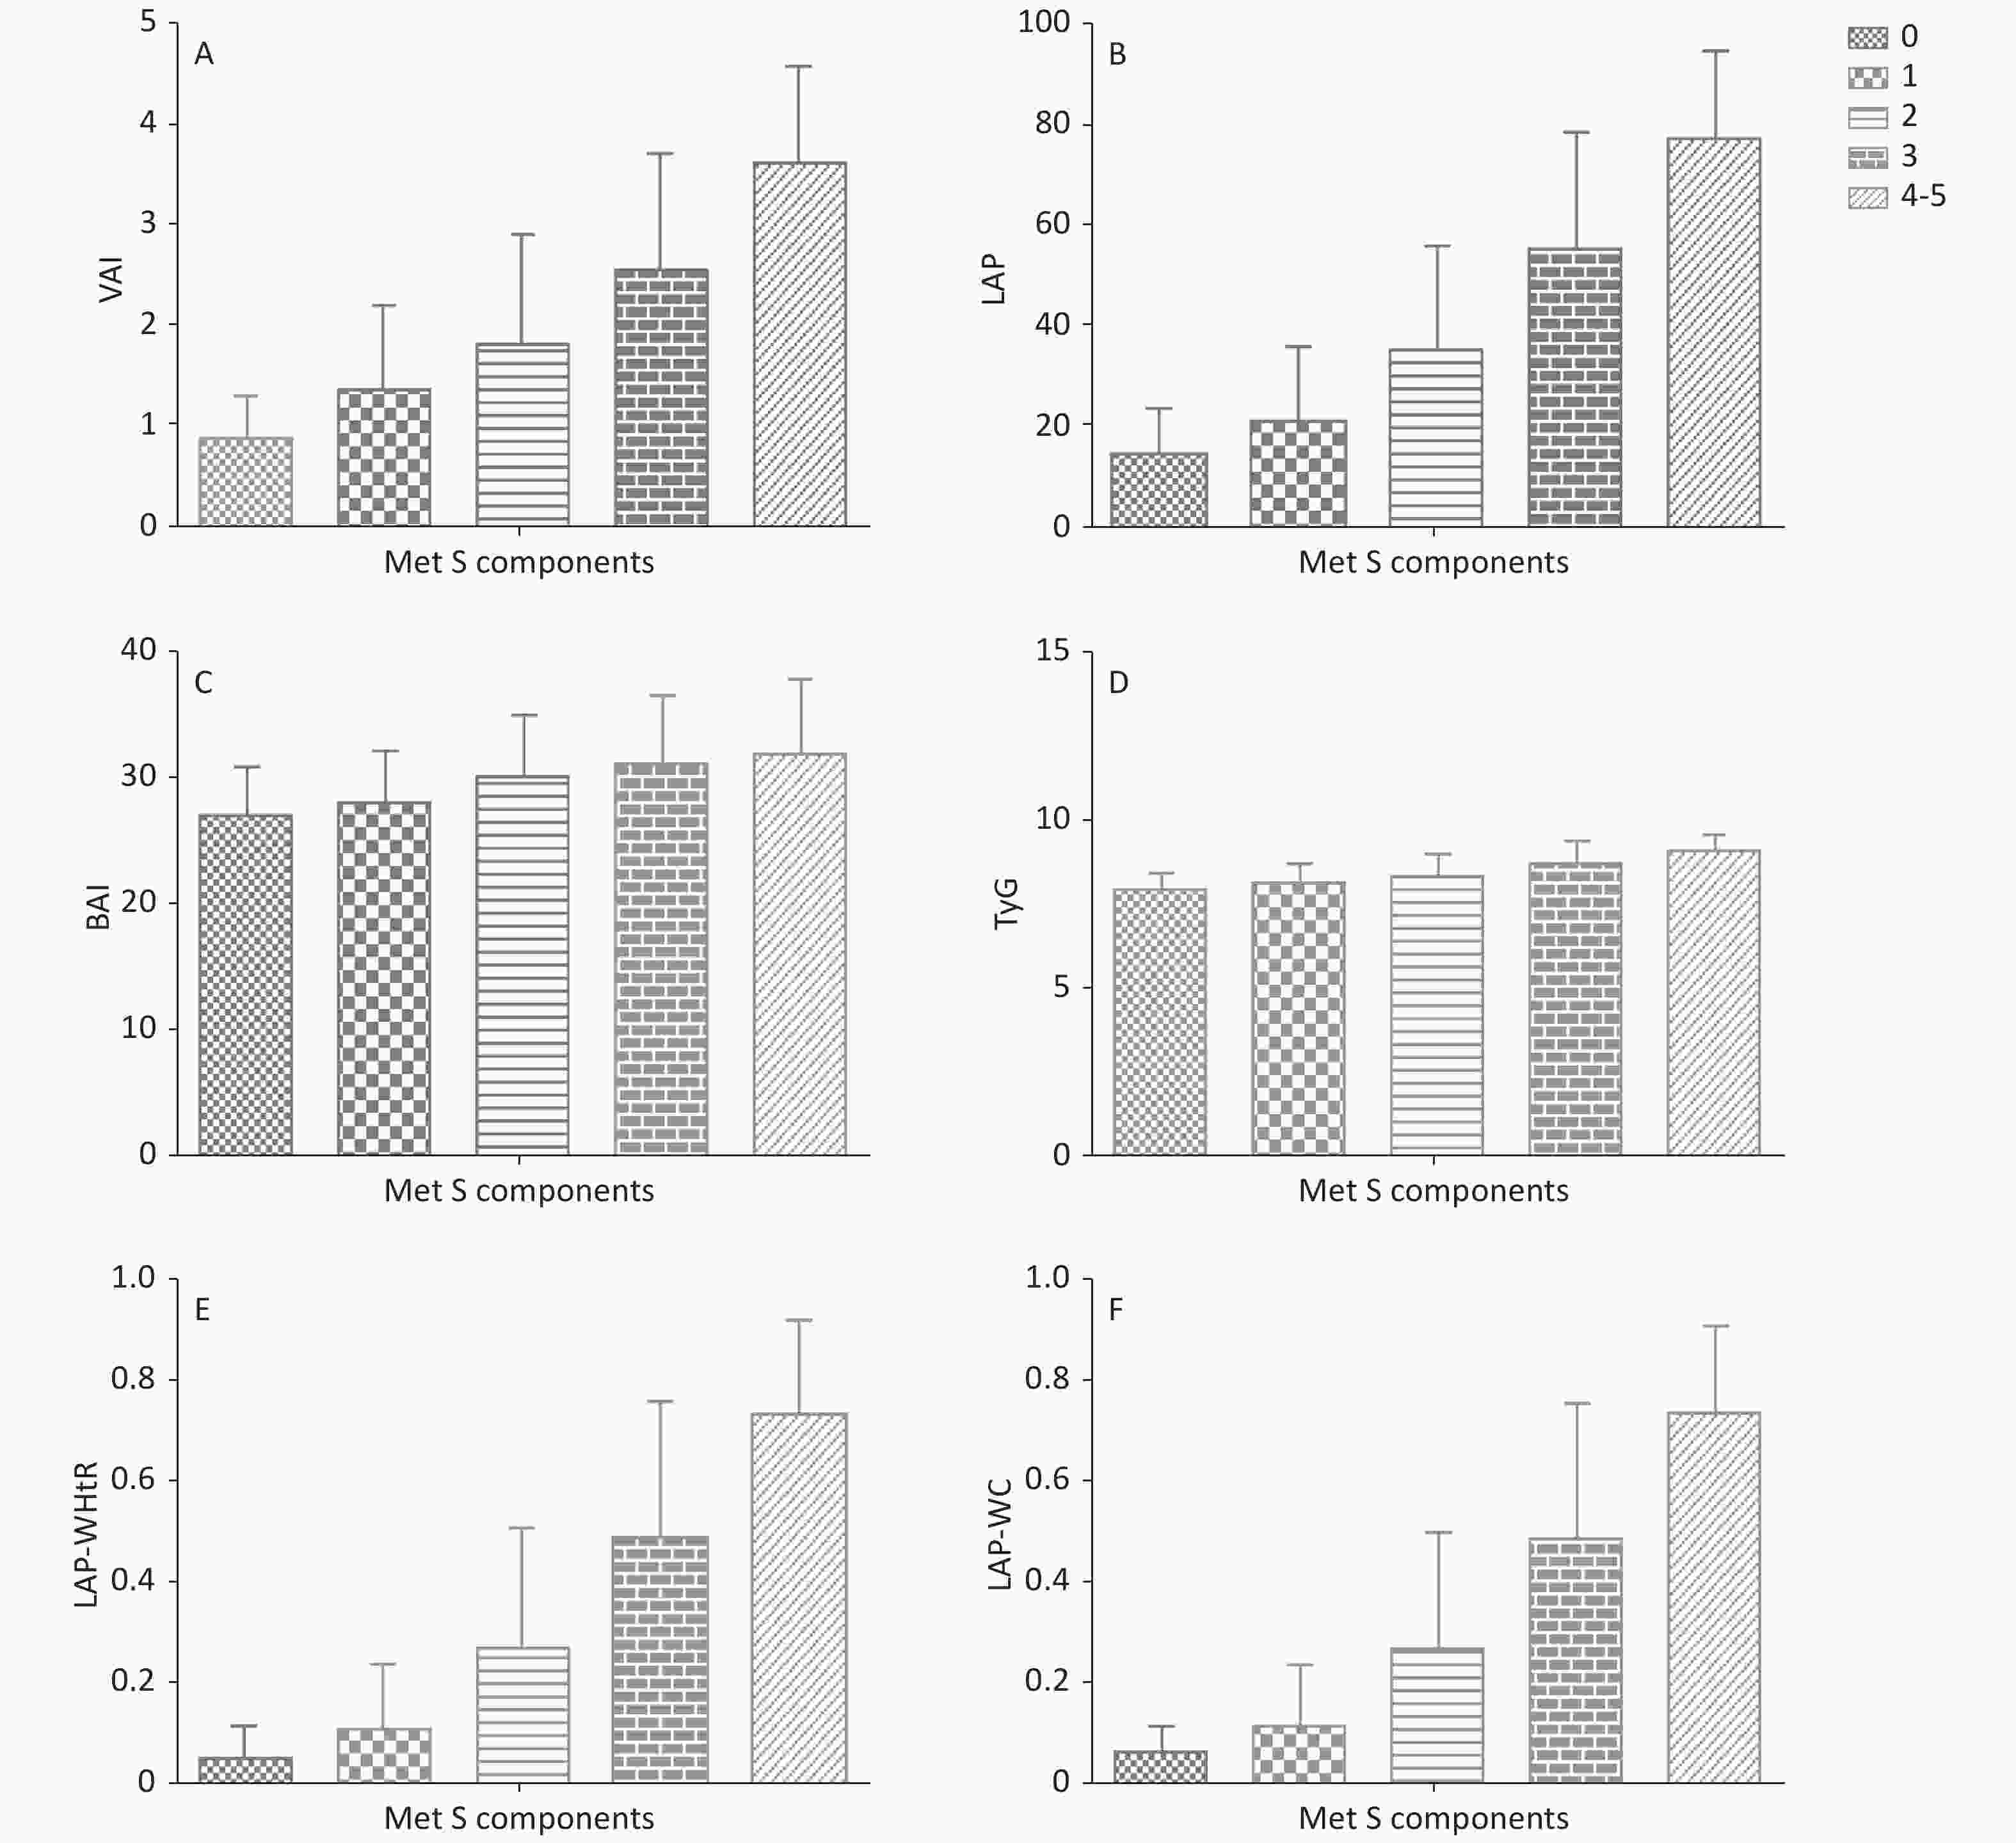
Figure S1. The values of indicators according to metabolic syndrome (MetS) components
Variables FBG (r) TG HDL-C SBP WC LAP 0.202* 0.784* 0.092* 0.357* 0.639* VAI 0.098* 0.720* −0.403* 0.173* 0.162* BAI 0.079* 0.031* 0.051* 0.136* 0.463* TYG 0.446* 0.197* 0.126* 0.416* 0.197* LAP-WC 0.191* 0.597* 0.056* 0.283* 0.752* LAP-WHtR 0.185* 0.555* 0.058* 0.282* 0.752* Note. *Respect P < 0.05. r: the correlation coefficient; VAI: visceral adiposity index; LAP: lipid accumulation product; BAI: body adiposity index; TyG: triglycerides and glucose index LAP-WC: the model of lipid accumulation product and waist circumference; LAP-WHtR: the model of lipid accumulation product and waist-to-height ratio. Table S2. Correlation analysis among indicators with metabolic syndrome components
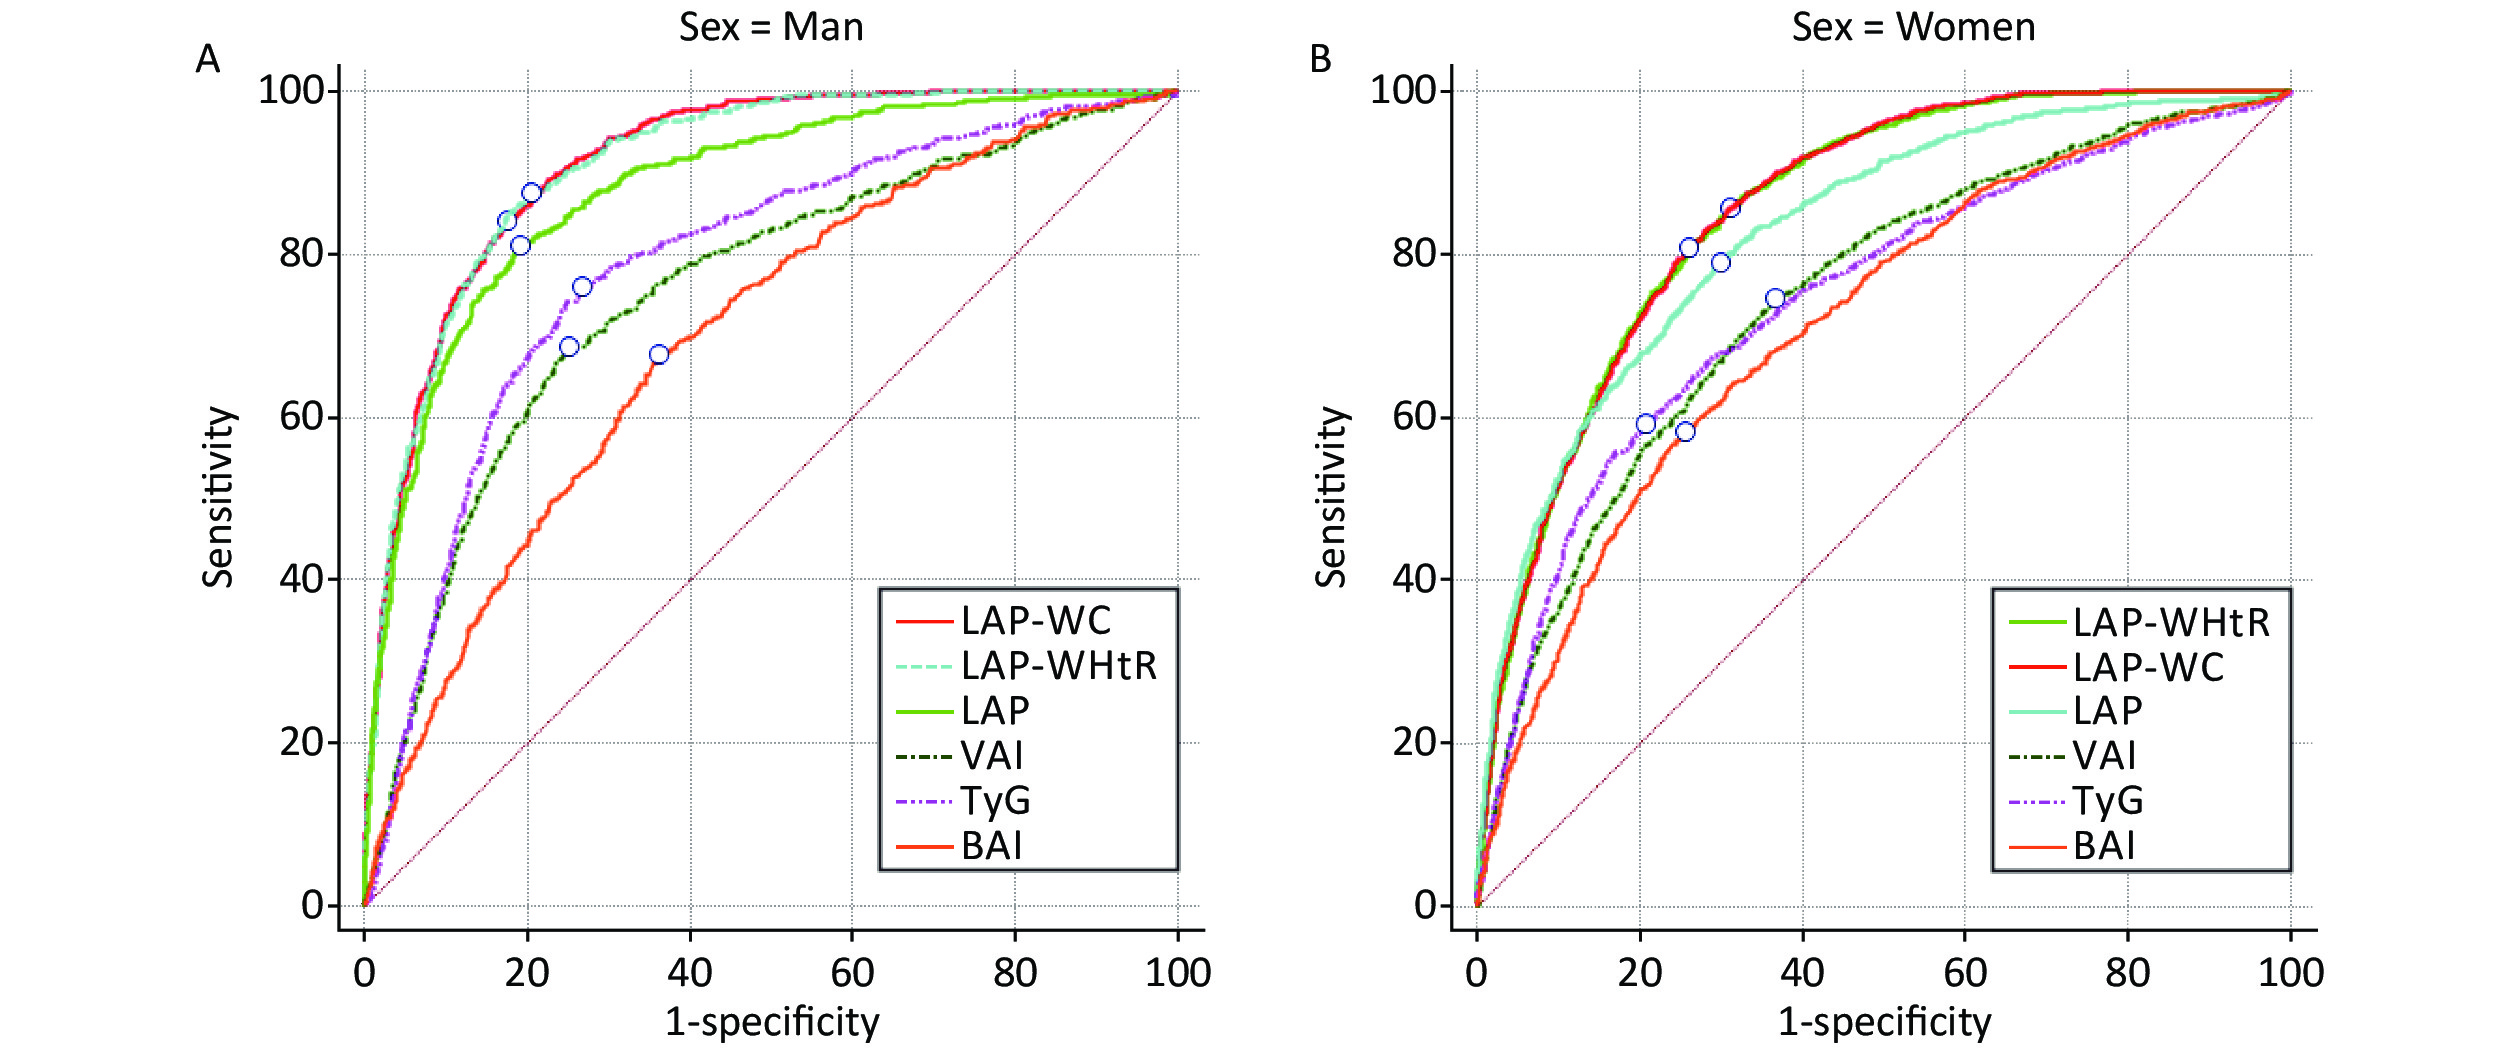
AUC of each variable for the screening of MetS using ROC analyses according to JIS Criteria. In order to analyze each evaluated variable with MetS, the ROC curves of the LAP-WC, LAP-WHtR, VAI, TyG, BAI, and LAP were plotted, and the AUCs were compared (Tables 1−2, and Figure 1). The most appropriate cut-offs of the MetS-JIS criterion in males were 36.77 for LAP (AUC 0.881), 0.214 for LAP-WC (AUC 0.913), and 0.198 for LAP-WHtR (AUC 0.910) (P < 0.001, respectively). The AUC of LAP-WC was higher than LAP. Whereas, in females, the most appropriate optimal cut-offs of the MetS-JIS criterion were 1.520 for VAI (AUC 0.746), 27.25 for LAP (AUC 0.827), 32.12 for BAI (AUC 0.717), 8.634 for TyG (AUC 0.745), 0.129 for LAP-WC (AUC 0.853), and 0.127 for LAP-WHtR (AUC 0.852). According to the AUC of indicators, LAP-WC and LAP-WHtR are both good indicators for predicting MetS in both males and females.
Variables Cut-off Sen (%) Spe (%) Youden’s index AUC (95% CI) P-value Men VAI 1.679 0.684 0.749 0.434 0.755 (0.735, 0.775) < 0.001 LAP 36.77 0.805 0.814 0.619 0.881 (0.867, 0.894) < 0.001 BAI 27.04 0.676 0.639 0.316 0.699 (0.678, 0.719) < 0.001 TYG 8.622 0.760 0.730 0.491 0.786 (0.768, 0.804) < 0.001 LAP-WC 0.214 0.893 0.772 0.666 0.913 (0.903, 0.922) < 0.001 LAP-WHtR 0.198 0.875 0.795 0.671 0.910 (0.900, 0.920) < 0.001 Women VAI 1.520 0.746 0.633 0.379 0.746 (0.731, 0.761) < 0.001 LAP 27.25 0.803 0.688 0.492 0.827 (0.815, 0.839) < 0.001 BAI 32.12 0.583 0.745 0.328 0.717 (0.702, 0.733) < 0.001 TYG 8.634 0.558 0.828 0.386 0.745 (0.729, 0.760) < 0.001 LAP-WC 0.129 0.835 0.713 0.548 0.853 (0.843, 0.863) < 0.001 LAP-WHtR 0.127 0.870 0.675 0.545 0.852 (0.842, 0.863) < 0.001 Note. Sen: sensitivity; Spe: specificity; AUC: the area under the curve; VAI: visceral adiposity index; LAP: lipid accumulation product; BAI: body adiposity index; TyG: triglycerides and glucose index LAP-WC: the model of lipid accumulation product and waist circumference; LAP-WHtR: lipid accumulation product and waist-to-height ratio. Table 1. The cut-off, Sen, Spe, Youden’s Index and AUC of each variable for the screening of MetS in men and women
Variables Man Women Z-value P-value Z-value P-value LAP-WC 1.55 0.121 0.53 0.595 LAP-WHtR LAP-WC 11.05 < 0.001 9.47 < 0.001 LAP LAP-WHtR 9.14 < 0.001 7.89 < 0.001 LAP Note. LAP-WC: the model of lipid accumulation product and waist circumference; LAP-WHtR: the model of lipid accumulation product and waist-to-height ratio; LAP: lipid accumulation product. Table 2. Comparison of the area under the curve (AUC) of LAP-WC, LAP-WHtR, and LAP using Z test
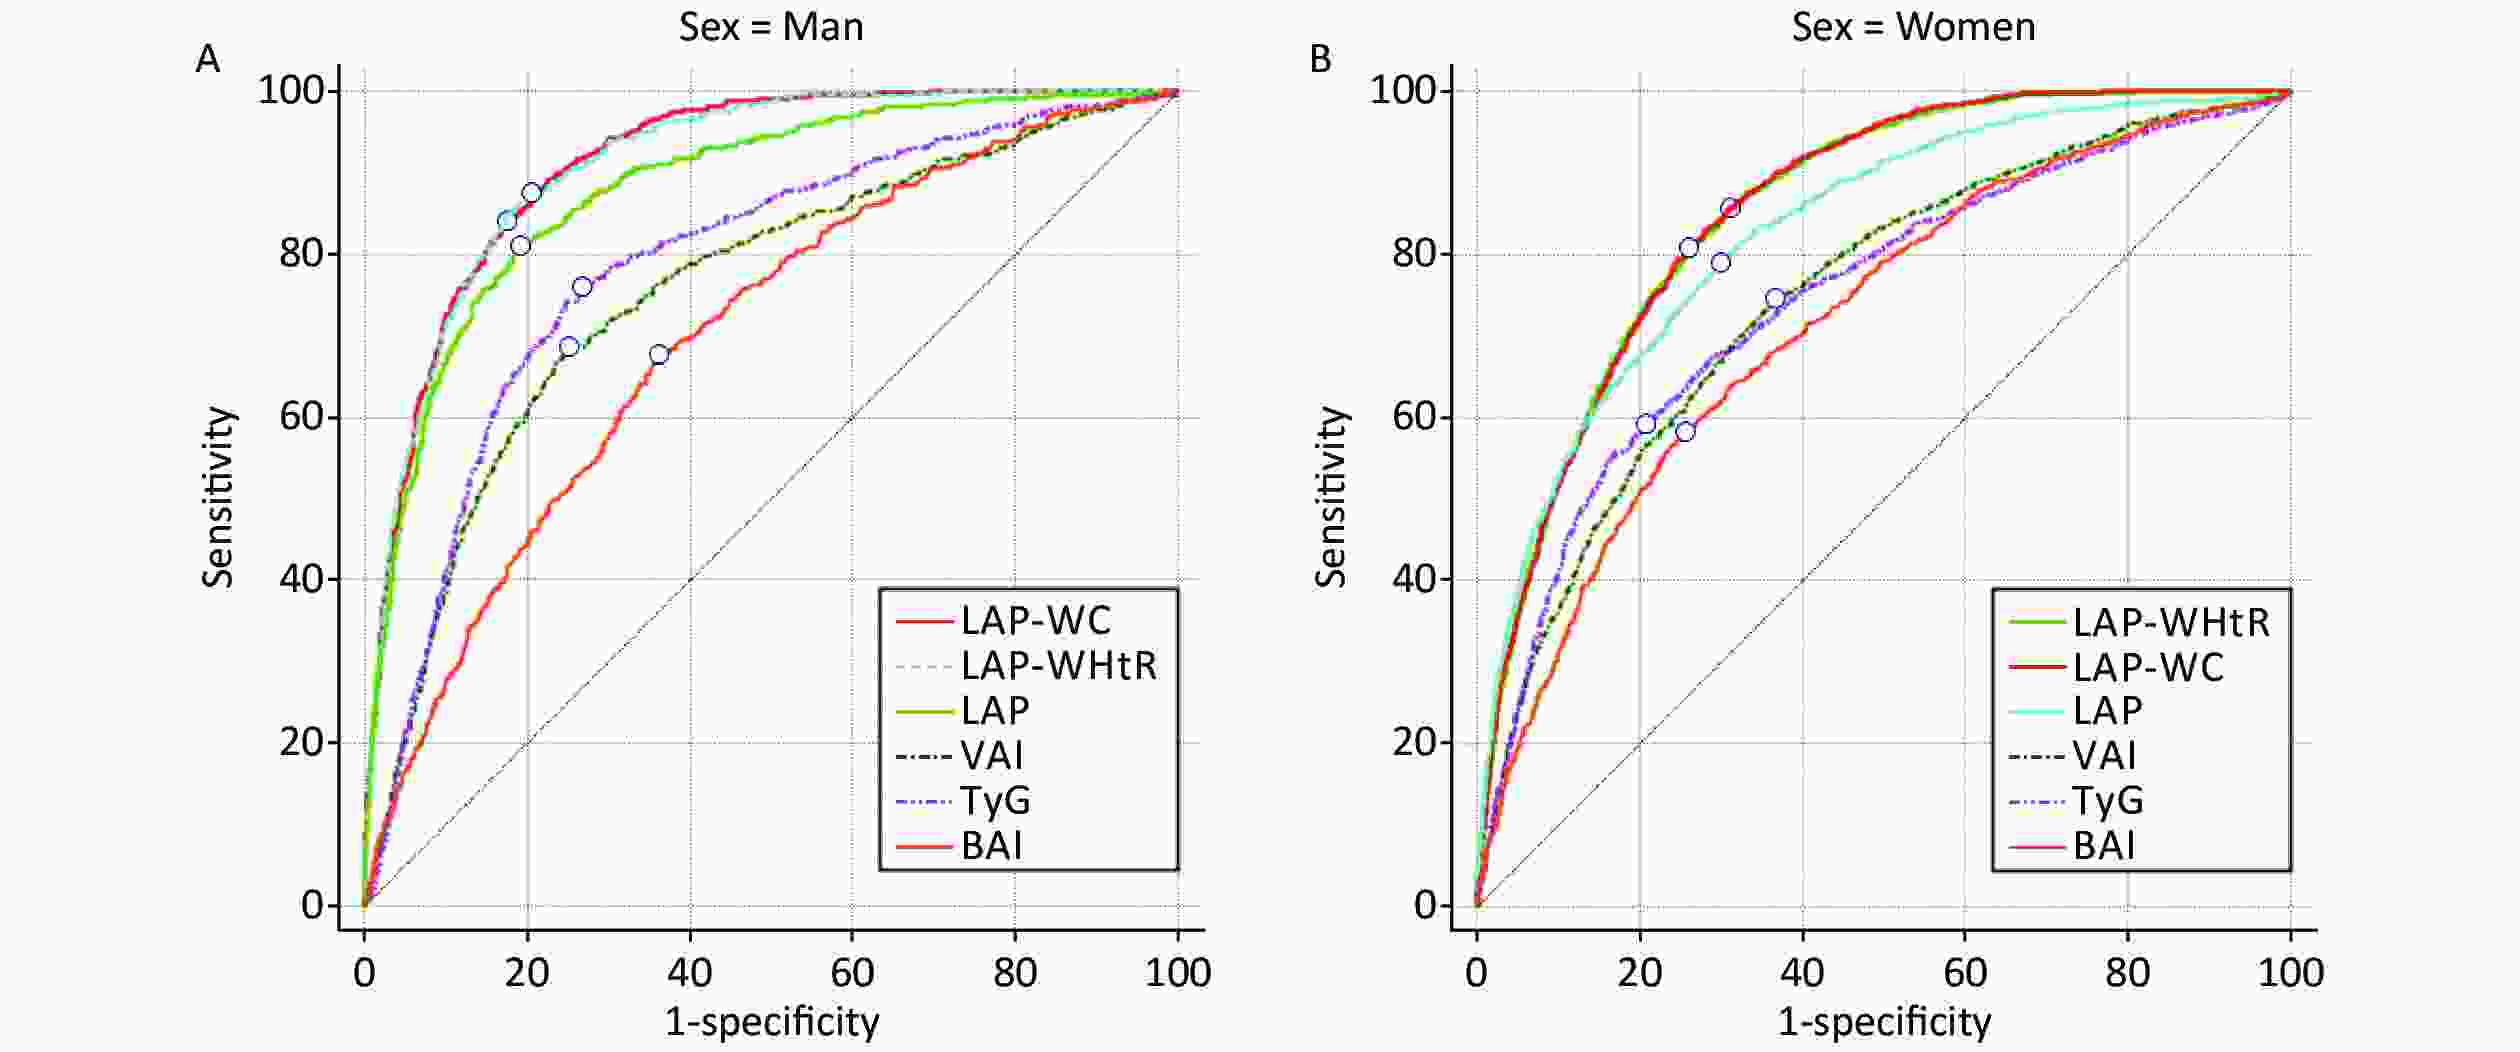
Figure 1. ROC curves of each indicators for the screening of MetS in men (A) and women (B) according to the IDF. The circles indicate the positions of the maximum Youden’s Index and the optimal cut-off.
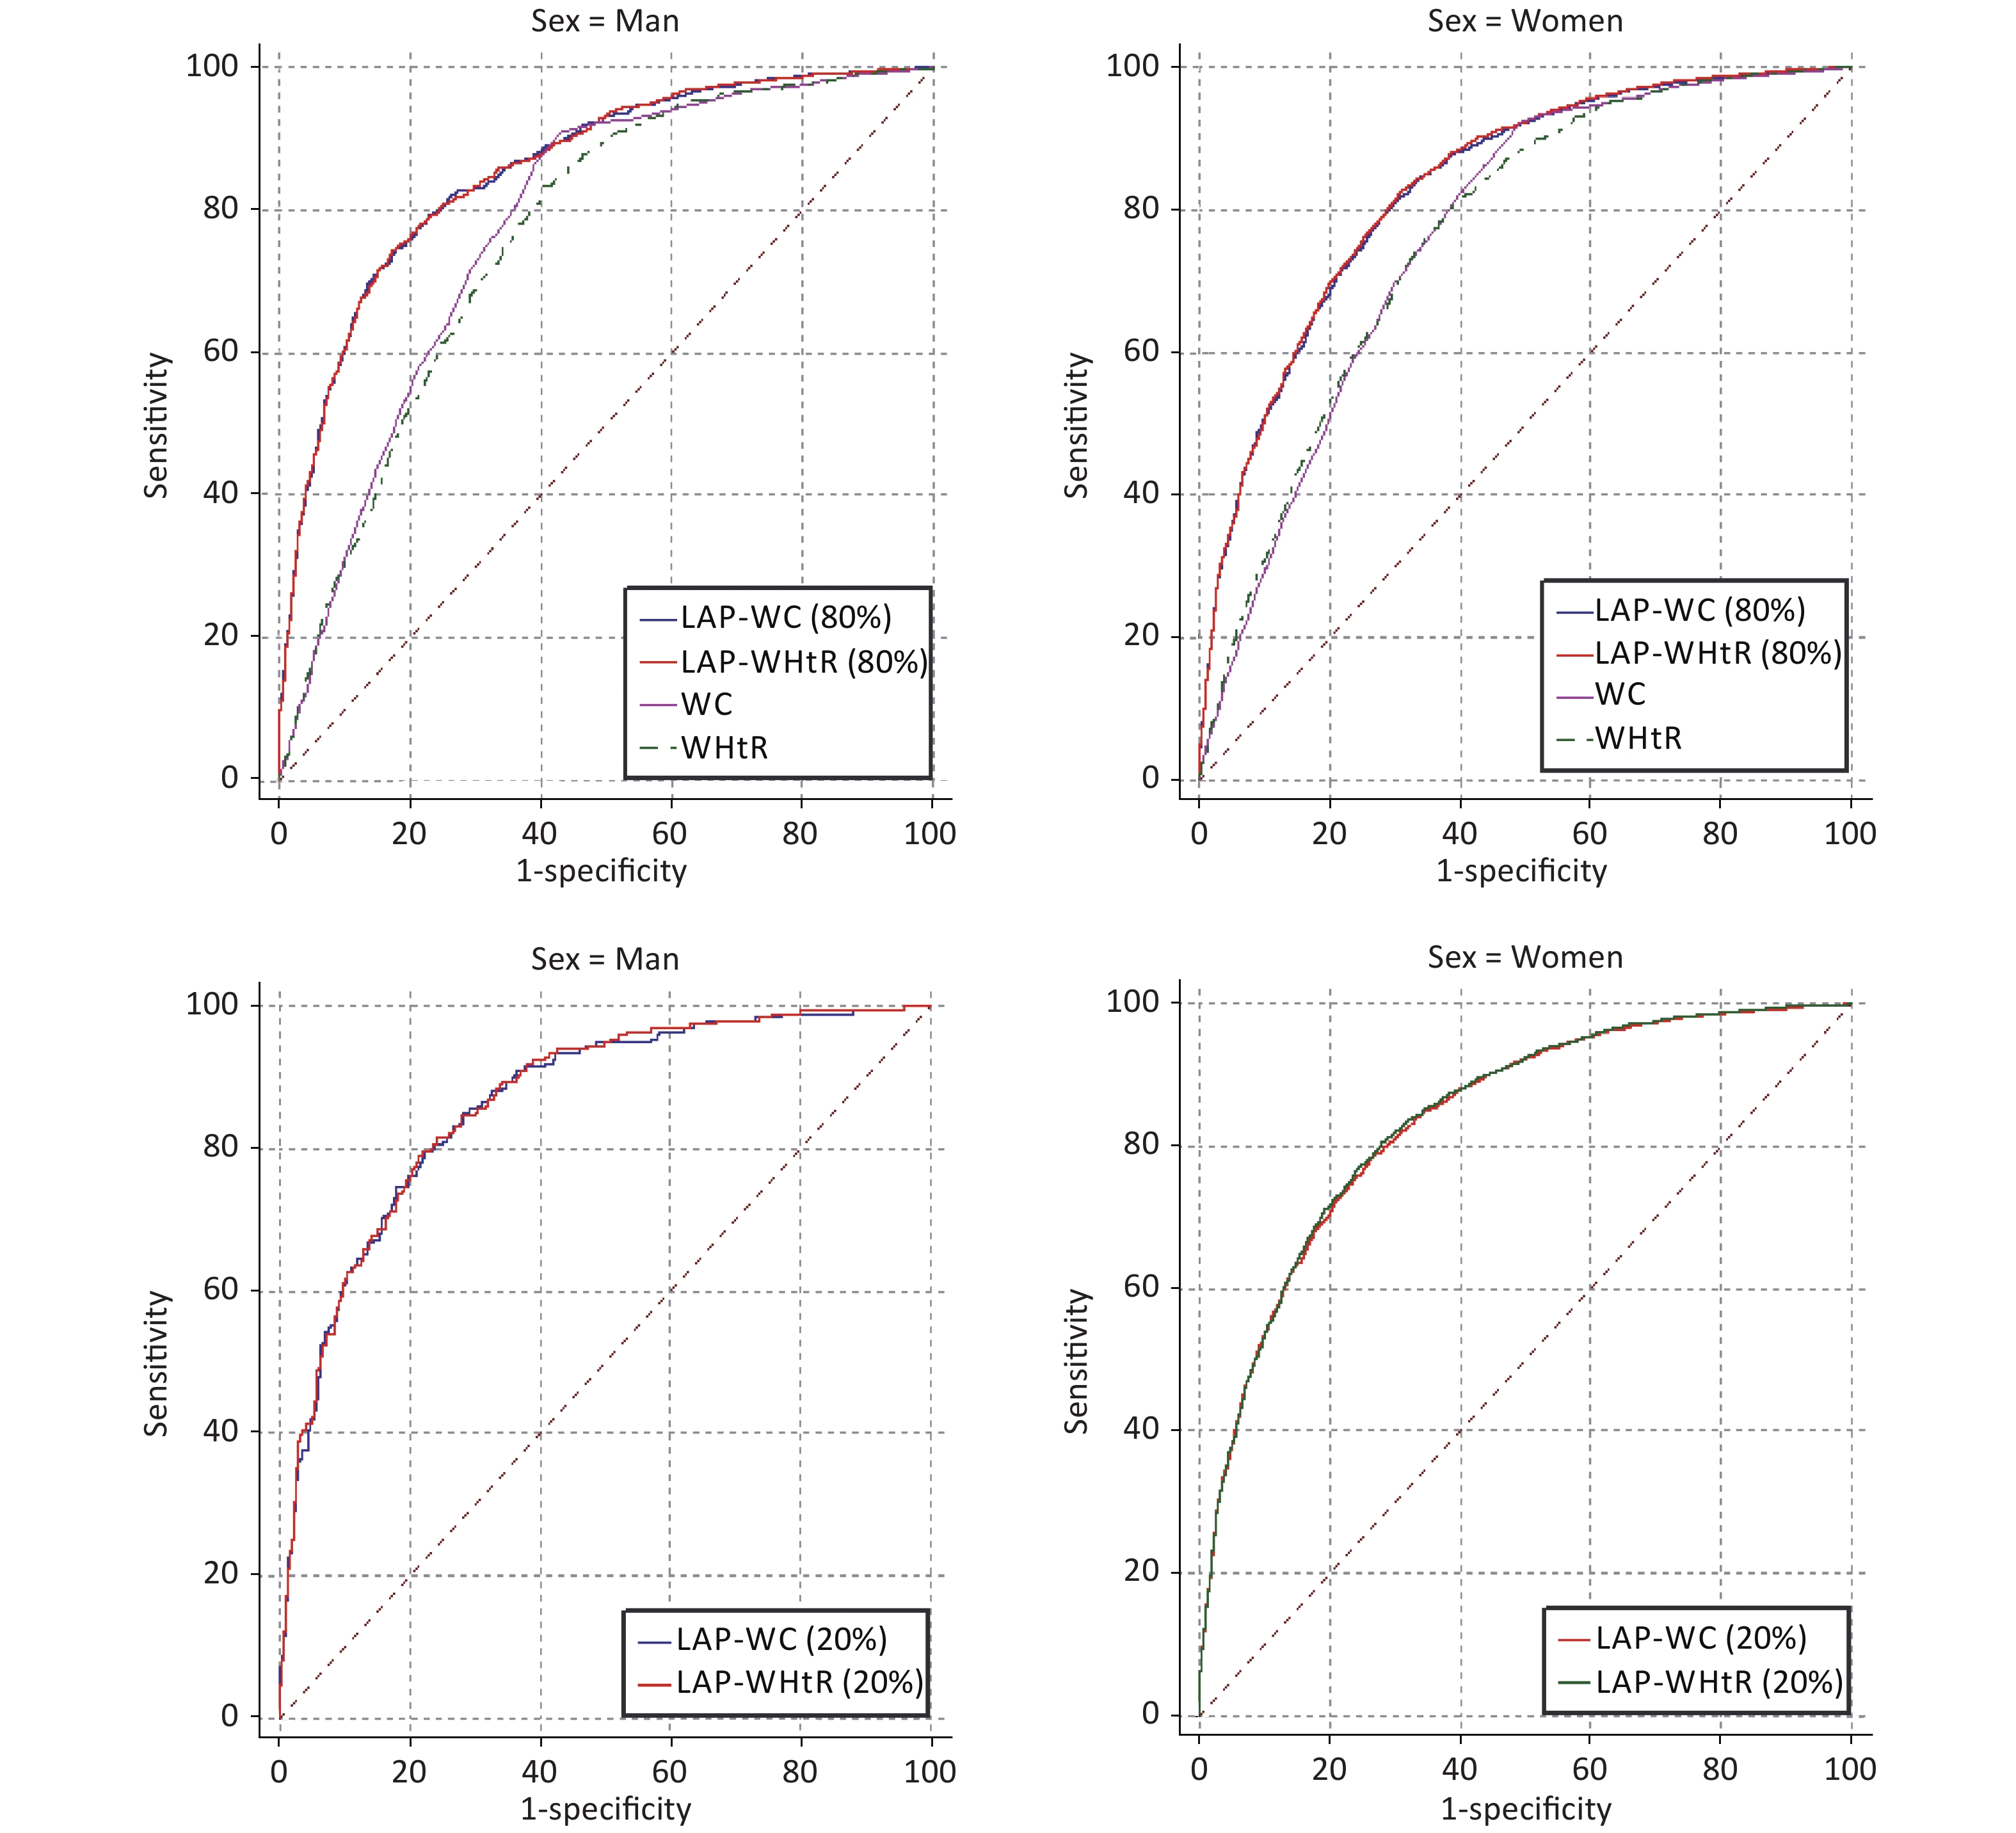
In order to verify the effect of the model, the 80% of samples used to establish logistic regression model to generate new probability variables, the remaining 20% of samples used to compare prediction ability. (Supplementary Table S3 and Supplementary Figure S2 available in www.besjournal.com). The results still shows that LAP-WC and LAP-WHtR are both good indicators for predicting MetS in both males and females. The test results show that the effect of the model we built is very stable and has good predictive ability. It is known that WC, WHtR and LAP are usually used as effective indicators of MetS. The probability variables LAP-WC and LAP-WHtR generated by the Logistic regression prediction model of LAP and WC or WHtR will theoretically also be good predictors of MetS. Our research confirms this.
Variables Cut-off Sen (%) Spe (%) Youden’s Index AUC (95% CI) P-value Men WC 84.9 0.909 0.568 0.477 0.775 (0.759,0.792) < 0.001 WHtR 0.509 0.836 0.591 0.427 0.761 (0.745,0.778) < 0.001 LAP-WC (20%) 0.247 0.797 0.775 0.572 0.862 (0.834,0.890) < 0.001 LAP-WHtR (20%) 0.243 0.792 0.785 0.577 0.864 (0.837,0.892) < 0.001 LAP-WC (80%) 0.274 0.747 0.819 0.566 0.855 (0.841,0.870) < 0.001 LAP-WHtR (80%) 0.268 0.743 0.826 0.569 0.856 (0.842,0.870) < 0.001 Women WC 79.9 0.92 0.535 0.455 0.770 (0.756,0.785) < 0.001 WHtR 0.518 0.813 0.611 0.424 0.766 (0.751,0.780) < 0.001 LAP-WC (20%) 0.180 0.799 0.686 0.485 0.822 (0.797,0.848) < 0.001 LAP-WHtR (20%) 0.175 0.828 0.662 0.49 0.823 (0.797,0.848) < 0.001 LAP-WC (80%) 0.194 0.792 0.722 0.514 0.828 (0.814,0.841) < 0.001 LAP-WHtR (80%) 0.198 0.812 0.709 0.521 0.829 (0.816,0.842) < 0.001 Note. Sen: sensitivity; Spe: specificity; AUC: the area under the curve; WC: waist circumference; WHtR: waist-to-height ratio. LAP-WC: the model of lipid accumulation product and waist circumference; LAP-WHtR: lipid accumulation product and waist-to-height ratio. Table S3. The cut-off, Sen, Spe, Youden’s Index and AUC of each variable for the testing of MetS in men and women
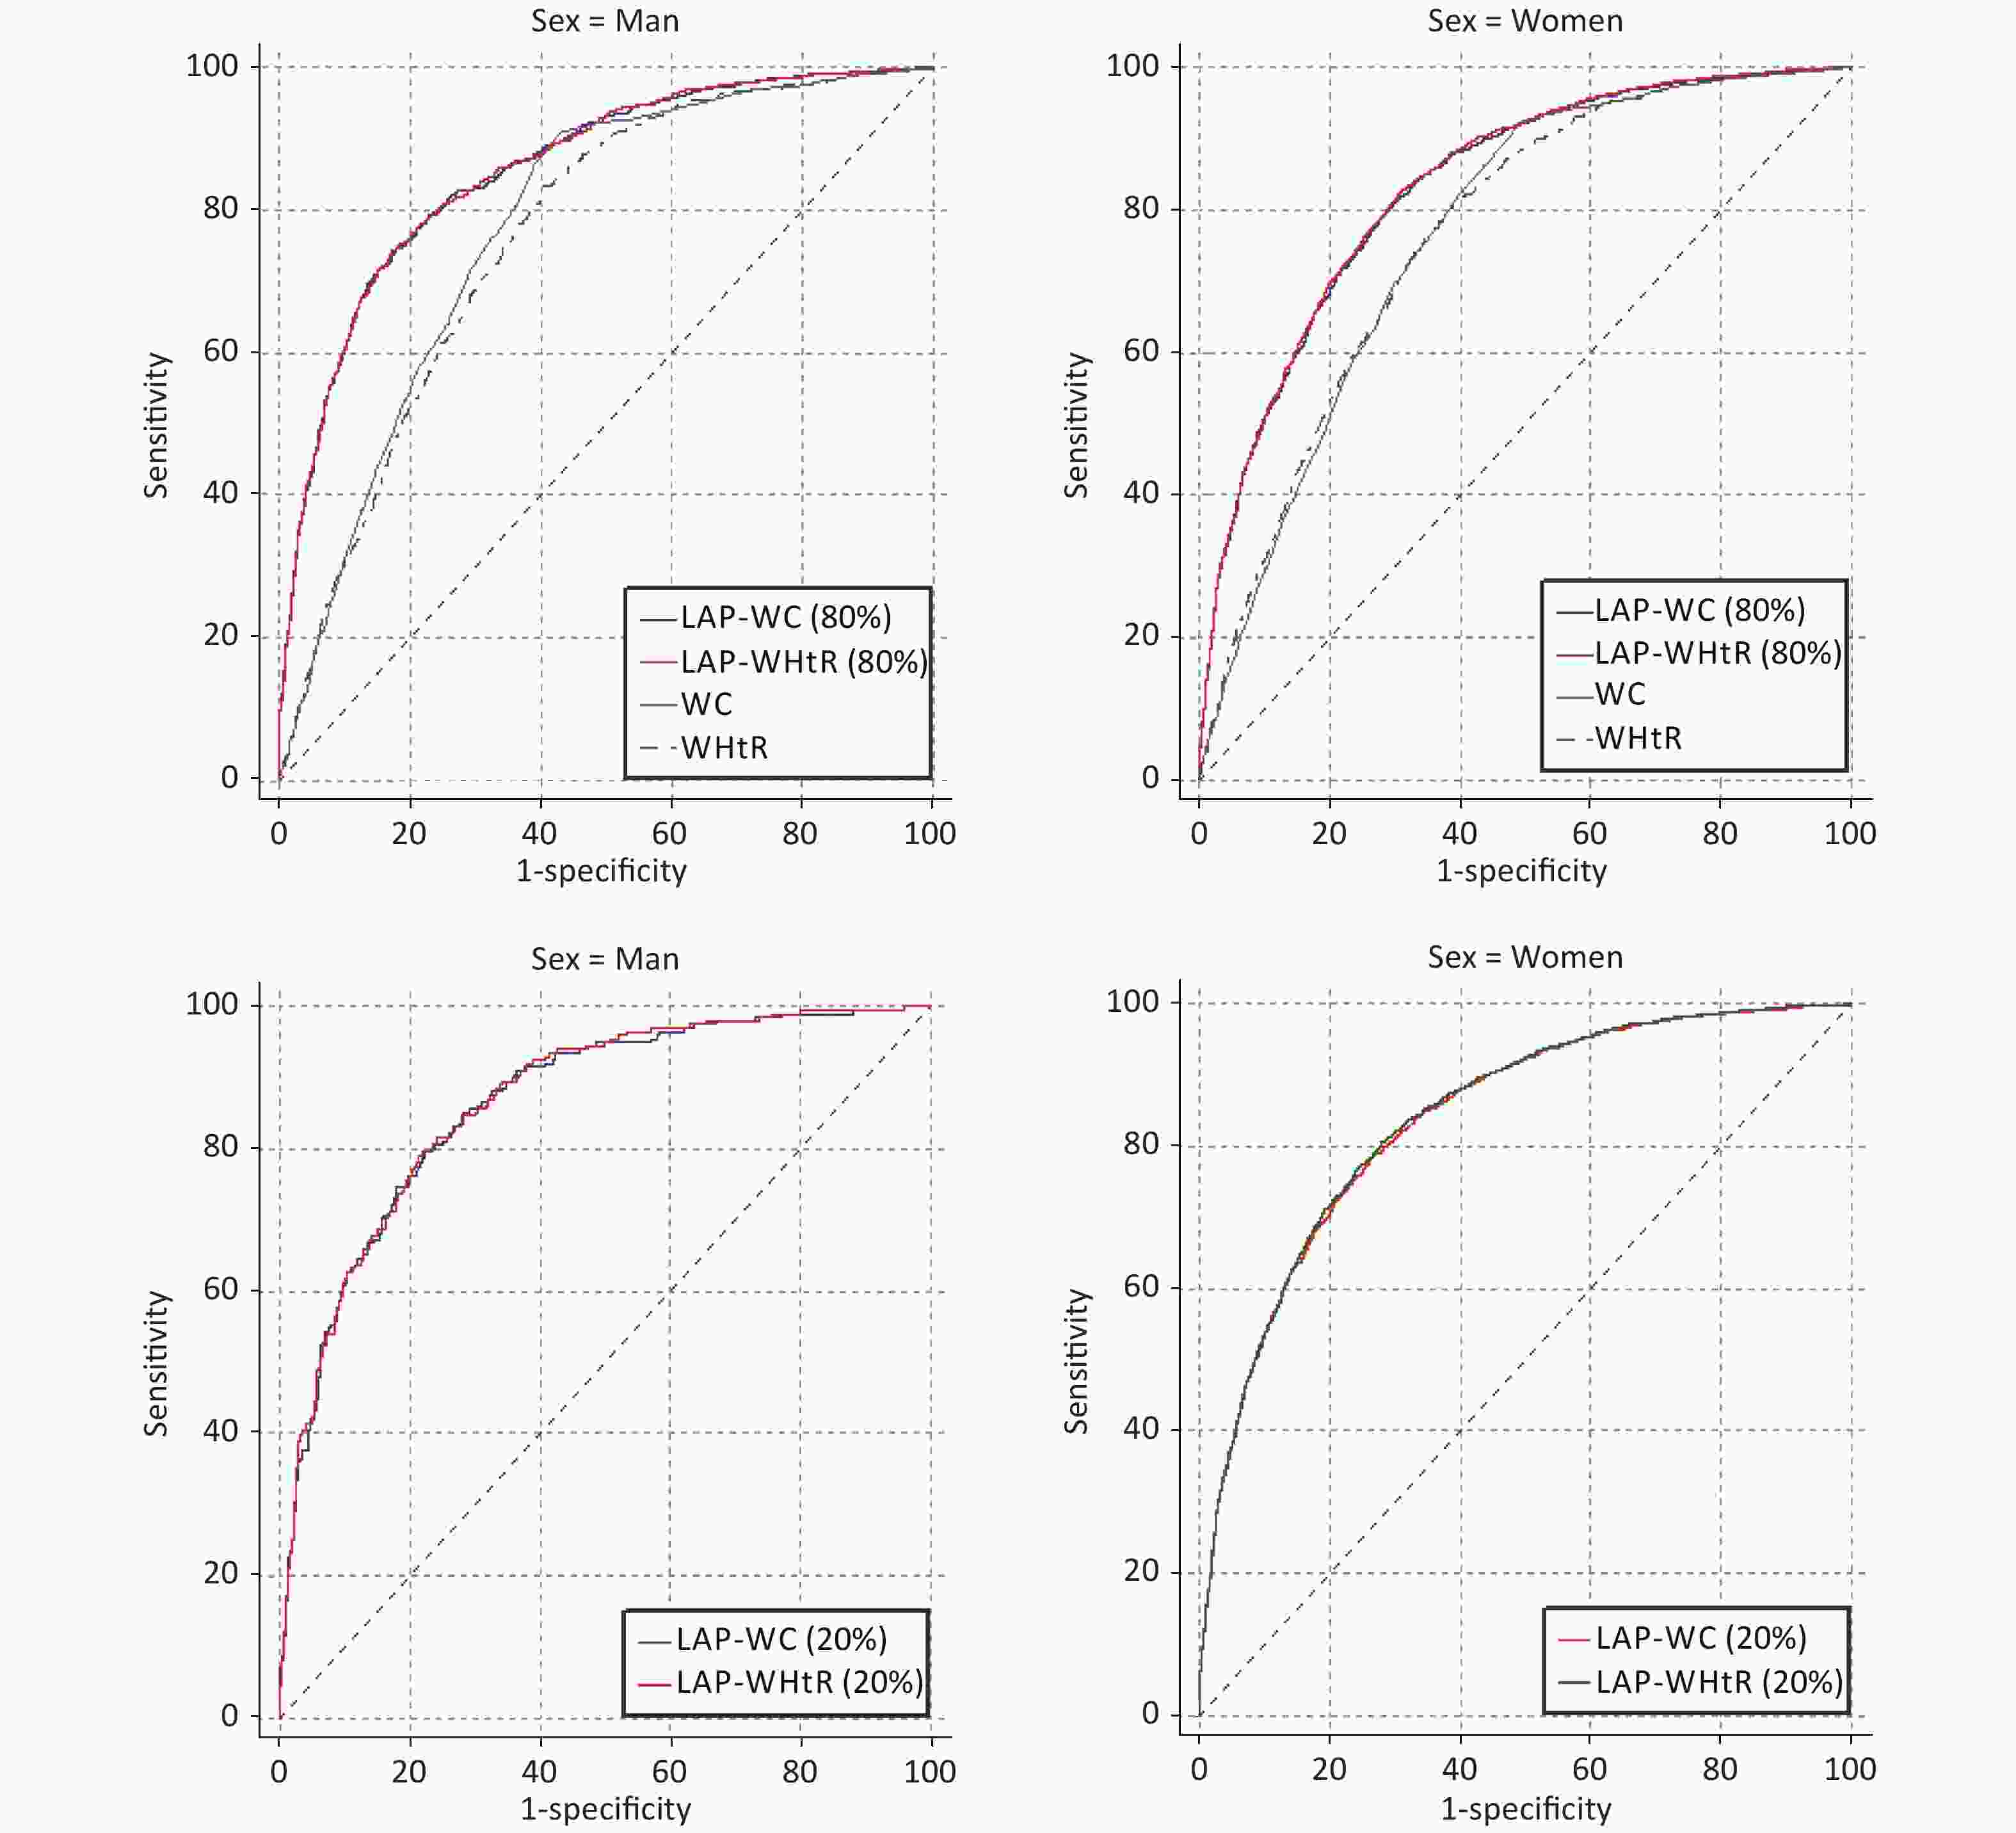
Figure S2. ROC curves of each indicators for the testing of MetS in men and women according to the IDF
LAP, as an indicator of central obesity, is an emergent predictor of central lipid accumulation linked to diabetes risk and cardiovascular diseases. Several reports have confirmed the diagnostic power of LAP for MetS[6]. The present study shows that LAP has the ideal predictive value for MetS, compared with VAI, BAI, TyG. More importantly, some reports suggested that LAP may be generally applied to the Chinese population[7].
Studies by Amato et al. established VAI as a powerful clinical marker of abdominal fat function to be an excellent indicator of cardiometabolic diseases[8]. Since then, many articles have pointed out that VAI has a significant relationship with MetS, and the ability of VAI to screen for MetS is also particularly high. Interestingly, in the present study, we found that the screening ability of VAI is higher than BAI, but it is lower than the LAP and TyG.
TyG is a simple marker for screening insulin resistance (IR) and could be a powerful indicator for predicting the risk of a cardiovascular event. It is well known that MetS is closely related to IR. Also, some articles showed that TyG was a reliable surrogate marker for identifying MetS[9]. The present study confirmed this point, but TyG was lower than LAP. The reason may be due to the absence of WC, a significant component for MetS, which will decrease the accuracy for predicting MetS. Especially for Chinese people, as there is a difference in lifestyle habits, which might result in the difference in abdominal fat distribution.
Based on the hip circumference and height, BAI was developed with a purpose that this index would provide a direct estimate of body adiposity. Some studies have shown that the VAI and BAI perform better than WHtR for the prediction of MetS. Moushira found that BAI is a practical predictor for MetS demonstrating satisfactory diagnostic accuracy among Egyptian women and can be used in addition to WHR, WHtR, and BMI for identifying MS[10]. However, compared with LAP, VAI, and TyG, in our study, BAI showed the lowest potential. The reason may be a lack of central obesity components of MetS. Hence, BAI alone cannot be used to differentiate between subcutaneous and visceral adipose tissues.
The present study has several strengths, the most novel one being the use of a logistic regression model to combine the central obesity index with the abdominal obesity index for screening MetS. To our knowledge, this is the first large-scale population-based study to compare the screening ability of the anthropometric and atherogenic indices for MetS according to the JIS criteria. The study also demonstrated that LAP-WC was a better indicator for the screening of MetS and provided the cut-offs of the index stratified according to gender. In addition, we also tested the screening ability of other indicators, which further showed that the screening ability of the model that we selected was relatively robust.
At the end of the research, we use the 80% of samples used to establish logistic regression model to generate new probability variables, the remaining 20% of samples used to compare prediction ability. The test results show that the effect of the model we built is very stable and has good predictive ability.
Nevertheless, there are some limitations to the study. Firstly, a cross-sectional design was used. Future prospective studies examining should consider the AUC value for improved LAP to evaluate its utility in predicting MetS and risks of cardiovascular diseases and diabetes. Secondly, there are three criteria for MetS, of which only one criterion was chosen.
Improved LAP was found to be an accurate and simple method for predicting the risk of MS in xinjiang people. It had significantly higher predictability than other adiposity measures tested. The study suggests that LAP-WC and LAP-WHtR are both good indicators for screening MetS and could be effectively used by clinicians.
No potential conflicts of interest were disclosed.
Conceived and designed the experiments: YAO Ping, MA Long, LIU Tao. Performed the experiments: DING Yu Song, ZHANG Xiang Hui, MA Ru Lin, GUO Heng. Analyzed and interpreted the data: DING Yu Song, LI Yang. Wrote the paper: DING Yu Song, LI Yang.
The Improved Lipid Accumulation Product is an Accurate Index for Predicting Metabolic Syndrome in the Xinjiang Population
doi: 10.3967/bes2021.070
- Received Date: 2020-08-13
- Accepted Date: 2021-01-21
| Citation: | DING Yu Song, LI Yang, ZHANG Xiang Hui, MA Ru Lin, GUO Heng, MA Long, LIU Tao, YAO Ping. The Improved Lipid Accumulation Product is an Accurate Index for Predicting Metabolic Syndrome in the Xinjiang Population[J]. Biomedical and Environmental Sciences, 2021, 34(6): 503-507. doi: 10.3967/bes2021.070

|


 Quick Links
 DownLoad: