


-
T he novel coronavirus disease 2019 (COVID-19) poses a major public health threat and is associated with an average mortality of 6.57%. Most patients with COVID-19 experience mild symptoms but others develop severe illness. Patients with mild symptoms present flu-like symptoms such as cough, fever, and sometimes fatigue. On the other hand, if patients fail to undergo timely treatment, they may progress to severe disease, which mostly presents with respiratory distress and/or hypoxemia a week after onset and may rapidly progress to acute respiratory distress syndrome, septic shock, uncorrectable metabolic acidosis, bleeding, coagulation dysfunction and multi-organ failure in severe cases. A recent large multi-center study showed a mortality rate as high as 49% in severe and critically ill patients[1,2]. Compared to non-severe COVID-19, severe COVID-19 is characterized by a longer hospital stay and higher mortality. A number of studies have focused on the early identification of risk factors in patients who are likely to develop severe illness[3,4], such as older age, neutrophilia, neutrophil-to-lymphocyte ratio (NLR), and elevated D-dimer levels. Nevertheless, there is a lack of validated indicators from a large number of variables screened to distinguish severe patients. Furthermore, studies from infectious disease hospitals with large numbers of severely and critically ill patients are better able to distinguish severe patients. Therefore, there is an urgent need to develop an accurate and easy scoring system, as well as define possible protective variables[5-8].
In the present study, we developed a risk prediction score system that characterizes patients who are at risk of developing severe illness. This report was based on a cohort study in JinYinTan Hospital, Wuhan's designated hospital for the treatment of severe COVID-19 patients.
-
We conducted a retrospective cohort study involving COVID-19 patients, and characterized their demographic, clinical, and laboratory data between January 25, 2020, and March 31, 2020, at the JinYinTan Hospital. We included 188 moderate, 90 severe and 17 critical COVID-19 patients.
-
Nose and throat swab specimens or nasopharyngeal aspirates collected from the patients were tested for COVID-19 using positive high-throughput sequencing or real-time reverse-transcriptase polymerase chain reaction (RT‐PCR).
Demographic information, medical history, and clinical symptoms were recorded on admission. Imaging results, laboratory findings such as partial arterial oxygen pressure, oxygen saturation, complete blood counts (white blood cells, lymphocytes, monocytes, eosinophils, NLR, hemoglobin levels, and platelet counts), serum biochemical tests (liver and kidney function and lactate dehydrogenase) as well as coagulation indicators (D-dimer levels, prothrombin time, and activated partial thromboplastin time) were routinely conducted in all patients. Demographic characteristics such as age and sex were also recorded. In addition, medical history including cardiovascular disease, digestive system disease, endocrine system disease, malignant tumor, nervous system disease, or respiratory system disease was also recorded. Clinical parameters and symptoms measured included temperature, respiratory rate, heart rate, cardiac arrhythmia, blood pressure, fever, chest pain, palpitation, dyspnea, cough, and stridor, fatigue, xerostomia, nausea and vomiting, diarrhea, and anorexia.
The data were extracted from hospital information systems and laboratory information systems using a standardized data collection form. A group of experienced physicians determined the frequency of examinations, reviewed and cross-checked the data. The data were input double-blind by two physicians and were scrutinized by another 2 independent physicians.
-
The clinical spectrum of COVID-19 pneumonia ranged from the mild group, moderate group, severe group to the critical group, according to the Chinese management guideline for COVID-19; new coronavirus pneumonia diagnosis and treatment plan (trial version 7) developed by the National Health Committee of the People's Republic of China (
http://www.nhc.gov.cn/ ). The clinical spectrum used was as follows: (1) Mild: mild clinical symptoms with imaging negative for pneumonia. (2) Moderate: respiratory symptoms and fever, with imaging showing pneumonia. (3) Severe: meeting any of the following: a) shortness of breath, respiratory rate ≥ 30 breaths/min; b) during resting-state, oxygen saturation without oxygen uptake ≤ 93%; c) arterial partial pressure of oxygen (PaO2) / oxygen concentration ≤ 300 mmHg (1 mmHg = 0.133 kPa); d) progressive worsening of clinical symptoms, lung imaging findings showed rapid progression > 50% during the past 24–48 hours. 4) Critical: meeting any of the following: a) respiratory failure, and the need for mechanical ventilation; b) shock; c) multisystem organ failure, and urgent admission to the intensive care unit.In our study, the severe group included severe and critical cases; in addition, given that no mild cases were enrolled, the non-severe group only included moderate cases.
Chest X-ray and chest computed tomography (CT) abnormalities were scored as follows: 0: Bilateral pneumonia with no abnormal lesions (unilateral or bilateral pneumonia); 1: Unilateral pneumonia with multiple mottling and ground-glass opacities; 2: Bilateral pneumonia with multiple mottling and ground-glass opacities.
-
We initially enrolled all 302 COVID-19 patients at the JinYinTan Hospital for the selection of variables and development of the risk score system. Categorical and continuous variables were represented by number (%) and by median (interquartile range), respectively. We applied the Chi-square test or Wilcoxon rank sum test to compare the differences between two groups.
Least absolute shrinkage and selection operator (LASSO) regression and 10-fold cross-validation were used to minimize the potential collinearity of variables while multiple logistic regression analysis was used to select the independent risk factors which influenced the results. The statistically significant variables were then used to establish a nomogram. In the case of P < 0.05 for non-linearity, the restricted cubic spline (RCS) was drawn to demonstrate the relationship between the variable and the risk.
-
A receiver operating characteristic curve (ROC) was drawn to measure the optimal clinical value of the prediction probability. The accuracy of COVID-19 risk factors was assessed by the area under the ROC (AUC), calibration, decision curve, net reclassification improvement and clinical impact curve. An AUC < 0.5 indicated meaningless prediction, an AUC of 0.5–0.7 indicated lower accuracy prediction, while an AUC > 0.7 indicated higher prediction accuracy. Integrated discrimination improvement was applied to evaluate the improvement of standard CURB-65 in our model. Analysis was performed with R software (version 3.6.2, the R Foundation for Statistical Computing, Vienna, Austria). SPSS (version 22.0, Statistical Product and Service Solution, IBM SPSS Inc., IL, USA), and a P-value < 0.05 was considered statistically significant.
For internal validation of the accuracy of the estimates, we used the training set in the 10-fold cross-validation, and used the validation set for external validation.
-
Out of 302 patients, 8 patients were excluded due to missing data, 90 patients (30.5%) were diagnosed with severe illness, and 17 (5.8%) patients with critical illness, while the remainder (188/295, 63.7%) had moderate illness based on the new coronavirus pneumonia diagnosis and treatment plan (trial version 7; National Health Committee of the People's Republic of China). Our data demonstrated an overall mortality rate of 5.08%. Overall, the median age of patients in the study was 60 (49−68) years, and the median age in the non-severe and severe group was 57.0 (46.7−67.0) years and 62.5 (55.7−70.0) years, respectively, and the difference was statistically significant (P = 0.002). One hundred and sixty-four (55.6%) patients were male and showed a significant difference between the moderate, severe and critical groups (P < 0.001). There was no significant difference in cardiovascular disease, digestive system disease, endocrine system disease, malignant tumor, nervous system disease, or respiratory system disease. Fever, cough, and tachypnea were the most common clinical symptoms. Laboratory findings are shown in Table 1.
Clinical symptoms Points Confusion 1 Urea > 7 mmol/L 1 Age over 65 years 1 Respiratory rate ≥ 30 1 Systolic blood pressure ≤ 90 mmHg or diastolic blood pressure ≤ 60 mmHg 1 Table S1. CURB-65 scoring system
Variables All patients (n = 294) Mild group (n = 188) Severe group (n = 106) P Age, years 60.00 (49.00−68.00) 57.00 (46.00−67.00) 62.50 (55.75−70.00) 0.002 Gender Female 131 (44.6) 98 (52.1) 33 (31.1) 0.001 Male 163 (55.4) 90 (47.9) 73 (668.9) Signs and symtons Fever 93 (31.6) 62 (33.0) 31 (29.2) 0.509 Cough 176 (60.1) 113 (60.1) 63 (60.0) 0.984 Tachypnea 79 (26.9) 42 (22.3) 37 (34.9) 0.020 Muscle soreness 2 (0.7) 0 2 (1.1) 0.539 Headache 3 (1.0) 3 (1.6) 0 0.555 Sore throat 4 (1.4) 3 (1.6) 1 (0.9) > 0.999 Chest pain 1 (0.3) 1 (0.5) 0 > 0.999 Diarrhea 5 (1.7) 3 (1.6) 2 (1.9) > 0.999 Nausea and vomiting 2 (0.7) 1 (0.5) 1 (1.0) 1.000 Vital signs Body temperature, °C 36.70 (36.50−37.20) 36.70 (36.50−37.50) 36.60 (36.50−37.00) 0.843 Heart rate, beats/min 88 (80−99) 88 (80−98) 88 (84−99) 0.180 Respiratory rate breaths/min 22 (20−23) 22 (20−23) 22 (20−23) 0.050 Systolic Blood pressure, mmHg 127 (116−138) 125 (115−136) 132 (120−138) 0.014 Diastolic Blood pressure, mmHg 80 (74.00−89.00) 80 (73.75−87.25) 81 (74.25−90.50) 0.610 Laboratory results White blood cell count, ×109/L 5.52 (4.40−7.63) 5.18 (4.14−6.63) 6.78 (5.10−9.03) < 0.001 Red blood cell count, ×109/L 4.15 (3.83−4.54) 4.19 (3.88−4.51) 4.08 (3.73−4.55) 0.209 Hematokrit, % 37.80 (34.90−40.80) 38.00 (35.80−40.75) 37.05 (34.02−40.80) 0.066 Platelet count, ×109/L 210.00 (161.00−275.00) 207.00 (160.50−270.00) 216.50 (166.75−283.25) 0.469 Platelet distribution width, % 16.20 (16.00−16.50) 16.20 (16.00−16.50) 16.30 (16.02−16.60) 0.337 Mean platelet volume, fl 9.50 (8.90−10.30) 9.50 (8.90−10.40) 9.50 (8.80−10.10) 0.284 Thrombocytocrit 0.21 (0.16−0.26) 0.21 (0.16−0.26) 0.21 (0.17−0.25) 0.637 Mean corpuscular volume, fl 91.00 (88.40−93.40) 91.00 (88.45−93.30) 91.05 (88.05−93.77) 0.943 Mean corpuscular Hemoglobin, pg 30.40 (29.50−31.00) 30.40 (29.55−31.00) 30.50 (29.42−31.10) 0.773 Mean corpuscular−hemoglobin
concentration, g/L332.00 (327.00−339.00) 332.00 (326.00−339.00) 333.00 (328.00−338.75) 0.643 RDW-CV, fL 12.30 (11.90−12.90) 12.30 (11.90−12.80) 12.50 (11.90−13.00) 0.032 RDW-SD, fL 40.00 (38.60−41.90) 40.00 (38.55−41.75) 40.25 (38.70−42.40) 0.227 Neutrophil cell count, ×109 /L 3.77 (2.79−5.67) 3.34 (2.46−4.63) 5.25 (3.60−7.53) < 0.001 Neutrophil granulocyte rate, % 69.50 (61.70−79.60) 66.80 (57.05−73.65) 78.95 (68.50−85.20) < 0.001 Lymphocyte count, ×109/L 1.08 (0.81−1.53) 1.24 (0.90−1.64) 0.90 (0.60−1.25) < 0.001 Lymphocyte percentage, % 21.40 (13.60−28.60) 24.70 (17.70−33.10) 13.65 (8.62−22.18) < 0.001 Monocytes count, ×109/L 0.39 (0.27−0.50) 0.38 (0.27−0.48) 0.41 (0.27−0.54) 0.293 Monocyte percentage, % 6.80 (5.30−8.70) 7.10 (5.80−8.75) 6.10 (4.55−8.17) 0.002 Eosinophils count, ×109/L 0.03 (0.00−0.08) 0.03 (0.01−0.09) 0.02 (0.00−0.08) 0.277 Eosinophils percentage, % 0.50 (0.10−1.50) 0.70 (0.10−1.60) 0.40 (0.00−1.20) 0.062 Basophil count, ×109/L 0.01 (0.01−0.02) 0.01 (0.01−0.02) 0.01 (0.01−0.03) 0.066 Basophil percentage, % 0.30 (0.10−0.40) 0.30 (0.10−0.40) 0.20 (0.10−0.40) 0.328 Hemoglobin, g/L 126.00 (115.00−136.00) 128.00 (118.00−136.00) 123.00 (113.75−136.00) 0.075 Platelet count, ×109/L 210.00 (161.00−275.00) 207.00 (160.50−270.00) 216.50 (166.75−283.25) 0.469 IL-6, pg/mL 8.24 (6.42−11.90) 7.69 (6.13−11.15) 89.04 (7.05−12.87) 0.004 Amyloid A, mg/L 142.35 (11.00−234.28) 55.30 (5.77−218.12) 181.30 (82.38−245.81) < 0.001 α-fucosidase, U/L 22.50 (19.00−27.00) 22.50 (18.00−27.00) 22.50 (20.00−26.25) 0.522 D-dimer level, mg/L 0.70 (0.38−1.57) 0.51 (0.31−1.06) 1.18 (0.60−3.57) < 0.001 Total protein, g/L 65.13 ± 6.50 66.28 ± 6.30 63.07 ± 6.36 < 0.001 Albumin, g/L 33.18 ± 4.63 34.72 ± 4.37 30.43 ± 3.72 < 0.001 Globulin, g/L 31.50 (28.87, 34.40) 31.40 (28.60−34.10) 32.40 (29.50−35.00) 0.089 ALB, g/L 1.00 (0.90−1.20) 1.10 (1.00−1.30) 0.90 (0.80−1.10) < 0.001 Prealbumin, g/L 153.50 (99.00−223.25) 166.50 (117.75−232.00) 130.50 (84.75−193.50) < 0.001 Total cholesterol, mmol/L 3.84 (3.36−4.44) 3.94 (3.45−4.45) 3.71 (3.21−4.44) 0.176 High-sensitivity troponin, ng/L 3.60 (1.40−8.90) 2.80 (1.10−6.10) 6.60 (2.65−12.65) < 0.001 Prothrombin time, S 11.30 (10.62−12.00) 11.20 (10.50−11.80) 11.70 (10.80−12.60) < 0.001 Prothrombin time activity, % 102.70 (89.00−121.90) 108.10 (93.30−124.30) 96.20 (77.90−118.30) < 0.001 INR 0.96 (0.91−1.02) 0.96 (0.90−1.01) 0.99 (0.92−1.06) 0.003 Thrombin time, S 17.00 (16.10−18.00) 17.15 (16.20−17.78) 17.00 (16.00−18.30) 0.678 Ferritin, ug/L 473.90 (243.69−737.52) 380.65 (191.88−623.12) 688.59 (438.28−1022.66) < 0.001 Alkaline phosphatase, U/L 76.00 (59.75−93.25) 76.00 (59.50−94.50) 75.00 (60.00−93.00) 0.856 r-glutamyltransferase, U/L 34.00 (21.00−60.00) 28.00 (18.00−56.00) 41.00 (26.00−77.00) < 0.001 Egfr 106.33 (91.19−125.93) 107.69 (92.72−128.03) 104.53 (86.69−124.48) 0.080 Aminotransferase Alanine, U/L 32.00 (20.00−48.50) 28.00 (18.50−45.00) 38.00 (24.00−53.00) 0.006 Aminotransferase Aspartate, U/L 32.00 (24.00−45.25) 29.00 (23.00−41.00) 37.00 (29.00−56.00) < 0.001 Total Bilirubin, mmol/L 12.80 (9.57−16.55) 13.10 (9.70−16.70) 12.00 (9.10−16.00) 0.207 Indirect Bilirubin, mmol/L 8.30 (6.18−11.43) 8.80 (6.60−11.75) 7.80 (5.65−10.60) 0.047 Direct Bilirubin, mmol/L 4.00 (3.00−5.23) 4.00 (2.90−5.10) 4.00 (3.20−5.40) 0.647 Lactate dehydrogenase, U/L 255.00 (197.50−350.50) 225.00 (180.50−277.50) 344.00 (261.00−452.00) < 0.001 Uric acid, μmol/L 233.00 (188.57−300.25) 239.00 (194.50−302.00) 224.00 (181.00−294.00) 0.237 Cystatin C, mg/L 0.85 (0.74−1.03) 0.83 (0.73−0.95) 0.94 (0.78−1.16) < 0.001 Glucose, mmol/L 5.80 (5.00−7.10) 5.60 (5.00−6.68) 6.30 (5.30−7.80) 0.005 Cholinesterase, U/L 7914.35 ± 2021.09 8395.58 ± 1947.16 7081.45 ± 1878.61 < 0.001 Creatine kinase, U/L 70.00 (47.75−115.00) 68.50 (46.75−106.00) 74.00 (51.50−126.00) 0.225 Creatinine, μmol/L 67.40 (57.00−80.25) 65.90 (55.75−77.85) 70.90 (59.90−83.60) 0.009 Blood urea nitrogen, mmol/L 4.35 (3.46−5.46) 4.00 (3.30−5.00) 4.90 (4.00−6.60) < 0.001 CXR
0
1
2280
80 (28.6)
20 (7.1)
180 (61.22)177
63 (35.6)
18 (10.2)
96 (54.2)103
17 (16.5)
2 (1.89)
84 (81.6)< 0.001
< 0.001
0.227
< 0.001Note. Data are presented as n/N (%) and mean ± SD, median (IQR). P values were calculated by Chi-square test, Fisher's exact test, t test, or Wilcoxon rank sum test as appropriate. P values denoted the comparison among mild group and severe group. CXR, chest CT abnormalities. Table 1. Clinical characteristics among patients with COVID-19 in the cohort
-
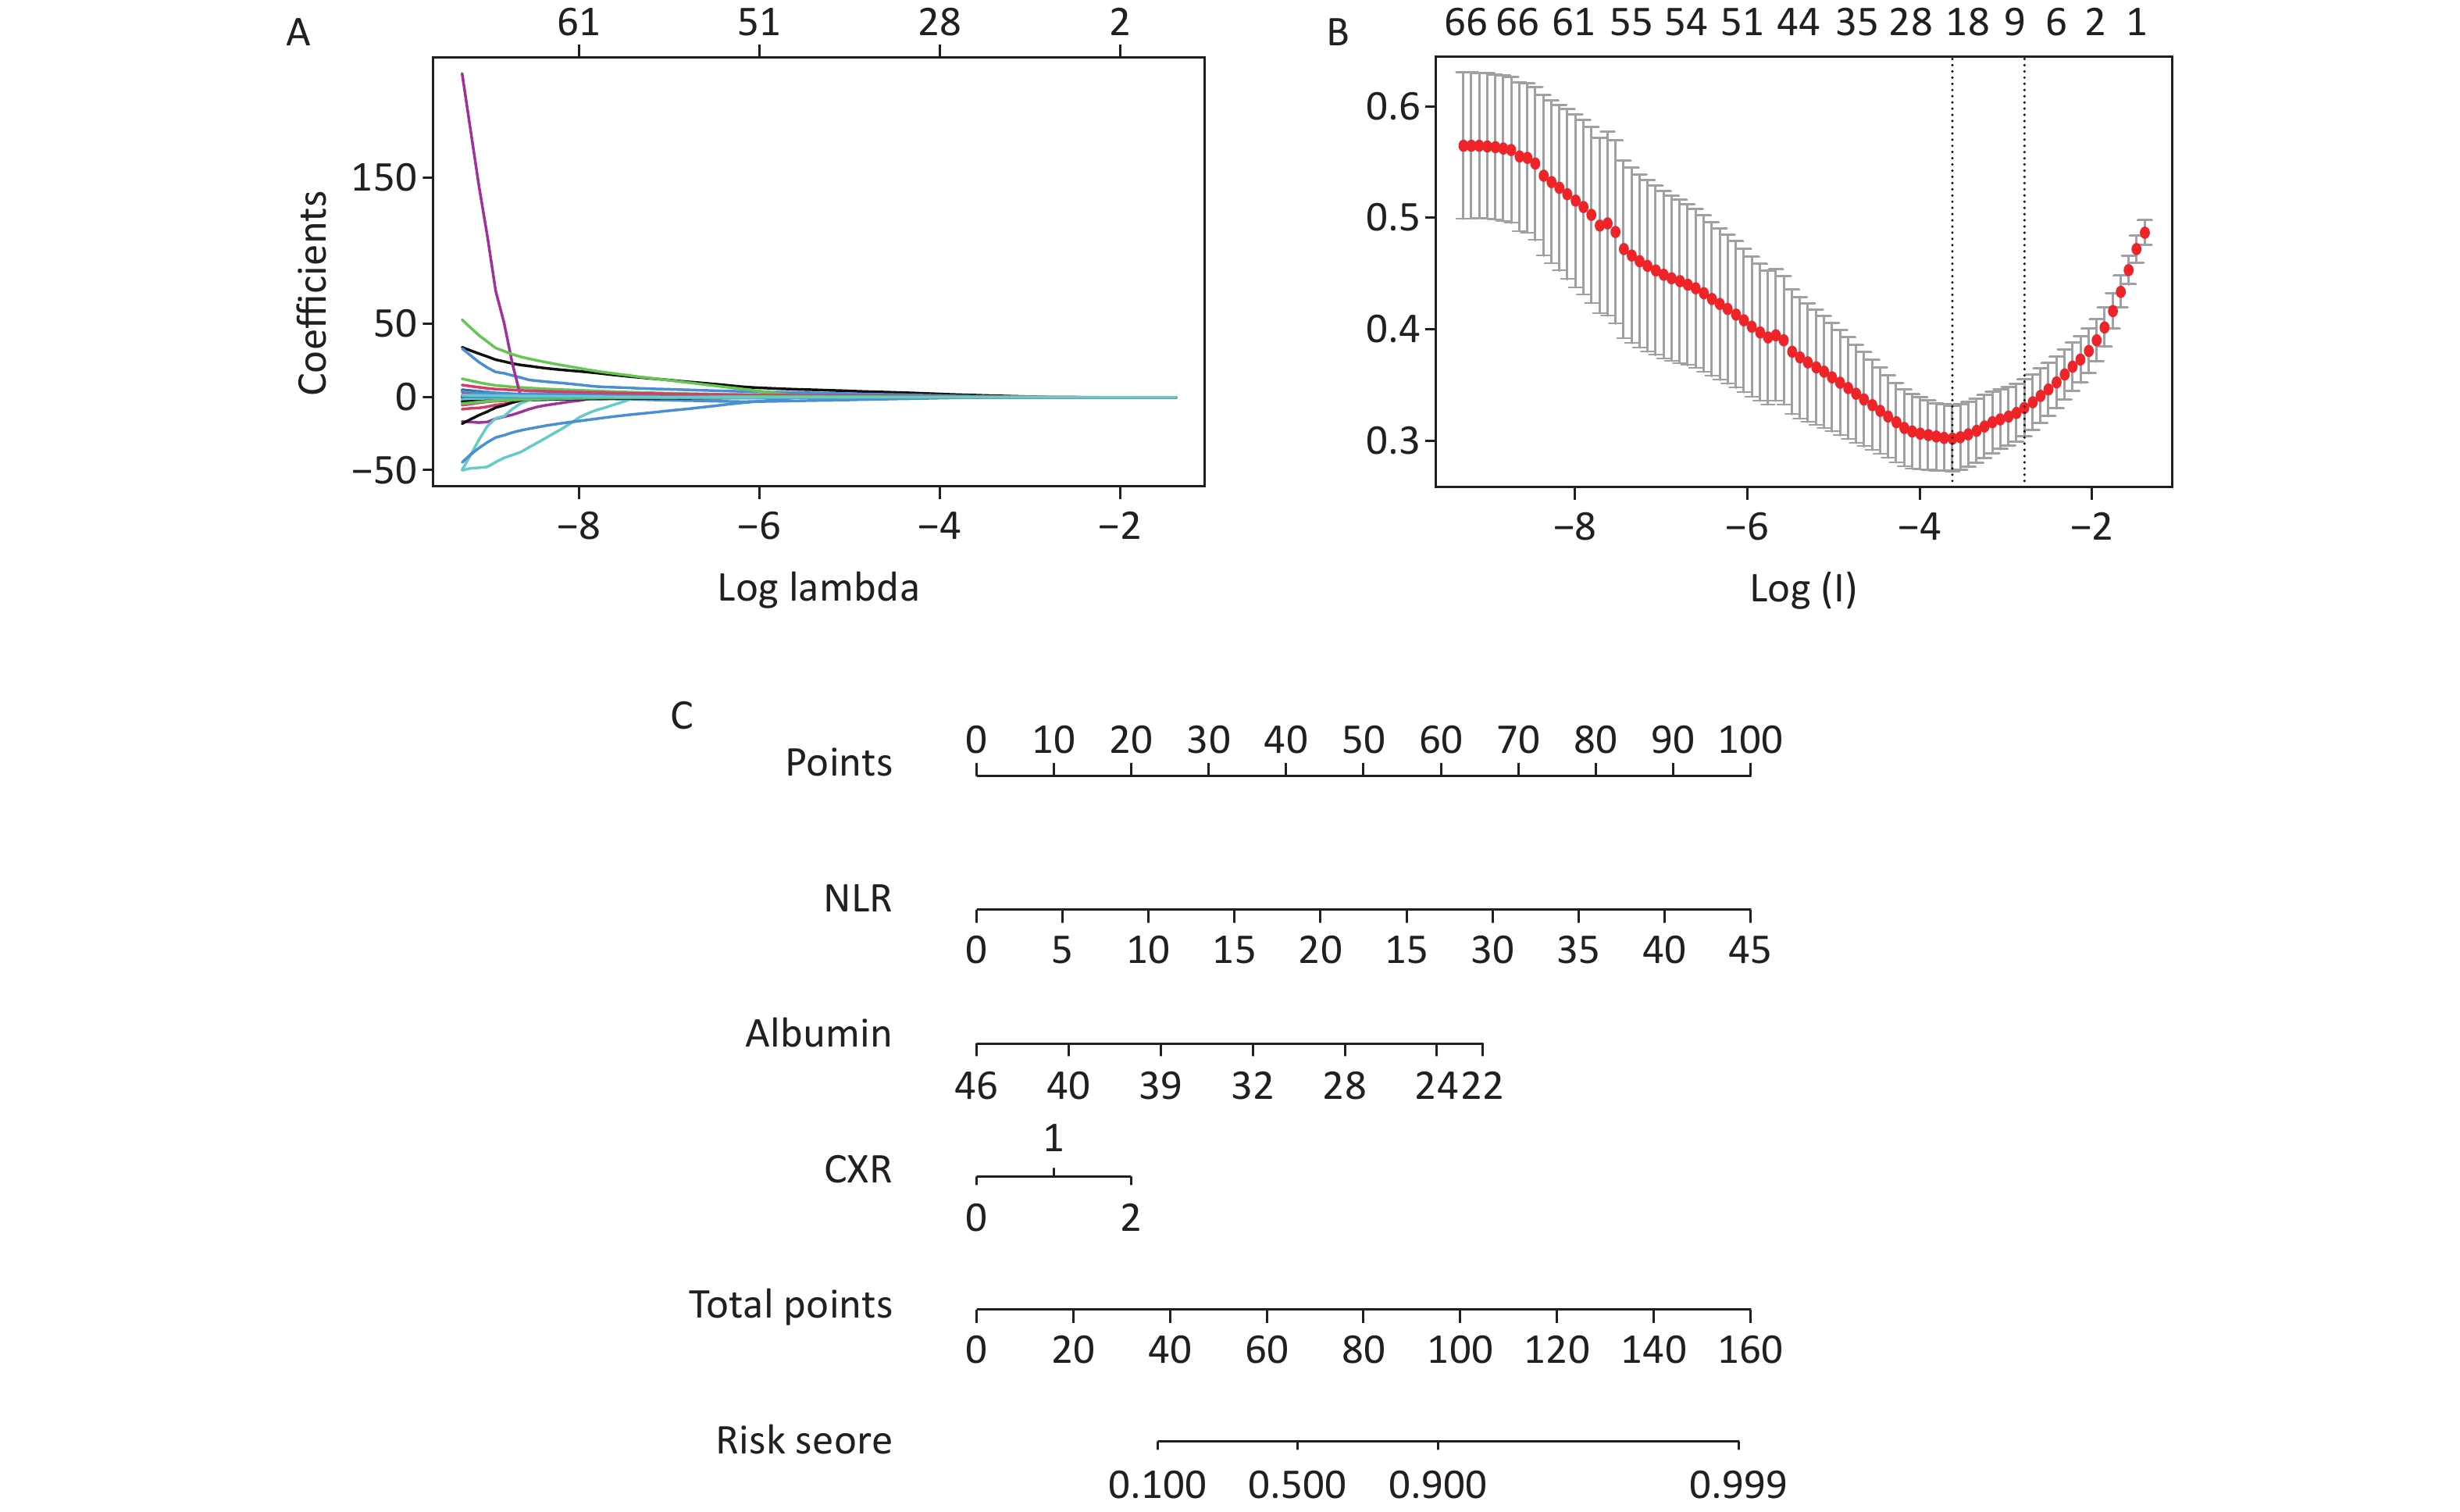
A total of 74 variables were documented on hospital admission and were measured in the LASSO regression. Following the application of LASSO regression and L1-penalized least absolute shrinkage and selection regression for multivariable analyses, we used 10 fold-cross validation to obtain a training and validation set from the whole dataset. We then repeated the LASSO and logistic regression analyses which resulted in 3 variables which predicted the development of severe illness (Figure 1A, 1B), which were the NLR (OR, 1.27; 95% CI, 1.15−1.39), albumin (OR, 0.76; 95% CI, 0.70−0.83), chest CT abnormalities (OR, 2.01; 95% CI, 1.41−2.86) (Table 2).
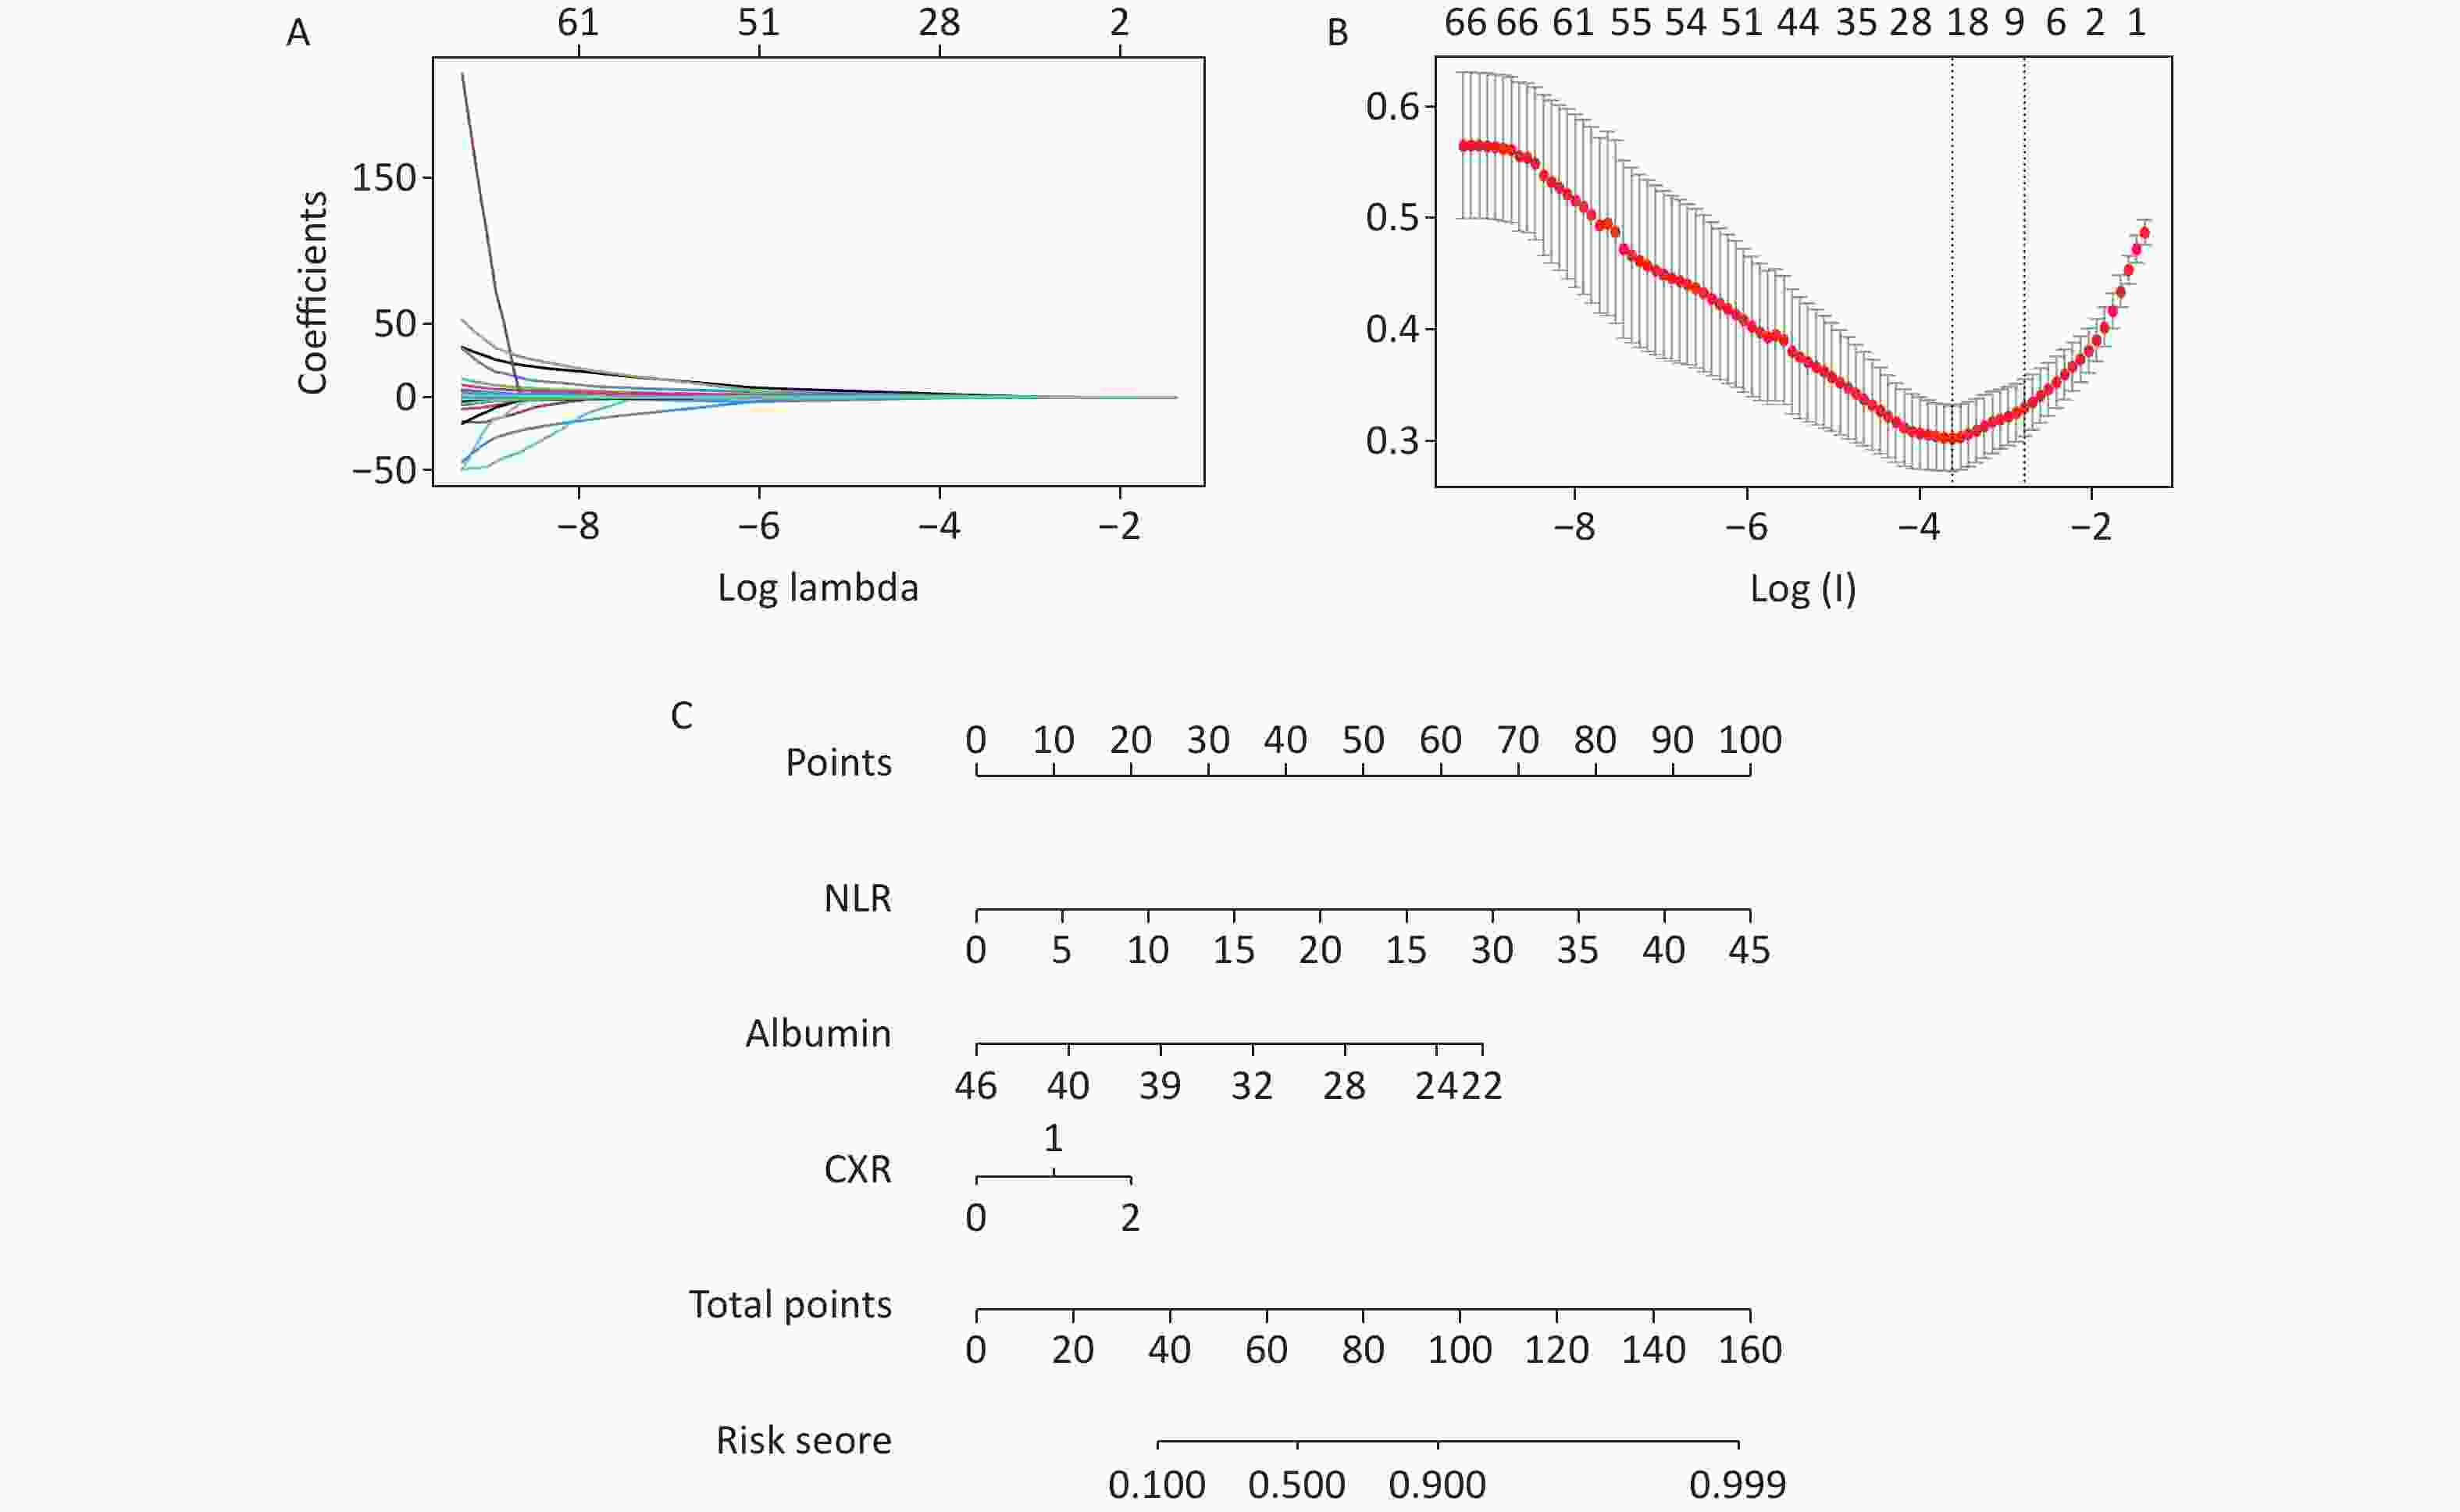
Figure 1. Predictive risk factors were selected by LASSO regression analysis. (A) LASSO coefficient profiles of the non-zero variables in COVID-19 patients. (B) The lowest point of the red curve indicates the mean−squared error plot, which contains thirteen variables. A more concise model including five variables is the dashed line on the right within one standard error. (C) Nomogram predicting the risk of developing severe COVID-19. LASSO, least absolute shrinkage and selection operator; NLR, neutrophil-to-lymphocyte ratio; CXR, chest CT abnormalities.
Variables OR (95% CI) P NLR 1.27 (1.15, 1.39) 0.038 Albumin 0.76 (0.70, 0.83) < 0.001 CXR 2.01 (1.41, 2.86) < 0.001 Note. LASSO, least absolute shrinkage and selection operator; NLR, neutrophil-to-lymphocyte ratio; CXR, chest CT abnormalities. Table 2. Selected variables by LASSO
CURB-65 Risk 0−1 Low risk ≥ 2 Moderate and high risk Table S2. CURB-65 risk score
-
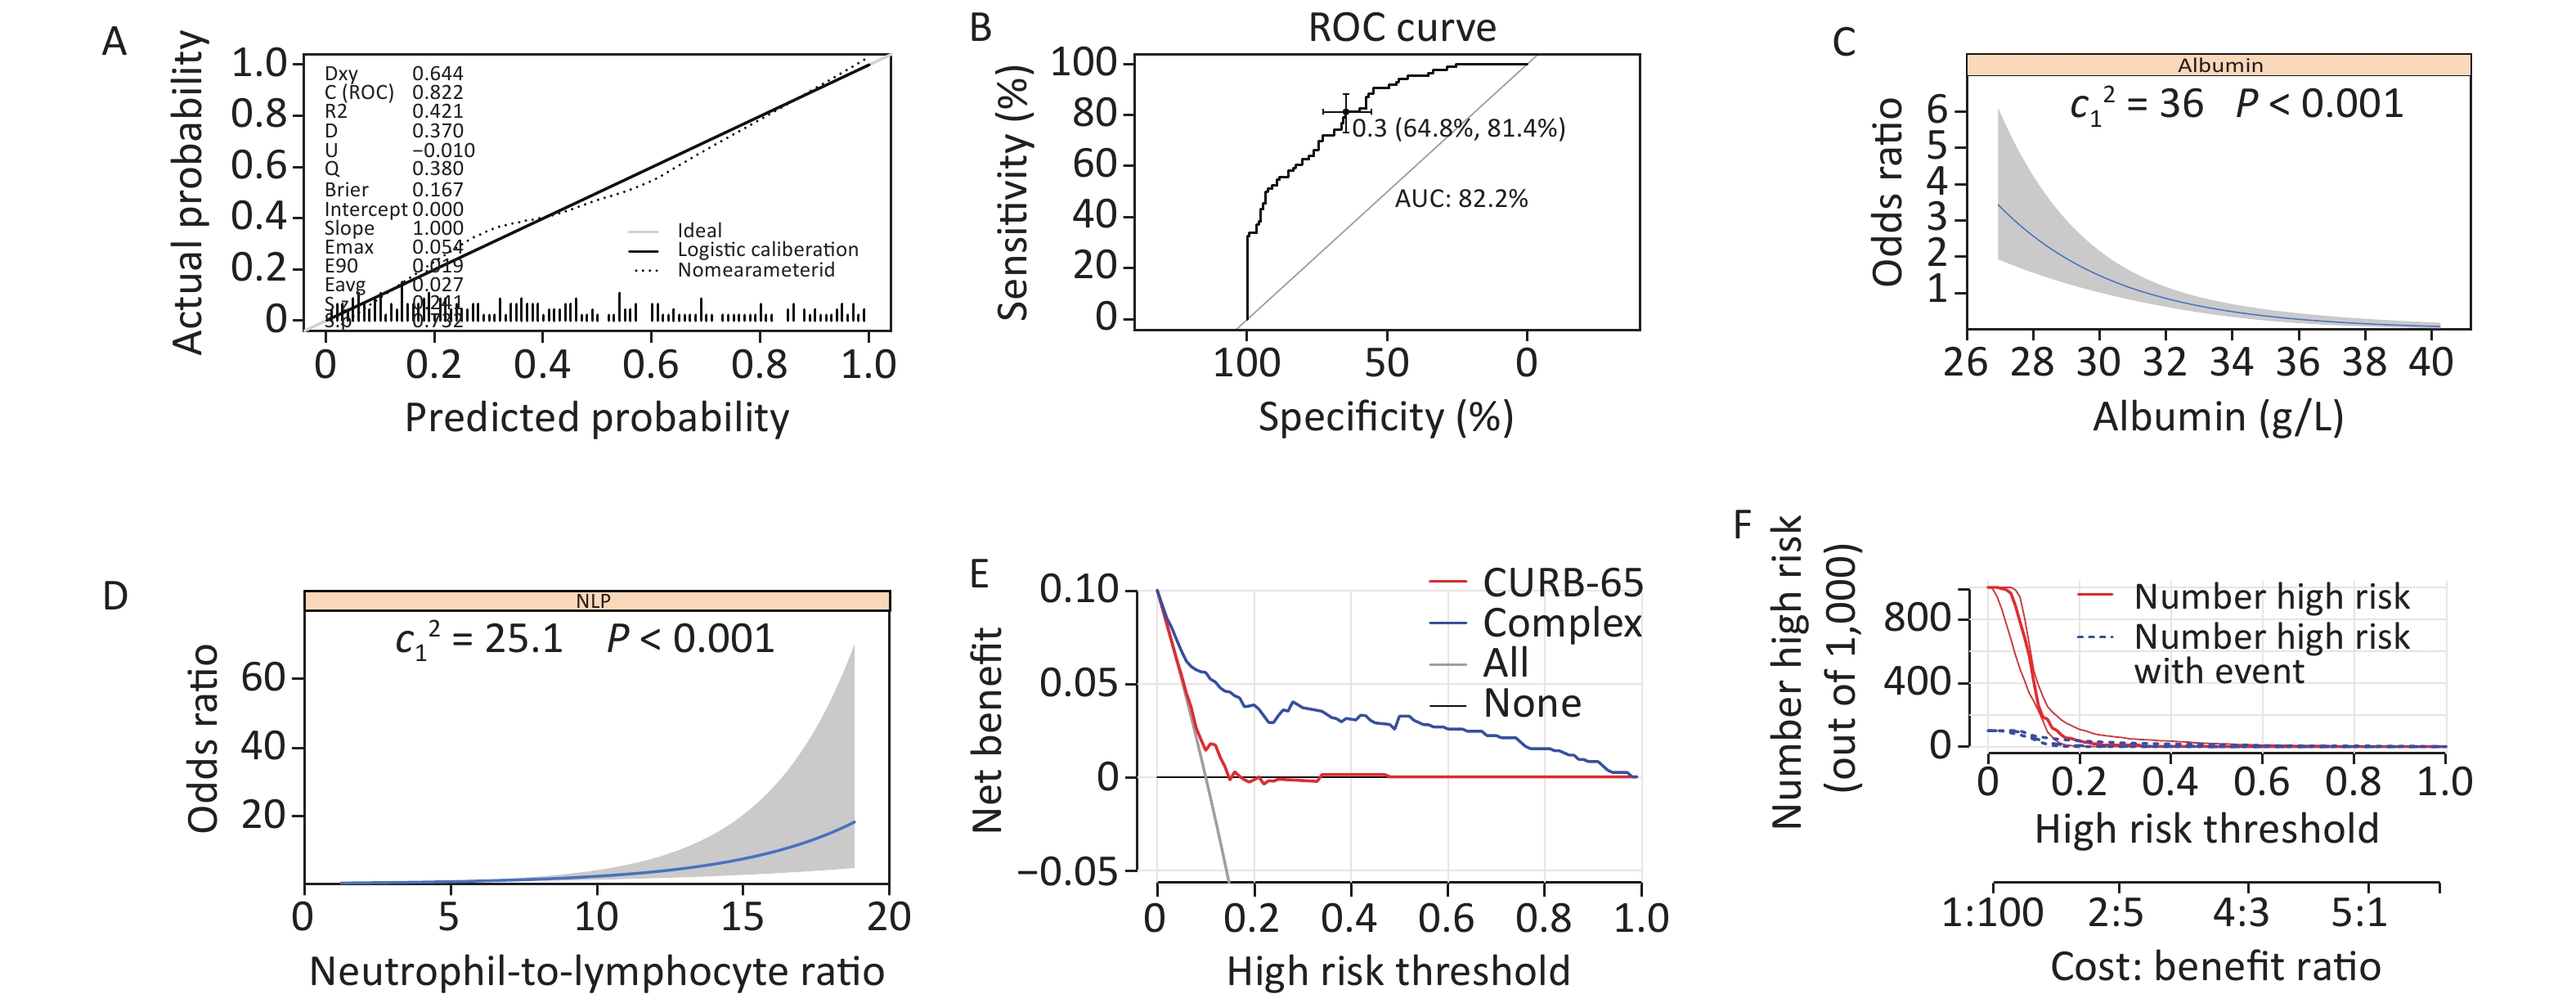
The nomogram was constructed based on the coefficients of the predictors (Figure 1C). This allowed clinicians to evaluate the possibility of developing severe COVID-19. The nomogram had a C-index of 0.822 (95% CI, 0.7667–0.8776) (Figure 2A, 2B). In the case of a P < 0.05 for non-linearity, the restricted cubic spline (RCS) was drawn to demonstrate the relationship between the NLR (P < 0.001) and albumin (P < 0.001) and the risk, which is non-linear (Figure 2C, 2D). The clinical impact and decision curve indicated that a combination of the risk factors had a good net benefit and influence on the patients (Figure 2E, 2F), (Supplementary Tables S1–S2 available in www.besjournal.com).
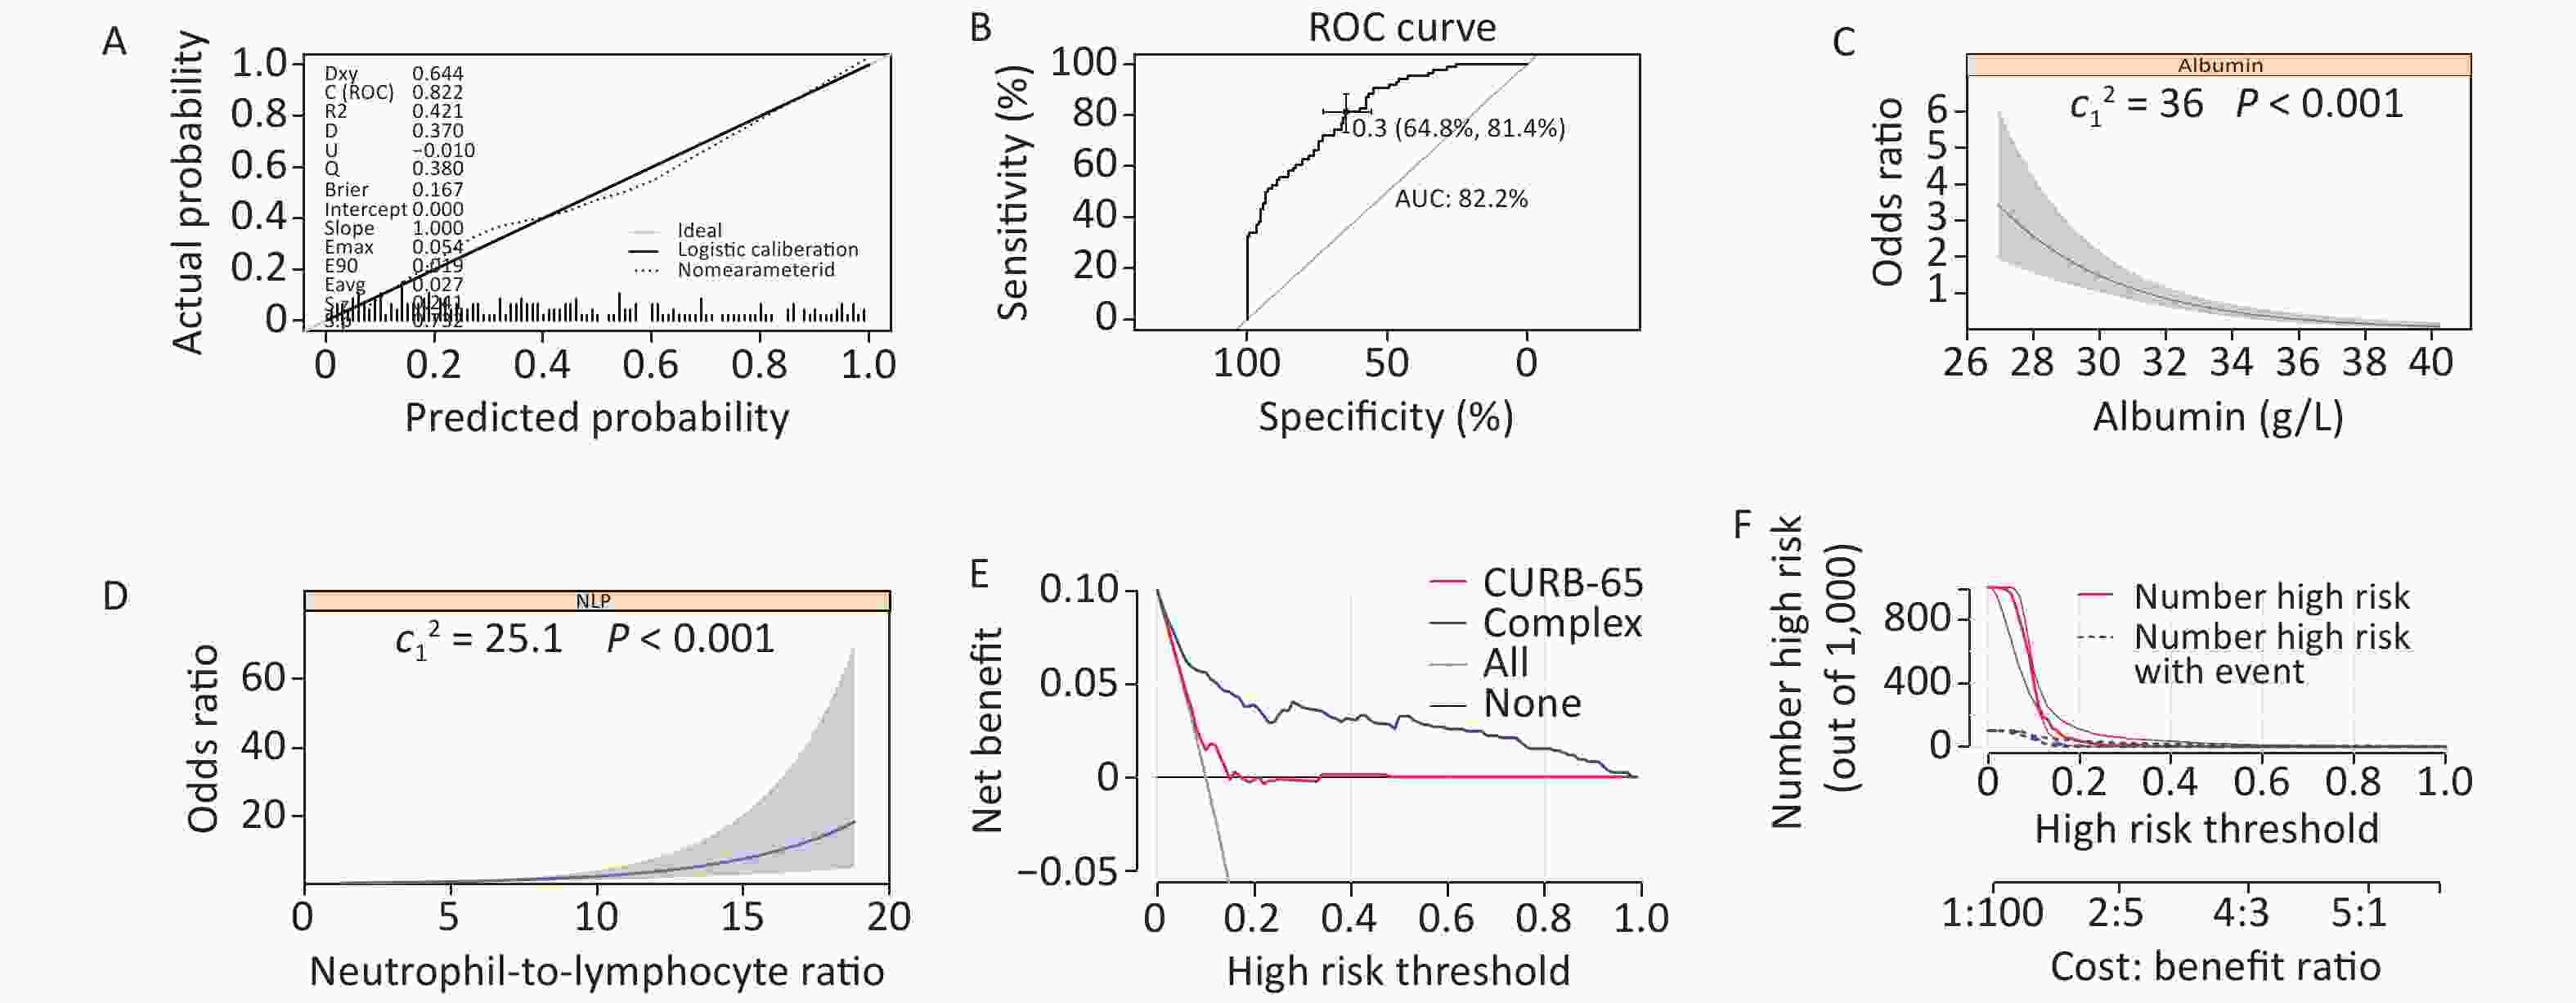
Figure 2. Association of variables with the risk of severe illness and accuracy of the model. (A–B) The calibration curve and ROC curve of the new model. The C-index was 0.822, the specificity was 0.648 and the sensitivity was 0.814. (C–D) Association of albumin and NLR with the risk of severe illness in patients with COVID-19. (E–F) Decision curve and clinical impact curve of the new complex model in the nomogram for no severe illness survival in patients with COVID-19, compared with actual survival and CURB-65, in which the possibility of survival had a superior standardized net benefit.
-
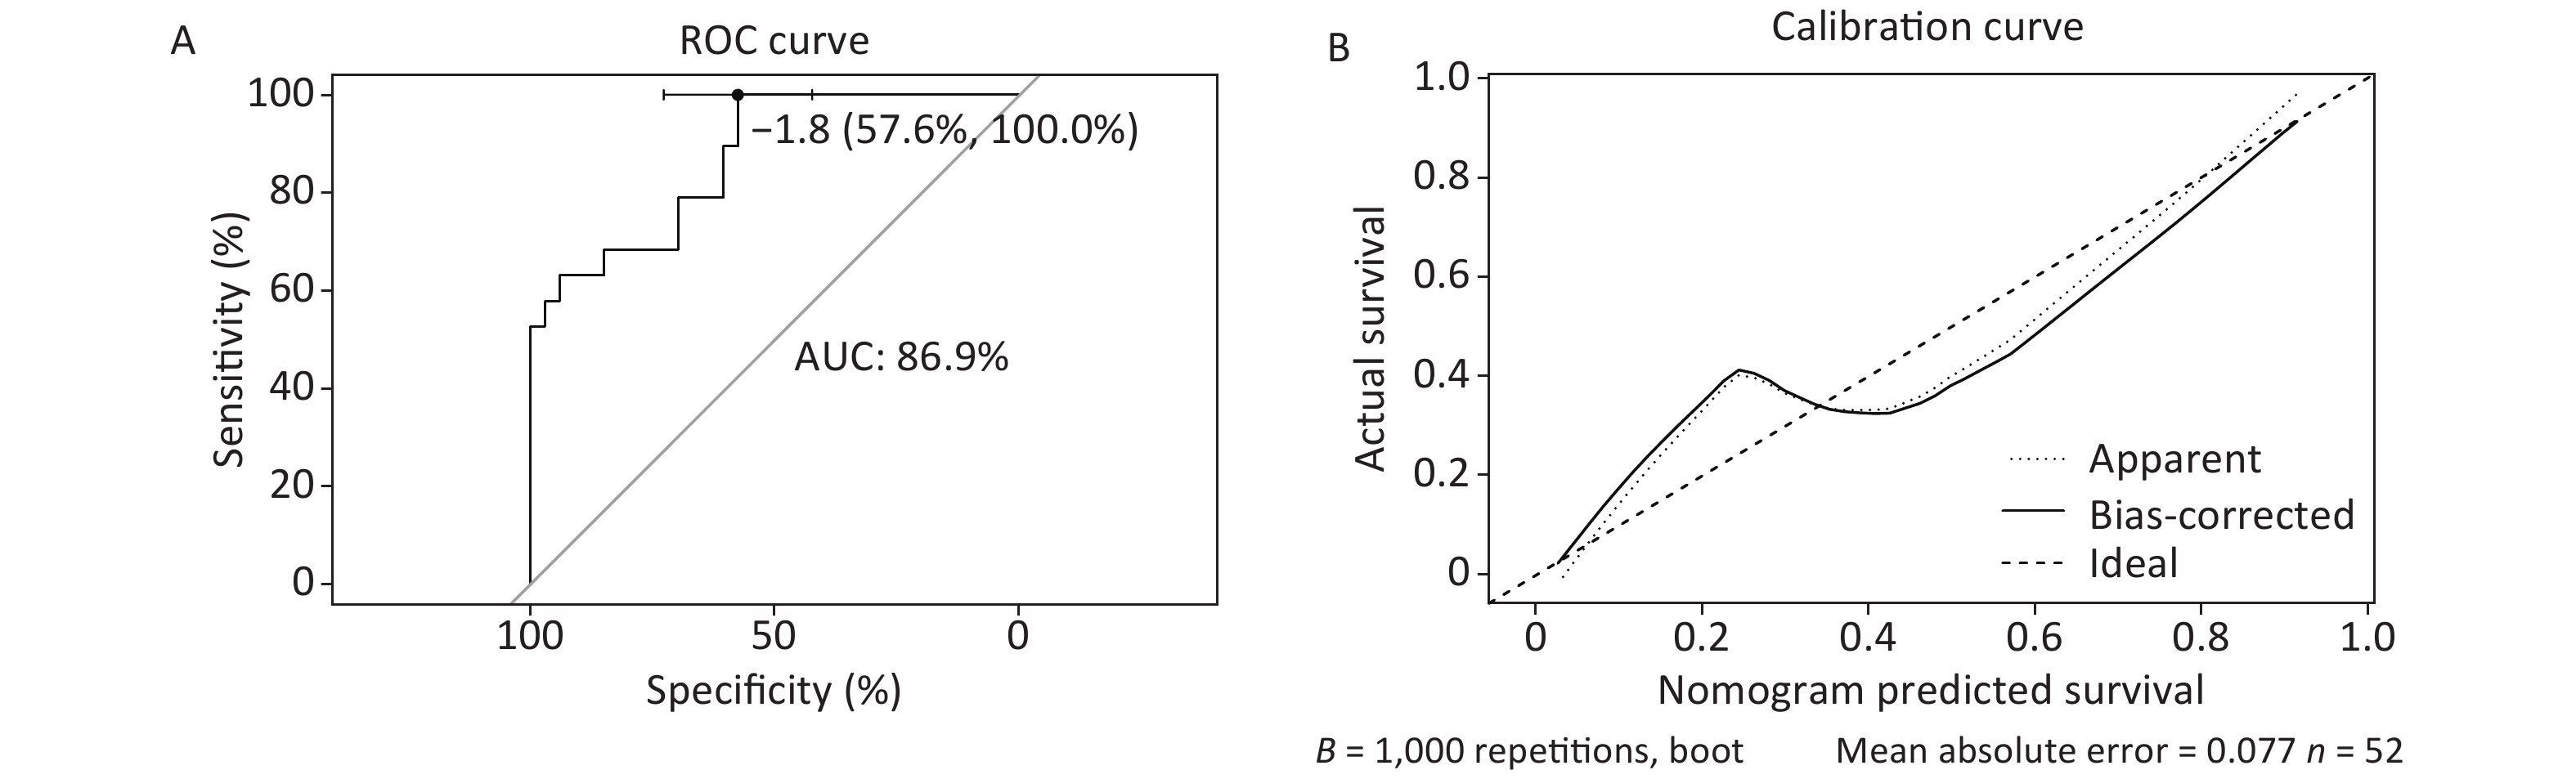
During internal validation, the training set was applied and the calibration curve showed convergence of the predicted rates and actual results (Figure 3). In the external validation, the validation set was applied and the AUC of severe COVID-19 was 0.885 (95% CI, 0.7719–0.9666).
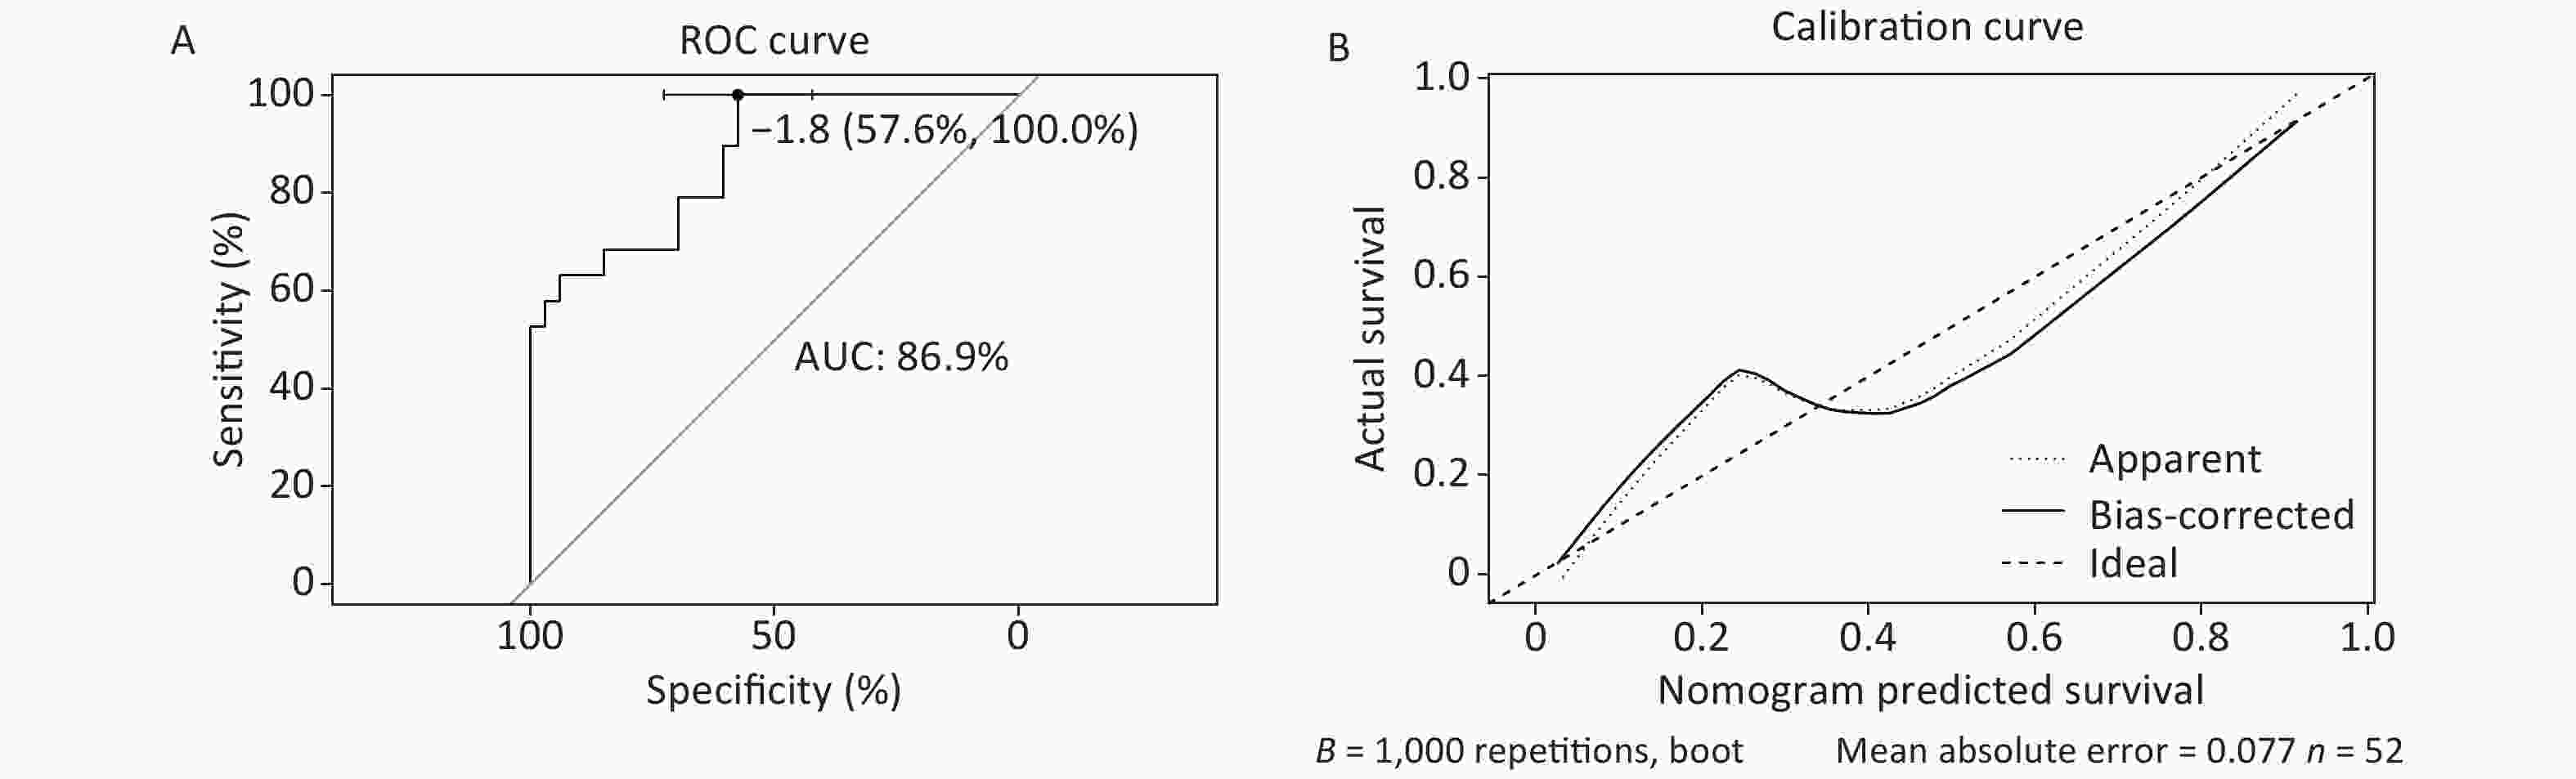
Figure 3. External validation of the new complex prediction model. The ROC curve and calibration curve of internal validation, in which AUC was 86.9%, specificity was 0.576 and sensitivity was 1.00.
-
In this study, we developed a simple and reliable risk score calculator for clinicians that can predict the development of severe illness in patients with COVID-19. The risk score showed a satisfactory performance and an accuracy of 0.822 based on the training and testing set. Moreover, compared with the standard CURB-65, it not only had a superior sensitivity (34%), but also good specificity. Three indicators were obtained from the 49 variables using the scoring criteria, the NLR, albumin, and chest CT abnormalities, and were used to calculate the possibility of developing severe illness on hospital admission and biochemical test results were quickly obtained after initial diagnosis, which will save valuable time for clinicians.
Previous studies have demonstrated that some of these factors are closely related to the development of severe illness in COVID-19. Liu et al. found that a high NLR, as an inflammatory marker[9-13], was associated with the diagnosis and poor clinical course of COVID-19. Researchers indicated that aggressive immune responses to COVID-19 initiated more severe symptoms and higher mortality among men than among women[14,15]. CT abnormalities can reduce the overall survival of patients with COVID-19. Albumin is widely used in the intensive care unit (ICU) in patients with sepsis or critical pneumonia, especially during the COVID-19 pandemic[16-18]. It is empirically used when patients with COVID-19 develop severe illness with limited proof. Our data indicated that albumin is a protective factor and the use of albumin is beneficial in severely ill patients. However, more clinical data are required to prove this finding.
-
Although it is critical to evaluate laboratory parameters, such as C-reactive protein, erythrocyte sedimentation rate, iron, CD4+, and CD8+, not all patients underwent all of these tests, especially in an emergency and when there was a shortage of medical resources. Thus, their laboratory variables were not included in the assessment. Therefore, a large sample multi-center study is required. Moreover, this study included 188 moderate, 90 severe and 17 critical COVID-19 patients. Therefore, these findings might not be generalized to those with mild COVID-19.
-
Taken together, our data demonstrated a predictive risk score to estimate the possibility of patients with COVID-19 developing severe illness. The system was based on 3 variables, NLR, albumin, and chest computed tomography abnormalities, which are easily measured on hospital admission, to help identify COVID-19 patients who have a high risk of progressing to severe illness, thereby requiring tailored treatments at an early stage to avoid moderate or mild cases developing into severe cases.
-
HUANG Lu Qi, LU Cheng, and XIONG Yi Bai conceived and designed the study, XIONG Yi Bai and MA Yan drafted the manuscript. TIAN Ya Xin and MA Yan performed the statistical analysis. LIU Bin inputted data. Patient were enrolled by RUAN Lian Guo. LU Cheng and HUANG Lu Qi revised the manuscript. All authors read and approved the final manuscript.
-
The authors thank all doctors in Wuhan JinYinTan Hospital for their help in treating patients with COVID-19.
-
We wish to confirm that there are no known conflicts of interest associated with this publication and there has been no significant financial support for this work that could have influenced its outcome. The authors have no ethical conflicts to disclose.
HTML
Study Design and Participants
Data Collection
Definition
Variable Selection and Score Construction
Assessment of Accuracy
Characteristics of the Study
Selection of Risk Factors
Construction of a Nomogram
Validation
Limitations
 21273Supplementary Materials.pdf
|

|

 Quick Links
 DownLoad: