


-
Hypertension is a common complication or comorbidity of diabetes mellitus whose prevalence is associated with diabetes type, age, obesity, race, and other factors[1-3]. The incidence of both hypertension and diabetes is increasing, and 20%–60% of people with type 2 diabetes mellitus (T2DM) have been reported to have concomitant hypertension[4]. Furthermore, approximately 30% of the patients with T2DM in Chinese outpatient clinics also have a clinical diagnosis of hypertension[5]. The coexistence of T2DM with hypertension is associated with multiple cardiometabolic risk factors and significantly increases the risk of cardiovascular disease, stroke, nephropathy, and retinopathy, as well as the mortality rate, in patients with diabetes[6]. In contrast, controlling hypertension can significantly decrease the risk of diabetes complications and slow the rate of development[7-10].
Glucocorticoids (including cortisol and corticosterone) have been implicated in a broad range of physiological functions, such as regulating metabolism and blood pressure, as well as stress and inflammatory responses; therefore, they are indispensable in maintaining survival[11, 12]. Glucocorticoids also induce insulin resistance, hyperglycemia, and hyperlipidemia through a variety of mechanisms[13]. Research[14] has shown that morning cortisol levels are positively correlated with the body mass index (BMI), waist-to-hip ratio, and levels of blood glucose, insulin, and triglycerides. Another study has suggested that people with T2DM have higher levels of morning cortisol, and these levels are negatively correlated with the insulin sensitivity index[15]. According to the literature, endogenous glucocorticoids increase blood pressure[16, 17]. However, in patients prescribed synthetic corticoids, the prevalence of the hypertension greatly varies, between 0% and 90%[18, 19].
To our knowledge, no definitive conclusion has been reached regarding the relationship between glucocorticoids and hypertension. Glucocorticoids regulate blood pressure by acting on multiple organs, as reported in many clinical observations and experimental studies[20-24]. Therefore, to investigate whether glucocorticoids might be involved in the pathogenesis of diabetes and hypertension, we aimed to explore the characteristics of glucocorticoids in people with dysglycemia and hypertension by analyzing their association with blood pressure indicators.
-
The participants in this study were from the Henan Rural Cohort study, which included 39,259 people 18–79 years of age in five rural regions of Henan province in China at baseline (2015–2017). The cohort details have been described elsewhere[25]. A matched case study[26] was performed after the exclusion of participants taking sex steroid related drugs. Consequently, 925 patients with T2DM were selected, and all cases were matched with participants with impaired fasting glycemia (IFG), on the basis of normal fasting glucose, sex, and age (± 3 years) in the same general population. Finally, 2,775 participants were recruited. In this analysis, we excluded individuals who had normal blood glucose (n = 925) and lacked clinical parameters for blood pressure (n = 4). We also excluded individuals with gestational hypertension (n = 15) and kidney disease (n = 143). After this exclusion process, a total of 1,688 participants 18–79 years of age were included in the final analysis. This study was approved by the Zhengzhou University Life Science Ethics Committee [code: (2015) MEC (S128)]. All participants in the study provided signed written informed consent.
-
Patients or the public were not involved in designing, conducting, reporting, or disseminating our research.
-
Previously validated questionnaires[25, 27] were used by trained investigators to collect demographic (age, sex, education, income, etc.), and lifestyle (smoking, drinking, and exercise) information, as well illness history through face-to-face interviews. The level of education was classified into illiteracy, primary school, middle school, and high school or higher education. Marital status was categorized into married or cohabiting, widowed/divorced/separated, and single. Per capita monthly income was classified into three levels [< 500, between 500 and 999, and ≥ 1,000 renminbi (RMB)]. Smoking status was defined as smoking at least one cigarette per day for 6 consecutive months, and was categorized into never, once, and current. Drinking status was defined as drinking alcohol at least 12 times per year. Physical activity was evaluated with the international physical activity short questionnaire and categorized into low, moderate, and high levels[28].
The investigators measured anthropometric variables, and all participants were asked to wear light clothing and no shoes. Height and weight were measured twice with a standard right-angle device and a weight measurement device (V. BODY HBF-371, OMRON, Japan) to the nearest 0.1 cm and 0.1 kg, respectively[29]. BMI was calculated as body weight (kg) divided by height squared (m2). Blood pressure was measured three times at 30 s intervals in seated participants with an electronic sphygmomanometer (HEM-770AFuzzy, Omron, Japan) after the participants had rested for 5 min, and the mean value was used for analysis[30]. Pulse pressure (PP), mean arterial pressure (MAP), mean blood pressure (MBP), and mean proportional arterial pressure (MPAP) were calculated with the following Formulas[31, 32]:
$$ {\rm P}{\rm P}={\rm S}{\rm B}{\rm P}-{\rm D}{\rm B}{\rm P} \qquad\qquad\qquad\qquad\qquad\qquad\;\;\; $$ (1) $$ {\rm M}{\rm A}{\rm P}=\frac{1}{3}\times {\rm S}{\rm B}{\rm P}+\frac{2}{3}\times {\rm D}{\rm B}{\rm P}=\frac{{\rm S}{\rm B}{\rm P}+2\times {\rm D}{\rm B}{\rm P}}{3}\;\;\;\;\; \,$$ (1) $$ \rm{M}\rm{B}\rm{P}=\frac{1}{2}\times \rm{S}\rm{B}\rm{P}+\frac{1}{2}\times \rm{D}\rm{B}\rm{P}=\frac{\rm{S}\rm{B}\rm{P}+\rm{D}\rm{B}\rm{P}}{2} \qquad\quad $$ (3) $$\begin{aligned} \rm{M}\rm{P}\rm{A}\rm{P}&=\rm{S}\rm{B}\rm{P}\times \left(\frac{\rm{S}\rm{B}\rm{P}}{\rm{S}\rm{B}\rm{P}+\rm{D}\rm{B}\rm{P}}\right)+\rm{D}\rm{B}\rm{P}\left(\frac{\rm{D}\rm{B}\rm{P}}{\rm{S}\rm{B}\rm{P}+\rm{D}\rm{B}\rm{P}}\right)\\ &=\frac{{\rm{S}\rm{B}\rm{P}}^{2}+{\rm{D}\rm{B}\rm{P}}^{2}}{\rm{S}\rm{B}\rm{P}+\rm{D}\rm{B}\rm{P}}\; \end{aligned}$$ (4) -
Fasting venous blood was collected from each participant after a fast of at least 8 h, with no anticoagulant treatment. The samples were then centrifuged immediately after coagulation, and the serum was stored at –80 °C. Fasting plasma glucose (FPG) was measured with a Roche Cobas C501 automatic biochemical analyzer. The serum levels of glucocorticoids (cortisol, deoxycortisol, and cortisone) were measured with liquid chromatography-tandem mass spectrometry on a Waters XEVO TQ-S system (Waters, Milford, MA, USA). We used blind determination when the case or control status of each sample analyzed in the same run was unknown. Values below the limit of detection and undetectable results were replaced with the value of half the detection limit.
-
IFG and T2DM were collectively referred to as dysglycemia, and the diagnostic criteria for IFG and T2DM were those recommended by the American Diabetes Association (2002) and World Health Organization (1999) guidelines. Excluding type 1 diabetes, gestational diabetes, and other special types of diabetes, we defined IFG as 6.1 mmol/L ≤ FPG < 7.0 mmol/L, or 5.7% < HbA1C < 6.5%. T2DM was defined as FPG ≥ 7.0 mmol/L, or HbA1C > 6.5%, or a self-reported previous diagnosis of diabetes by a physician and administration of antiglycemic agents in the prior 2 weeks.
-
A diagnosis of hypertension, as recommended by the Chinese guidelines for the prevention and treatment hypertension (revised 2010)[33], was defined according to the following standards: 1) SBP ≥ 140 mmHg and or DBP ≥ 90 mmHg; 2) self-reported hypertension diagnosed by a physician and current use of antihypertensive treatment in the prior 2 weeks. Participants who reported non-hypertension but were found to be hypertensive when measured were considered to have undiagnosed hypertension.
-
Continuous non-normal variables are expressed in median (quartiles) and compared with the Mann-Whitney U test, whereas categorical variables are expressed as a percentage and compared with a chi-squared test. To explore the potential nonlinear relationships and evaluate dose-response relationships, we categorized serum glucocorticoid (cortisol, deoxycortisol, and cortisone) levels in tertiles, and used the lowest tertiles as the reference. Serum glucocorticoid levels and blood pressure indicators were log-transformed (Ln-) to better approximate a normal distribution. Logistic regression analysis was used to estimate the association between serum glucocorticoids and the risk of dysglycemia with hypertension. The odds ratio (OR) and 95% confidence interval (CI) of dysglycemia with hypertension are reported in tertiles in separate models. We performed trend tests by entering the categorical variables as continuous variables in the logistic regression models. Stratified logistic regression was also performed. Linear regression was also used to examine the relationships between the serum levels of glucocorticoids (Ln-cortisol, Ln-deoxycortisol, and Ln-cortisone) and characteristics of hypertension (Ln-SBP, Ln-SDP, Ln-PP, Ln-MAP, Ln-MBP, and Ln-MPAP). Multivariable adjustment modelling was performed as follows: model 1 was adjusted for age, sex, education, marital status, and per capita monthly income; model 2 was adjusted for the same parameters as model 1, plus drinking and smoking status; and model 3 was adjusted for the same parameters as model 2, plus BMI and physical activity. To further observe the association between continuous serum glucocorticoid (cortisol, deoxycortisol and cortisone) levels and hypertension, we used restricted cubic regression splines. Statistical analyses were performed in SPSS software, version 21.0 (SPSS Inc., Chicago) and SAS V.9.1 (SAS Institute). Two-sided test P values < 0.05 were considered statistically significant.
-
The study population contained of 552 cases of dysglycemia with hypertension (32.7%) and 1,136 cases of dysglycemia with non-hypertension (67.3%). Participants with hypertension were more likely to have a lower education, per capita monthly income, and physical activity level (Table 1). Participants with hypertension appeared to have higher BMI, SBP, DBP, PP, MAP, MBP, MPAP, FPG, serum cortisol, and serum deoxycortisol.
Variables Dysglycemia with hypertension x2/z P No Yes n = 1,136 (67.3%) n = 552 (32.7%) Age (years) 60.00 (53.00, 65.00) 63.00 (56.00, 68.00) −6.84 < 0.001 Sex, n (%) 34.96 < 0.001 Male 486 (42.8) 154 (27.9) Female 650 (57.2) 398 (72.1) Education, n (%) 18.01 0.001 Illiteracy 258 (22.7) 169 (20.6) Primary school 343 (20.2) 176 (31.9) Middle school 412 (36.3) 164 (29.7) High school or higher 123 (10.8) 43 (7.8) Marital status, n (%) 4.36 0.225 Married/cohabiting 1,105 (89.3) 483 (87.5) Widowed/divorced/separated 100 (8.8) 63 (11.4) Single 21 (1.8) 6 (1.1) Per capita monthly income (RMB), n (%) 3.84 0.429 < 500 462 (40.7) 238 (43.1) 500–999 347 (30.5) 172 (31.2) ≥ 1,000 327 (28.7) 142 (25.7) Smoking habit, n (%) 26.33 < 0.001 Never 815 (71.8) 452 (81.9) Once 89 (7.8) 41 (7.4) Current 232 (20.4) 59 (10.7) Drinking status, n (%) 8.36 0.015 Never 920 (81.0) 468 (84.8) Once 63 (5.5) 36 (6.5) Current 153 (13.5) 48 (8.7) Physical activity, n (%) 17.99 < 0.001 Low 281 (24.7) 177 (32.1) Moderate 539 (47.4) 268 (48.6) High 316 (27.8) 107 (19.4) BMI (kg/m2) 24.25 (22.15, 26.48) 25.86 (23.73, 28.04) −9.20 < 0.001 SBP (mmHg) 117.00 (109.00, 126.00) 143.00 (132.00, 152.00) −26.21 < 0.001 DBP (mmHg) 72.00 (66.00, 78.00) 84.00 (77.00, 91.00) −21.04 < 0.001 PP (mmHg) 45.00 (39.00, 51.00) 58.00 (49.00, 67.00) −19.36 < 0.001 MAP (mmHg) 87.67 (80.67, 93.33) 104.33 (96.33, 110.67) −25.16 < 0.001 MBP (mmHg) 95.00 (88.00, 101.50) 113.50 (105.13, 121.38) −25.95 < 0.001 MPAP (mmHg) 100.32 (93.49, 107.28) 121.14 (112.93, 129.08) −26.38 < 0.001 FPG (mmol/L) 5.93 (5.10, 7.63) 6.56 (5.37, 8.46) −5.09 < 0.001 HbA1c (%) 6.10 (5.80, 7.20) 6.40 (5.90, 760) −4.02 < 0.001 Serum cortisol (ng/mL) 141.95 (96.10, 189.25) 153.50 (105.33, 200.30) −2.63 0.009 Serum deoxycortisol (ng/mL) 0.30 (0.20, 0.40) 0.30 (0.20, 0.50) −3.87 < 0.001 Serum cortisone (ng/mL) 12.90 (9.50, 16.10) 12.90 (10.00, 16.60) −0.89 0.373 Ratio of serum cortisol to cortisone 10.64 (7.66, 15.35) 10.96 (7.66, 15.35) −1.04 0.300 Note. Continuous variables are expressed in median (quartiles) and compared with Mann-Whitney U test; categorical variables are expressed in percentage and compared by chi-squared test. BMI: body mass index; SBP: systolic blood pressure; DBP: diastolic blood pressure; PP: pulse pressure; MAP: mean arterial pressure; MBP: mean blood pressure; MPAM: mean proportional arterial pressure; FPG: fasting plasma glucose; HbA1c: hemoglobin A1c. Table 1. Characteristics of the study population with dysglycemia with and without hypertension
-
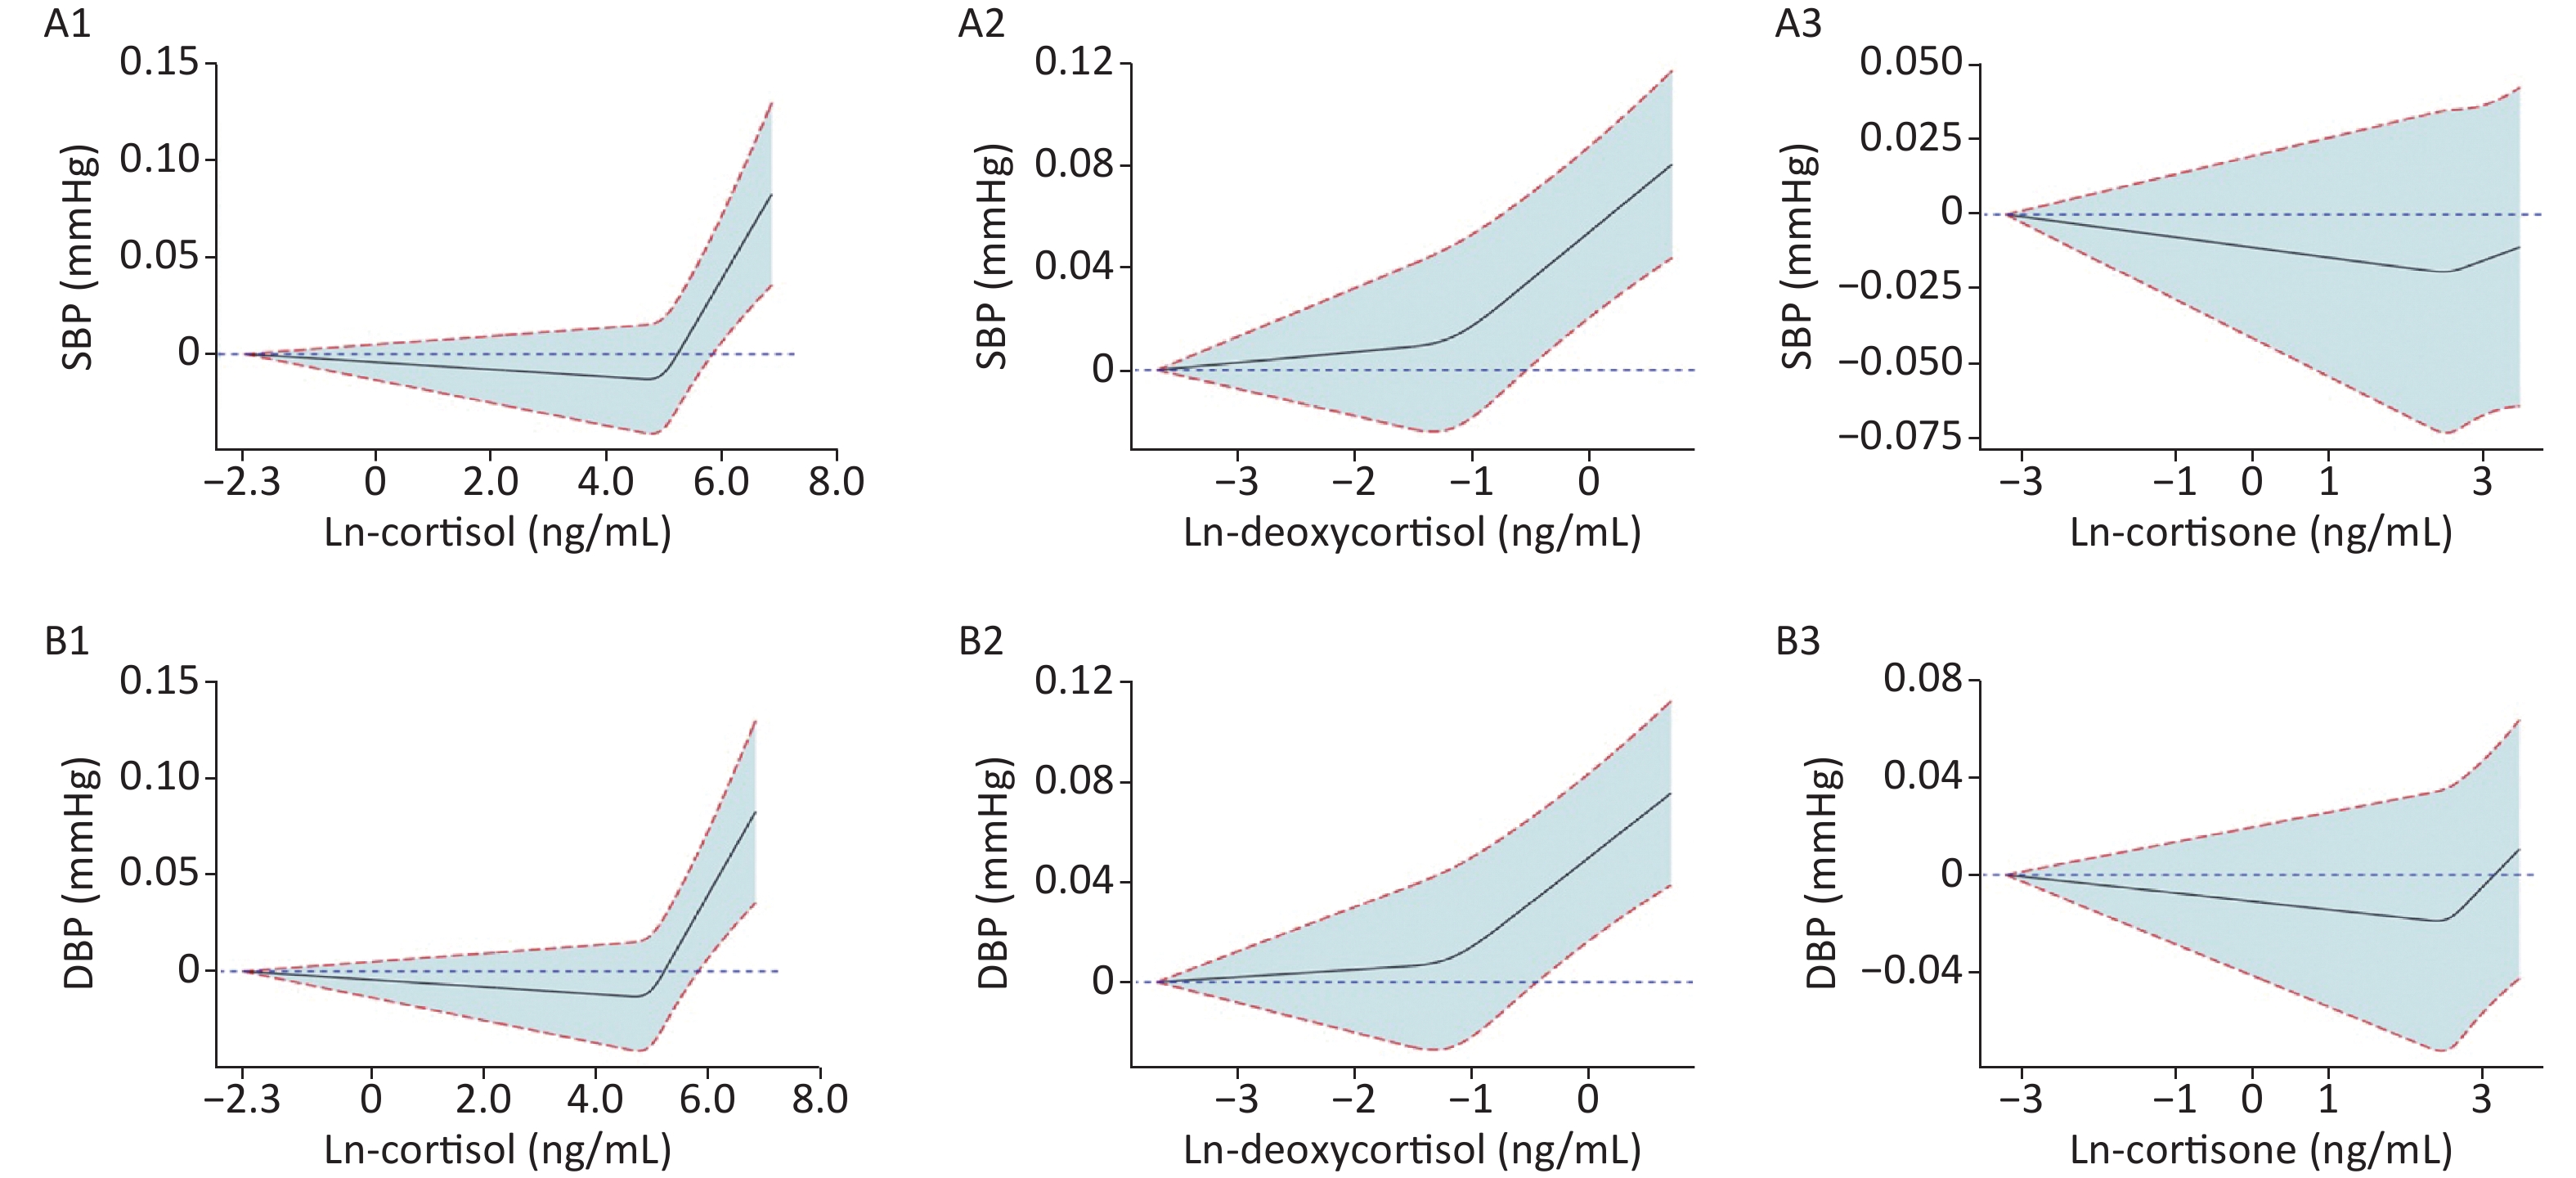
To observe the trend between Ln-glucocorticoids and BP, we generated restricted spline curves for serum Ln-glucocorticoids (Supplementary Figure S1, available in www.besjournal.com). As demonstrated, elevated SBP was associated with increased serum deoxycortisol levels. However, no significant differences in the trends were observed for the relationship between SBP and serum Ln-cortisol or Ln-cortisone. A similar trend between Ln-glucocorticoids and DBP was also observed.
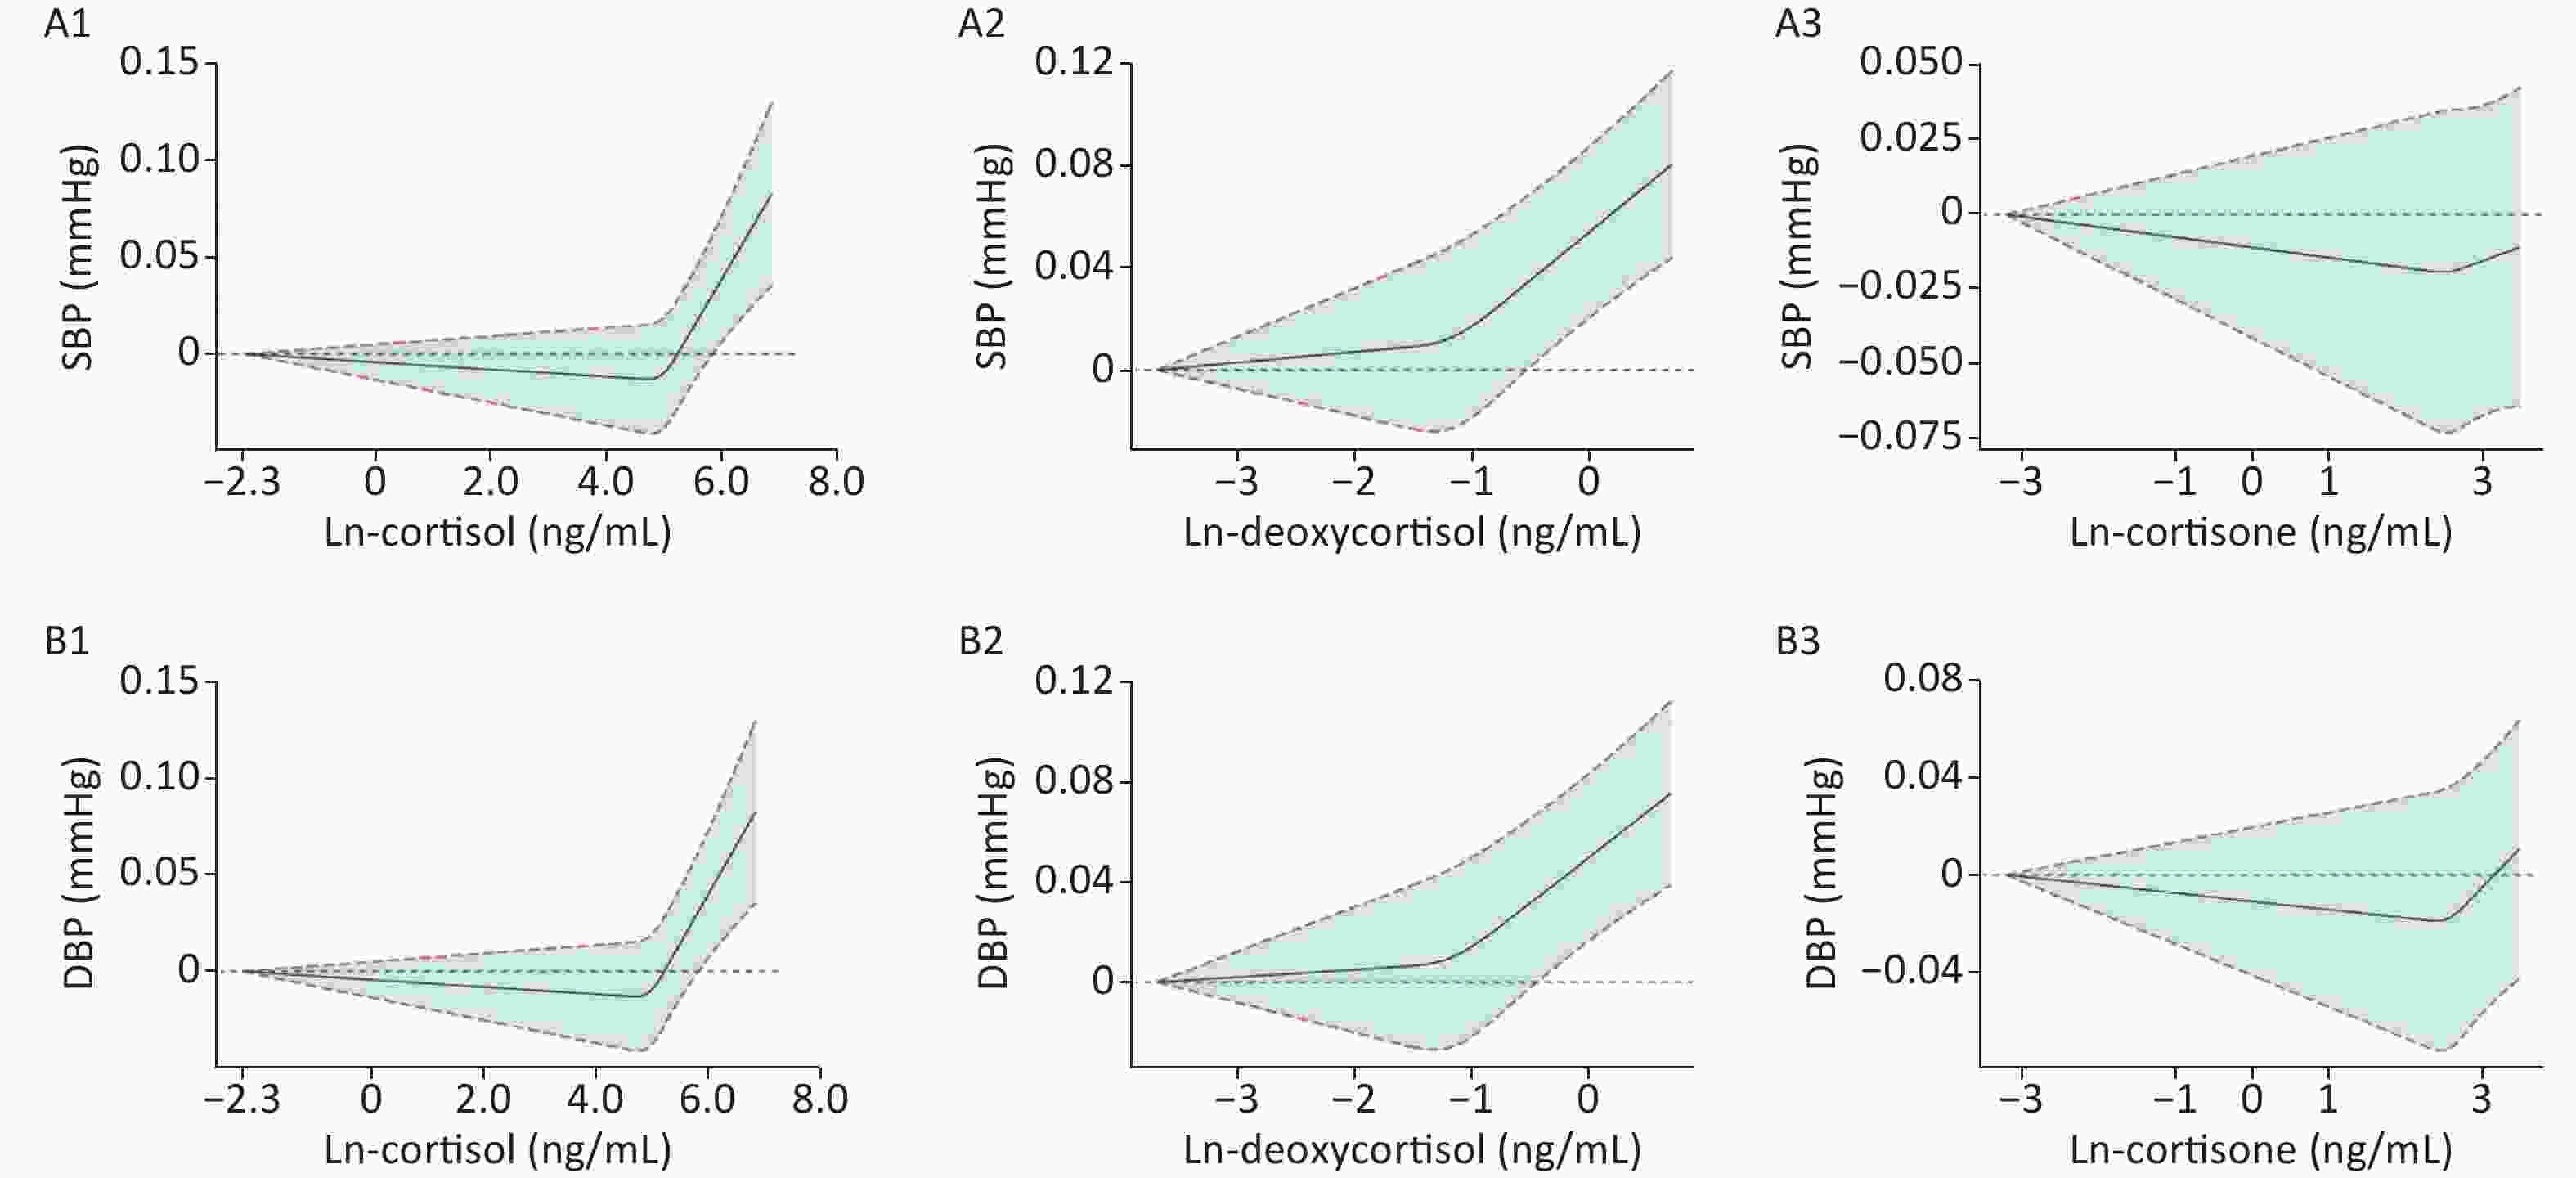
Figure S1. Mean and 95% confidence intervals of SBP (A1–A3) and DBP (B1–B3) along with changes in serum Ln-cortisol, Ln-deoxycortisol, and Ln-cortisone from restricted cubic splines analysis, adjusted for age, sex, education, marital status, per capita monthly income, drinking and smoking status, BMI, and physical activity. SBP: systolic blood pressure; DBP: diastolic blood pressure. Ln-, natural log-transformed.
-
Table 2 shows the association between serum Ln-glucocorticoids and dysglycemia with hypertension. The ORs (95% CIs) of participants with the highest tertile of the Ln-cortisol were 1.42 (1.11, 1.83) and 1.55 (1.18, 2.04), as compared with the lowest tertile in the crude and full-adjusted model. In the crude model, the highest tertile of the Ln-deoxycortisol was significantly associated with an increased risk of dysglycemia with hypertension (OR: 1.57, 95% CI: 1.23, 2.00), as compared with the lowest tertile. After adjustment for covariates (model 1–3), the ORs (95% CIs) were 1.56 (1.21, 2.01), 1.56 (1.21, 2.01), and 1.59 (1.22, 2.07), respectively. No significant correlation was observed between serum Ln-cortisone and dysglycemia with hypertension in both the crude and adjusted models.
Item Crude Model 1 Model 2 Model 3 OR (95% CI) P value OR (95% CI) P value OR (95% CI) P value OR (95% CI) P value Serum Ln-cortisol Tertile 1 1 1 1 1 Tertile 2 1.203
(0.934, 1.551)0.152 1.198
(0.922, 1.556)0.177 1.194
(0.919, 1.551)0.184 1.253
(0.953, 1.646)0.106 Tertile 3 1.422
(1.107, 1.828)0.006 1.419
(1.096, 1.837)0.008 1.411
(1.089, 1.828)0.009 1.552
(1.183, 2.036)0.001 Ptrand 0.006 0.008 0.009 0.001 Serum Ln-deoxycortisol Tertile 1 1 1 1 1 Tertile 2 1.030
(0.803, 1.321)0.817 1.034
(0.799, 1.337)0.799 1.035
(0.800, 1.340)0.792 0.988
(0.755, 1.292)0.927 Tertile 3 1.565
(1.225, 1.999)< 0.001 1.558
(1.210, 2.006)0.001 1.557
(1.209, 2.005)0.001 1.591
(1.222, 2.072)0.001 Ptrand 0.001 0.001 0.001 0.001 Serum Ln-cortisone Tertile 1 1 1 1 1 Tertile 2 0.975
(0.760, 1.252)0.845 1.040
(0.804, 1.345)0.764 1.036
(0.801, 1.340)0.789 0.988
(0.755, 1.292)0.928 Tertile 3 1.078
(0.841, 1.381)0.555 1.111
(0.861, 1.434)0.419 1.101
(0.852, 1.422)0.462 1.060
(0.812, 1.385)0.668 Ptrand 0.557 0.420 0.463 0.667 Note. Model 1 was adjusted by age, sex, education, marital status, and per capita monthly income. Model 2 was further adjusted by drinking and smoking status, based on model 1. Model 3 was further adjusted by BMI and physical activity, based on model 2. Ln-, natural log-transformed. Table 2. Association between serum Ln-glucocorticoids and dysglycemia with hypertension
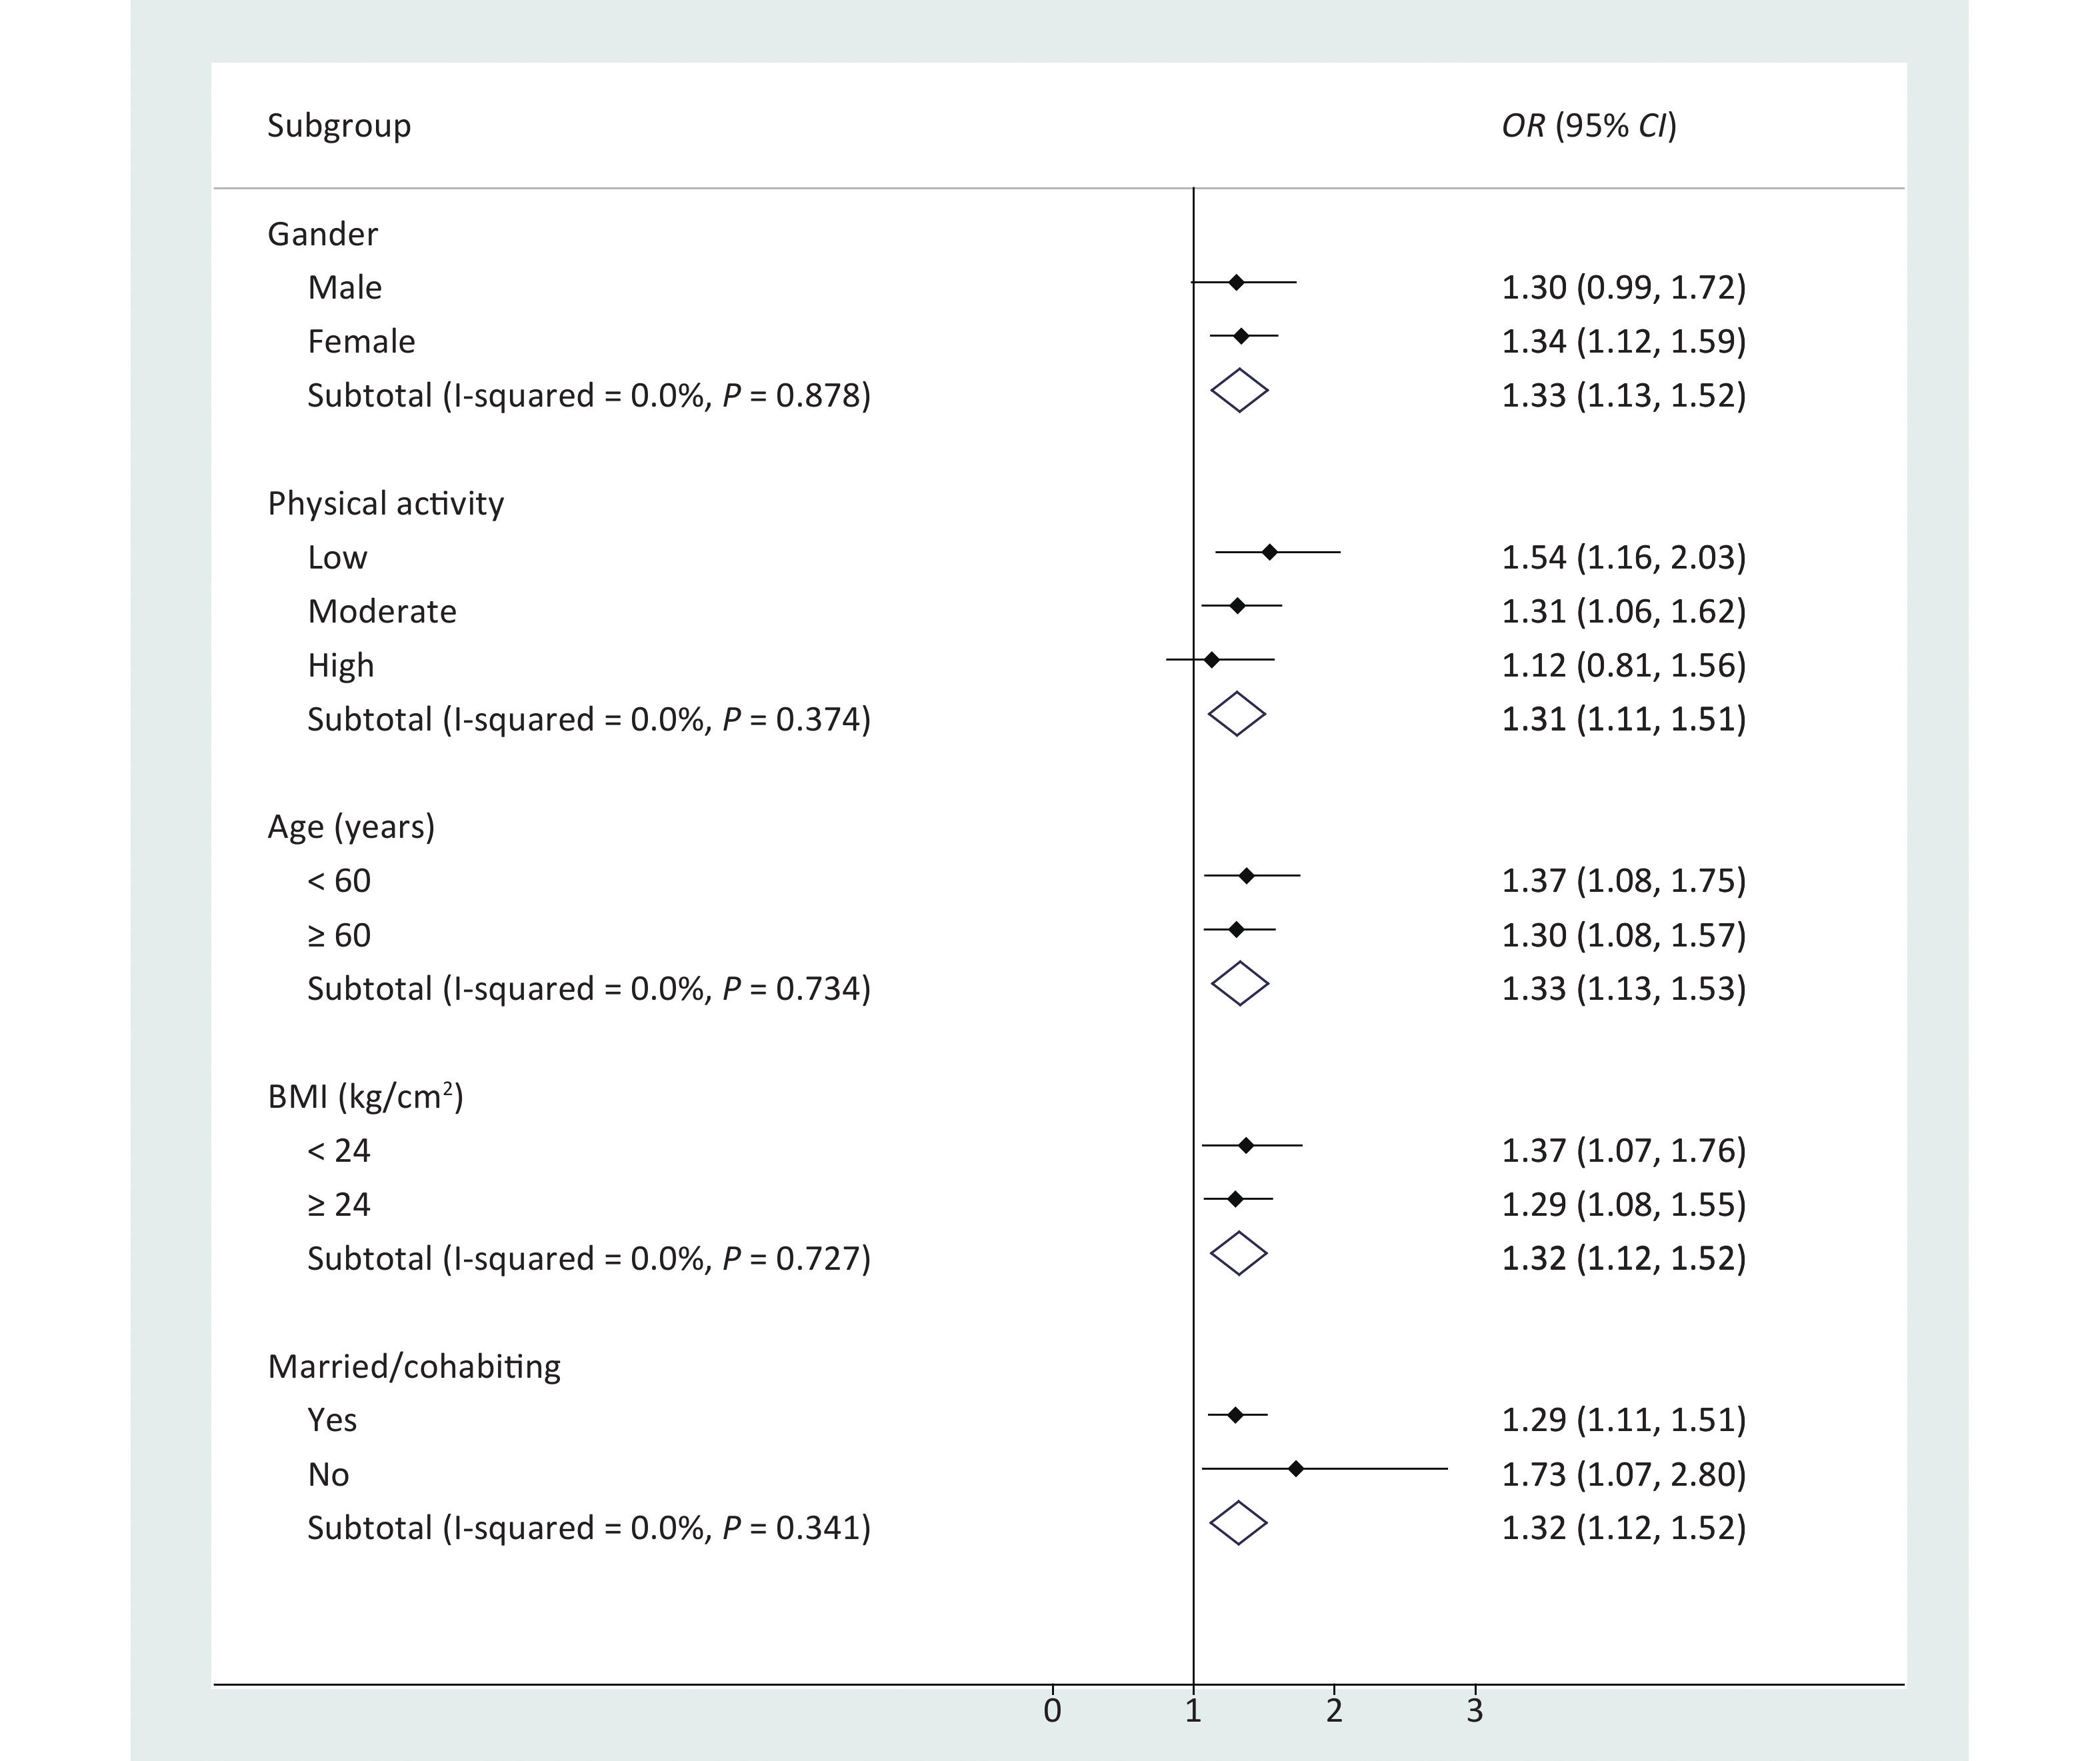
The results of stratified logistic regression showed that participants who were male, were unmarried/divorced/widowed, or had a low BMI or low physical activity had higher risk in the association between serum Ln-deoxycortisol and dysglycemia with hypertension (Figure 1). No significant correlation was observed between Ln-cortisol or Ln-cortisone and dysglycemia with hypertension after stratification by baseline characteristics (Supplementary Table S1, available in www.besjournal.com). In addition, when the association between serum Ln-glucocorticoids and dysglycemia with hypertension was stratified by T2DM and IFG (Table 3), the strongest association was observed between Ln-glucocorticoids and T2DM with hypertension. The results of further sensitivity analysis (Supplementary Table S2, available in www.besjournal.com) showed that the OR (95% CI) of the highest tertile of serum deoxycortisol was 1.682 (1.242, 2.277) after removal of the hypertension controlled population (n = 167).
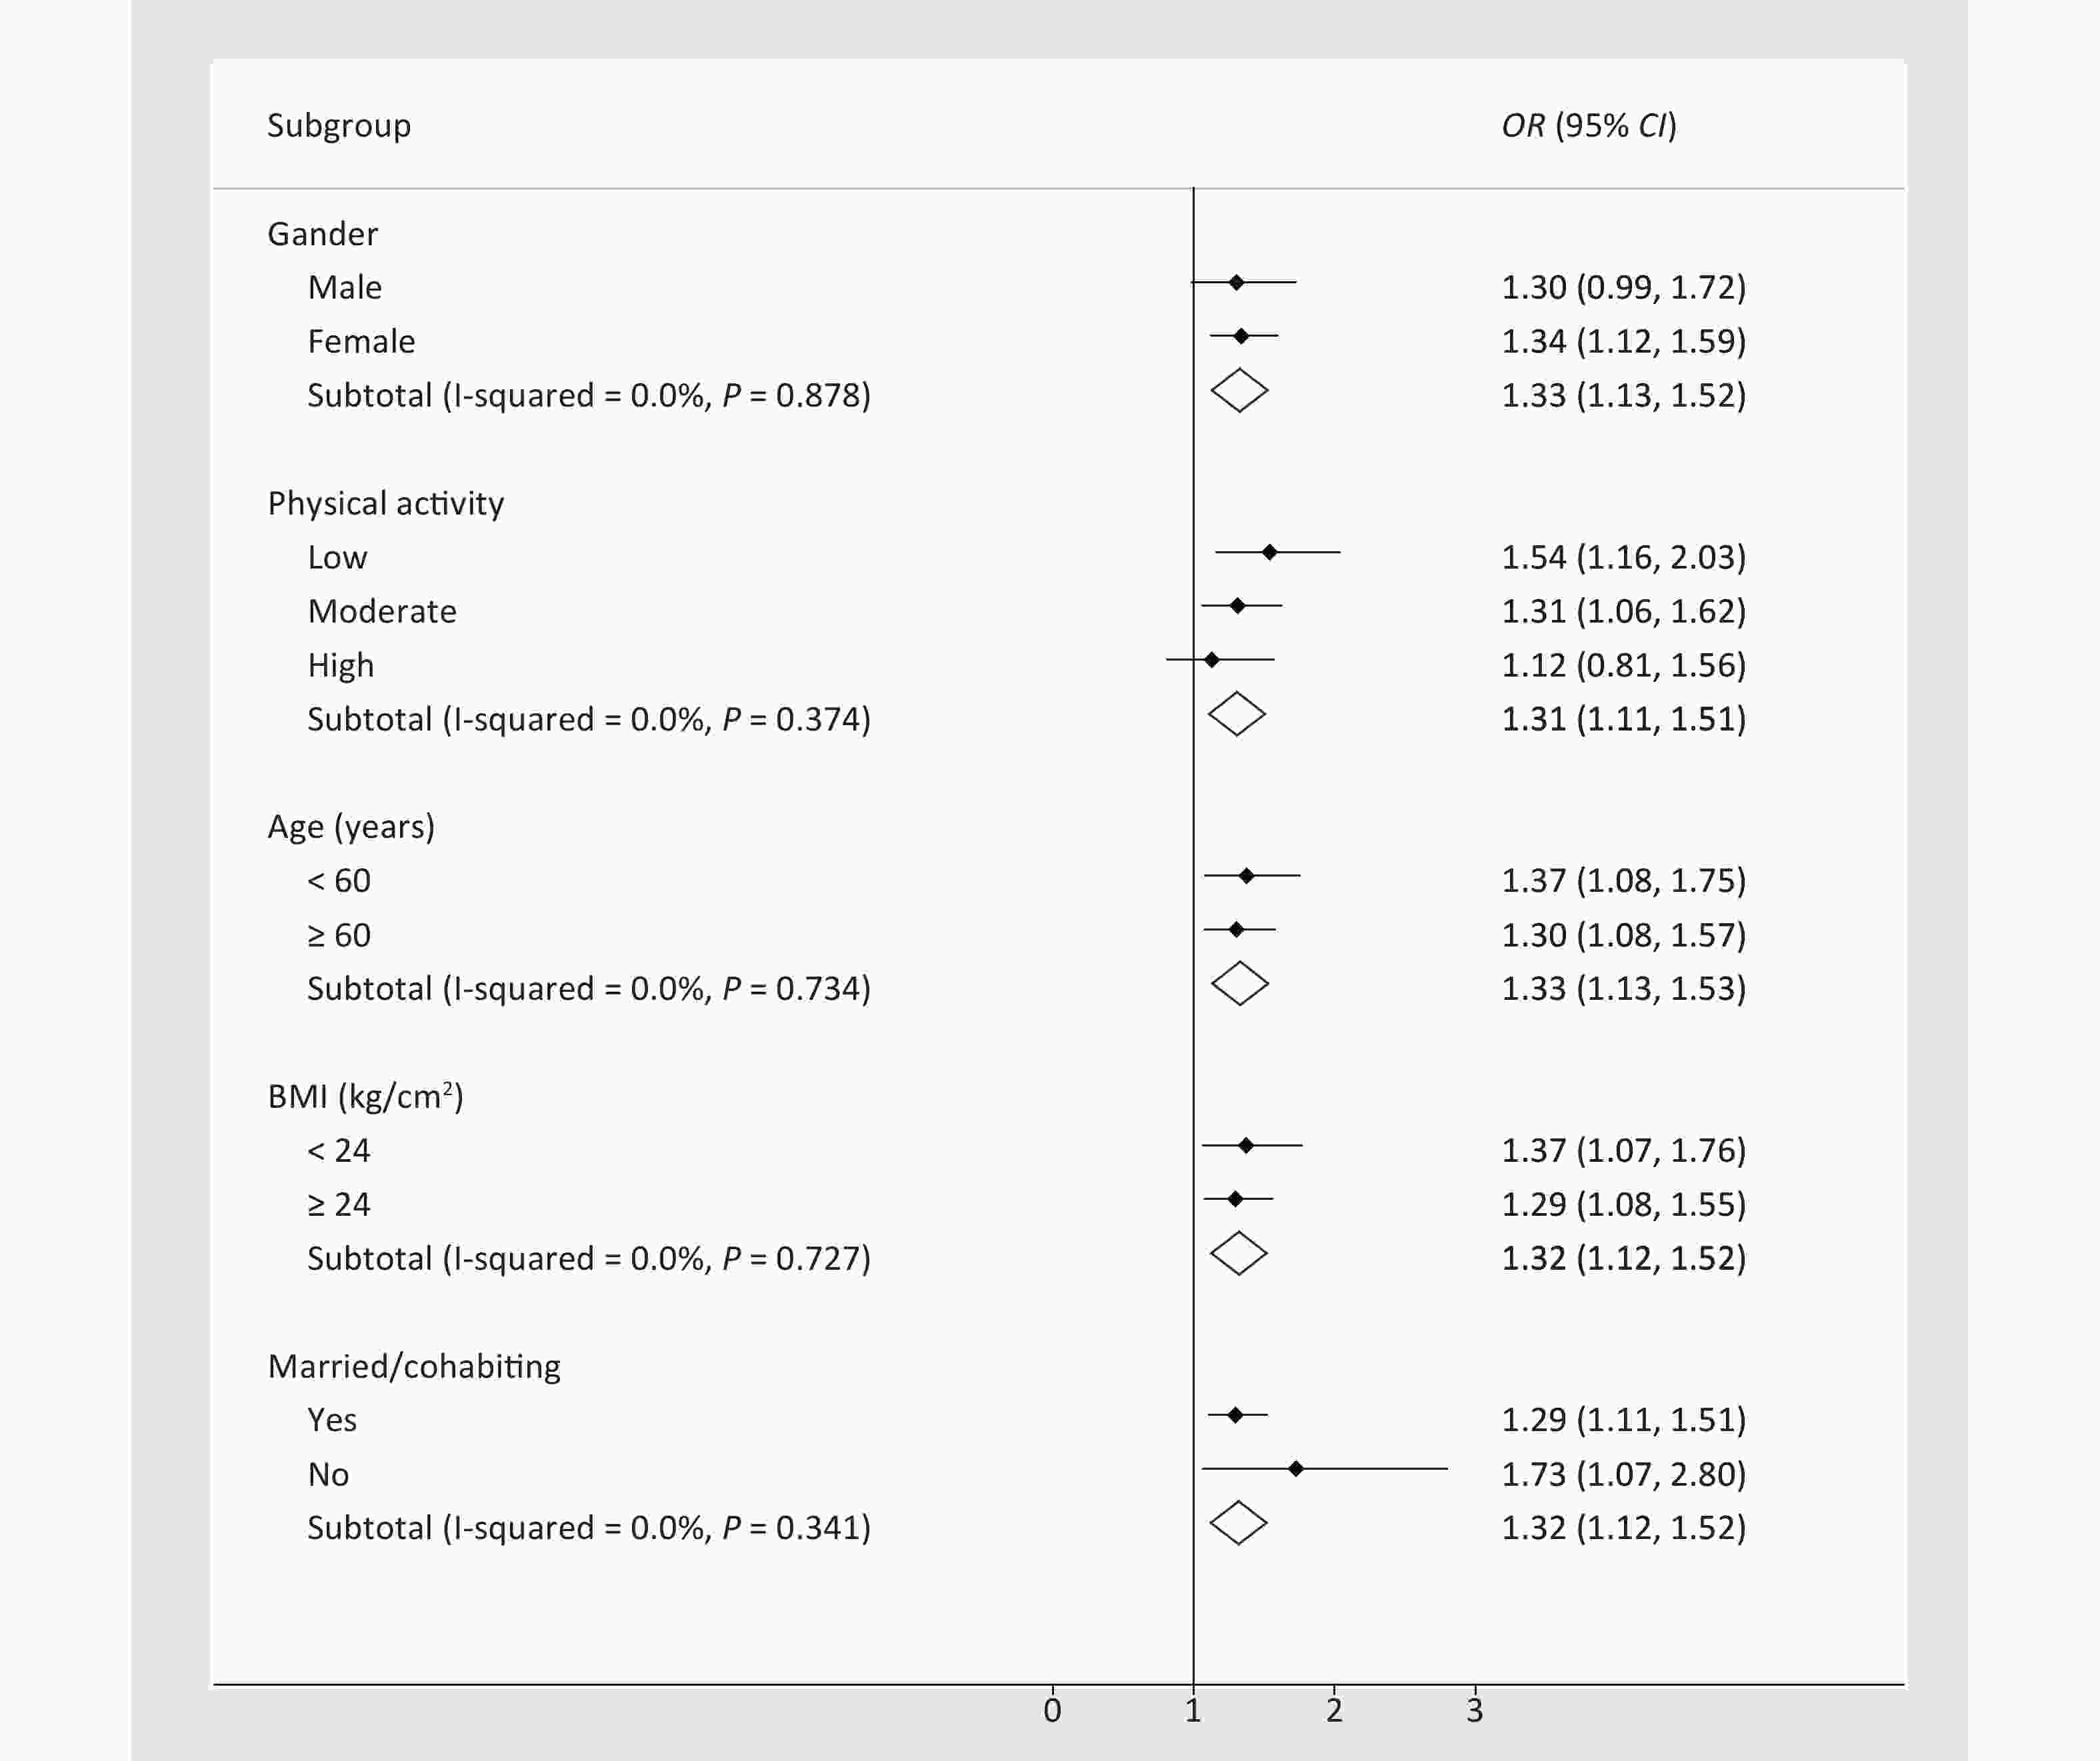
Figure 1. Association between serum Ln-deoxycortisol and dysglycemia with hypertension, stratified by baseline characteristics. The odds ratio (OR) and 95% confidence interval (CI) were calculated by stratified logistic regression adjusted for age, sex, education, marital status, per capita monthly income, drinking and smoking status, BMI, and physical activity. BMI: body mass index.
Item T2DM, n = 838 IFG, n = 850 OR (95% CI) P value OR (95% CI) P value Serum Ln-cortisol Tertile 1 1 1 Tertile 2 1.156 (0.786, 1.700) 0.462 1.359 (0.913, 2.022) 0.130 Tertile 3 1.530 (1.051, 2.228) 0.027 1.555 (1.041, 2.325) 0.031 Ptrand 0.026 0.031 Serum Ln-deoxycortisol Tertile 1 1 1 Tertile 2 1.051 (0.722, 1.530) 0.796 0.861 (0.580, 1.277) 0.456 Tertile 3 1.717 (1.180, 2.498) 0.005 1.429 (0.974, 2.095) 0.068 Ptrand 0.006 0.105 Serum Ln-cortisone Tertile 1 1 1 Tertile 2 0.956 (0.651, 1.404) 0.819 0.965 (0.658, 1.417) 0.857 Tertile 3 0.987 (0.673, 1.447) 0.946 1.047 (0.712, 1.541) 0.814 Ptrand 0.957 0.829 Note. T2DM: type 2 diabetes mellitus; IFG: impaired fasting glucose; OR: odds ratio; CI: confidence interval. Ln-, natural log-transformed. The model was adjusted by age, sex, education, marital status, per capita monthly income, drinking and smoking status, BMI, and physical activity. Table 3. Association between serum Ln-glucocorticoids and dysglycemia with hypertension, stratified by T2DM and IFG
-
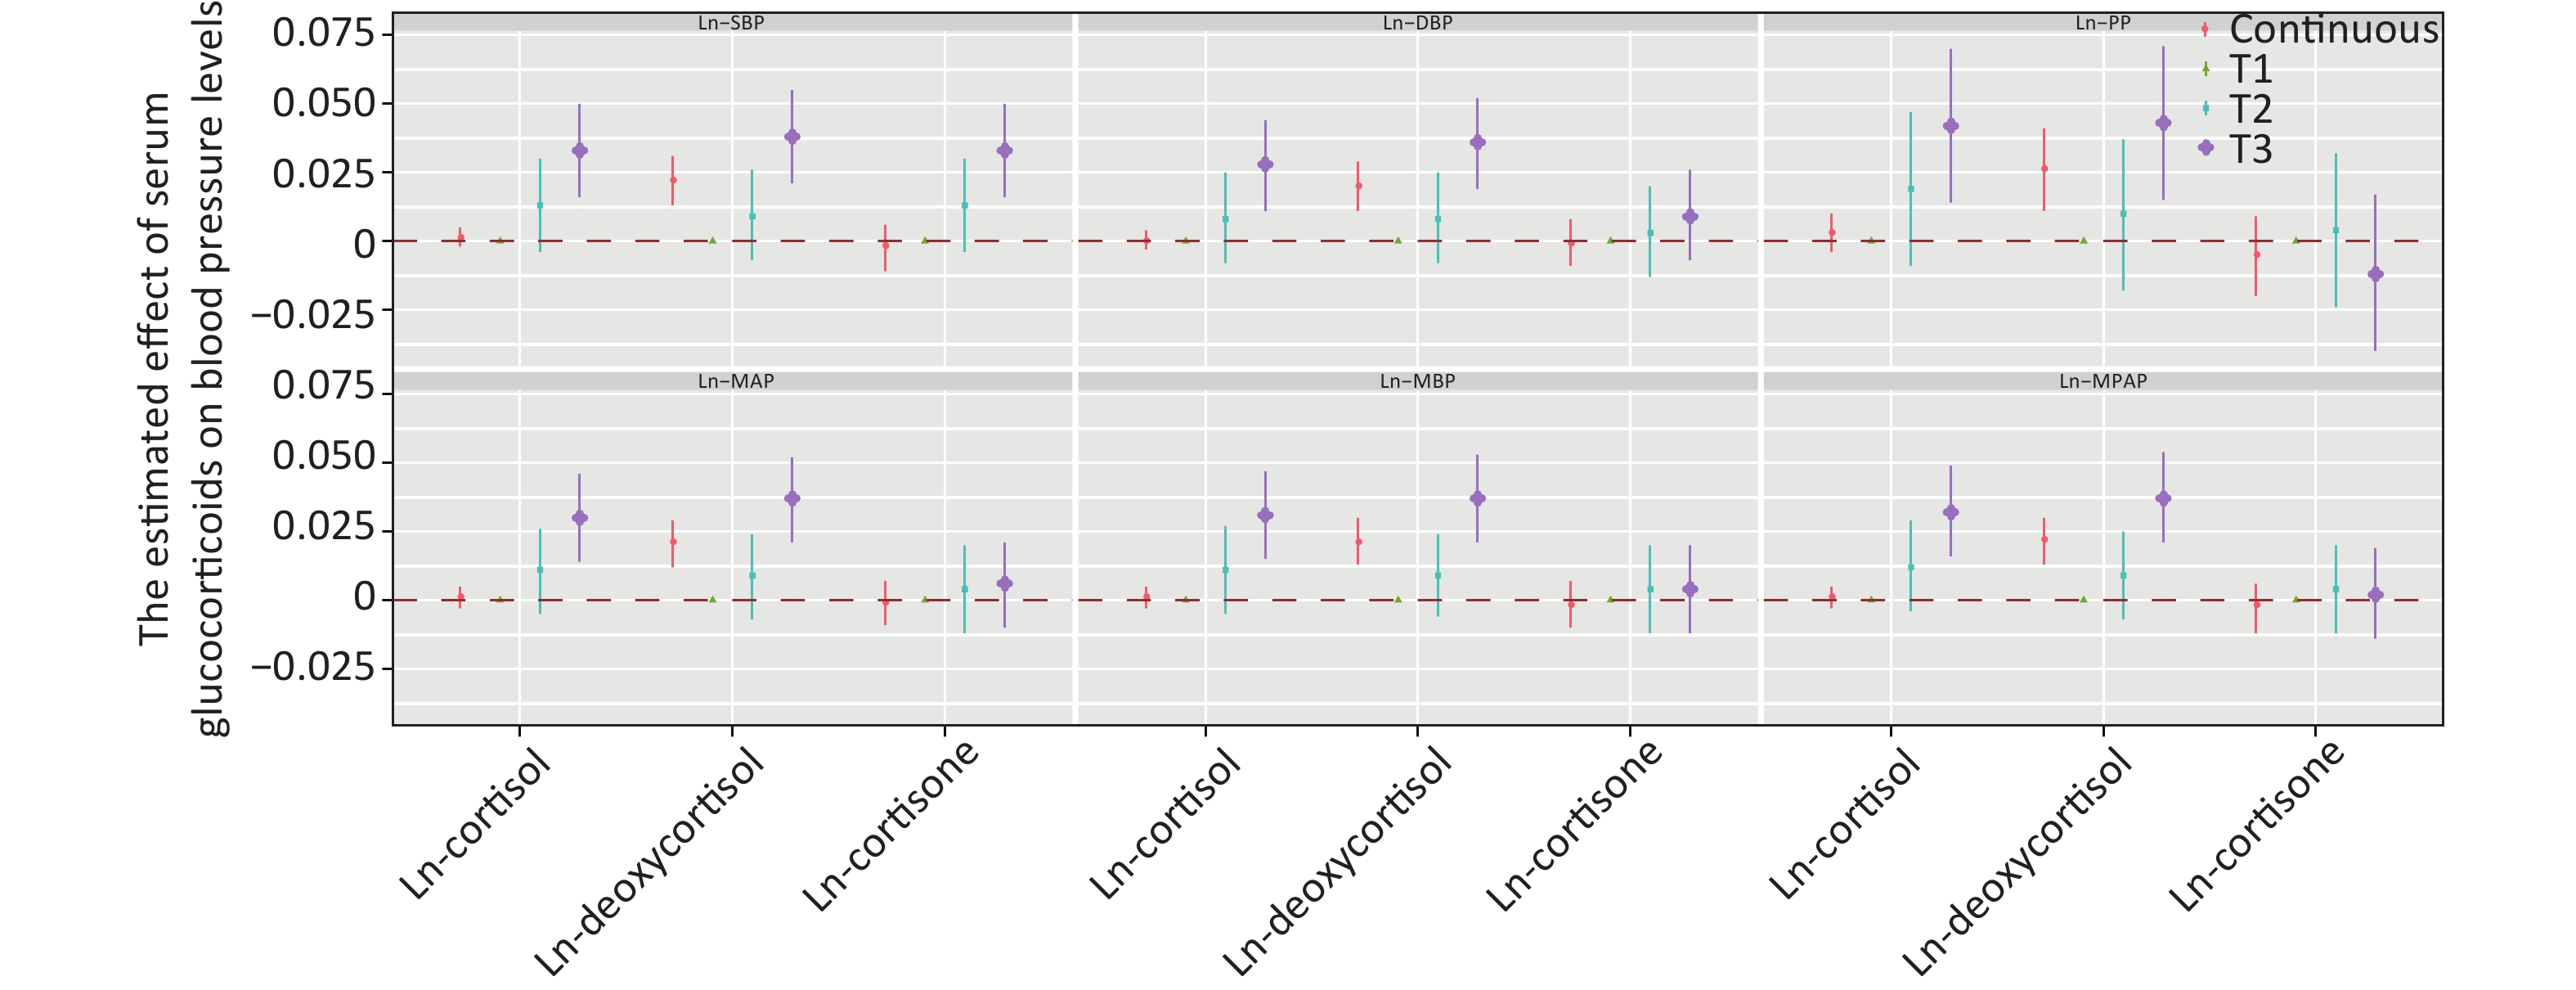
Figure 2 shows the positive correlation between deoxycortisol and various indices of blood pressure. After adjustment for multiple variables and comparison with tertile 1, only the third tertile of Ln-deoxycortisol was associated with a 0.033 mmHg (95% CI: 0.016, 0.050) higher Ln-SBP, 0.036 mmHg (0.019, 0.052) higher Ln-DBP, 0.043 mmHg (0.015, 0.071) higher Ln-PP, 0.037 mmHg (0.021, 0.052) higher Ln-MAP, 0.037 mmHg (0.021, 0.053) higher Ln-MBP, and 0.037 mmHg (0.021, 0.054) higher Ln-MPAP. The results for other models are shown in Supplementary Table S3, available in www.besjournal.com.
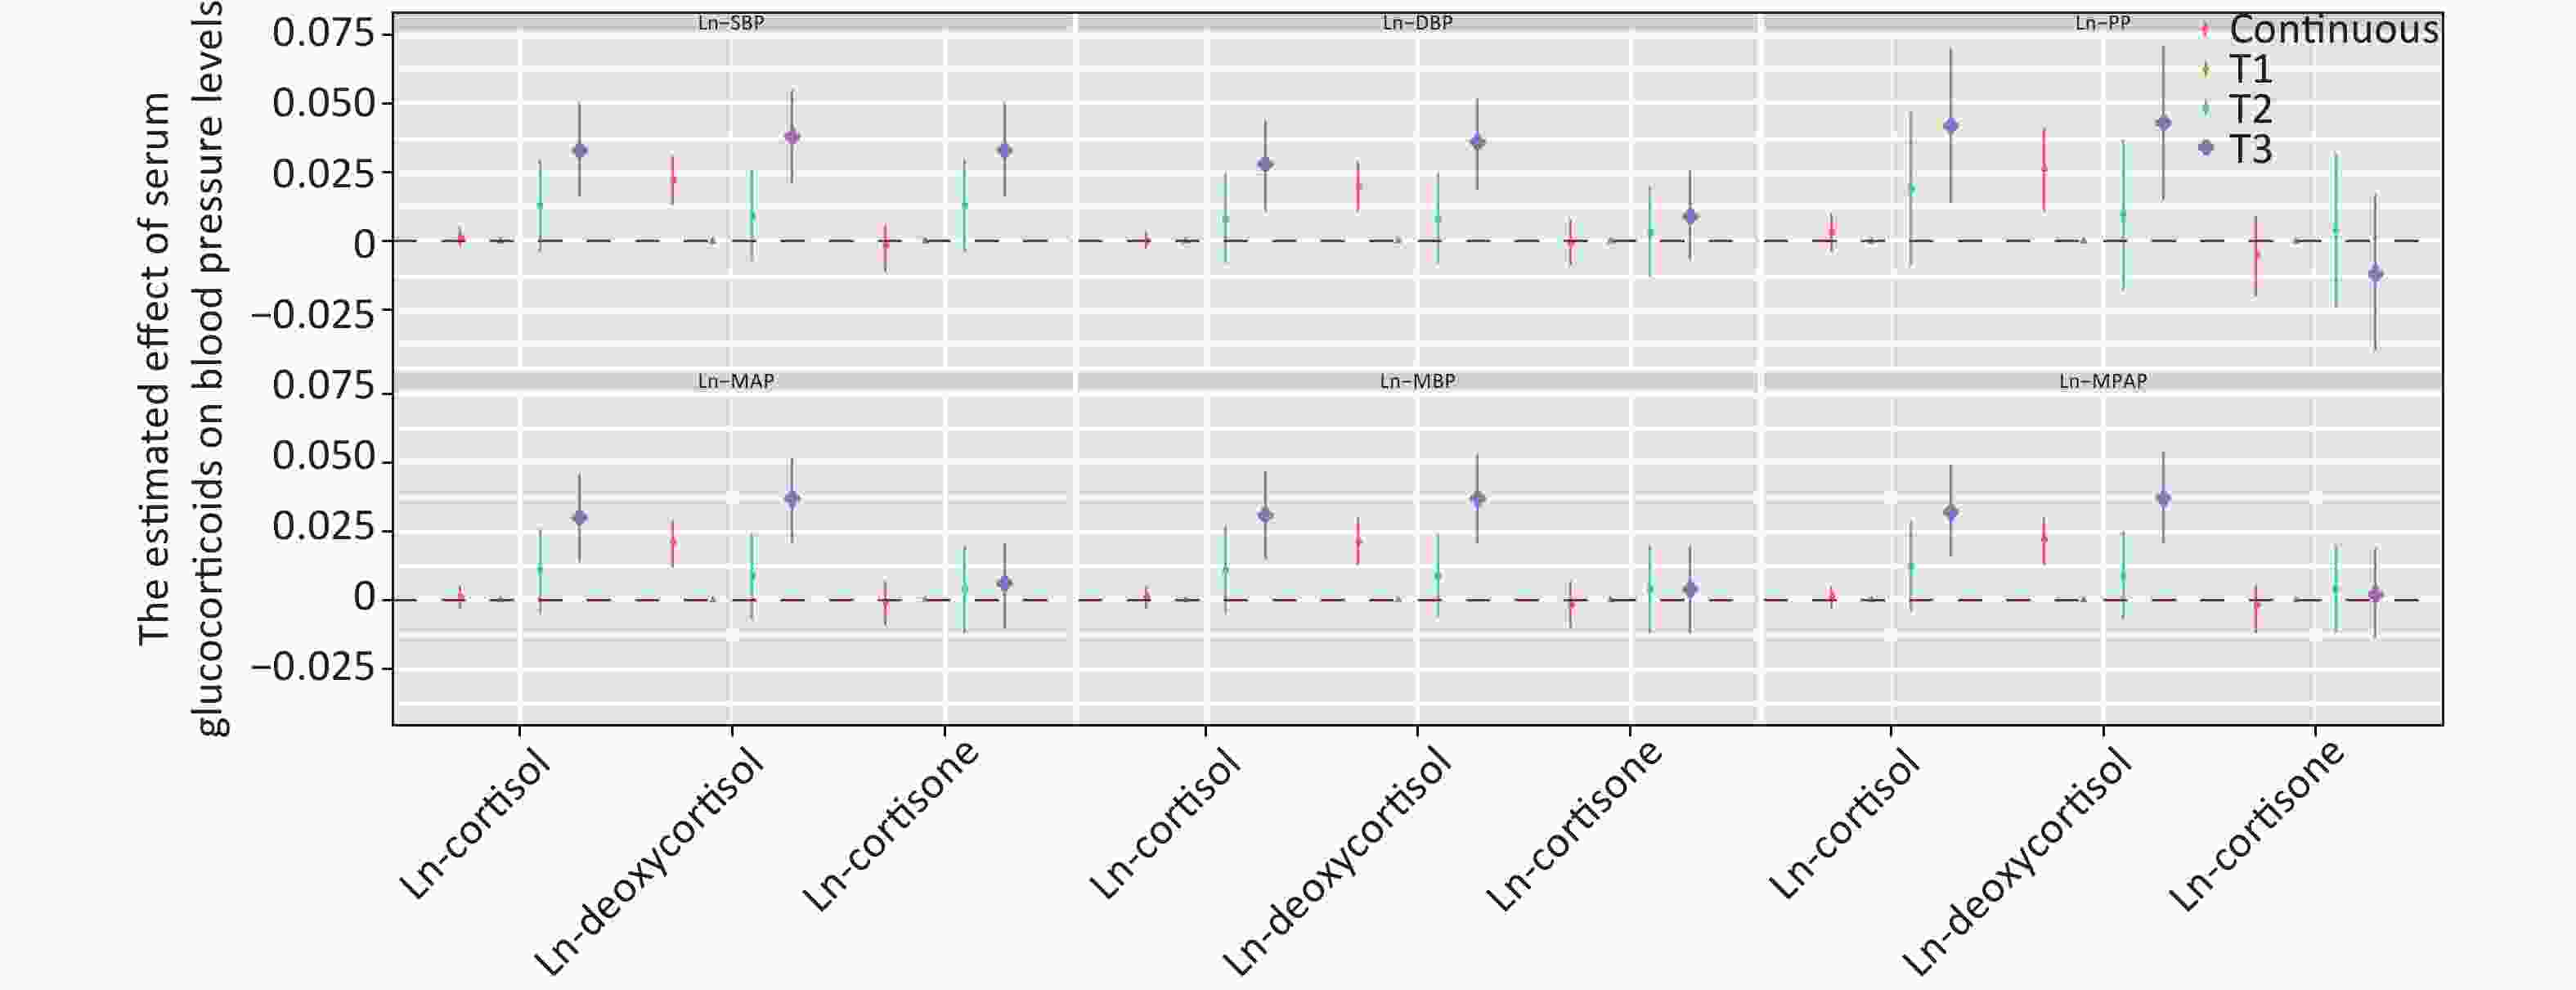
Figure 2. Estimated effect of serum glucocorticoids on blood pressure levels. The β coefficients were assessed by a linear regression model adjusted by age, sex, education, marital status, per capita monthly income, drinking and smoking status, BMI, and physical activity. SBP: systolic blood pressure; DBP: diastolic blood pressure; PP: pulse pressure; MAP: mean arterial pressure; MBP: mean blood pressure; MPAM: mean proportional arterial pressure. Ln-, natural log-transformed.
-
This study established the prevalence of co-morbidities among rural residents of Henan, China. The prevalence of hypertension (32.7%) among people with dysglycemia was not unexpected and has been described in many studies worldwide[4,34-36]. Patients with co-morbidities had higher levels of serum cortisol and deoxycortisol. Glucocorticoids are important insulin anti-regulatory hormones that strongly inhibit insulin action[37]. Increased glucocorticoids therefore may promote insulin resistance, visceral obesity, and hypertension[38]. Animal studies have shown that glucocorticoid action in the bone impairs osteoblast function, thus contributing to insulin resistance[39, 40]. Similarly, patients are prone to developing diabetes in response to high glucocorticoid levels[41]. Excess glucocorticoids can lead to abnormal metabolism and cardiovascular function, thereby inducing hypertension, hyperglycemia, and insulin resistance, which is also commonly found in patients with Cushing syndrome and metabolic syndrome[42, 43].
Our research highlighted that SBP increased with increasing serum deoxycortisol levels. Furthermore, DBP increased with increasing cortisol levels. Abundant evidence has indicated that glucocorticoids, through effects entirely independent of the mineralocorticoid receptor, induce sustained blood pressure elevation in both animals and humans[44-47]. Glucocorticoids improve vascular tension and maintain blood pressure by enhancing the sensitivity of vascular smooth muscle to catecholamine[48, 49]. Glucocorticoids therefore regulate blood pressure through the function of the heart, vascular endothelial cells, and vascular smooth muscle[23, 50, 51]. Consequently, increasing evidence indicates that spontaneous hypertension is associated with the abnormal secretion of glucocorticoids.
Glucocorticoids (deoxycortisol and cortisol) increase the risk of hypertension in people with dysglycemia, particularly those with T2DM. However, the levels of serum glucocorticoids have rarely been reported in pre-diabetic populations. The highest tertile of the Ln-cortisol was significantly associated with an increased risk of pre-diabetes, as compared with the lowest tertile. In a study on a Chinese population[15], the level of plasma cortisol in the T2DM group (5.85 nmol/L) was higher than that in controls (2.7 nmol/L), P < 0.05. A meta-analysis of 93 randomized controlled trials has shown that patients exposed to glucocorticoids have twice the risk of hypertension as those exposed to placebo [odds ratio, 2.2 (1.4–3.8)][52]. Glucocorticoid-mediated hypertension has been commonly thought to be moderated by excess sodium and water reabsorption by the renal mineralocorticoid receptor[53, 54]. In addition, glucocorticoids have been implicated in the regulation of blood pressure via a wide variety of extrarenal tissues, including the vascular smooth muscle, vascular endothelium, central nervous system, and adipose tissue[22, 23, 43, 55, 56].
This study was performed in a large sample cohort, including serum specimens from 1,688 participants with a wide age span. The major strength of this study is that it is the first of its kind, to our knowledge, to assess the relationship between glucocorticoids and an increased risk of hypertension in populations with dysglycemia (including pre-diabetes and T2DM). Moreover, the relationship between glucocorticoids and indices of blood pressure was explored through restrictive cubic spline analysis. Notwithstanding, several study limitations should also be considered. Although glucocorticoid levels fluctuate over time, we used the same morning fasting blood as that performed in other studies to detect glucocorticoids. We did not exclude the participants who used glucocorticoid drugs, because no relevant information was collected. Moreover, this was a case-control study and therefore could not determine whether the association was a causal or coincidental phenomenon. Finally, this was a single study limited to the Chinese Han population, thus potentially limiting the extrapolation of these findings to other racial groups.
-
Glucocorticoids (deoxycortisol and cortisol) increase the risk of hypertension in people with dysglycemia, particularly those with T2DM. High levels of serum glucocorticoids may promote higher SBP, PP, and MAP in people with dysglycemia and hypertension. Given that people with T2DM are already at increased risk of hypertension, patients with higher levels of glucocorticoids should have their blood pressure verified regularly and treated appropriately.
-
This study was conducted according to the guidelines of the Declaration of Helsinki, and the Ethics Committee of Zhengzhou University approved all procedures involving human participants/patients. Written informed consent was obtained from all participants/patients.
-
All authors have read and approve this version of the article, and due care has been taken to ensure the integrity of the work.
-
The data that support the findings of this study are available from The Henan Rural Cohort, but restrictions apply to the availability of these data, which were used under license for the current study and thus are not publicly available. However, data are available from the authors upon reasonable request and with permission of The Henan Rural Cohort.
-
The authors declare no conflicts of interest. Research data are not shared.
-
XL, WJL, and ZXM conceived and designed the study. SBP, CL, DDZ, SCY, JJG, JSL, and CJW performed the investigation. YX, XL, and DDW analyzed the data. YX wrote the manuscript. All authors read and approved the final manuscript.
-
The authors thank the participants and all research staff involved in the current study. The authors thank the anonymous reviewers for their helpful suggestions to improve the article.
Item Serum Ln-cortisol Serum Ln-deoxycortisol Serum Ln-cortisone OR lower CI upper CI P OR lower CI upper CI P OR lower CI upper CI P Sex Male 0.980 0.877 1.095 0.717 1.301 0.985 1.719 0.064 0.885 0.691 1.134 0.335 Female 1.007 0.933 1.086 0.857 1.335 1.121 1.591 0.001 1.061 0.901 1.249 0.481 Physical activity Low 1.070 0.942 1.214 0.299 1.537 1.162 2.034 0.003 0.859 0.668 1.106 0.239 Moderate 1.015 0.922 1.117 0.761 1.311 1.062 1.619 0.012 1.126 0.913 1.390 0.268 High 0.923 0.825 1.033 0.162 1.125 0.810 1.563 0.483 1.013 0.763 1.345 0.930 Age (years) < 60 1.051 0.943 1.173 0.368 1.374 1.080 1.748 0.010 1.073 0.864 1.332 0.523 ≥ 60 0.996 0.893 1.045 0.387 1.302 1.078 1.573 0.006 0.960 0.799 1.154 0.960 BMI (kg/cm2) < 24 1.040 0.925 1.169 0.512 1.370 1.066 1.761 0.014 1.047 0.822 1.334 0.708 ≥ 24 0.980 0.909 1.057 0.603 1.295 1.078 1.554 0.006 0.995 0.842 1.177 0.956 Married/cohabiting Yes 0.991 0.927 1.059 0.783 1.295 1.108 1.514 0.001 0.989 0.857 1.141 0.877 No 1.029 0.843 1.255 0.781 1.726 1.066 2.795 0.026 1.204 0.733 1.977 0.464 Note. OR: odds ratio; CI: confidence interval; BMI: body mass index. Ln-, natural log-transformed. Table S1. Association between serum Ln-glucocorticoids and dysglycemia with hypertension, stratified by baseline characteristics
Item OR (95% CI) P value Serum Ln-cortisol Tertile 1 1 Tertile 2 1.239 (0.909, 1.689) 0.175 Tertile 3 1.682 (1.242, 2.277) 0.001 Ptrand 0.001 Serum Ln-deoxycortisol Tertile 1 1 Tertile 2 1.239 (0.909, 1.689) 0.173 Tertile 3 1.682 (1.242, 2.277) 0.001 Ptrand 0.001 Serum Ln-cortisone Tertile 1 1 Tertile 2 1.007 (0.745, 1.362) 0.964 Tertile 3 1.082 (0.802, 1.460) 0.604 Ptrand 0.602 Note. The model was adjusted by age, sex, education, marital status, per capita monthly income, drinking and smoking status, BMI, and physical activity. OR: odds ratio; CI: confidence interval; Ln-: natural log-transformed. Table S2. Association between serum Ln-glucocorticoids and dysglycemia with hypertension, excluding the population with controlled hypertension
Item Linear regression β coefficients Unadjusted Model 1 Model 2 Model 3 Ln-SBP Ln-cortisol Continuous 0.002 (−0.003, 0.006) 0.002 (−0.002, 0.006) 0.002 (−0.002, 0.006) 0.001 (−0.002, 0.005) Tertile 1 Referent Referent Referent Referent Tertile 2 0.013 (−0.006, 0.031) 0.009 (−0.009, 0.027) 0.009 (−0.008, 0.027) 0.013 (−0.004, 0.030) Tertile 3 0.032 (0.014, 0.050) 0.030 (0.012, 0.047) 0.028 (0.011, 0.046) 0.033 (0.016, 0.050) Ln-deoxycortisol Continuous 0.026 (0.016, 0.036) 0.025 (0.015, 0.034) 0.024 (0.015, 0.034) 0.022 (0.013, 0.031) Tertile 1 Referent Referent Referent Referent Tertile 2 0.017 (−0.001, 0.034) 0.015 (−0.002, 0.032) 0.015 (−0.002, 0.032) 0.009 (−0.007, 0.026) Tertile 3 0.046 (0.028, 0.064) 0.043 (0.025, 0.061) 0.042 (0.025, 0.060) 0.038 (0.021, 0.055) Ln-cortisone Continuous −0.001 (−0.011, 0.008) −0.001 (−0.010, 0.008) −0.001 (−0.010, 0.008) −0.002 (−0.011, 0.006) Tertile 1 Referent Referent Referent Referent Tertile 2 0.003 (−0.015, 0.022) 0.008 (−0.010, 0.026) 0.007 (−0.010, 0.025) 0.013 (−0.004, 0.030) Tertile 3 0.004 (−0.015, 0.022) 0.006 (−0.012, 0.024) 0.006 (−0.012, 0.024) 0.033 (0.016, 0.050) Ln-SDP Ln-cortisol Continuous 0.001 (−0.003, 0.005) 0.001 (−0.00, 0.005) 0.001 (−0.003, 0.005) < 0.001 (−0.003, 0.004) Tertile 1 Referent Referent Referent Referent Tertile 2 0.001 (−0.017, 0.019) 0.004 (−0.014, 0.022) 0.004 (−0.015, 0.022) 0.008 (−0.008, 0.025) Tertile 3 0.022 (0.004, 0.041) 0.024 (0.005, 0.042) 0.022 (0.003, 0.040) 0.028 (0.011, 0.044) Ln-deoxycortisol Continuous 0.022 (0.012, 0.032) 0.024 (0.014, 0.033) 0.023 (0.013, 0.033) 0.020 (0.011, 0.029) Tertile 1 Referent Referent Referent Referent Tertile 2 0.012 (−0.006, 0.030) 0.015 (−0.003, 0.033) 0.015 (−0.003, 0.033) 0.008 (−0.008, 0.025) Tertile 3 0.040 (0.022, 0.059) 0.042 (0.024, 0.060) 0.041 (0.023, 0.059) 0.036 (0.019, 0.052) Ln-cortisone Continuous 0.002 (−0.007, 0.012) 0.002 (−0.007, 0.012) 0.002 (−0.008, 0.011) −0.001 (−0.009, 0.008) Tertile 1 Referent Referent Referent Referent Tertile 2 0.010 (−0.008, 0.029) 0.010 (−0.009, 0.028) 0.008 (−0.010, 0.026) 0.003 (−0.013, 0.020) Tertile 3 0.017 (−0.001, 0.035) 0.017 (−0.002, 0.035) 0.016 (−0.002, 0.034) 0.009 (−0.007, 0.026) Ln-PP Ln-cortisol Continuous 0.002 (−0.005, 0.010) 0.033 (−0.004, 0.010) 0.003 (−0.004, 0.010) 0.003 (−0.004, 0.010) Tertile 1 Referent Referent Referent Referent Tertile 2 0.030 (−0.002, 0.061) 0.017 (−0.012, 0.045) 0.017 (−0.011, 0.046) 0.019 (−0.009, 0.047) Tertile 3 0.046 (0.015, 0.078) 0.038 (0.010, 0.066) 0.039 (0.010, 0.067) 0.042 (0.014, 0.070) Ln-deoxycortisol Continuous 0.033 (0.016, 0.050) 0.027 (0.012, 0.042) 0.027 (0.012, 0.042) 0.026 (0.011, 0.041) Tertile 1 Referent Referent Referent Referent Tertile 2 0.024 (−0.007, 0.054) 0.014 (−0.014, 0.041) 0.014 (−0.014, 0.041) 0.010 (−0.018, 0.037) Tertile 3 0.056 (0.025, 0.088) 0.045 (0.017, 0.074) 0.045 (0.017, 0.073) 0.043 (0.015, 0.071) Ln-cortisone Continuous −0.006 (−0.023, 0.010) −0.006 (−0.021, 0.008) −0.005 (−0.020, 0.009) −0.005 (−0.020, 0.009) Tertile 1 Referent Referent Referent Referent Tertile 2 −0.007 (−0.039, 0.024) 0.005 (−0.023, 0.034) 0.006 (−0.022, 0.034) 0.004 (−0.024, 0.032) Tertile 3 −0.018 (−0.049, 0.014) −0.011 (−0.039, 0.017) −0.009 (−0.038, 0.019) −0.012 (−0.040, 0.017) Ln-MAP Ln-cortisol Continuous 0.001 (−0.003, 0.005) 0.001 (−0.003, 0.005) 0.001 (−0.003, 0.005) 0.001 (−0.003, 0.005) Tertile 1 Referent Referent Referent Referent Tertile 2 0.007 (−0.011, 0.024) 0.006 (−0.011, 0.024) 0.006 (−0.011, 0.023) 0.011 (−0.005, 0.026) Tertile 3 0.027 (0.010, 0.044) 0.026 (0.009, 0.043) 0.025 (0.008, 0.042) 0.030 (0.014, 0.046) Ln-deoxycortisol Continuous 0.024 (0.015, 0.033) 0.024 (0.015, 0.033) 0.024 (0.014, 0.033) 0.021 (0.012, 0.029) Tertile 1 Referent Referent Referent Referent Tertile 2 0.014 (−0.002, 0.031) 0.015 (−0.002, 0.032) 0.015 (−0.002, 0.032) 0.009 (−0.007, 0.024) Tertile 3 0.043 (0.026, 0.060) 0.043 (0.026, 0.060) 0.042 (0.025, 0.059) 0.037 (0.021, 0.052) Ln-cortisone Continuous 0.001 (−0.008, 0.010) 0.001 (−0.008, 0.010) < 0.001 (−0.008, 0.009) −0.001 (−0.009, 0.007) Tertile 1 Referent Referent Referent Referent Tertile 2 0.007 (−0.010, 0.024) 0.009 (−0.008, 0.026) 0.008 (−0.009, 0.025) 0.004 (−0.012, 0.020) Tertile 3 0.011 (−0.006, 0.028) 0.012 (−0.005, 0.029) 0.011 (−0.006, 0.028) 0.006 (−0.010, 0.021) Ln-MBP Ln-cortisol Continuous 0.001 (−0.003,0.005) 0.002 (−0.002, 0.006) 0.001 (−0.003, 0.006) 0.001 (−0.003, 0.005) Tertile 1 Referent Referent Referent Referent Tertile 2 0.008 (−0.009, 0.026) 0.007 (−0.010, 0.024) 0.007 (−0.010, 0.024) 0.011 (−0.005, 0.027) Tertile 3 0.028 (0.011, 0.046) 0.027 (0.010, 0.044) 0.026 (0.009, 0.043) 0.031 (0.015, 0.047) Ln-deoxycortisol Continuous 0.025 (0.015, 0.034) 0.024 (0.015, 0.033) 0.024 (0.015, 0.033) 0.021 (0.013, 0.030) Tertile 1 Referent Referent Referent Referent Tertile 2 0.015 (−0.002, 0.032) 0.015 (−0.002, 0.032) 0.015 (−0.002, 0.031) 0.009 (−0.006, 0.024) Tertile 3 0.044 (0.027, 0061) 0.043 (0.026, 0.060) 0.042 (0.025, 0.059) 0.037 (0.021, 0.053) Ln-cortisone Continuous < 0.001 (−0.009, 0.009) < 0.001 (−0.008, 0.009) < 0.001 (−0.009, 0.009) −0.002 (−0.010, 0.007) Tertile 1 Referent Referent Referent Referent Tertile 2 0.006 (−0.011, 0.023) 0.009 (−0.008, 0.026) 0.008 (−0.009, 0.025) 0.004 (−0.012, 0.020) Tertile 3 0.009 (−0.009, 0.026) 0.010 (−0.007, 0.027) 0.010 (−0.007, 0.027) 0.004 (−0.012, 0.020) Ln-MPAP Ln-cortisol Continuous 0.002 (−0.003, 0.006) 0.002 (−0.002, 0.006) 0.002 (−0.002, 0.006) 0.001 (−0.003, 0.005) Tertile 1 Referent Referent Referent Referent Tertile 2 0.011 (−0.007, 0.029) 0.009 (−0.009, 0.026) 0.009 (−0.009, 0.026) 0.012 (−0.004, 0.029) Tertile 3 0.030 (0.013, 0.048) 0.029 (0.011, 0.046) 0.027 (0.010, 0.045) 0.032 (0.016, 0.049) Ln-deoxycortisol Continuous 0.025 (0.016, 0.035) 0.024 (0.015, 0.034) 0.024 (0.015, 0.033) 0.022 (0.013, 0.030) Tertile 1 Referent Referent Referent Referent Tertile 2 0.016 (−0.001, 0.033) 0.015 (−0.002, 0.032) 0.015 (−0.002, 0.032) 0.009 (−0.007, 0.025) Tertile 3 0.045 (0.027, 0.063) 0.043 (0.025, 0.060) 0.042 (0.025, 0.059) 0.037 (0.021, 0.054) Ln-cortisone Continuous −0.001 (−0.010, 0.009) < 0.001 (−0.009, 0.009) < 0.001 (−0.009, 0.008) −0.002 (−0.010, 0.006) Tertile 1 Referent Referent Referent Referent Tertile 2 0.005 (−0.013, 0.022) 0.009 (−0.009, 0.026) 0.008 (−0.010, 0.025) 0.004 (−0.012, 0.020) Tertile 3 0.006 (−0.012, 0.023) 0.008 (−0.010, 0.025) 0.008 (−0.010, 0.025) 0.002 (−0.014, 0.019) Note. Model 1 was adjusted by age, sex, education, marital status, and per capita monthly income. Model 2 was further adjusted by drinking and smoking status, based on model 1. Model 3 was further adjusted by BMI and physical activity, based on model 2. SBP: systolic blood pressure; DBP: diastolic blood pressure; PP: pulse pressure; MAP: mean arterial pressure; MBP: mean blood pressure; MPAM: mean proportional arterial pressure. Ln-: natural log-transformed. Table S3. Association of Ln-glucocorticoids with Ln-blood pressure
HTML
Study Population
Patient and Public Involvement Statement
Data Collection


Laboratory Measurements
Ascertainment of Dysglycemia
Ascertainment of Hypertension
Statistical Analysis
Basic Characteristics
Trend between Serum Ln-glucocorticoids and Blood Pressure
Association between Serum Ln-glucocorticoids and Dysglycemia with Hypertension
Association between Ln-glucocorticoids and Ln-blood Pressure
Ethics Approval and Consent to Participate
Consent for Publication
Availability of Data and Materials
Competing Interests
Author’s Contributions
Acknowledgements
 21098Supplementary Materials.pdf
|

|

 Quick Links
 DownLoad: