


-
Metabolic syndrome (MetS) has been found to increase the risk of diabetes, cardiovascular disease, and all-cause mortality [1, 2]. It is a rapidly growing epidemic in China with a prevalence of 24.5% [3]. It is closely associated with lifestyles such as dietary intake [4]. Insufficient physical activity (PA) levels and increased sedentary time (ST) are the main lifestyles that increase the risk of MetS in adults [5, 6].
PA has long been considered a key factor in the prevention and management of metabolic risk factors [5]. Many epidemiological studies have reported a significant negative association between PA levels and incidence of MetS in adults [7, 8]; however, the results are inconsistent [9-13]. For total PA, most studies have shown a negative association with MetS [14-16]. Most studies assessing moderate-to-vigorous-intensity physical activity (MVPA) [9, 13, 17-20], vigorous-intensity physical activity (VPA) [18, 19, 21], and moderate-intensity physical activity (MPA) [18, 19, 21, 22] have reported a comparable association between PA and MetS. However, more studies that have assessed light-intensity physical activity (LPA) found no significant association with MetS [11, 12, 15, 19], and only a few studies have reported a negative association[9, 10, 23].
Emerging evidence in the past decade also shows that excessive ST is positively associated with metabolic risk factors [6], an effect that is independent of PA levels [24], as modern lifestyles are characterized by sitting and reclining most of the day. Despite inconsistent results [25], a meta-analysis using objective surveys concluded that MetS is positively associated with ST [6]. A subjective overview of systematic reviews reported a strong association between type-specific sedentary behavior (SB) and MetS [26].
In addition to their independent association with metabolic health, it is also interesting to examine the joint association of the effects of SB and PA on MetS. SB is not necessarily the same as the lack of PA [27], as individuals can meet or exceed the public health guidelines for PA [MPA ≥ 150 minutes/week (min/wk) or VPA ≥ 75 min/wk], but still spend a considerable amount of time in sedentary behaviors. Conversely, those who do not meet the public health guidelines for PA can still engage considerable LPA, accumulating to a high total PA, and have small ST. In this case, for people with sufficient MVPA/long ST/low total PA and people with insufficient MVPA/short ST/ high total PA, the effects of their MVPA and total PA levels may be adverse and inconsistent when MVPA and total PA are used separately as an adjustment variable or exposure variable. However, most previous analyses have only focused on MVPA, not on total PA. This may be a possible reason for the inconsistent association between ST and PA and chronic disease risk. Although studies on the joint association between ST and PA and MetS may conclude that higher ST is associated with increased prevalence of MetS, especially among inactive adults [28], the PA level that is needed to minimize the deleterious effects of long sitting time on MetS is still unclear.
To date, many studies have focused on the association between PA and ST and MetS risk in Western populations [28-31], while few studies have targeted Chinese populations [32, 33]. Most of these studies have a cross-sectional design. Therefore, we analyzed the survey data of 4,865 adults aged ≥ 18 who participated in two rounds of the China Health and Nutrition Survey (CHNS) in 2009 and 2015.
This study aimed to (1) examine the independent association between different types of leisure ST (TV time, computer time, reading time, and total leisure ST), and PA types (LPA, MVPA, and total PA) and MetS risk and (2) examine the joint association between total leisure ST and MVPA or total PA and MetS risk.
-
CHNS is a prospective household-based study that aims to understand China’s long-term social, economic, and demographic changes. The survey used a multistage, random-cluster design to draw samples from 15 provinces (autonomous regions) and has collected 11 rounds of data between 1989 and 2018. The detailed survey design and methods have been reported elsewhere [34]. The study collected fasting blood samples in the 2009 and 2015 surveys; therefore, our analysis focused on subsamples of 5,050 adults aged ≥ 18 years whose blood samples were measured in both surveys. After excluding pregnant and lactating women, people with implausible energy intake [< 500 kilocalories per day (kcal/d) or > 5,000 kcal/d], or people with missing anthropometric, demographic, diet, and other lifestyle data, the final sample included 4,865 adults.
The institutional review committee of the National Institute for Nutrition and Health, Chinese Center for Disease Control and Prevention, approved the survey protocols, instruments, and process of obtaining informed consent for this study. All participants provided their written informed consent before data collection.
-
In our study, PA and ST were evaluated using questionnaires. We recorded the time each participant spent per typical week in PA on weekdays and weekends, including occupational activities (e.g., light, moderate, and heavy), domestic activities (e.g., cooking and washing dishes and clothes), recreational sports activities (e.g., dancing, jogging, swimming, and playing soccer or basketball), and transportation activities (e.g., walking to and from school). In the analysis, we converted the time of each PA type into the metabolic equivalent of task (MET) based on the Compendium of Physical Activities [35] and classified PA into LPA (< 3 METs) and MVPA (≥ 3 METs) groups. We respectively added the MET time (h/w) in LPA and MVPA to get the total LPA and total MVPA and added them to get the total PA. We divided the total LPA, total MVPA, and total PA into tertiles; for LPA as low level (18.6 MET-h/w), medium level (18.6–53.7 MET-h/w), and high level (≥ 53.7 MET-h/w); for MVPA as low level (0 MET-h/w), medium level (0–61.0 MET-h/w), and high level (≥ 61.0 MET-h/w); for total PA as low level (46.6 MET-h/w), medium level (46.6–147.2 MET-h/w), and high level (≥ 147.2 MET-h/w).
SB includes lying down, sitting (reading or using a computer and other forms of screen entertainment), and watching TV. In this study, we mainly examined four sedentary behaviors. The first category, “TV time,” included watching TV, DVD, VCR, video, and online TV. The second category, “computer time,” included using computers, surfing the internet, chatting online, and playing computer games, tablets, mobile phones, and other electronic equipment. The third category, “reading time,” included time for reading, writing, and drawing. The fourth category, “total leisure ST,” was the sum of the above three types of ST. We categorized each type of ST based on the time per week (h/w). We divided TV time into four levels based on the 33.3, 66.7, 90th percentile: < 10.5, 10.5–17.5, 17.5–28, ≥ 28 h/w, computer time, and reading time into two levels, namely, < 7 and ≥ 7 h/w, and the total leisure ST into four levels based on the 33.3, 66.7, and 90th percentile, namely, 14, 14–21, 21–35, ≥ 35 h/w. From the distribution of ST types in our study, the total ST was dominated by TV time.
-
Trained health workers or nurses measured the waist circumference and blood pressure (BP) of the participants following standardized procedures. Waist circumference was measured in centimeters at the midway between the lowest rib margin and the top of the iliac crest using a SECA tape measure. BP was measured at least three times using a standard mercury sphygmomanometer after the participants rested at least 5 min in a seated position. We used the mean of three satisfactory measurements for analyses. Trained nurses collected overnight fasting blood samples. Plasma and serum samples were frozen and stored at −86 degrees centigrade for later laboratory analysis. All samples were analyzed in a national laboratory in Beijing with strict quality control.
-
According to the definition of MetS in the Diagnostic Criteria of Metabolic Syndrome in China [36], we defined that a person with MetS must meet at least three of the five criteria: (1) abdominal obesity, with waist circumference ≥ 90 cm for men and ≥ 85 cm for women; (2) hyperglycemia, with fasting glucose ≥ 6.1 mmol/L and/or diagnosed and treated diabetes; (3) elevated BP, with systolic blood pressure [SBP] ≥ 130 mmHg and/or diastolic blood pressure [DBP] ≥ 85 mmHg and/or diagnosed and treated hypertension; (4) elevated TG, with fasting TG ≥ 1.70 mmol/L; and (5) low HDL-C, with fasting HDL-C < 1.04 mmol/L.
-
Trained interviewers used standardized questionnaires to collect the sociodemographic, diet, and lifestyle characteristics of the participants. Detailed diet data at the household and individual levels were collected using a weighing method in combination with three consecutive 24-h recalls (on one weekend and two weekdays). Daily nutrients and total energy intake were calculated based on the China Food Composition Table [37]. Smoking status was classified as current smoker or non-smoker-. Current smokers were defined as participants who had smoked at least one cigarette per day within the past six months. Drinking status was categorized as regular drinkers and irregular drinkers, and regular-drink was defined as participants who had drunk at least once a month in the last year. We also controlled for sociodemographic factors [such as age group, gender, regions (urban and rural), education (primary school or below, middle school, high school or above), family per capita annual income (< 10,000, 10,000–20,000, 20,000 yuan and above)], and sleep time as potential confounders in the study.
-
To test the difference between normal participants and MetS participants at baseline, mean (standard deviation) was used to describe continuous variables and performed an analysis of variance and used number (percentage) to describe categorical variables and performed chi-square test.
Due to repeated measurements, we used two-level (individual as the second level and measure time as the first level) mixed-effects logistic regression models to examine the independent and joint effects of ST and PA on MetS risk and calculated odds ratio (OR) and 95% confidence interval (95% CI), respectively. We tested the independent effects of different types of ST and PA levels on the risk of abdominal obesity, hyperglycemia, elevated BP, elevated TG, low HDL-C, and MetS. We created 12 groups to test the joint effects of total ST (< 10.5, 10.5–17.5, 17.5–28, and ≥ 28 h/w) on MetS in each tertile of MVPA and total PA and to compare groups with different total leisure ST and MVPA/total PA with those in the lowest ST (< 10.5 h/w) and in the highest tertile of MVPA (≥ 61.0 MET-h/w)/total PA (≥ 147.2 MET-h/w) (referent group). The full mixed-effect models were adjusted for the survey time, baseline covariates of age, region, income level, educational level, energy intake, current smoking, regular drinking, sleep time, and intakes of carbohydrate, protein, fat, cholesterol, and sodium, in each type of ST model; additionally controlled for baseline total PA and other types of ST in each type of PA models; and additionally controlled for total leisure ST and types of PA in total PA models. We used SAS 9.4 (SAS Institute, Inc., Cary, NC, USA) for all statistical analyses.
-
Of the 4,685 participants included in the study, 825 (17.6%) had MetS at baseline in 2009 and 1,188 (25.6%) had MetS in 2015. Table 1 shows the baseline characteristics between the MetS group and the non-MetS group in 2009. We found significant differences between the non-MetS group and MetS group in terms of age, gender, region, education, dietary intake, regular drinking, TV time, and MVPA levels. The MetS group was more likely to be older, male, urban residents, primary school or below, regular drinker, TV time ≥ 28 h/w, non-MVPA, and higher protein and Na intake, but less likely to be middle school, TV time < 7 h/w, in the highest tertile of MVPA, and lower carbohydrate intake.
Parameters Total (4,685) Normal (n = 3,860) MetS (n = 825) P Average age (years)* 51.4 ± 13.0 50.6 ± 13.1 55.2 ± 11.7 < 0.001 Age group (n, %) 18−34 4,959 (10.6) 457 (11.8) 38 (4.6) < 0.001 35−44 992 (21.2) 866 (22.4) 126 (15.3) < 0.001 45−54 1,291 (27.6) 1,062 (27.5) 229 (27.8) 0.382 55−64 1,185 (25.3) 926 (24.0) 259 (31.4) < 0.001 65− 722 (15.4) 549 (14.2) 173 (21.0) < 0.001 Gender (n, %) 0.015 Male 2,104 (44.9) 1,694 (43.9) 410 (49.7) Female 2,581 (55.1) 2,166 (56.1) 415 (50.3) Region (n, %) 0.031 City 1,334 (28.5) 1,060 (27.5) 274 (33.2) Country 3,351 (71.5) 2,800 (72.5) 551 (66.8) Education (n, %) Primary school/below 2,153 (46.0) 1,754 (45.4) 399 (48.4) 0.007 Middle school 1,571 (33.5) 1,313 (34.0) 258 (31.3) 0.002 High school/above 961 (20.5) 793 (20.6) 168 (20.4) 0.934 Annual per capital family income (yuan) (n, %) < 10,000 2,295 (49.0) 1,888 (48.9) 407 (49.3) 0.056 10,000−20,000 1,195 (25.5) 1,020 (26.4) 175 (21.2) 0.073 ≥ 20,000 1,195 (25.5) 952 (24.7) 243 (29.5) 0.114 Dietary intake* Carbohydrate (g/day) 298.0 ± 111.1 299.8 ± 109.9 289.8 ± 116.2 0.004 Protein (g/day) 68.1 ± 25.4 67.9 ± 25.2 69.2 ± 26.4 0.011 Fat (g/day) 79.1 ± 41.4 79.2 ± 40.7 78.9 ± 44.4 0.109 Cholesterol (g/day) 263.3 ± 209.9 262.5 ± 209.7 267.0 ± 211.0 0.586 Na (mg/day) 5275.5 ± 4533.8 5184.0 ± 4392.5 5704.3 ± 5125.9 0.047 Kcal (kcal/day) 2234.7 ± 716.1 2,240.8 ± 710.5 2206.1 ± 742.0 0.292 Current smoker (n, %) 1,427 (30.5) 1,160 (30.1) 267 (32.4) 0.201 Regular drinking (n, %) 1,328 (28.4) 1,068 (27.7) 260 (31.5) 0.008 Sleep time (h/day)* 7.7 ± 2.2 7.7 ± 2.2 7.7 ± 2.0 0.566 Leisure ST (h/w) (n, %) TV time < 10.5 1,491 (31.8) 1,263 (32.7) 228 (27.6) 0.012 10.5−17.5 1,666 (35.6) 1,386 (35.9) 280 (33.9) 0.071 17.5−28 889 (19.0) 717 (18.6) 172 (20.9) 1.319 ≥ 28 63 (13.6) 494 (12.8) 145 (17.6) 0.024 Computer time 0.186 < 7 4,280 (91.4) 3,536 (91.6) 744 (90.2) ≥ 7 405 (8.6) 324 (8.4) 81 (9.8) Reading time 0.295 < 7 4,307 (91.9) 3,556 (92.1) 751 (91.0) ≥ 7 378 (8.1) 304 (7.9) 74 (9.0) Total leisure ST < 14 1,474 (31.5) 1,252 (32.4) 222 (26.9) < 0.001 14−21 1,444 (30.8) 1,187 (30.8) 257 (31.2) 0.337 21−35 1,259 (26.9) 1,029 (26.7) 230 (27.9) 0.216 ≥ 35 508 (10.8) 392 (10.2) 116 (14.1) < 0.001 Total time Physical activity (METs.h/w) (n, %) LPA Low (< 18.6) 1,392 (29.7) 1,159 (30.0) 233 (28.2) 0.777 Medium (18.6−53.7) 1,671 (35.7) 1,352 (35.0) 319 (38.7) 0.854 High (≥ 53.7) 1,622 (34.6) 1,349 (35.0) 273 (33.1) 0.71 MVPA Low (= 0) 1,918 (40.9) 1,502 (38.9) 416 (50.4) < 0.001 Medium (0−61.0) 1,048 (22.4) 850 (22.2) 198 (24.0) 0.21 High (≥ 61.0) 1,719 (36.7) 1,508 (39.1) 211 (25.6) < 0.001 Total PA Low (< 46.6) 1,374 (29.3) 1,075 (27.9) 299 (36.2) < 0.001 Medium (46.6−147.2) 1,598 (34.1) 1,286 (33.3) 312 (37.8) 0.54 High (≥ 147.2) 1,713 (36.6) 1,499 (38.8) 214 (25.9) < 0.001 MetS components (n, %) Abnomial obesity 1,634 (34.9) 935 (24.2) 699 (84.7) < 0.001 Hyperglycemia 638 (13.6) 267 (6.9) 371 (45.0) < 0.001 Raised TG 1,507 (32.2) 807 (20.9) 700 (84.9) < 0.001 Reduced HDL_C 618 (13.2) 253 (6.6) 365 (44.2) < 0.001 Raised BP 1,761 (37.6) 1,124 (29.1) 637 (77.2) < 0.001 Note. MetS: metabolic syndrome; PA: physical activity; met: metabolic equivalent; h/w: hours per week; MET: Metabolic equivalent of task; MVPA Moderate-to-vigorous-intensity physical activity; HDL: high-density lipoprotein cholesterol; MET: metabolic equivalent of task; *: means (standard deviations) and conducted an analysis of variance (ANOVA). Table 1. Baseline characteristics of the study populations stratified by MetS in 2009
-
Table 2 shows the association between the risks of MetS and its components and the levels of different types of leisure ST and PA at baseline. After adjusting for all covariates, higher levels of TV time were associated with abdominal obesity (OR 1.4, 95% CI 1.1–1.7, Ptrend < 0.001), hyperglycemia (OR 1.3, 95% CI 1.0–1.7, Ptrend = 0.012), elevated TG (OR 1.3, 95% CI 1.1–1.7, Ptrend = 0.006), and MetS (OR 1.3, 95% CI 1.1–1.6, Ptrend < 0.001). The computer time > 7 h/w group had a higher risk of low HDL-C (OR 1.4, 95% CI 1.1–1.7) and MetS (OR 1.5, 95% CI 1.2–1.9) than the computer time < 7 h/w group. A higher level of total leisure ST was associated with abdominal obesity (OR 1.2, 95% CI 1.0–1.5, Ptrend < 0.001), hyperglycemia (OR 1.3, 95% CI 1.0–1.6, P trend < 0.001), elevated TG (OR 1.4, 95% CI 1.2–1.7, Ptrend < 0.001), and MetS (OR 1.4, 95% CI 1.2–1.8, Ptrend < 0.001). The effects of reading level were not significant.
Parameters N Abdominal obesity Hyperglycemia Raised TG Reduced HDL_C Raised BP MetS subjects Model 1 Model 2 Model 1 Model 2 Model 1 Model 2 Model 1 Model 2 Model 1 Model 2 Model 1 Model 2 Leisure ST (h/w) TV time < 10.5 1,491 ref ref ref ref ref ref ref ref ref ref ref ref 10.5−17.5 1,666 1.1
(0.9, 1.3)1.1
(0.9, 1.3)1.0
(0.8, 1.3)1.0
(0.8, 1.3)1.0
(0.8, 1.2)1.1
(1.0, 1.2)*0.9
(0.7, 1.1)1.0
(0.8, 1.2)1.3
(0.9, 1.6)1.3
(0.9, 1.6)1.0
(0.9, 1.2)1.0
(0.9, 1.2)17.5−28 889 1.2
(1.0, 1.4)*1.2
(1.0, 1.5)*1.1
(0.9, 1.3)1.1
(1.0, 1.3)*1.2
(1.0, 1.4)1.2
(1.0, 1.4)*1.0
(0.8, 1.2)1.0
(0.8, 1.2)1.2
(0.9, 1.4)1.2
(0.9, 1.5)1.3
(1.1, 1.5)**1.2
(1.1, 1.5)**≥ 28 639 1.3
(1.1, 1.6)**1.4
(1.1, 1.7)**1.4
(1.1, 1.8)**1.3
(1.0, 1.7)**1.4
(1.1, 1.7)**1.3
(1.1, 1.7)**1.1
(0.9, 1.4)1.0
(0.8, 1.3)1.0
(0.9, 1.3)1.1
(0.9, 1.3)1.4
(1.2, 1.7)**1.3
(1.1, 1.6)**Ptrend < 0.001 < 0.001 0.001 0.012 < 0.001 0.006 0.347 0.992 0.429 0.566 < 0.001 < 0.001 Computer time < 7 4,280 ref ref ref ref ref ref ref ref ref ref ref ref ≥ 7 405 1.2
(1.0, 1.4)1.2
(1.0, 1.4)1.2
(0.9, 1.5)1.1
(0.9, 1.4)1.7
(1.4, 2.0)**1.5
(0.9, 1.8)1.4
(1.2, 1.7)**1.4
(1.1, 1.7)**1.0
(0.8, 1.2)1.1
(0.9, 1.3)1.6
(1.3, 2.0)**1.5
(1.2, 1.9)**Reading time < 7 4,307 ref ref ≥ 7 378 1.1
(0.9, 1.4)1.1
(0.9, 1.4)1.0
(0.8, 1.3)1.0
(0.7, 1.2)1.1
(0.9, 1.3)0.8
(0.7, 1.0)1.2
(0.9, 1.5)1.0
(0.8, 1.3)0.9
(0.8, 1.1)1.0
(0.8, 1.3)1.1
(0.9, 1.4)1.0
(0.8, 1.2)Total leisure ST < 14 1,474 ref ref ref ref ref ref ref ref ref ref ref ref 14−21 1,444 1.2
(1.0, 1.3)*1.2
(1.0, 1.3)*1.1
(0.9, 1.3)1.0
(0.9, 1.2)1.2
(1.1, 1.4)**1.2
(1.1, 1.4)**1.1
(0.9, 1.3)1.1
(0.9, 1.3)1.0
(0.9, 1.1)1.0
(0.9, 1.1)1.2
(1.0, 1.4)*1.1
(0.9, 1.3)21−35 1,259 1.2
(1.0, 1.3)*1.2
(1.0, 1.4)*1.2
(1.0, 1.5)*1.2
(0.9, 1.4)1.2
(1.1, 1.4)**1.2
(1.1, 1.5)**1.1
(0.9, 1.3)1.1
(0.9, 1.2)1.0
(0.9, 1.2)1.0
(0.9, 1.1)1.3
(1.1, 1.5)**1.2
(1.0, 1.4)*≥ 35 508 1.4
(1.2, 1.7)**1.2
(1.0, 1.5)**1.4
(1.1, 1.8)**1.3
(1.0, 1.6)*1.6
(1.3, 1.9)**1.4
(1.2, 1.7)**1.4
(1.1, 1.7)**1.2
(0.9, 1.4)0.9
(0.7, 1.1)0.9
(0.7, 1.1)1.7
(1.4, 2.0)**1.4
(1.2, 1.8)**Ptrend < 0.001 0.008 < 0.001 < 0.001 < 0.001 < 0.001 0.014 0.853 0.744 0.639 < 0.001 < 0.001 Note. The model 1 adjusted only for baselined gender, age, region, education, income and wave; the model 2 full adjusted the covariates including baselined carbohydrate, protein, fat, cholesterol, Na, kcal, regular drinking, current smoking, sleep time, total PA besides those in model 1, and when each type of ST was studied, the other types of sedentary excluding the total ST were acted as covariates. *P < 0.05; **P < 0.001. Table 2. Prospective associations of risk of MetS and its components with levels of leisure ST at baseline, OR (95%) CI
-
Table 3 shows the association between MetS risk and the levels of different types of baseline PA time. After adjusting for all covariates, higher levels of MVPA time were associated with a lower risk of abdominal obesity (OR 0.8, 95% CI 0.7–0.9, Ptrend = 0.008), elevated TG (OR 0.7, 95% CI 0.6–0.8, Ptrend = 0.011), lower HDL-C (OR 0.8, 95% CI 0.7–0.9, Ptrend = 0.031), elevated BP (OR 0.8, 95% CI 0.7–0.9, Ptrend = 0.031), and MetS (OR 0.7, 95% CI 0.6–0.9, Ptrend < 0.001). Higher levels of total PA time were associated with a lower risk of abdominal obesity (OR 0.8, 95% CI 0.7–0.9, Ptrend = 0.003), elevated TG (OR 0.8, 95% CI 0.7–0.9, Ptrend = 0.020), and MetS (OR 0.8, 95% CI 0.7–0.9, Ptrend < 0.001).
Parameters N Abdominal obesity Hyperglycemia Raised TG Reduced HDL_C Raised BP MetS subjects Model 1 Model 2 Model 1 Model 2 Model 1 Model 2 Model 1 Model 2 Model 1 Model 2 Model 1 Model 2 Total time Physical activity (METs-h/w) LPA Low 1,392 ref ref ref ref ref ref ref ref ref ref ref ref Medium 1,671 1.2
(1.0, 1.4)**1.1
(0.9, 1.3)1.0
(0.9, 1.2)1.0
(0.9, 1.2)1.2
(0.9, 1.3)1.1
(0.9, 1.3)1.2
(1.0, 1.4)*1.2
(0.9, 1.4)1.2
(1.0, 1.3)*1.1
(0.9, 1.3)1.2
(1.0, 1.4)*1.2
(0.9, 1.4)High 1,622 1.2
(0.9, 1.4)1.1
(0.9, 1.3)1.2
(0.9, 1.4)1.1
(0.9, 1.4)1.0
(0.9, 1.2)1.0
(0.9, 1.2)1.1
(0.9, 1.3)1.1
(0.9, 1.3)1.2
(0.9, 1.3)1.2
(0.9, 1.4)1.2
(0.9, 1.5)1.1
(0.9, 1.4)Ptrend 0.085 0.548 0.125 0.294 0.491 0.914 0.1 0.165 0.087 0.054 0.051 0.123 MVPA Low 1,918 ref ref ref ref ref ref ref ref ref ref ref ref Medium 1,048 1.0
(0.9, 1.1)0.9
(0.8, 1.1)0.9
(0.8, 1.1)0.9
(0.7, 1.0)1.0
(0.9, 1.1)1.0
(0.8, 1.1)0.9
(0.8, 1.0)0.9
(0.8, 1.1)0.9
(0.8, 1.0)0.9
(0.7, 1.0)*1.0
(0.8, 1.1)0.9
(0.8, 1.1)High 1,719 0.8
(0.7, 0.9)**0.8
(0.7, 0.9)**0.9
(0.7, 1.0)0.9
(0.8, 1.0)0.7
(0.6, 0.8)**0.7
(0.6, 0.8)**0.7
(0.6, 0.8)**0.8
(0.7, 0.9)**0.9
(0.8, 1.0)*0.8
(0.7, 0.9)**0.7
(0.6, 0.8)**0.7
(0.6, 0.9)**Ptrend 0.02 0.008 0.015 0.03 0.002 0.011 0.02 0.085 0.045 0.031 < 0.001 < 0.001 Total PA Low 1,374 ref ref ref ref ref ref ref ref ref ref ref ref Medium 1,598 1.0
(0.9, 1.1)1.0
(0.9, 1.1)1.0
(0.8, 1.1)0.9
(0.8, 1.1)1.0
(0.9, 1.2)1.0
(0.9, 1.2)1.0
(0.9, 1.1)1.0
(0.9, 1.2)1.0
(0.9, 1.1)1.0
(0.9, 1.1)1.0
(0.9, 1.2)1.0
(0.9, 1.2)High 1,713 0.8
(0.7, 0.9)**0.8
(0.7, 0.9)**0.9
(0.8, 1.0)0.9
(0.8, 1.0)0.7
(0.6, 0.8)**0.8
(0.7, 0.9)**0.8
(0.7, 0.9)**0.9
(0.8, 1.1)1.0
(0.8, 1.1)0.9
(0.8, 1.0)0.7
(0.6, 0.8)**0.8
(0.7, 0.9)**Ptrend 0.003 0.003 0.158 0.356 0.019 0.020 0.022 0.096 0.765 0.774 < 0.001 < 0.001 Note. The model 1 adjusted only for baselined gender, age, region, education, income and wave, and the model 2 full adjusted the covariates besides those in model 1, including baselined, carbohydrate, protein, fat, cholesterol, Na, kcal, regular drinking, current smoking, sleep time, total leisure ST, and when each type of PA was studied, the other types of PA excluding the total PA were acted as covariates. Classification of LPA, MVPA and total PA were based on the tertiles of the amounts per week (MET-h/w), there were LPA: low level (_ 18.6 MET-h/w), medium level (18.6–53.7 MET-h/w), and high level (≥ 53.7 MET-h/w); MVPA: low level (0 MET-h/w), medium level (0–61.0 MET-h/w), and high level (≥ 61.0 MET-h/w); total PA: low level (46.6 MET-h/w), medium level (46.6–147.2 MET-h/w), and high level (≥ 147.2 MET-h/w). Table 3. Prospective associations of risk of MetS and its components with levels of Physical activity at baseline, OR (95%) CI
-
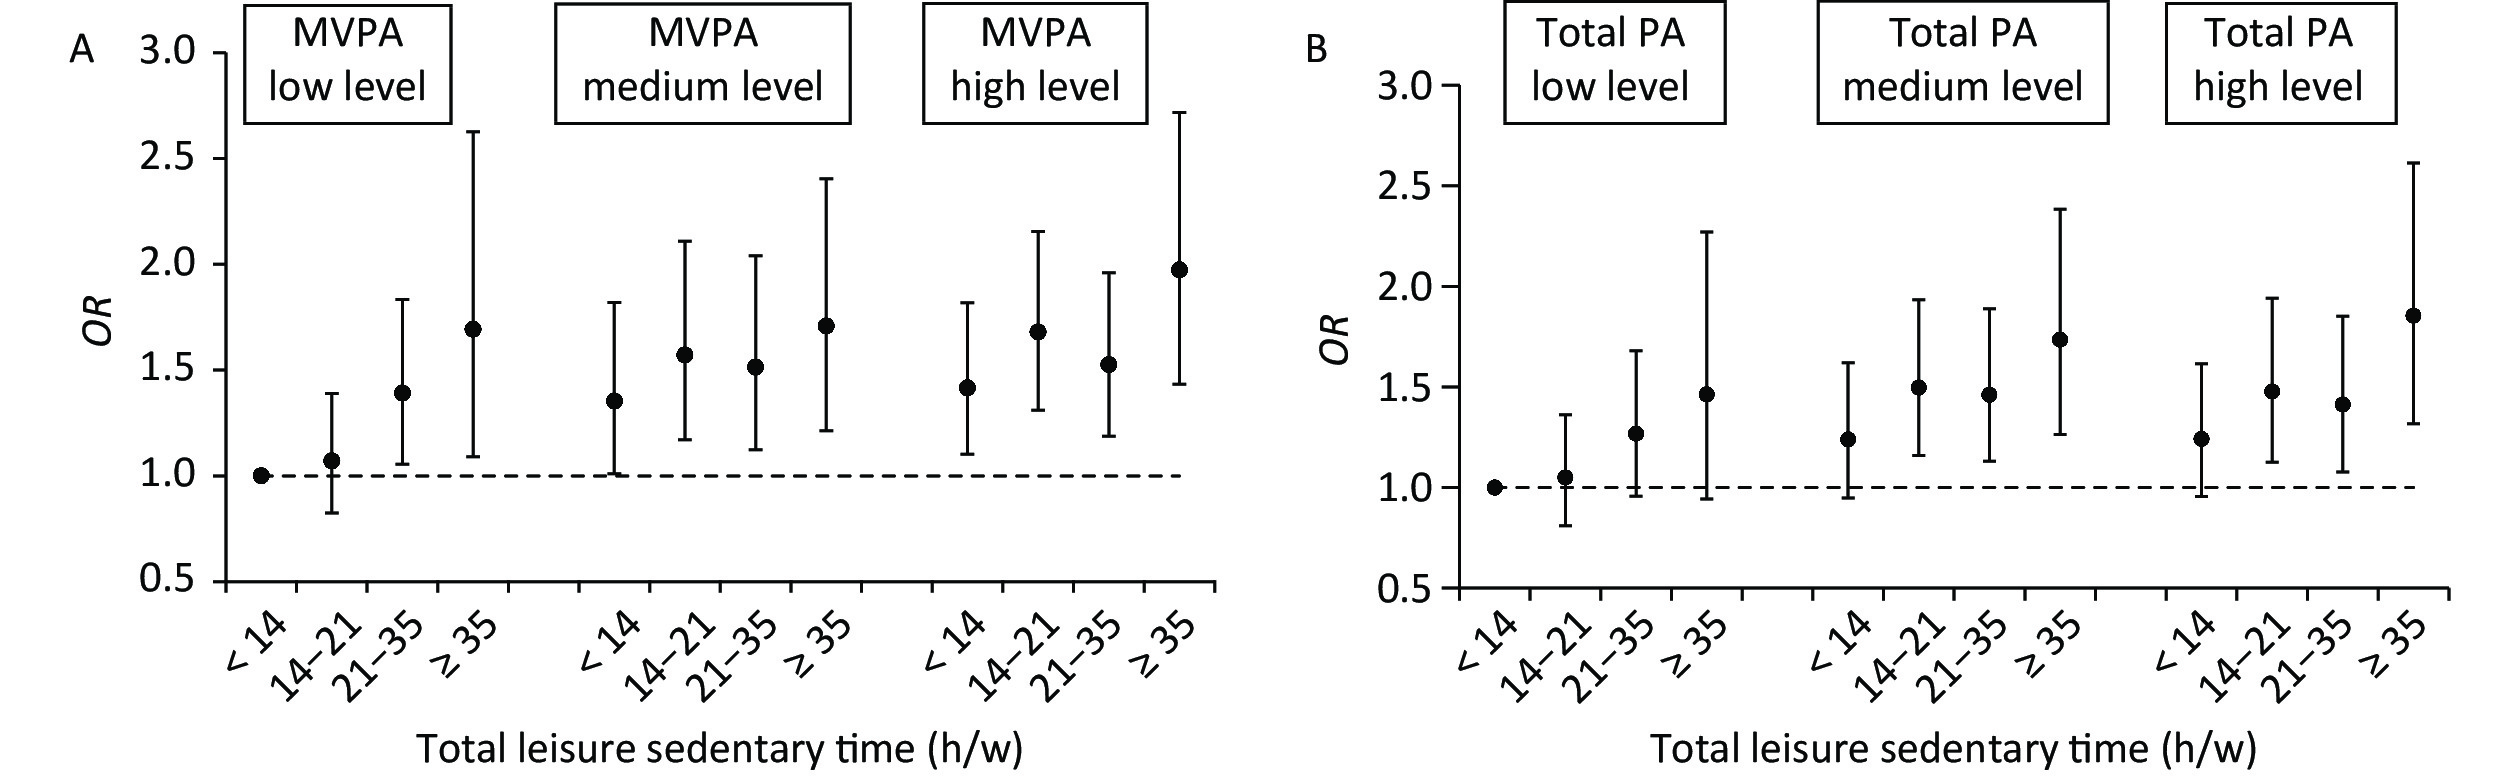
Figure 1A shows the joint association between total ST and MVPA and MetS. Those reporting the highest total leisure ST (≥ 35 h/w) and the lowest levels of MVPA (0 MET-h/w) had a twofold higher odds of MetS (OR 2.0, 95% CI 1.4–2.7) than the reference group (those reporting the lowest level of total leisure ST (< 14 h/w) and the highest tertile of MVPA (≥ 61.0 MET-h/w). Those reporting the highest total leisure ST (≥ 35 h/w) with a medium level of MVPA (0–61.0 MET-h/w) had a 70% higher odds (OR 1.7, 95% CI 1.2–2.4), and those reporting the highest total leisure ST with the highest tertile of MVPA also had a 70% higher odds (OR 1.7, 95% CI 1.1–2.6) than the reference group. Except for those reporting ST (14–21 h/w) within the highest tertile of MVPA (≥ 61.0 MET-h/w), the other groups had significantly higher odds of MetS, which showed a curved acceleration with increased TV time.
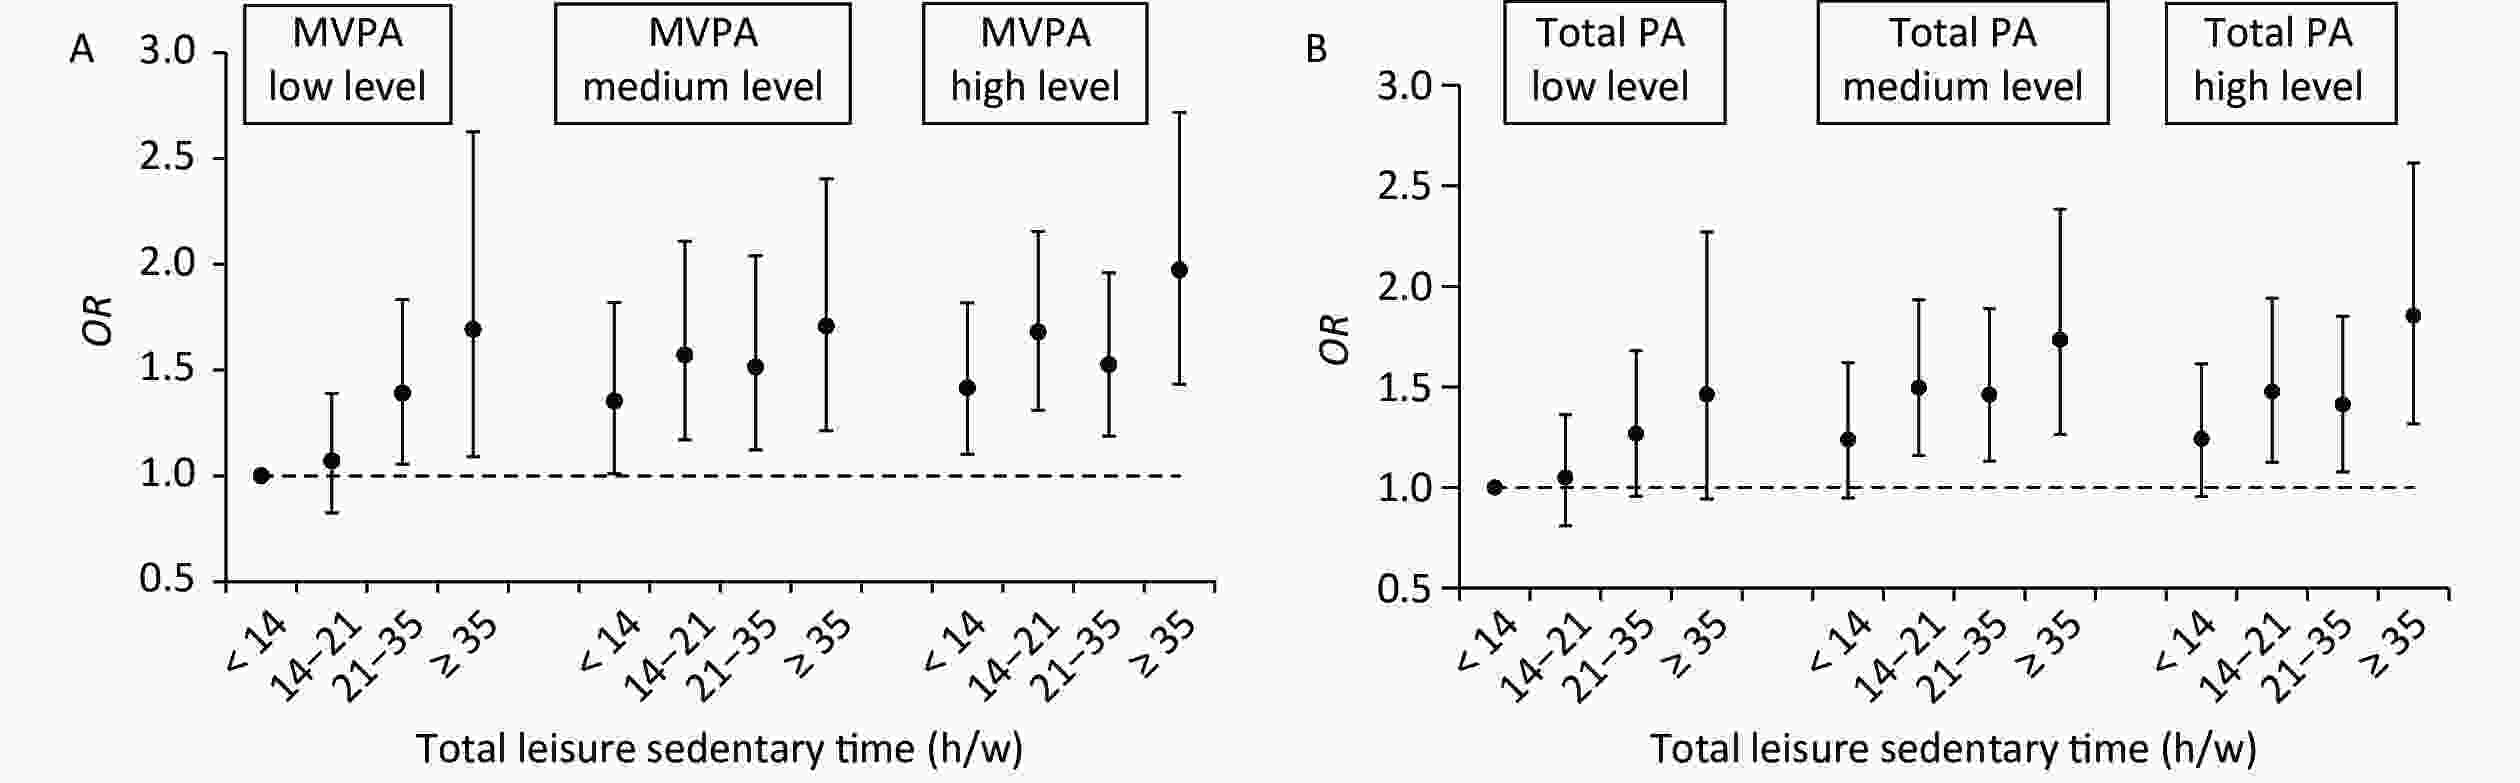
Figure 1. The ORs for the joint associations of total leisure sedentary time and MVPA/total PA with MetS. Note: The ORs for the joint associations of total leisure ST and MVPA with MetS are showed in Figure 1A, and the ORs for the joint associations of total leisure ST and total PA with MetS are showed in Figure 1B. Both models were adjusted the covariates including baselined gender, age, region, education, income, carbohydrate, protein, fat, cholesterol, Na, kcal, regular drinking, current smoking, sleep time, and wave, besides LPA were adjusted in Figure 1A. Classification of LPA, MVPA and total PA were based on the tertiles of the amounts per week (MET-h/w), there were LPA: low level (< 18.6 MET-h/w), medium level (18.6−53.7 MET-h/w), and high level (≥ 53.7 MET-h/w); MVPA: low level (0 MET-h/w), medium level (0−61.0 MET-h/w), and high level (≥ 61.0 MET-h/w); total PA: low level (46.6 MET-h/w), medium level (46.6−147.2 MET-h/w), and high level (≥ 147.2 MET-h/w).
When we repeated these analyses using total leisure ST and total PA, the results were similar but weaker (Figure 1B). Compared with the reference group (those reporting the lowest level of total leisure ST (< 14 h/w) and the highest tertile of total PA (≥ 147.2 MET-h/w), those reporting the highest leisure ST (≥ 35 h/w) and the lowest levels of total PA (< 46.6 MET-h/w) had a twofold higher odds of MetS (OR 1.9, 95% CI 1.4–2.5), and those reporting the highest leisure ST (≥ 35 h/w) and the second tertile of total PA (46.6–147.2 MET-h/w) had a 60% higher odds (OR 1.6, 95% CI 1.2–2.1), while those reporting the highest level of leisure ST (≥ 35 h/w) and the highest tertile of total PA (≥ 147.2 MET-h/w) did not have a significantly higher odds. In addition, within those reporting the highest tertile of total PA (≥ 147.2 MET-h/w), the levels of total leisure ST had no significant effects on MetS. Within those reporting the second (46.6–147.2 MET-h/w) and the first (< 46.6 MET-h/w) tertile of total PA, except that the lowest level of total leisure ST (< 14 h/w) had no significant effects on MetS, the other higher levels of total leisure ST significantly increased the odds of MetS.
-
In this study, we found that higher TV time, computer time, or total leisure ST (mainly TV time) were independent risk factors for MetS, while higher MVPA or higher total PA were protective factors for MetS and its abnormal components. Among those reporting the highest tertile of total PA, no significant association was found between all total ST levels and the odds of MetS, suggesting that higher total PA levels might reduce the deleterious effects of long-time sitting. By contrast, increased ST was significantly associated with increased odds of MetS among all reported MVPA levels—even among the participants with the highest MVPA, suggesting that higher levels of MVPA might not alleviate the deleterious effects of long-time sitting.
A sedentary lifestyle has been particularly evident in the past few decades. Many recent studies have confirmed a deleterious independent association of long-time sitting with health [26]. A meta-analysis suggested that a greater ST increased the odds of MetS by 73% (OR 1.73, 95% CI 1.55–1.94) independent of PA[6], but no such association was found in some other surveys [6, 38]. In this study, compared with the total leisure ST level ≤ 14 h/w, the total leisure ST level > 35 h/w was associated with a 20% increase in the risk of abdominal obesity, hyperglycemia, elevated TG, and MetS, which is consistent with other studies reporting that sedentary behaviors increase the risk of MetS with different total PA levels [26, 28, 29, 31, 33]. In the present study, the total leisure ST is dominated by TV time; thus, the effect of total leisure ST mainly results from TV time, which is consistent with an overview of systematic reviews that reported a strong association between sedentary behavior (based on watching TV) and MetS [6]. Importantly, much of the observational evidence between sedentary behavior and MetS components is complex, depending on the type of sedentary behavior [33]. Therefore, in addition to total leisure ST, we focused on the association of different types of sedentary behaviors (watching TV, using a computer, and reading) on MetS and its components among Chinese adults and reached different conclusions. Since TV time is the main component of total leisure ST in this study, the effect of TV time on MetS is similar to that of total ST, that is, TV time > 28 h/w was associated with a 40% increase in the risk of high waist circumference and a 30% increase in the risk of hyperglycemia and high triglyceride, compared with TV time ≤ 10.5 h/w. Our results are consistent with those of other studies that watching TV is positively associated with high waist circumference and high triglyceride levels in rural Chinese [33] and is associated with central obesity in Indian women [39]. We found that > 7 h/w of computer use, another more popular type of screen ST, showed a 40% increase in the odds of low HDL-C and a 50% increase in the odds of MetS, compared with < 7 h/w of computer use. The association between reading time and MetS components is not significant. This demonstrated that domain-specific SB has different effects on people’s health. However, we should be aware that computer use and reading time in our study are not related to work, and a large part of people do not use computers or read in their leisure time. The effects of computer use or reading on MetS still need to be verified by more studies.
In this study, we found that people in the highest tertile of total PA have a 20% reduction in the odds of abdominal obesity (OR 0.8, 95% CI 0.7–0.9), elevated TG (OR 0.8, 95% CI 0.7–0.9), and MetS (OR 0.8, 95% CI 0.7–0.9), compared with those in the lowest tertile. These results are consistent with a study that reported a lower prevalence of MetS in the highest tertile of total PA (OR 0.55 for men and 0.63 for women) compared with those in the lowest tertile in Portuguese adults [40] and with another survey that the highest tertile of total PA is associated with a reduced risk of MetS (OR 0.59 for men and 0.75 for women) in rural China [33]. However, no such association has been found in other studies [39, 41]. Some previous reports have shown that high levels of PA play a critical role in reducing the risk of central obesity, dyslipidemia, and dysglycemia [42-47], but some other studies have not found this relationship [48].
In this study, we found that those in the highest tertile of MVPA are associated with a 10%–30% reduction in the odds of all abnormal MetS components, except hyperglycemia, and a 30% reduction in the odds of MetS (OR 0.7, 95% CI 0.6–0.9), compared with those in the lowest tertile. These results are consistent with those of many studies; for example, Esteghamati concluded that longer MVPA is associated with a lower incidence of MetS [49]. Previous studies have also reported that PA has a protective effect on hypertension [43, 44, 46]. We found that the highest tertile of MVPA was associated with a 20% reduction in the odds of elevated BP; however, the association between total PA and elevated BP is not significant.
In this study, we did not find any association between LPA and MetS and its components, which is inconsistent with previous findings that LPA is associated with waist circumference or blood glucose level [41, 50, 51]. It may be that LPA is too weak to improve insulin sensitivity, and it is difficult to detect its effect on MetS components [52].
Combined with the PA level, our results show that increased ST is significantly associated with increased odds of MetS in all MVPA levels—even among participants in the highest MVPA tertile (≥ 61.0 MET-h/w), which is much higher than 7.5–15 MET-h/w, recommended by the PA guidelines [MVPA 3–6 METs = 150 min/week (min/w)] suggesting that even if MVPA reaches the recommended level, it cannot compensate for the harmful effects of long-time sitting. This is consistent with a study that increased SB time increased the risk of MetS among adults who met the PA guideline of 150 min/w of MVPA in NHANES 2003–2006 [31]. However, among people reporting the highest tertile of total PA (≥ 147.2 MET-h/w), no significant association was found between all ST levels and the odds of MetS, suggesting that a higher level of total PA can alleviate some harmful effects of long-time sitting. Participants in the highest tertile of total PA may participate in less ST or MVPA, but more LPA accumulates to a certain amount of total PA. Therefore, participants who lack MVPA but have more LPA and higher total PA may alleviate the harmful effects of long ST to a certain extent. Although we have not observed an independent association between LPA and MetS or its components, LPA is a part of the total PA and may have some effects through total PA. This is consistent with the displacement hypothesis that replacing sitting time with the same amount of LPA or MVPA is associated with a lower disease [53]. Although MVPA brings more benefits than LPA when the same amount of SB time are replaced, LPA may nevertheless be a more feasible and relevant way where MVPA is impractical (e.g., in office workplace environments), when people are unable to participate in MVPA (older adults or those with physical frailties), or among those who may benefit from more physical activities [54]. These findings underscore the important contribution of LPA to people’s health and body function [38]. Evidence also shows that the frequently reported deleterious association between ST and chronic disease risk may be due to the fact that ST replaces the time spent in healthful lower-intensity activity [55, 56] because less time spent in MVPA does not necessarily lead to longer sitting time and vice versa. This suggests that sedentary behavior and MVPA can coexist independently of each other, which is supported by studies that show weak correlations between the two behaviors [51, 57-59]. This finding shows that highlighting MVPA alone is not enough to increase the health effect. Even if MVPA reaches the recommended target, it is necessary to reduce ST at the same time and replace ST with LPA to increase total PA. When the total PA accumulates to a certain amount, it will also have a healthful effect on ST.
One of the main strengths of this study is its comprehensive evaluation of the association between different types of leisure ST and PA and MetS and its components and analysis of covariates, including diet and sleep time. We used both LPA and MVPA as covariates instead of focusing on only one type of PA. However, this study has some limitations. First, our data on ST and PA and other lifestyles are self-reported, which may bias the results. Therefore, it is necessary to use objective measures of PA to verify our results and reveal the physiological and behavioral mechanisms underlying the observations. Second, we used leisure ST instead of total ST, which is not comprehensive. Finally, TV time dominates the total leisure ST in our study, and computer use and reading time are relatively small. Therefore, our results have better verified the effects of TV time on MetS, but not of computer use or reading time.
-
In this study, we found that MVPA and total PA have independent preventive effects and sedentary behavior (mainly watching TV) increases the risk of MetS and its components. However, higher levels of MVPA may not reduce the deleterious effects of long-time ST, but higher levels of total PA may do. Therefore, we recommend that Chinese adults should participate in more MVPA but also total PA to reduce ST and LPA to prevent and control MetS.
-
ST, sedentary time; PA, physical activity; LPA, light-intensity physical activity; MPA, moderate-intensity physical activity; VPA, vigorous-intensity physical activity; MVPA, moderate- to vigorous-intensity physical activity; SBP, systolic blood pressure; DBP, diastolic blood pressure; TG, triglyceride; HDL-C, high-density lipoprotein cholesterol; MetS, metabolic syndrome; MET, metabolic equivalent of task.
-
The study was approved by the Ethics Committee of the National Institute for Nutrition and Health, Chinese Center for Disease Control (201524). Written informed consent was obtained from all participants. All methods were carried out in accordance with relevant guidelines and regulations.
-
Not Applicable.
-
The authors declare that they have no competing interests.
-
The authors would like to acknowledge all the participants in our study and the staffs responsible for conducting the CHNS.
Funds:
This study was supported by US NIH [R01-HD30880, DK056350, R24HD050924, and R01-HD38700]
&These authors contributed equally to this work.
 Quick Links
 DownLoad: