


-
Advances in public health and rapid developments in socio-economic and medical technology have brought a dividend of life and steady improvements in global life expectancy (LE) over the past 30 years[1]. However, long survival does not equate to a good quality of life[2]. Health-adjusted life expectancy (HALE) provides a new perspective for evaluating the quality of life[3]. The difference between LE and HALE reflects the number of years a population has lived in a state of disease or disability: a large difference indicates a long life in an unhealthy state and low quality of life. The goals of the global health field are improving LE and HALE and focusing on narrowing their gap. Some studies have mentioned the gap and called the indicator LE–HALE[4,5], but only a few in-depth analyses were conducted[6]. Whether the phase of unprecedented urbanization since the 20th century has narrowed this gap remains unclear.
The rapid growth in the number of megacities and the huge population size of existing megacities will create a large number of environmental and social problems, which will reduce the quality of life and pose great challenges and opportunities for sustainable development in the future[7-9]. Although focusing on related factors that can explain health inequalities can provide important information for equitable population health[10,11], little is known about the impact megacity expansion may have on narrowing the gap between LE and HALE (herein referred to as GAP). In addition, previous studies on the relationship between health inequalities and socio-economic levels did not consider local characteristics[12]. China, which houses six of the world’s 33 megacities (more than any other country), may provide compelling evidence. Guangzhou is one of the six megacities in China and has an annual growth rate of urban expansion of 8.07% from 1978 to 2015, thus ranking second among the six megacities in China[13]. During the 35 years from 1979 to 2013, this megacity experienced four urban expansion stages (low rates, increased rates, high rates, and steadily increased rates) and three urban growth models (edge-expansion growth, infilling growth, and spontaneous growth), and is still developing, which has had a substantially influence on the urban spatial pattern and urban development direction[14]. Examining LE, HALE, and their GAP by county is crucial in assessing key drivers factors related to these disparities and has important implications. In particular, policies and programs that aim to achieve healthy and sustainable cities have the potential to narrow the GAP in all locations, especially the most disadvantaged ones at present, and consequently reduce health inequalities.
This study has two specific objectives. First, this work aimed to generate the annual estimates of LE, HALE, and their GAP for all the districts of Guangzhou, China, from 2010 to 2020 and analyze their temporal trend. Second, this research aimed to assess the extent to which GAP variation is explained by variation in specific social determinants.
-
Datasets of all-cause deaths covering all Guangzhou districts from 2010 to 2020 were obtained from Guangzhou Center for Disease Control and Prevention. These datasets were mainly based on the death cases reported by the Chinese National Cause of Death Registration and Reporting Information System and integrated the data from the Statistics Information Center of Guangzhou Health Bureau, Guangzhou Public Security Bureau, and Maternal and Child Health Department. All of the causes of death were originally coded by the International Classification of Diseases (ICD-10), and duplicate data were cleared. Cases with logic errors were reviewed one by one, the root cause of death was verified according to the multiple causes of death and demographic information, and the ICD-10 code was corrected and confirmed. The registered population datasets from 2010 to 2020 were obtained from the Guangzhou Public Security Bureau. The indexes of specific social determinants of all Guangzhou districts were obtained from the Statistical Yearbook of Guangzhou from 2011 to 2021, published by the Guangzhou Statistics Bureau[15]. Open-access data on the Global Burden of Disease (GBD) is available from the Global Health Data Exchange website [16]. This study complied with the Guidelines for Accurate and Transparent Health Estimates Reporting statement. The requirement for ethical board approval was waived because of the retrospective nature of this study and the anonymity of individual information.
-
Abridged life tables for 2010–2020[17] were calculated for the 19 standard age groups by sex. The first two age groups in the abridged life table consisted of < 1 year and 1−4 years. The remaining age groups were divided according to the standard of 5 years, and the last age group was > 85 years, which is open. The method used to calculate HALE was developed by the Institute for Health Metrics and Evaluation and WHO, and details can be found in the Supplementary Materials, available in
www.besjournal.com [3]. Data management and annual life table compilation for calculating LE, HALE, and their GAP, were completed using Microsoft Excel 2019 (Microsoft Corporation, Redmond, Washington).Age group Life expectancy 0− 88.87 1− 88.00 5− 84.03 10− 79.05 15− 74.07 20− 69.11 25− 64.15 30− 59.20 35− 54.25 40− 49.32 45− 44.43 50− 39.63 55− 34.91 60− 30.25 65− 25.68 70− 21.29 75− 17.10 80− 13.24 85− 9.99 90− 7.62 95− 5.92 Table S1. GBD 2019 reference life table
-
The following ten county-level macro-social indicators in Guangzhou were selected as explanatory variables (Table 1): socio-economic (economic density, per capita annual disposable income, and urbanization rate), health services (licensed/assistant doctors per thousand and hospital beds per thousand), population structure (male to female ratio, old people to child ration, and population density), and population dynamics (natural population growth rate and net migration rate).
Indicators Mean value Standard deviation Unit Economic density 14.64 23.65 Hundred million RMB yuan per one square kilometer Hospital beds per thousand 5.31 4.70 Numbers per 1,000 population Licensed/assistant doctors per thousand 3.41 2.58 Persons per 1,000 population Natural population growth rate 10.11 6.31 ‰ Net migration rate 11.19 10.00 ‰ Per capita annual disposable income 46,764.88 15,078.97 RMB yuan Population density 6,652.89 9,977.88 Persons per one square kilometer Ratio of male to female 1.01 0.03 % Ratio of old people to child 1.12 0.52 % Urbanization rate 82.10 17.75 % Note. RMB: Renminbi, the official currency of China. Table 1. County-level macro-social indicators collected in this study
-
Joinpoint regression analysis was used to estimate the annual percentage change (APC), average annual percentage change (AAPC), and corresponding 95% confidence interval (CI) for each trend segment of LE and HALE during the 10-year study period to examine temporal trends. The model is a piecewise regression based on the time series of the dependent variable. The study period was divided into different intervals through several connecting points, and model fitting and optimization were carried out for each interval. The variation characteristics of different interval specificity in the study period were further evaluated[18]. With a log-linear model as the basis, the classic Joinpoint regression model was expressed as follows:
$$ E\left[y|x\right]={e}^{{\beta }_{0}+{\beta }_{1}x+{\beta }_{2}x+{\delta }_{k}\left(x-{\tau }_{k}\right)} $$ where
$ e $ is the natural base,$ k $ is the number of connecting points,$ {\tau }_{k} $ is the unknown connecting points, β0 is the invariable parameter, β1 is the regression coefficient, and$ {\delta }_{k} $ is the regression coefficient of the piecewise function in intervals$ k $ .The analysis was conducted using the Joinpoint trend analysis software, version 4.8.0.1 (National Cancer Institute, USA).
-
A high degree of collinearity always exists between macro-social factors. For the panel datasets of all Guangzhou districts from 2010 to 2020, the statistics of the Kaiser-Meyer-Olkin test was 0.8, and the confidence to accept the null hypothesis of Bartlett’s test was less than 0.05, suggesting a correlation between variables. GPCA adds time series based on classical principal component analysis and replaces original variables with comprehensive variables to eliminate the correlation between variables on the premise of retaining the main information of original variables[19]. For panel or longitudinal data, GPCA effectively avoids the deviation of results caused by short-term fluctuations and is highly robust and representative. Explanatory variables were merged into panel data by year and district, and classical PCA was used to generate the factor loads of explanatory variables (Table 2). Four principal components (PCs) with eigenvalues greater than one and cumulative variance contribution of more than 90% were considered as the independent variables. PCs were defined according to factor loading greater than 0.4, where PC1 was socio-economic and health services, PC2 was population dynamics and personal wealth, PC3 was aging and urbanization, and PC4 was the sex structure of the population.
Indicators Principal component (PC) PC1 PC2 PC3 PC4 Economic density (Hundred million RMB yuan per one square kilometer) −0.40 0.05 −0.30 0.16 Hospital beds per thousand (Numbers per 1,000 population) −0.40 0.08 −0.39 0.01 Licensed/assistant doctors per thousand (Persons per 1,000 population) −0.40 0.04 −0.35 −0.02 Natural population growth rate (‰) 0.27 0.40 −0.33 −0.12 Net migration rate (‰) −0.03 0.65 0.10 −0.01 Per capita annual disposable income (RMB yuan) −0.19 0.54 0.27 −0.01 Population density (Persons per one square kilometer) −0.40 −0.12 −0.12 0.15 Ratio of male to female (%) 0.26 −0.01 −0.12 0.90 Ratio of old people to child (%) −0.32 −0.28 0.43 −0.06 Urbanization rate (%) −0.31 0.16 0.48 0.34 Table 2. Factor loading of principal component
-
The direction and strength of the relationship of social determinants were analyzed using a multilevel model with the annual county-level GAP of all Guangzhou districts as the dependent variable and the four PCs as the independent variables from 2010 to 2020. The null model, random intercept model, and random intercept and slope model were fitted, and the Akaike information criterion and Bayesian information criterion were used to select the optimal model. For all models, parameter estimates and standard errors for fixed and random coefficients, conditional R2, and marginal R2 were reported. All statistical analyses were performed by using R software, version 4.1.0 (R Foundation for Statistical Computing, Vienna, Austria).
-
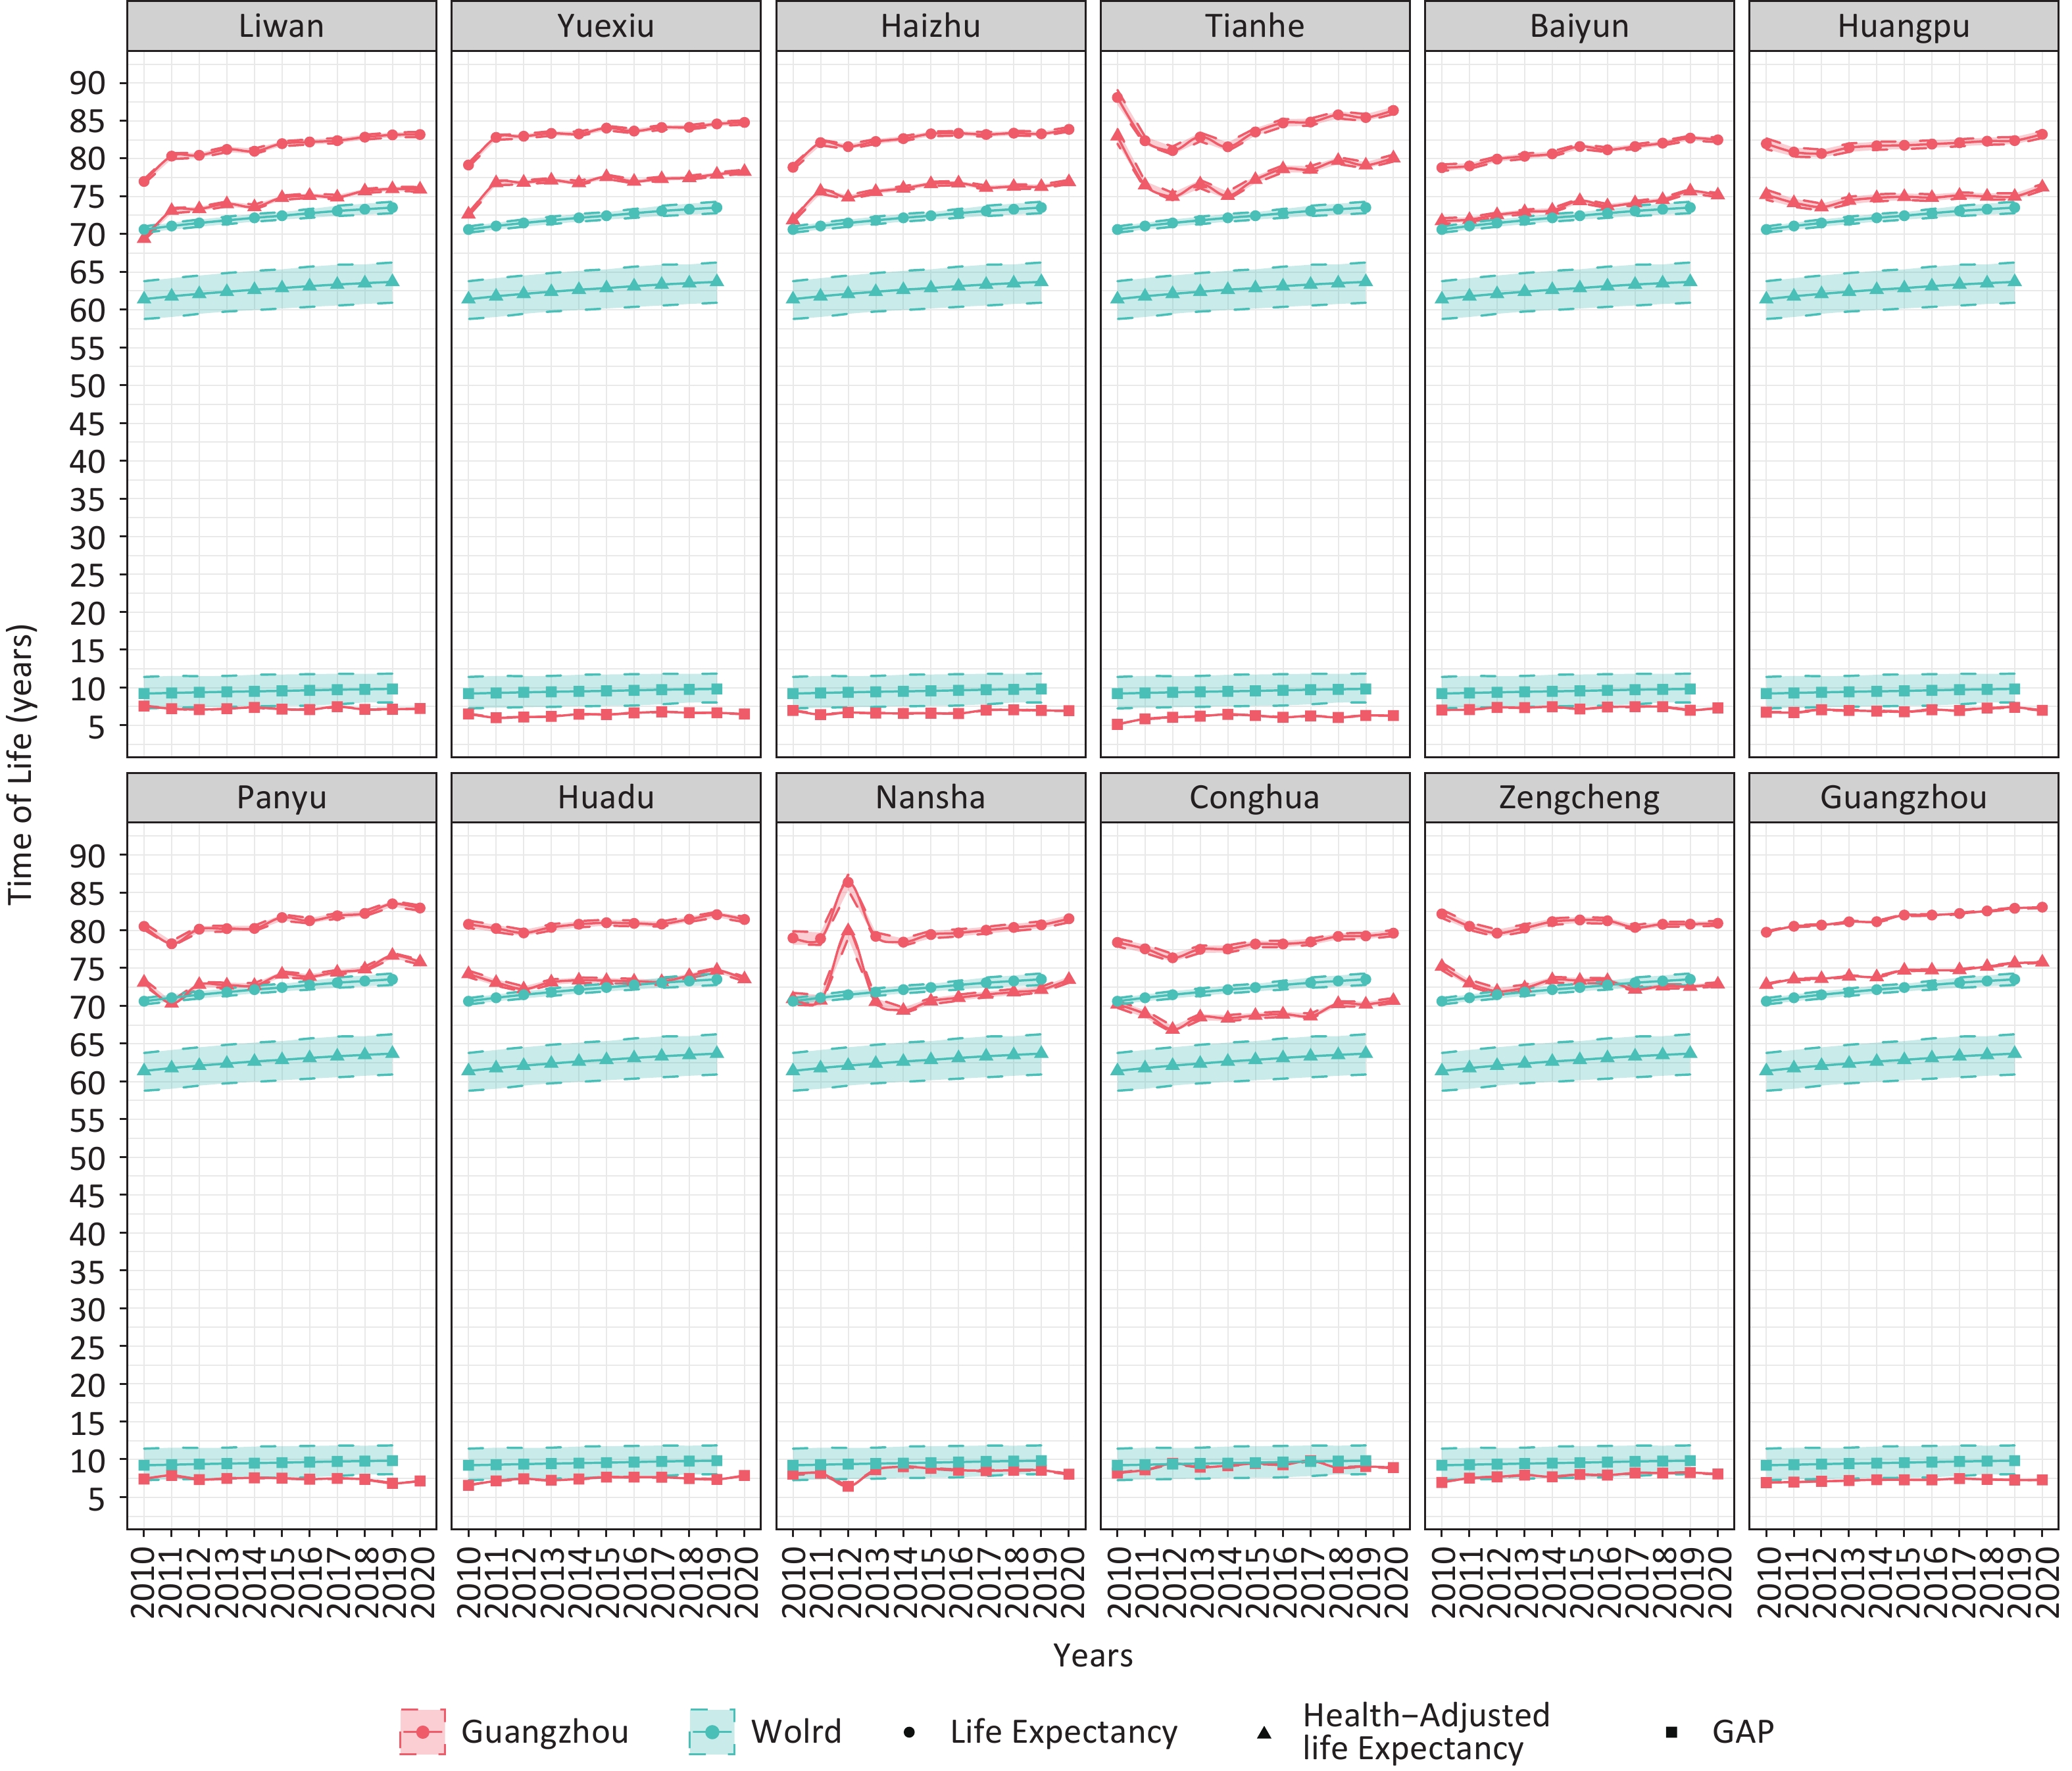
The temporal trends of LE, HALE, and their GAP in Guangzhou from 2010 to 2020 with base characteristics are summarized in Figure 1 and were compared with the global average reported by the GBD study. The temporal trends in longevity varied from region to region. By 2020, the LE in all districts was over 80 years and the HALE was over 70 years, both above the global level. GAP was below 9 years, which was lower than the global level.
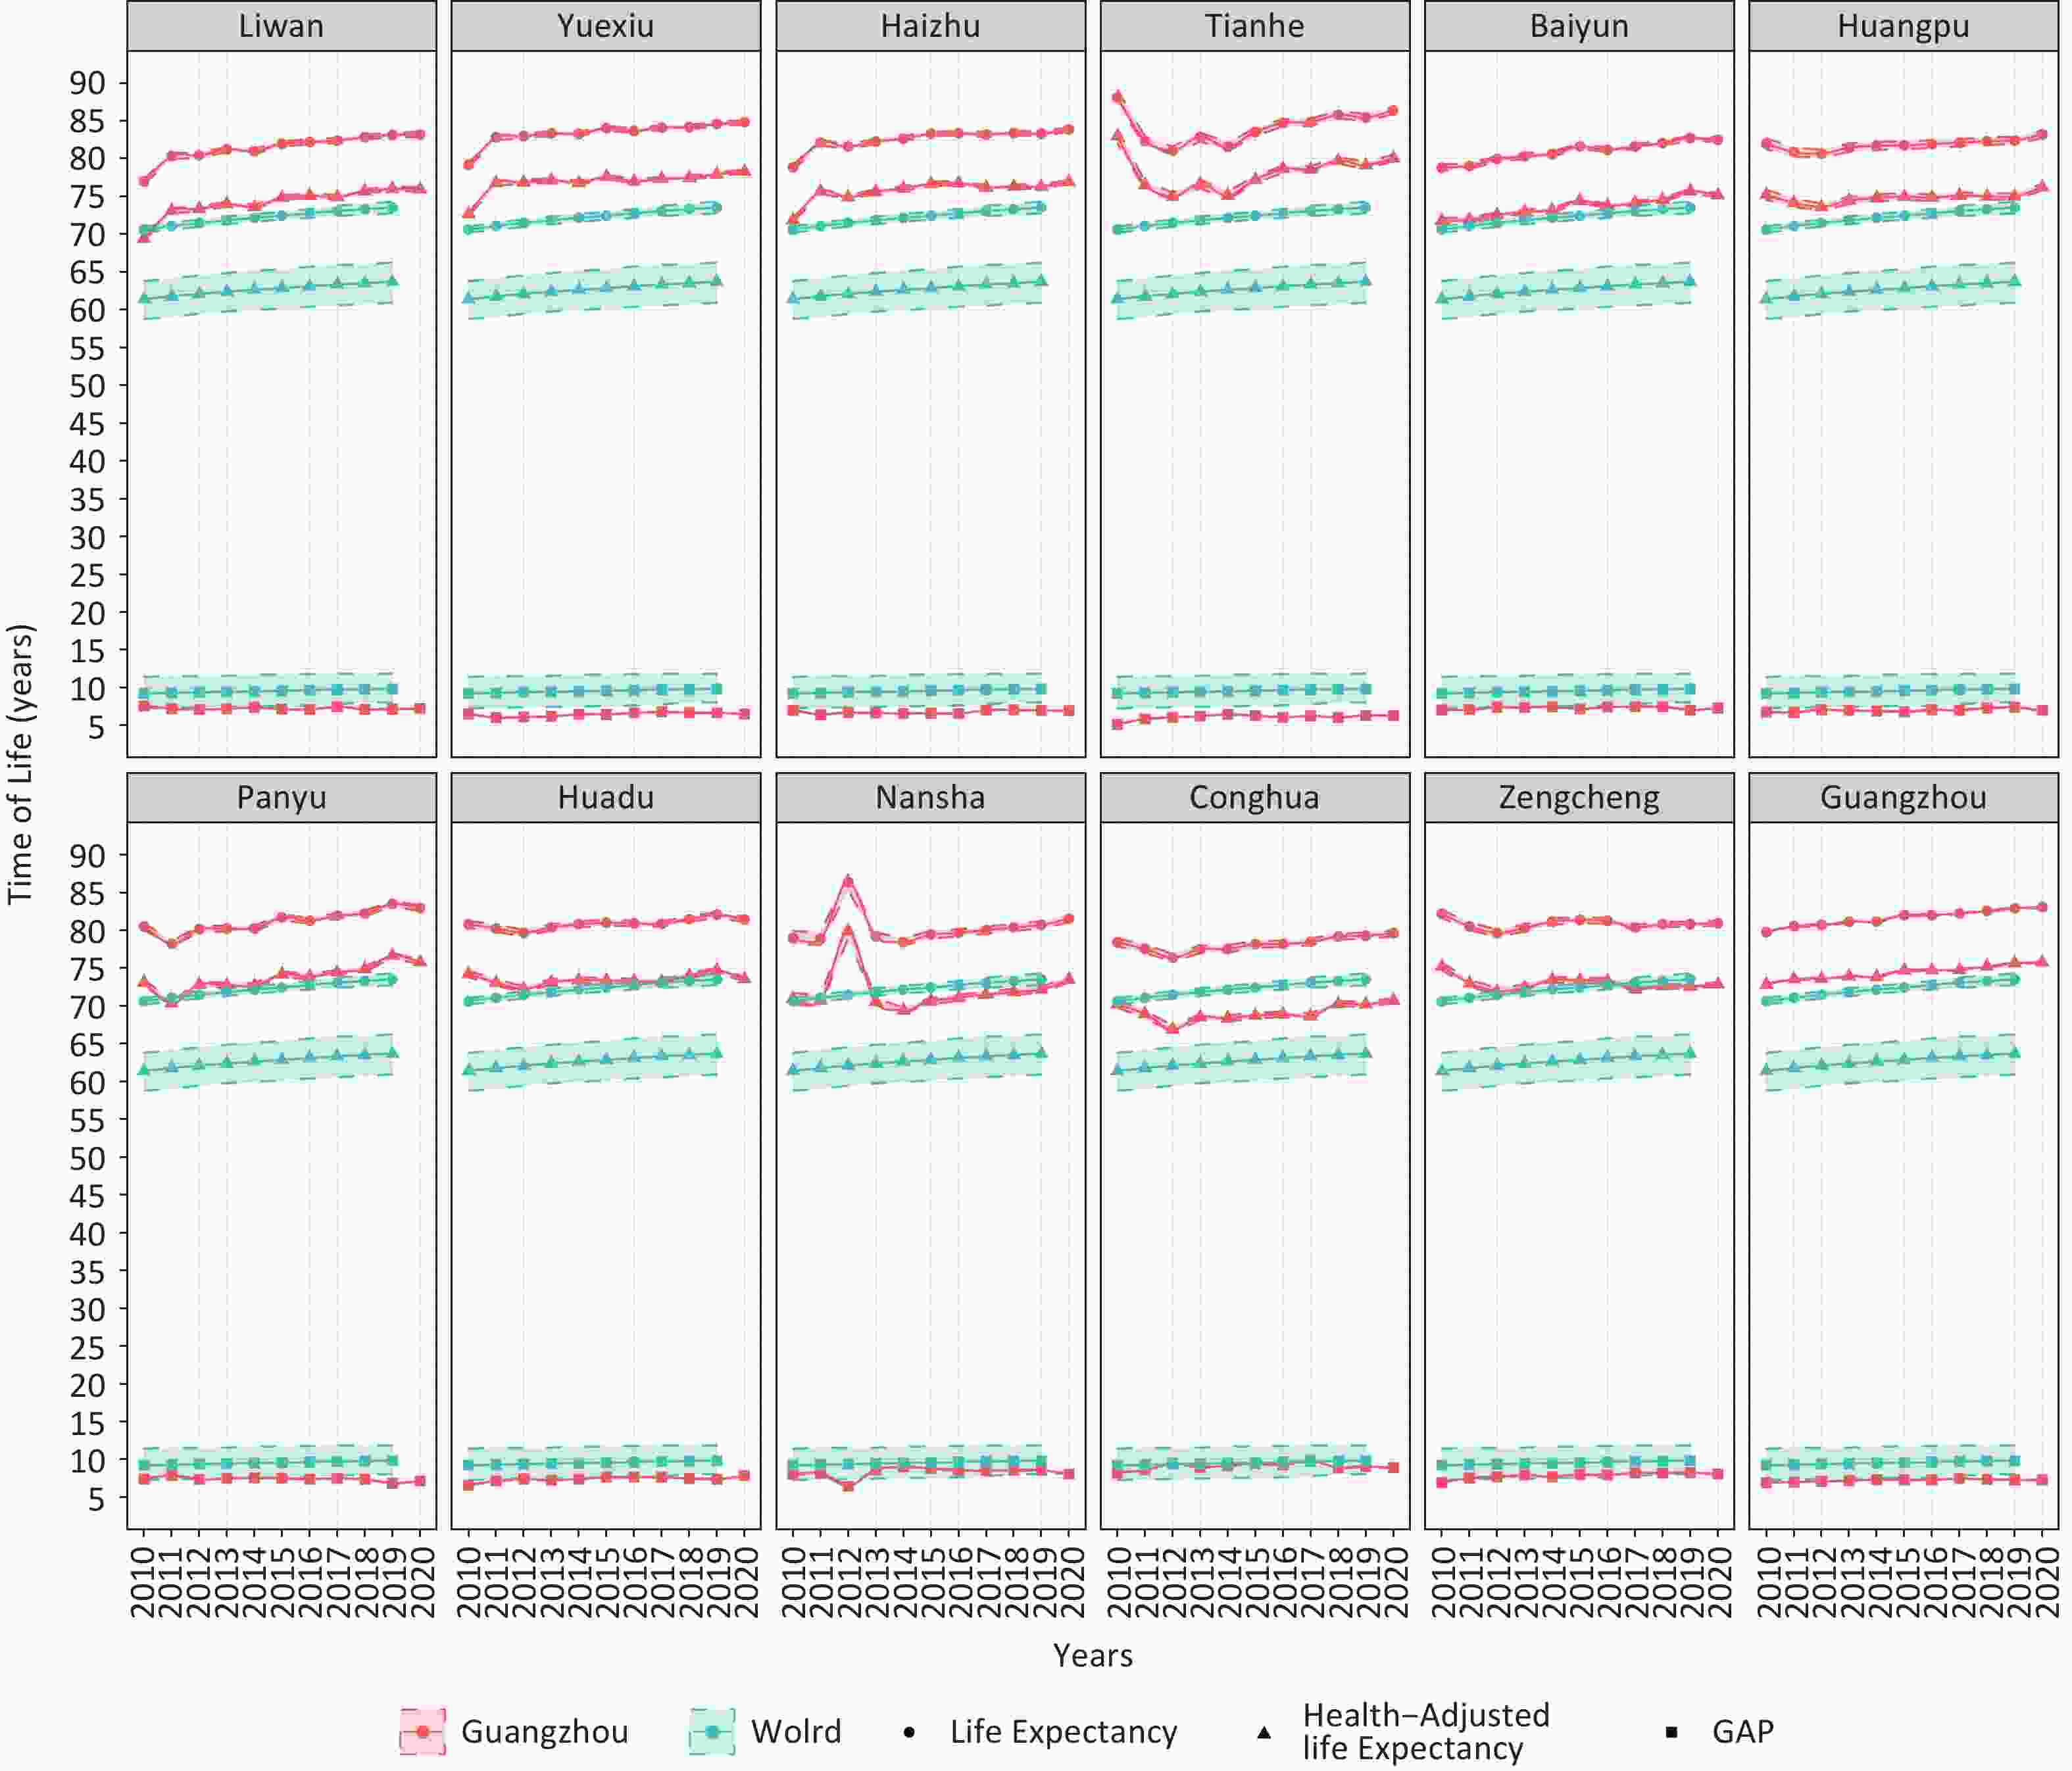
Figure 1. Temporal trends of LE, HALE, and their GAP in Guangzhou from 2010 to 2020. The solid line is the point estimate, and the dotted line is the 95% uncertainty interval. LE = life expectancy. HALE = health-adjusted life expectancy. GAP = the difference between LE and HALE.
-
Joinpoint regression analysis indicated that the LE and HALE of Guangzhou and its majority districts increased significantly during the study period (Table 3). The LE in Tianhe, Huangpu, Nansha, and Zengcheng districts and the HALE in Tianhe, Huangpu, Huadu, Nansha, and Zengcheng districts did not show any significant change during the study period (AAPC ranged from −0.1 to 0.1) and therefore were statistically insignificant. In addition, LE and HALE in Tianhe, Huangpu, and Conghua districts exhibited a downward trend from 2010 to 2012 and then a continuous increase to this day. Only the GAP in the Panyu district decreased significantly during the study period (AAPC −0.7%), and that in Guangzhou and other districts showed an unfavorable upward trend. The GAP in the Liwan district had an insignificant downward trend without statistical significance. The GAP in the Tianhe district remained at the highest level with an AAPC of 1.9% in 2010–2020, and the AAPC for 2010–2012 was 9.9%, with no significant change for 2012–2020.
Districts Types AAPC (95% CI) Trend 1 Trend 2 Period APC (95% CI) Period APC (95% CI) Liwan LE 0.7* (0.6 to 0.9) 2010 to 2012 2.1* (1.1 to 3.1) 2012 to 2020 0.4* (0.3 to 0.5) HALE 0.8* (0.6 to 1.1) 2010 to 2012 2.6* (0.9 to 4.3) 2012 to 2020 0.4* (0.2 to 0.6) GAP −0.3 (−0.8 to 0.2) − − − − Yuexiu LE 0.6* (0.4 to 0.7) 2010 to 2012 2.1* (1.2 to 3.0) 2012 to 2020 0.2* (0.1 to 0.3) HALE 0.6* (0.4 to 0.8) 2010 to 2012 2.5* (1.1 to 3.9) 2012 to 2020 0.1 (0.0 to 0.3) GAP 0.9* (0.2 to 1.6) − − − − Haizhu LE 0.4* (0.2 to 0.7) − − − − HALE 0.4* (0.1 to 0.7) − − − − GAP 0.6 (−0.1 to 1.3) − − − − Tianhe LE −0.1 (−0.6 to 0.5) 2010 to 2012 −3.5* (−6.3 to −0.7) 2012 to 2020 0.8* (0.5 to 1.2) HALE −0.2 (−0.8 to 0.5) 2010 to 2012 −4.4* (−7.9 to −0.8) 2012 to 2020 0.9* (0.5 to 1.3) GAP 1.9* (0.5 to 3.2) 2010 to 2012 9.9* (1.8 to 18.6) 2012 to 2020 0.0 (−0.9 to 0.8) Baiyun LE 0.5* (0.4 to 0.6) − − − − HALE 0.5* (0.4 to 0.6) − − − − GAP 0.2 (−0.4 to 0.8) − − − − Huangpu LE 0.1 (0.0 to 0.3) 2010 to 2012 −0.5 (−1.4 to 0.3) 2012 to 2020 0.3* (0.2 to 0.4) HALE 0.2* (0.0 to 0.3) − − − − GAP 0.7* (0.1 to 1.2) − − − − Panyu LE 0.5* (0.3 to 0.7) − − − − HALE 0.6* (0.3 to 0.9) − − − − GAP −0.7* (−1.4 to 0.0) − − − − Huadu LE 0.2* (0.1 to 0.3) − − − − HALE 0.1 (−0.1 to 0.3) − − − − GAP 1.1* (0.4 to 1.8) − − − − Nansha LE 0.1 (−0.5 to 0.7) − − − − HALE 0.0 (−0.9 to 0.9) − − − − GAP 0.9 (−1.1 to 2.9) − − − − Conghua LE 0.2* (0.0 to 0.3) 2010 to 2012 −1.0 (−1.7 to −0.3) 2012 to 2020 0.5* (0.4 to 0.5) HALE 0.1 (−0.3 to 0.4) 2010 to 2012 −2.0 (−4.1 to 0.1) 2012 to 2020 0.6* (0.3 to 0.8) GAP 1.1 (−1.0 to 3.3) 2010 to 2012 7.3 (−5.0 to 21.3) 2012 to 2020 −0.4 (−1.7 to 1.0) Zengcheng LE 0.0 (−0.2 to 0.2) − − − − HALE −0.1 (−0.4 to 0.1) − − − − GAP 1.6* (0.6 to 2.5) 2010 to 2012 5.0 (−0.3 to 10.7) 2012 to 2020 0.7* (0.2 to 1.3) Guangzhou LE 0.4* (0.3 to 0.4) − − − − HALE 0.4* (0.3 to 0.4) − − − − GAP 0.4* (0.0 to 0.8) 2010 to 2017 1.0* (0.6 to 1.3) 2017 to 2020 −0.9 (−2.1 to 0.4) Note. *AAPC or APC significantly different from 0 (two-sided P < 0.05).
LE = life expectancy. HALE = health-adjusted life expectancy. GAP = the difference between LE and HALE. AAPC = average annual percent change. APC = annual percent change. CI = confidence interval.Table 3. Joinpoint regression analysis in LE, HALE, and their GAP in Guangzhou, 2010–2020
-
The overall results of the multilevel model indicated several features of the social determinants of GAP (Table 4). PC1, whose factor load is negative, showed significant positive relation to GAP, indicating that positive socio-economic and health services could narrow the GAP. PC2 and PC3, whose factor load is positive, showed significant negative relation to GAP, indicating that positive population dynamics, personal wealth, aging, and urbanization may narrow the GAP. Meanwhile, the negative correlation between PC4 (positive sex structure of the population) and GAP was not statistically significant. Modeling details can be found in the Supplementary Materials.
Parameter Parameter estimates Standard error P Fixed parameters β1 (Intercept) 6.826 0.218 < 0.001 β2 (Years) 0.089 0.021 < 0.001 β3 (Principal
component 1)0.146 0.051 0.007 β4 (Principal
component 2)−0.111 0.054 0.043 β5 (Principal
component 3)−0.226 0.087 0.011 β6 (Principal
component 4)−0.015 0.083 0.855 Random parameters $ {\sigma }_{1}^{2} $ (Districts) 0.334 0.578 − $ {\sigma }_{2}^{2} $ (Years) − − − $ {\sigma }_{3}^{2} $ (Residual) 0.101 0.317 − Note. Conditional R2 = 0.836; Marginal R2 = 0.292. Table 4. The relationship between the GAP and social determinants in Guangzhou, 2010–2020
-
Many indexes are being used to define health, but the GAP between LE and HALE has received minimal attention. The GAP focuses on revealing the unhealthy survival time of the population and can be used as a routine health surveillance index for tracking population health over time. No research has focused on LE, HALE, and their GAP at the city level in China. This study was based on a typical megacity that is representative in China, thus filling in the void in this field. This work also provided an up-to-date overview of the temporal trends of LE, HALE, and their GAP in recent decades in Guangzhou and assessed the extent to which GAP variation is explained by variation in social determinants. Overall, LE and HALE maintained a steady upward trend from 2010 to 2020, with values relatively higher than the global average[3]. However, the GAP, which was below global levels during the study period, also showed an unfavorable increase. This finding suggested that the growths of LE and HALE were not parallel, which was similar to the situation in China and its provinces[20]. The potential cause may be a decrease in mortality and an increase in the prevalence of certain diseases, such as chronic liver diseases[21]. In addition, the results indicated several features of the social determinants of GAP and thus provided a basis for further investigation on improving the quality of life in megacities and reducing regional health inequality.
This work showed that positive socio-economic and health services could narrow the GAP, and other studies have confirmed their importance for health[22]. Population health is the result of investments, such as good environmental conditions, healthy lifestyles, and appropriate medical and health services. Health service is not only an input factor to maintain national health but also an important source of national income growth. It also has comparative advantages in promoting employment and personal income, thus contributing to the improvement of household consumption and national domestic demand and boosting the transformation of the economic development model[23]. In brief, a virtuous cycle of socio-economic and health services is the key to narrowing the GAP.
The combination of urbanization and aging has a positive effect on narrowing the GAP. A wide disparity in the health of older people occurs between rural and urban areas[24]. The rapid growth of urbanization in China has led to the migration of young people from rural areas to cities, and the expanding trend of offspring living apart from their parents has made health a daunting challenge to empty nesters in rural areas[25,26]. Chronic non-communicable diseases and mental health disorders are the major disease burdens of the emerging aging population and are reaching epidemic levels. However, rural healthcare resources may be insufficient to cover vulnerable aging populations[27]. Although an aging population brings long life, it does not represent an increase in health[28]. The health of older people should be more associated with their functional integrity than the presence or absence of disease[29]. Healthy aging is urgently needed to narrow the GAP. China has long regarded aging and urbanization as the top priority of public health issues and has already formulated a series of policies and measures to deal with the pressure of an aging society[30]. Urbanization provides a supportive environment, including increased parks and green spaces, and plays an important role in addressing physical activity and health promotion for older people, as reflected in Taiwan, China[31]. In addition, geriatrics has rapidly developed into a sub-discipline that provides older people with high-quality prevention and cares for the elderly and allows them to remain resilient and functional as they age; this innovation is one step closer to the goal of healthy aging[32]. In summary, comprehensive, evidence-based policies related to health disparities between urban and rural older persons and adequate funding for rural health care systems are urgently needed.
Positive population dynamics and personal wealth were found to be significantly positively correlated with narrowing the GAP. Regional development and economic progress must be accompanied by population aggregation[33]. Population aggregation, to a certain extent, is conducive to the integration of resources, acquisition of social services, and effective implementation of regional economic activities[34]. However, too dense a population will also lead to a shortage of per capita resources and an increase in social burden[35]. In brief, the relationship between population density and health index presents an inverted U-shaped curve[36]. Guangzhou, with its favorable economic growth environment and infrastructure construction speed, has brought a rapid increase in the number of newborns and immigrants who tend to be relatively healthy[26]. However, restrictive health policies are still needed to maximize the health effects of population growth, such as Chinese Family Planning and the Chinese Household Registration System. Chinese Family Planning aims to promote maternal and child welfare and improve the population structure, thus effectively controlling the rapid growth of the population and improving the quality of life[37]. Chinese Household Registration System plays a two-way role in managing immigration. On the one hand, social welfare can be popularized for every citizen who legally obtains the urban household registration, and the health of the citizen who holds the household registration is promised to be guaranteed. On the other hand, the government will also dynamically limit the population expansion according to urban development so that social support can stabilize the supply[38]. Although newborns and healthy migrants in megacities have narrowed the GAP to some extent, the threshold of urban comprehensive carrying capacity must be defined accurately to maintain the health effects of population growth.
This study has several advantages. First, it provides the first up-to-date overview of the temporal trends of LE, HALE, and their GAP in recent decades in Guangzhou and important scientific evidence for quality of life research. Second, it is the first to link the GAP between LE and HALE with the expansion of megacities and provide valuable knowledge about the role of social determinants in the quality of life. Meanwhile, some limitations of our work should be identified. First, we cannot obtain complete and accurate information on the prevalence and disability severity for all-cause and sequelae; hence, Years of healthy life lost due to disability (YLDs) could not be calculated directly as the GBD. Nevertheless, the well-established indirect method developed by the WHO can be used as an alternative to calculate YLDs and obtain equally reassuring results[39,40]. Second, influential factors except for the four dimensions aforementioned may also be related to health inequalities, such as education, employment, and environment. However, those potential factors were not considered in this analysis. Third, the PCs produced by GPCA were a mix of several explanatory variables that may partially overlap. However, this phenomenon does not imply a systematic error in our analysis. We carefully considered the magnitude and direction of the factor loading and explained it as a combined effect of multiple explanatory variables. Our work is the first step in elucidating the relationship between specific social determinants and health inequalities in megacity expansion and exploring future directions for necessary research with improved study designs.
In summary, although LE and HALE are increasing steadily in megacities, their GAP is widening. Socio-economic and health services are guaranteed to narrow the GAP. Increasing personal wealth and a growing number of newborns and healthy immigrants, high urbanization, and healthy aging have helped narrow the GAP.
-
XI Jun Yan, CHEN Yuan Yuan, and HAO Yuan Tao conceived and designed the research. XI Jun Yan, CHEN Yuan Yuan, LIANG Bo Heng, and DONG Hang contributed to the acquisition of data. XI Jun Yan, LIN Xiao, and QIN Peng Zhe contributed to data curation and its analysis. XI Jun Yan and CHEN Yuan Yuan wrote the paper. ZHANG Yu Qin, LUO Ao, and DU Zhi Cheng contributed to the visualization and investigation of the manuscript. HAO Yuan Tao, QIN Peng Zhe, and LIN Xiao are the guarantors of the manuscript. All co-authors contributed to the revisions of the manuscript and have reviewed and approved the final manuscript version for publication.
-
We wish to thank all the participants included in the study. Professor HAO Yuan Tao gratefully acknowledges the support of K.C.Wong Education Foundation.
-
The authors have no conflicts of interest to disclose.
HTML
Data Sources
LE, HALE, and Their GAP
Social Determinants
Joinpoint Regression Analysis


Generalized Principal Component Analysis (GPCA)
Multilevel Model
Temporal Trends of LE, HALE, and Their GAP in Guangzhou from 2010 to 2020
Joinpoint Regression Analysis of LE, HALE, and Their GAP in Guangzhou from 2010 to 2020
Relationship Between the GAP and Social Determinants in Guangzhou from 2010 to 2020
 21495+Supplementary Materials.pdf
|

|

 Quick Links
 DownLoad: