


-
Rabies is an acute infectious disease with a mortality rate of nearly 100%. More than 3 billion people in more than 100 countries are at risk of rabies infection[1]. The World Health Organization (WHO) estimates that the number of rabies deaths worldwide is about 59,000 per year[2]. Dog-mediated rabies has been eliminated from Western Europe, Canada, USA, Japan, and some Latin American countries. Australia and many Pacific Island nations have always been free from dog-mediated rabies[3]. However, the burden of rabies remains high in China, India, and other countries in Asia and Africa[2]. According to the China Epidemic Reporting System, the number of rabies deaths has ranked in fifth place for many years[4].
At present, there is no effective treatment for rabies once its symptoms have appeared. However, effective rabies vaccines and passive immune preparation can provide immunity to rabies promptly after exposure[2]. WHO recommends that people with category III exposure and severely immunocompromised people with category II exposure should receive thorough wound washing, effective rabies vaccine and rabies immunoglobulin (RIG)[3]. Currently, RIG is either of human (HRIG) or equine origin and both are considered to have equal effectiveness. Despite the effectiveness of RIG in preventing rabies after severe exposure, it is administered in < 2% of WHO category III exposures worldwide. The reasons for underutilization of RIG include cost, insufficient supply, and dependence on the cold-chain[3]. For these reasons, anti-rabies virus monoclonal antibody (mAb) has been investigated as an alternative to RIG[5]. These mAbs have improved quality consistency, possible improve safety by eliminating the potential for transmission of blood-borne pathogens, and methods capable of increasing production in response to need[3].
Several companies have developed mAbs. SII RMab was developed by the Serum Institute of India was approved for marketing in India in December 2016[6], and RABIMABS developed by Zydus Cadila Research Center in India was approved for marketing in India in September 2019[7]. A Phase II clinical trial has been completed for CL184, an mAb cocktail against rabies virus developed by Crucell in the Netherlands[8]. In China and the USA, two Phase III clinical trials are being conducted for SYN023, an antibody developed by China Synermore Biotechnology Co. Ltd[9,10].
In the present study, a recombinant human rabies antibody of mAb NM57 was produced by NCPC New Drug Research and Development Co. Ltd. (Shijiazhuang, China). According to our previous research, NM57 can neutralize a spectrum covering all rabies epidemic strains in China. Post-exposure prophylactic studies using mouse, hamster or beagle models showed that the protective rate of NM57 was equal to or better than that of HRIG[11]. A Phase I clinical trial for NM57 showed that the safety and neutralization activity of NM57 (20–40 IU/kg) combined rabies vaccine were comparable or superior to those of HRIG combined rabies vaccine. This suggests that the dose range 20–40 IU/kg should be re-evaluated in Phase II trials (unpublished). In the present study, we aimed to preliminarily evaluate the rabies virus neutralizing activity, safety, and immunogenicity of 20 and 40 IU/kg NM57 in Chinese healthy adults, as compared with those of 20 IU/kg HRIG.
-
The was a randomized, double-blind, parallel controlled Phase IIa clinical trial conducted with three parallel groups from the Center for Disease Control and Prevention, Chaoyang District, Beijing (CDC). Healthy adults aged 18–55 years were eligible for inclusion. The exclusion criteria included: previous history of rabies exposure; history of rabies vaccination; history of receiving RIG; fever > 37 °C (axillary); acute or chronic infectious diseases; history of mental, heart, liver, kidney, blood, digestive tract or other diseases; pregnancy, planned pregnancy or breastfeeding during the study; immunodeficiency; congenital defects; allergy to any vaccine component; treatment with immunosuppressive or immune enhancer drugs; use of hormonal therapy; blood donation; massive blood loss (within 56 days), plasma donation (within 7 days), and blood or blood products transfusion (within 6 months); and other conditions not compliable with the study protocol. The study was registered at
https://clinicaltrials.gov (registration number NCT02559921) and performed following good clinical practice. Protocols and other materials were reviewed and approved by the Ethics Committee of the CDC. All participants provided written informed consent prior to enrollment. -
A total of 60 subjects were randomly assigned to three groups at a ratio of 1:1:1, Group A (20 IU/kg NM57), Group B (40 IU/kg NM57), and control Group C (20 IU/kg HRIG). Randomized numbers were generated by SAS® 9.13, with the block length of 3.
NM57 or HRIG was injected into the lateral thigh muscles on the day of study initiation (day 0). One dose was injected by unilateral or bilateral injection, determined by injection volume, with no more than 5 mL per shot and at least 2 cm between two injection sites. All drugs were administered in strict accordance with the dose and method specified in the protocol. The average injection volumes per subject for Groups A, B, and C were 7.04 ± 1.227, 13.35 ± 2.526 and 13.43 ± 2.435 mL, respectively. Because the unit titer of NM57 (200 IU/mL) was twice that of HRIG (100 IU/mL), the injection volumes in Groups B and C were similar, and the injection volume in Group A was half of that of Groups B and C.
-
NM57 had two preparation specifications, including 500 IU/vial (20131004, titer 200 IU/mL) and 200 IU/vial (20131003, titer 200 IU/mL). NM57 was manufactured by North China Pharmaceutical Group New Drug Research and Development Co. Ltd. (Shijiazhuang, China). HRIG (200 IU/vial, Lot No. 20130714, titer 100 IU/mL) was manufactured by Shuanglin Biopharmaceutical Co., Ltd. (Guangdong, China). The study drugs for the three groups were individually packaged according to an estimated maximum body weight and the dose specified in the protocol. The outer packaging boxes for the three groups were identical. The study drug was packaged and blinded by unblinded statisticians and nonclinical trial personnel. Each subject’s drug package had a unique random code that did not reveal the treatment group. Except for those responsible for drug injection, all researchers were blinded.
-
Blood samples for rabies virus neutralizing antibodie (RVNA) and immunogenicity evaluation were collected on days 0, 3, 7, 14, 28, and 42. RVNAs and anti-antibody levels were evaluated at all follow-up points.
A validated rapid fluorescent focus inhibition test (RFFIT)[12] was used to evaluate RVNA activity against the challenge virus standard 11 (CVS-11) at the National Institute for Food and Drug Control (Beijing, China). For calculation of RVNA geometric mean, values below the quantitation limit of 0.05 IU/mL were set to half of it (i.e., 0.025 IU/mL). Antidrug antibody was determined by ELISA at Beijing Lawke Health Laboratory (Beijing, China).
-
Immediate adverse events (AEs) were monitored and recorded by the researchers at 30 min after injection. After that, all symptoms were recorded on diary cards by the subjects and reviewed by the researchers. AEs referred to any adverse medical event (including events unrelated to study drugs) during the study period. Of all AEs, those related to study drugs were defined as adverse reactions (ARs). Electrocardiography and routine laboratory tests (blood, biochemistry and urine) were conducted prior to administration (from day −7 to 0) and on days 7 and 42 after immunization. The vital signs were monitored throughout the study on days 0, 3, 7, 14, 28, and 42. The safety of NM57 alone in Phase IIa and the safety of NM57 combined with rabies vaccine in Phase IIb needed to be compared at the later stage, and participants in these two trials were healthy Chinese people. Therefore, the Guidelines for Grading Criteria of Adverse Reactions in Clinical Trials of Preventive Vaccines (National Medical Products Administration, NMPA, 2005)[13] were adopted, with grade 1 as mild, grade 2 as moderate, grade 3 as severe and grade 4 as potentially life threatening.
-
The main evaluation indicator was the detection rate of RVNA (> 0.05 IU/mL) for subjects within 7 days. The secondary evaluation indicators included the geometric mean concentration (GMC) of RVNA, and the detection rate of RVNA and anti-antibody on days 3, 7, 14, 28, and 42, as well as the area under curve (AUC) (days 0–14 and 0–42, respectively). The safety indicators included the incidence of AEs, ARs and serious AEs (SAEs).
-
This Phase IIa clinical trial preliminarily evaluated the antibody neutralization activity, safety and immunogenicity of NM57 at a dose of 20 and 40 IU/kg without rabies vaccine combined. The minimum sample size of each group was 20.
-
Statistical analysis was performed by SAS® version 9.2 (SAS Institute, Cary, NC, USA). Continuous variables were described by mean, standard deviation, median, minimum and maximum. Categorical variables were described by frequency and percentage. The χ2 test was used to compare the detection rate of RVNA and anti-antibody among the three groups. If statistically significant, Fisher’s exact test was performed to make pairwise comparisons. Analysis of covariance was used to test the log10-transformed GMC difference among the three groups, and the covariate was the baseline data. Pairwise comparisons were also performed if the between-group difference was statistically significant. In this Phase II trial, we only carried out exploratory analysis, without multiple comparisons, and calculated the nominal P value, which described the association of end points with other parameters in each group. Comparison of AUCs was performed by Kruskal-Wallis test. If statistically significant, the Wilcoxon rank-sum test was performed to make pairwise comparisons. The lack of efficacy data (RVNA) caused by early termination of the study was carried forward by the last observation carry forward method. A result with P ≤ 0.05, two-sided α = 0.05, was considered statistically significant. A full analysis set (FAS) was used for efficacy analysis, which included all 60 subjects. A safety set was used for safety analyses including all 60 subjects. AEs were coded with MedDRA and listed. The number of AEs or ARs represented the number of subjects who had at least one reaction of this type. Because there were subjects with detectable baseline RVNA, a modified intention-to-treat analysis (mITT) was also used for efficacy analysis. Based on mITT, those subjects with baseline RVNA > 0.05 IU/mL were excluded (0.05 IU/mL was the detection limit). A total of 28 subjects (11 in Group A, 12 in Group B, and 9 in Group C) were excluded.
-
A total of 100 subjects were screened and 60 were randomized to Groups A–C. One participant refused blood sample collection on day 42 and was therefore designated as lost to follow-up. Except for one participant in Group A who did not complete the follow-up, there were no other protocol violations/deviations (Figure 1).
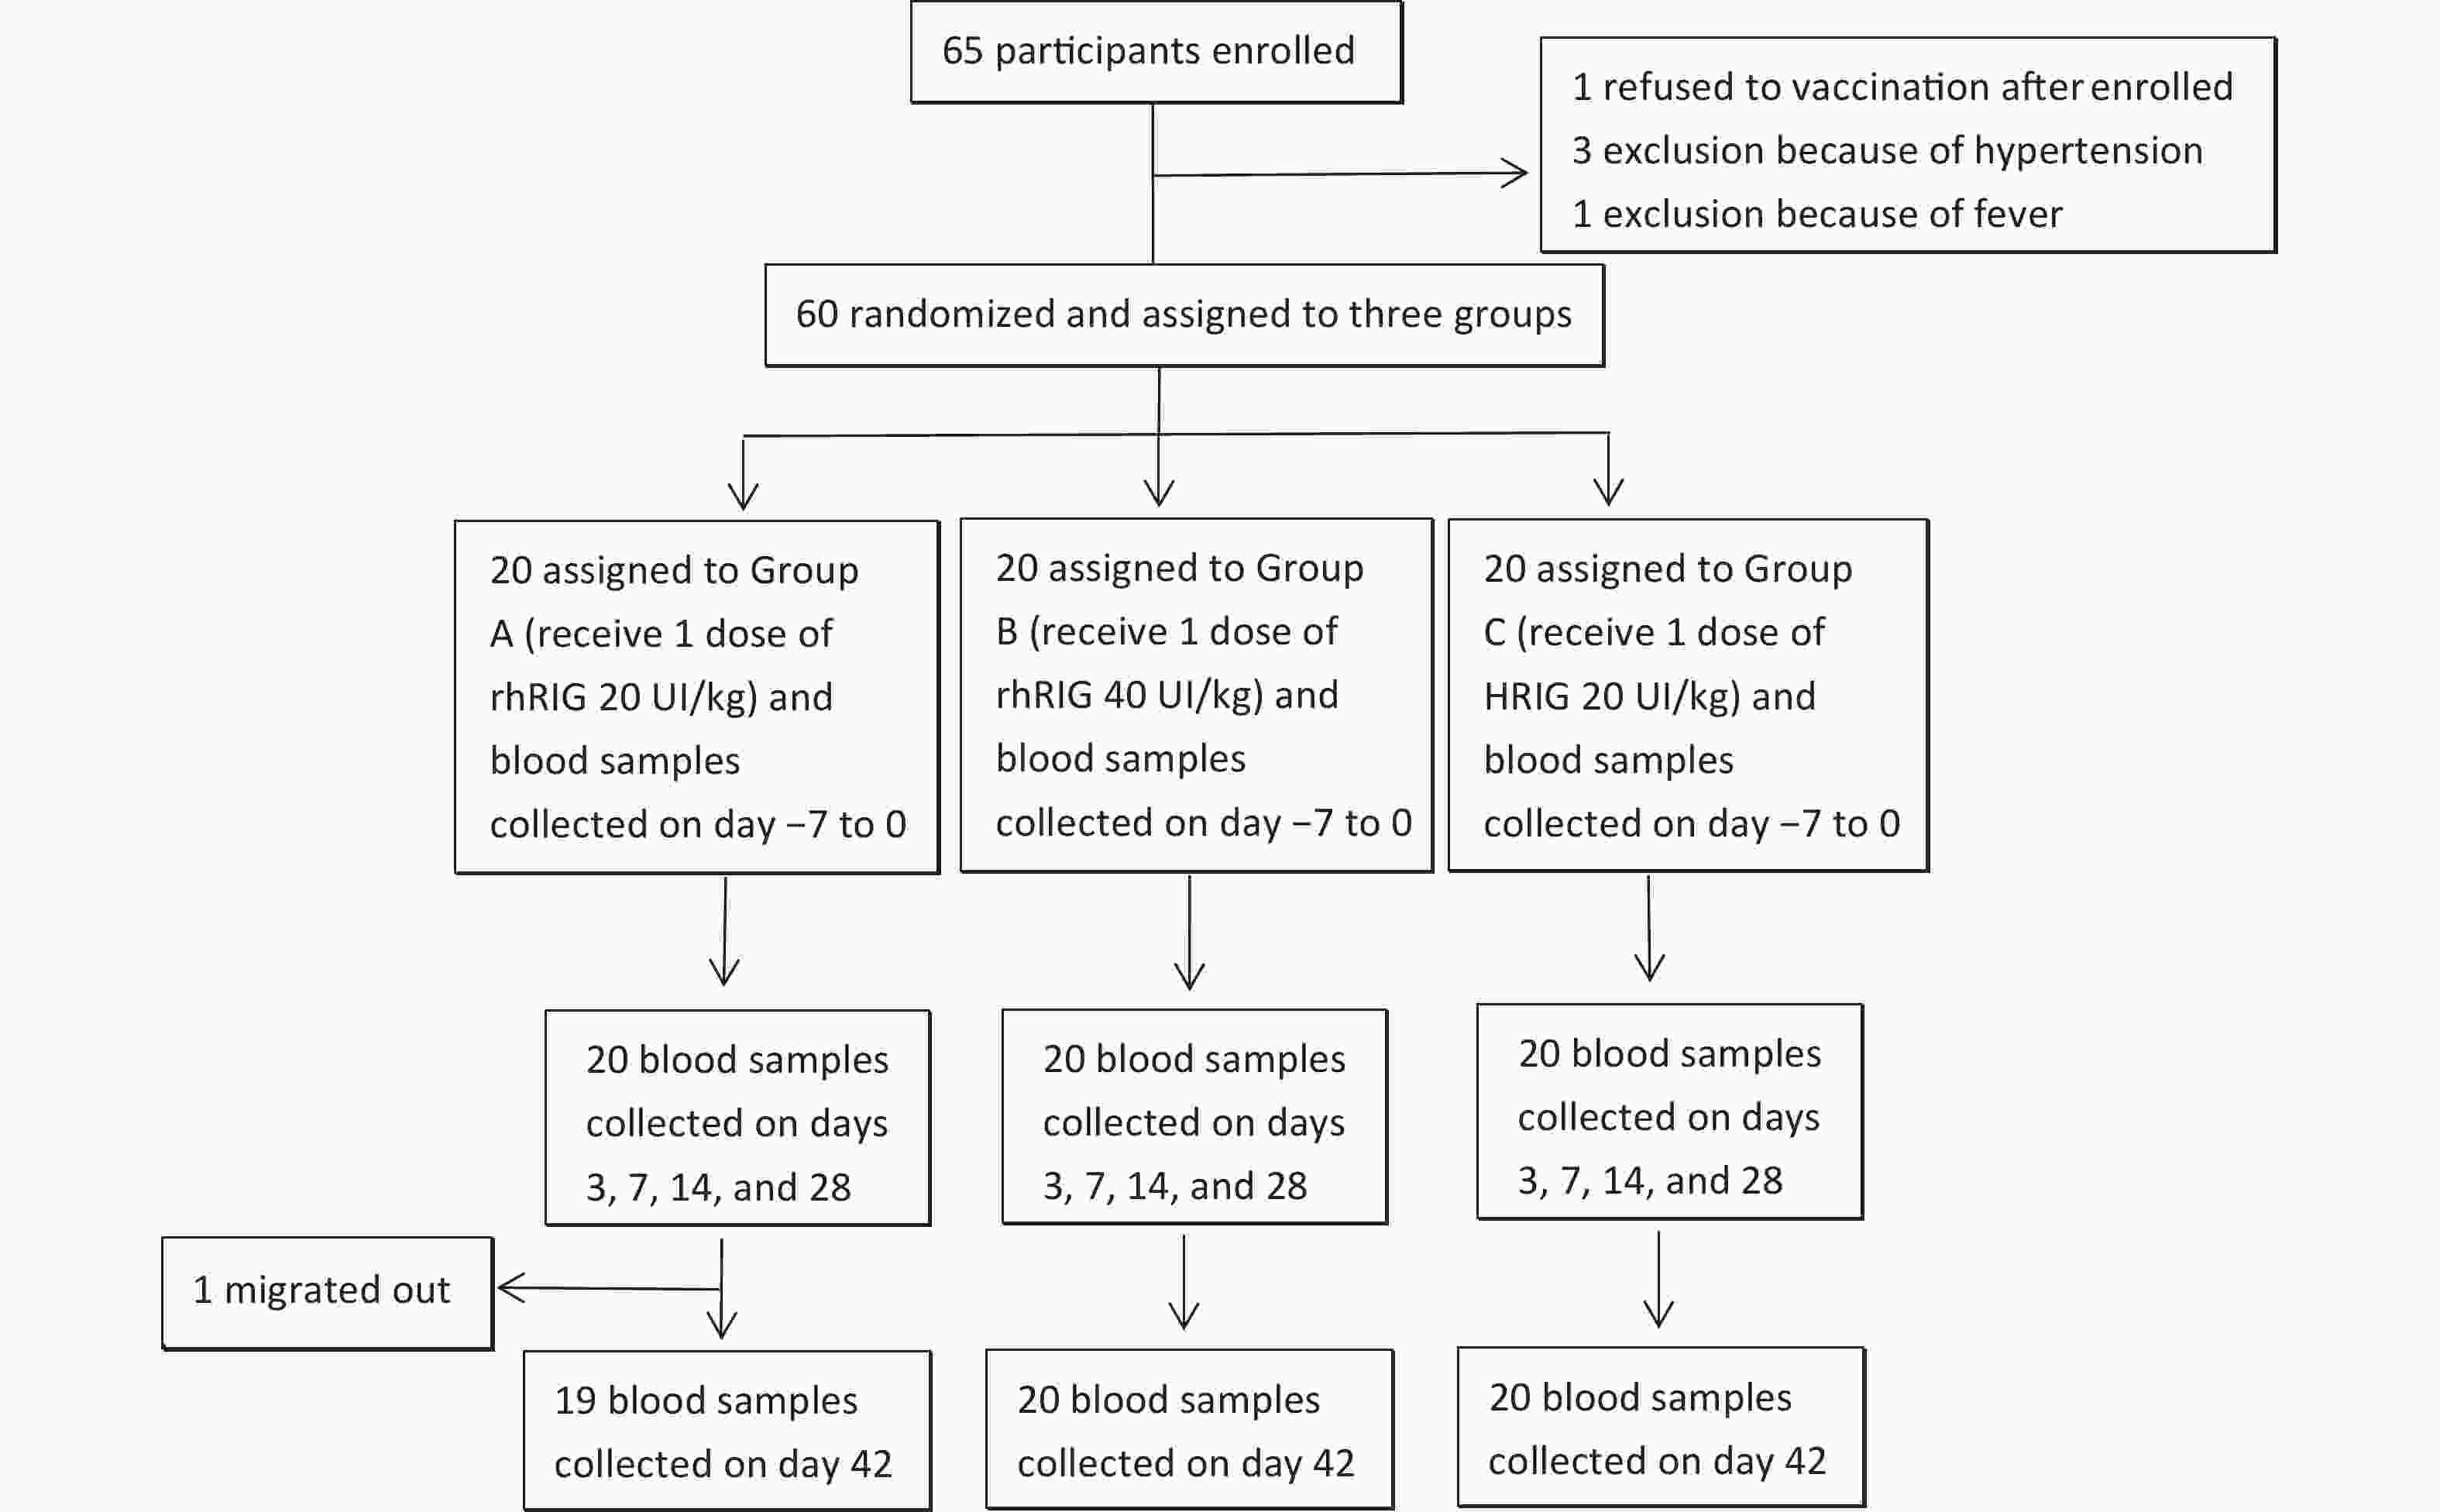
Figure 1. Flow chart of participants throughout the trial.
There was no significant difference in the demographic characteristics among the three groups (Table 1). The average age of the subjects was 37.73 ± 9.04 years, and there was no significant difference among the groups. Subjects were mainly women (33, 55.0%), and the mean weight was 68.10 ± 12.26 kg. No missing baseline data were reported.
Characteristics Group Group A
(n = 20)Group B
(n = 20)Group C
(n = 20)Total
(n = 60)Statistic/P Age, y (mean ± SD) 35.05 ± 9.23 38.17 ± 9.18 39.96 ± 8.44 37.73 ± 9.04 F = 1.5356,
P = 0.2241Sex*, n (%) Women 8 (40.00) 13 (65.00) 12 (60.00) 33 (55.00) P = 0.3495 Men 12 (60.00) 7 (35.00) 8 (40.00) 27 (45.00) Weight, kg (mean ± SD) 70.40 ± 12.27 66.75 ± 12.63 67.15 ± 12.18 68.10 ± 12.26 F = 0.5247,
P = 0.5946Note. Analysis of variance was used for the comparison between groups of age and weight, and *Fisher's exact probability was used for the comparison between groups of gender. Table 1. Demographics characteristics of study participants (FAS)
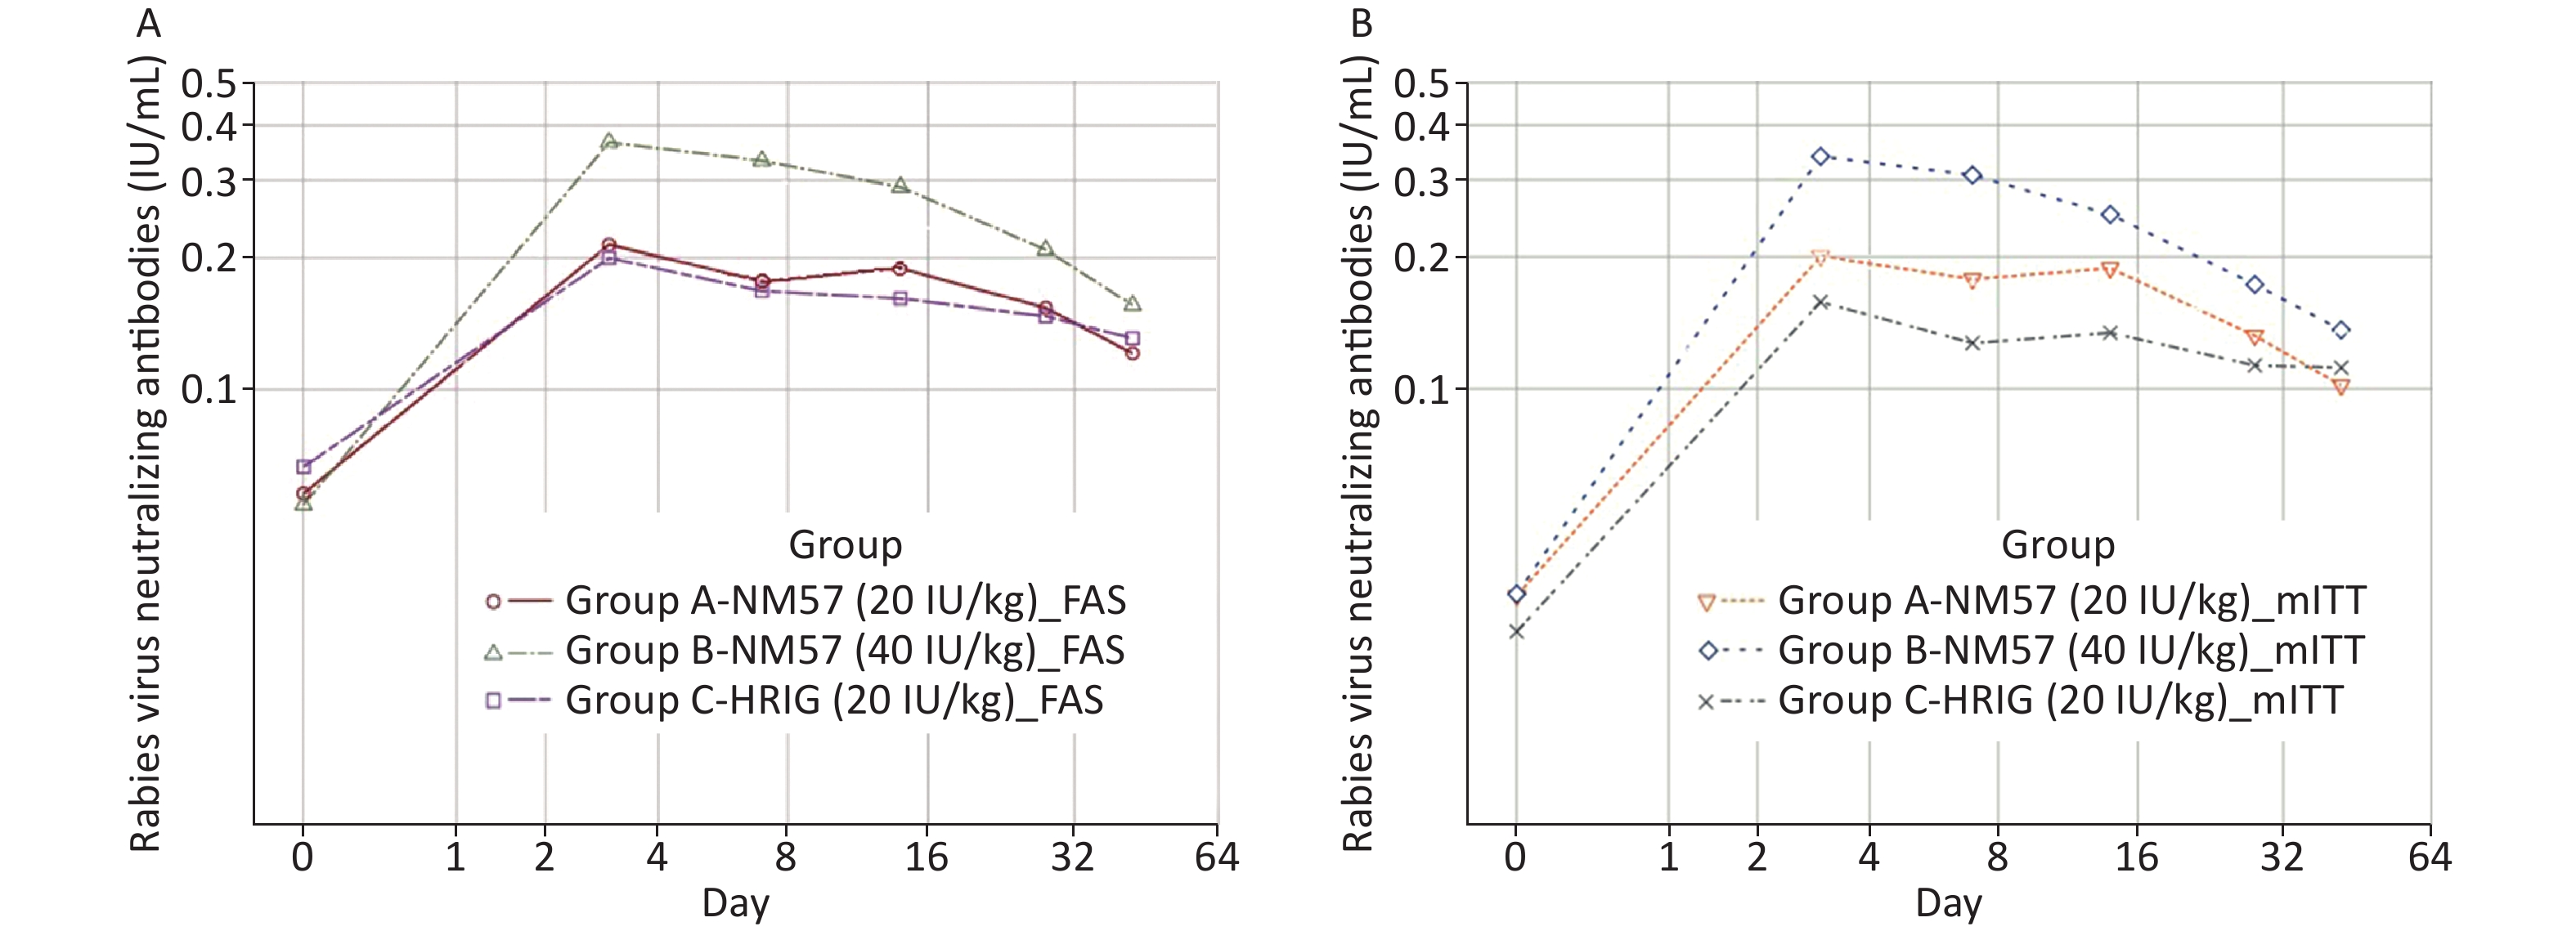
At baseline, there was no significant difference in the detection rate and GMC of RVNA among the three groups (Tables 2a and 3a). All subjects (100%) developed detectable RVNA (> 0.05 IU/mL) on days 3, 7, 14, 28, and 42 (Table 2a). Significant RVNA was induced after NM57/HRIG administration in the three groups, with a peak on day 3 (Figure 2A). The RVNA level increased most evidently in Group B. At each time point, the GMC in Group B was significantly higher than that in Groups A and C, but no significant difference was found between Groups A and C (Table 3a). The results of the mITT were similar to those of the FAS (Tables 2b and 3b, Figure 2B).
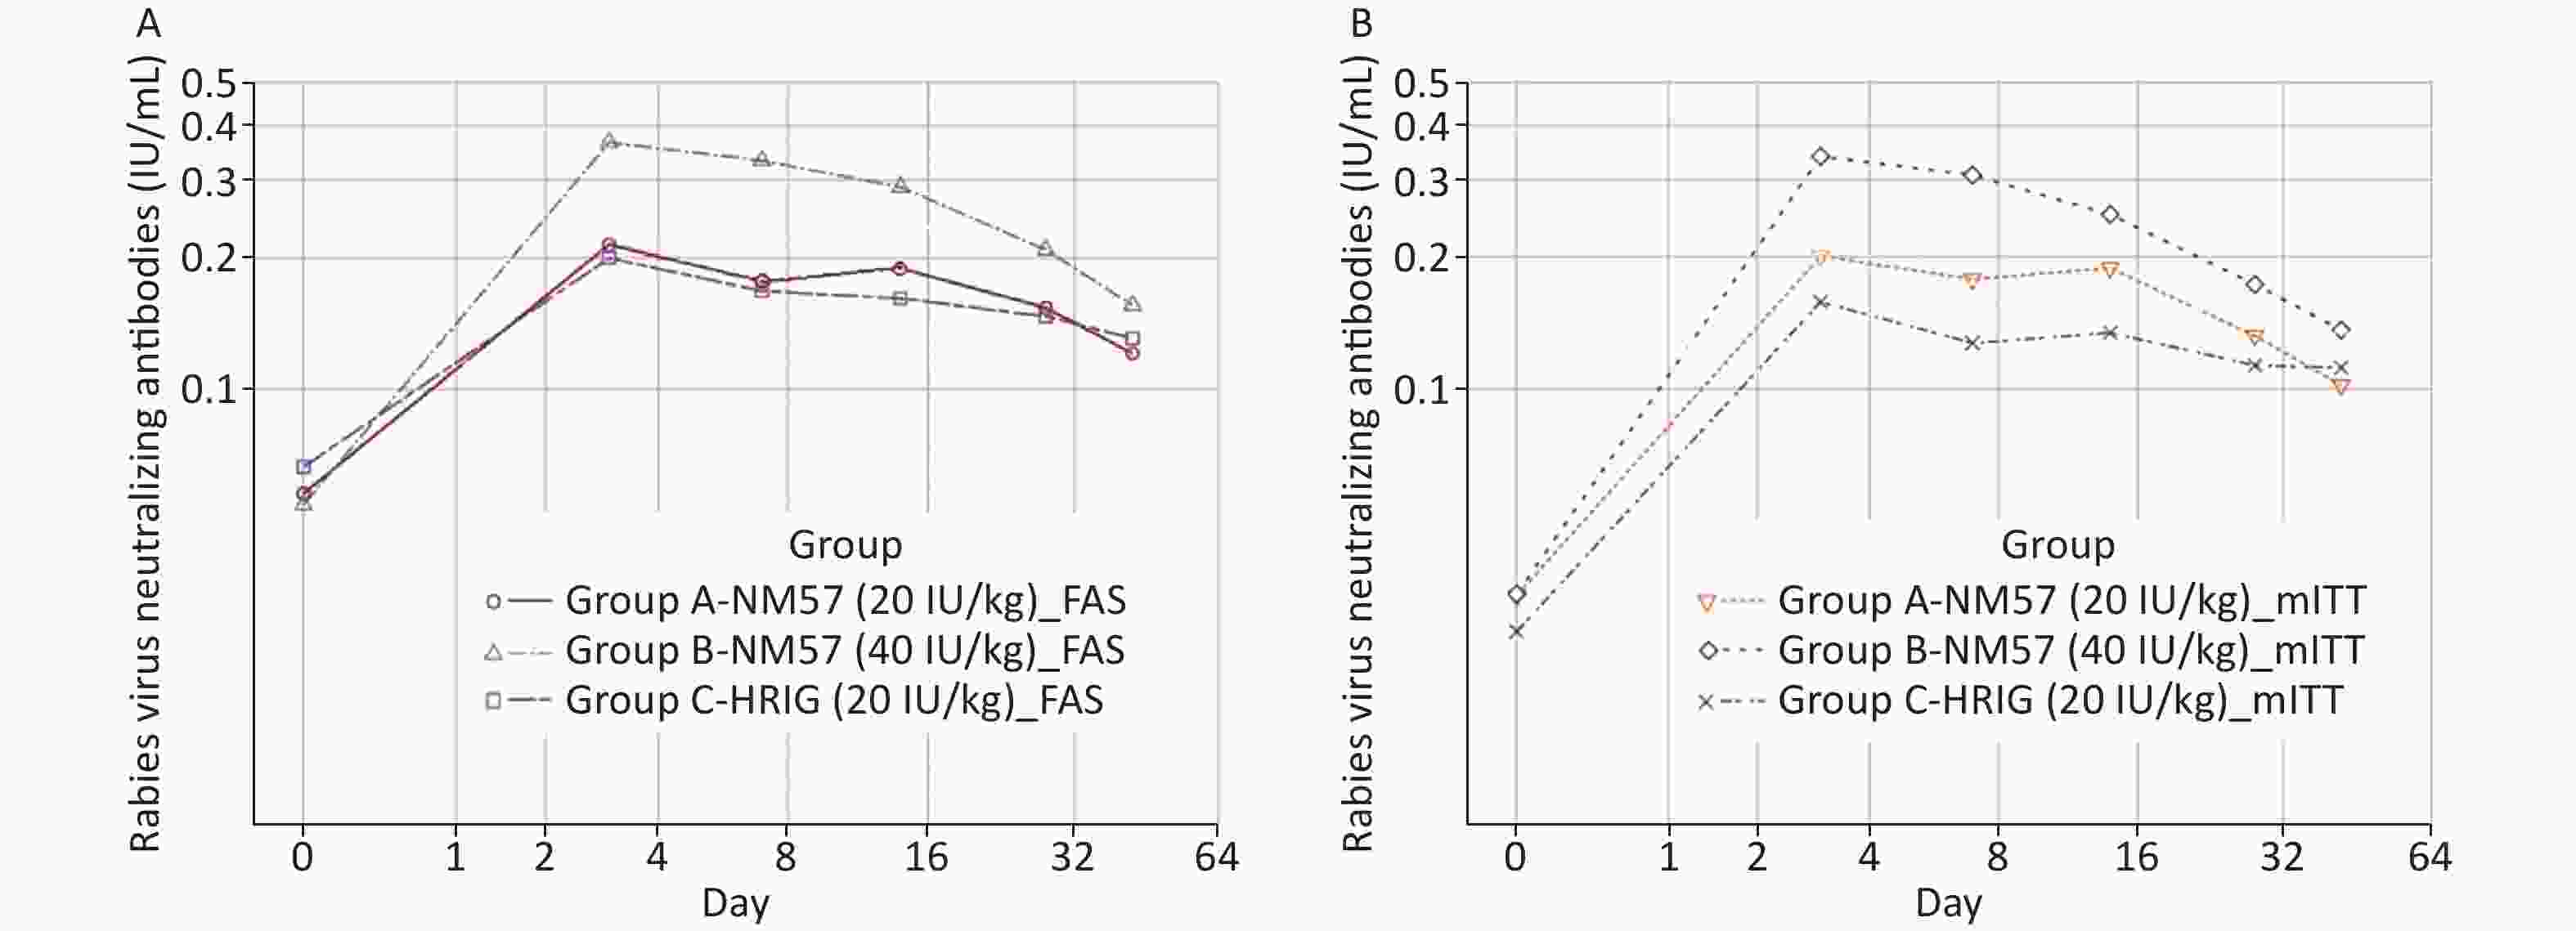
Figure 2. Geometric mean concentration of RVNA at different visits (FAS and mITT). All subjects (100%) developed detectable RVNA (> 0.05 IU/mL) on days 3, 7, 14, 28, and 42. On day 3, peak RVNA levels were achieved in the three groups. At each follow-up point, the GMC in Group B (40 IU/mL NM57) was significantly higher than that in Group A (20 IU/mL NM57) and Group C (20 IU/mL HRIG), but no significant difference was found in the latter two groups. The FAS and the mITT showed similar trends.
Time Detection rate of RVNA (%) Group A
(n = 20)Group B
(n = 20)Group C
(n = 20)Statistic/P Baseline Mean
(95% CI)45.00
(23.06−68.47)40.00
(19.12−63.95)55.00
(31.53−76.94)χ2 = 0.9219,
P = 0.6307Day 3 Mean
(95% CI)100.00
(83.16−100.00)100.00
(83.16−100.00)100.00
(83.16−100.00)NA Day 7 Mean
(95% CI)100.00
(83.16−100.00)100.00
(83.16−100.00)100.00
(83.16−100.00)NA Day 14 Mean
(95% CI)100.00
(83.16−100.00)100.00
(83.16−100.00)100.00
(83.16−100.00)NA Day 28 Mean
(95% CI)100.00
(83.16−100.00)100.00
(83.16−100.00)100.00
(83.16−100.00)NA Day 42 Mean
(95% CI)100.00
(83.16−100.00)100.00
(83.16−100.00)100.00
(83.16−100.00)NA Note. To compare the detection rate of RVNA among three groups, χ2 test was used. If the difference was statistically significant, Fisher’s exact test was performed to make pairwise comparisons. FAS, full analysis set. Table 2a. Detection rate (95% CI) of RVNA (FAS)
Time Detection rate of RVNA (%) Group A
(n = 11)Group B
(n = 12)Group C
(n = 9)Statistic/P Baseline Mean
(95% CI)0.00
(0.00−28.49)0.00
(0.00−26.46)0.00
(0.00−33.63)NA Day 3 Mean
(95% CI)100.00
(71.51−100.00)100.00
(73.54−100.00)100.00
(66.37−100.00)NA Day 7 Mean
(95% CI)100.00
(71.51−100.00)100.00
(73.54−100.00)100.00
(66.37−100.00)NA Day 14 Mean
(95% CI)100.00
(71.51−100.00)100.00
(73.54−100.00)100.00
(66.37−100.00)NA Day 28 Mean
(95% CI)100.00
(71.51−100.00)100.00
(73.54−100.00)100.00
(66.37−100.00)NA Day 42 Mean
(95% CI)100.00
(71.51−100.00)100.00
(73.54−100.00)100.00
(66.37−100.00)NA Note. To compare the detection rate of RVNA among three groups, χ2 test was used. If the difference was statistically significant, Fisher’s exact test was performed to make pairwise comparisons. mITT, modified intention-to-treat analysis. Table 2b. Detection rate (95% CI) of RVNA (mITT)
Time Geometric mean
concentrations (IU/mL)Group A
(n = 20)Group B
(n = 20)Group C
(n = 20)Statistic/P Baseline Mean ± SD
Min, Max0.0579 ± 2.3249
0.01, 0.280.0546 ± 2.3213
0.01, 0.460.0666 ± 2.8540
0.01, 0.57NA Day 3 Mean ± SD
Min, Max0.2139 ± 1.4608
0.11, 0.420.3660 ± 1.2499
0.19, 0.530.1994 ± 1.5007
0.14, 0.53F = 24.4898, P < 0.0001 Group A−Group C
Group B−Group C
Group A−Group BF = 0.8984, P = 0.3473
F = 41.8703, P < 0.0001
F = 30.7518, P < 0.0001Day 7 Mean ± SD
Min, Max0.1764 ± 1.3100
0.13, 0.310.3324 ± 1.4084
0.15, 0.530.1677 ± 1.6196
0.06, 0.52F = 25.1773, P < 0.0001 Group A−Group C
Group B−Group C
Group A−Group BF = 0.4261, P = 0.5166
F = 41.4284, P < 0.0001
F = 33.7164, P < 0.0001Day 14 Mean ± SD
Min, Max0.1890 ± 1.4142
0.14, 0.410.2895 ± 1.5185
0.08, 0.580.1612 ± 1.3714
0.12, 0.41F = 18.4065, P < 0.0001 Group A−Group C
Group B−Group C
Group A−Group BF = 3.0383, P = 0.0868
F = 34.8119, P < 0.0001
F = 17.4403, P < 0.0001Day 28 Mean ± SD
Min, Max0.1535 ± 1.3770
0.10, 0.400.2082 ± 1.4844
0.12, 0.530.1468 ± 1.5690
0.06, 0.46
F = 9.7662, P = 0.0002Group A−Group C
Group B−Group C
Group A−Group BF = 0.7359, P = 0.3946
F = 17.4650, P = 0.0001
F = 11.1251, P = 0.0015Day 42 Mean ± SD
Min, Max0.1209 ± 1.4190
0.08, 0.390.1557 ± 1.3644
0.08, 0.400.1308 ± 1.2538
0.08, 0.19F = 7.4864, P = 0.0013 Group A−Group C
Group B−Group C
Group A−Group BF = 0.4611, P = 0.4999
F = 8.7129, P = 0.0046
F = 13.2711, P = 0.0006Note. Analysis of covariance (ANCOVA) was used to test the log10 transformed GMC difference among three groups, and the covariate was the baseline data. Pairwise comparisons would also be performed if the difference between groups was statistically significant. FAS, full analysis set. Table 3a. Geometric mean concentrations (GMC) of RVNA (FAS)
Time Geometric mean
concentrations (IU/mL)Group A
(n = 11)Group B
(n = 12)Group C
(n = 9)Statistic/P Baseline Mean ± SD
Min, Max0.0337 ± 1.8405
0.01, 0.050.0340 ± 1.8083
0.01, 0.050.0279 ± 1.8725
0.01, 0.05NA Day 3 Mean ± SD
Min, Max0.2006 ± 1.4122
0.15, 0.420.3392 ± 1.2724
0.19, 0.440.1578 ± 1.1288
0.14, 0.19F = 23.7957, P < 0.0001 Group A−Group C
Group B−Group C
Group A−Group BF = 4.2586, P = 0.0484
F = 43.4173, P < 0.0001
F = 22.9064, P < 0.0001Day 7 Mean ± SD
Min, Max0.1779 ± 1.3107
0.14, 0.310.3075 ± 1.4502
0.15, 0.410.1271 ± 1.3808
0.06, 0.18F = 20.1924, P < 0.0001 Group A−Group C
Group B−Group C
Group A−Group BF = 5.7304, P = 0.0236
F = 38.4918, P < 0.0001
F = 16.1363, P = 0.0004Day 14 Mean ± SD
Min, Max0.1884 ± 1.3847
0.14, 0.410.2499 ± 1.5706
0.08, 0.390.1342 ± 1.0677
0.12, 0.15F = 8.8018, P = 0.0011 Group A−Group C
Group B−Group C
Group A−Group BF = 5.2464, P = 0.0297
F = 17.5908, P = 0.0002
F = 3.9431, P = 0.0569Day 28 Mean ± SD
Min, Max0.1321 ± 1.1110
0.100, 0.1400.1730 ± 1.2773
0.120, 0.3300.1130 ± 1.3296
0.060, 0.150F = 9.4840, P = 0.0007 Group A−Group C
Group B−Group C
Group A−Group BF = 2.2434, P = 0.1454
F = 17.7762, P = 0.0002
F = 8.2361, P = 0.0077Day 42 Mean ± SD
Min, Max0.1018 ± 1.2181
0.08, 0.130.1362 ± 1.2126
0.08, 0.180.1117 ± 1.2049
0.08, 0.14F = 6.6392, P = 0.0044 Group A−Group C
Group B−Group C
Group A−Group BF = 1.2904, P = 0.2656
F = 4.8545, P = 0.0360
F = 12.8374, P = 0.0013Note. Analysis of covariance (ANCOVA) was used to test the log10 transformed GMC difference among three groups, and the covariate was the baseline data. Pairwise comparisons would also be performed if the difference between groups was statistically significant. mITT, modified intention-to-treat analysis. Table 3b. Geometric mean concentrations (GMC) of RVNA (mITT)
The mean AUC over 0–14 days in Group B (4.43 IU/mL per day) was significantly larger than that in Group A (2.63 IU/mL per day) and Group C (2.57 IU/mL per day) (P < 0.001), but showed no significant difference between Groups A and C (P > 0.05). The mean AUC over 0–42 days in Group B (10.92 IU/mL per day) was also larger than that in Group A (7.24 IU/mL per day) and Group C (7.00 IU/mL per day), and similar in the latter two groups (Table 4a). The results of the mITT were similar to those of the FAS (Table 4b). Anti-antibodies only originated from NM57. We reported anti-antibody profiles in Groups A and B, and only one participant was positive for anti-antibody in Group B.
Time AUC of RVNA
(IU/mL per day)Group A
(n = 20)Group B
(n = 20)Group C
(n = 20)Statistic/P Days
0–14Mean ± SD
(95% CI)2.63 ± 0.71
(2.3–3.0)4.43 ± 1.04
(3.9–4.9)2.57 ± 1.39
(1.9–3.2)χ2 = 26.7982,
P < 0.0001Days
0–42Mean ± SD
(95% CI)7.24 ± 2.37
(6.1–8.3)10.92 ± 3.18
(9.4–12.4)7.00 ± 3.11
(5.5–8.5)χ2 = 23.7446,
P < 0.0001Note. Comparisons for AUCs were performed by Kruskal-Wallis test. If the difference was statistically significant, Wilcoxon rank-sum test was performed to make pairwise comparisons. FAS, full analysis set. Table 4a. Area under curve (AUC) of RVNA (FAS)
Time AUC of RVNA
(IU/mL per day)Group A
(n = 11)Group B
(n = 12)Group C
(n = 9)Statistic/P Days
0–14Mean ± SD
(95% CI)2.52 ± 0.59
(2.1−2.9)4.01 ± 0.86
(3.5−4.6)1.80 ± 0.22
(1.6−2.0)χ2 = 22.4400,
P < 0.0001Days
0–42Mean ± SD
(95% CI)6.49 ± 1.07
(5.8−7.2)9.36 ± 1.44
(8.4−10.3)5.17 ± 0.43
(4.8−5.5)χ2 = 24.3174,
P < 0.0001Note. Comparisons for AUCs were performed by Kruskal-Wallis test. If the difference was statistically significant, Wilcoxon rank-sum test was performed to make pairwise comparisons. mITT, modified intention-to-treat analysis. Table 4b. Area under curve (AUC) of RVNA (mITT)
A total of 15 (25.0%) AEs were reported, of which 12 (20.0%) were considered to be ARs related to the study drugs (Tables 5 and 6). Injection site erythema, asthenia, fatigue, and pyrexia were the most common ARs. Except for one case of grade 2 myalgia in Group C, the other ARs were all grade 1. No SAEs were reported.
System Organ Class
Preferred TermNo (%) Group A
(n = 20)Group B
(n = 20)Group C
(n = 20)Total
(n = 60)Number of subjects with ≥ 1 AE 6 (30.0) 4 (20.0) 5 (25.0) 15 (25.0) Investigations 0 0 1 (5.0) 1 (1.7) White blood cells urine positive 0 0 1 (5.0) 1 (1.7) Red blood cells urine positive 0 0 1 (5.0) 1 (1.7) Nervous system disorders 0 1 (5.0) 0 1 (1.7) Headache 0 1 (5.0) 0 1 (1.7) Ear and labyrinth disorders 0 0 1 (5.0) 1 (1.7) Tinnitus 0 0 1 (5.0) 1 (1.7) Musculoskeletal and connective tissue disorders 1 (5.0) 0 1 (5.0) 2 (3.3) Myalgia 1 (5.0) 0 1 (5.0) 2 (3.3) Skin and subcutaneous tissue disorders 0 0 1 (5.0) 1 (1.7) Dermatitis 0 0 1 (5.0) 1 (1.7) General disorders and administration site conditions 4 (20.0) 4 (20.0) 1 (5.0) 9(15.0) Pyrexia 1 (5.0) 0 1 (5.0) 2(3.3) Asthenia 2 (10.0) 2 (10.0) 0 4(6.7) Fatigue 2 (10.0) 2 (10.0) 0 4(6.7) Injection site erythema 1 (5.0) 2 (10.0) 1 (5.0) 4(6.7) Injection site pain 1 (5.0) 0 0 1 (1.7) Injection site pruritus 1 (5.0) 0 0 1 (1.7) Gastrointestinal disorders 1 (5.0) 0 0 1 (1.7) Diarrhoea 1 (5.0) 0 0 1 (1.7) Note. The number of adverse events or reactions represents the number of participants who had at least one adverse event or reaction of this type. For example, a participant with several events would be only calculated once in “adverse events”, and would also be calculated once in “Number of subjects with ≥ 1 AE” or “Number of subjects with ≥ 1 ADR”. AE, adverse events. ADR, adverse drug reaction. Table 5. Details of adverse events
System organ class preferred term No. (%) Group A
(n = 20)Group B
(n = 20)Group C
(n = 20)Total
(n = 60)Number of subjects with ≥ 1 ADR 4 (20.0) 4 (20.0) 4 (20.0) 12 (20.0) Investigations 0 0 1 (5.0) 1 (1.7) White blood cells urine positive 0 0 1 (5.0) 1 (1.7) Red blood cells urine positive 0 0 1 (5.0) 1 (1.7) Nervous system disorders 0 1 (5.0) 0 1 (1.7) Headache 0 1 (5.0) 0 1 (1.7) Musculoskeletal and connective tissue disorders 0 0 1 (5.0) 1 (1.7) Myalgia 0 0 1 (5.0) 1 (1.7) Skin and subcutaneous tissue disorders 0 0 1 (5.0) 1 (1.7) Dermatitis 0 0 1 (5.0) 1 (1.7) General disorders and administration site conditions 4 (20.0) 4 (20.0) 1 (5.0) 9 (15) Pyrexia 1 (5.0) 0 1 (5.0) 2 (3.3) Asthenia 2 (10.0) 2 (10.0) 0 4 (6.7) Fatigue 2 (10.0) 2 (10.0) 0 4 (6.7) Injection site erythema 1 (5.0) 2 (10.0) 1 (5.0) 4 (6.7) Injection site pain 1 (5.0) 0 0 1 (1.7) Injection site pruritus 1 (5.0) 0 0 1 (1.7) Note. The number of adverse events or reactions represents the number of participants who had at least one adverse event or reaction of this type. For example, a participant with several events would be only calculated once in “adverse events”, and would also be calculated once in “Number of subjects with ≥ 1 AE” or “Number of subjects with ≥ 1 ADR”. AE, adverse events. ADR, adverse drug reaction. Table 6. Details of adverse reactions
-
Because active immunity induced by rabies vaccine did not appear until day 7 after vaccination, RIG injection, as a part of post-exposure prophylaxis (PEP), has been developed to provide immediate local neutralization to people exposed to rabies virus[1]. However, in rabies-endemic countries, RIG is usually in short supply, and its use is restricted by various factors[3]. According to consensus, mAbs provide a new solution for the prevention and treatment of rabies and the first (a single mAb) was recently licensed by the Serum Institute of India[6]. Studies so far have shown that its performance is equivalent to that of HRIG[3]. NM57 was approved by NMPA for use in China in January 2022. It is the first mAb for prophylactic treatment of rabies virus exposure in China.
Our results suggested that the safety of NM57 was comparable to that of HRIG. ARs were mostly grade 1 and resolved spontaneously without sequelae, and there was no occurrence of SAEs. The most common injection site AEs were erythema, pain and pruritus, similar to those reported by Bakkera and Nithya[14,15]. The most common systemic AEs were asthenia, fatigue and pyrexia, which differed from those induced by CL184 and SII RMab[14,15]. For the latter two antibodies, the systemic AE with the highest incidence was headache. Laboratory tests showed only one case of positive urinary erythrocytes in the HRIG group on day 7 after administration. Similar results also showed up in Nithya’s Phase I study[15], in which microscopic hematuria occurred in four subjects, including three treated with SII RMab and one with rabies vaccine, but this abnormality was irrelevant to drug administration.
RVNA serology was accepted by WHO as an indirect assessment of study endpoints in clinical trials of novel rabies vaccines or RIG products[16]. WHO specifies that a minimum serum antibody concentration of 0.5 IU/mL is widely used as a measure of adequate seroconversion after vaccination. In most individuals, irrespective of age or nutritional status, this level is reached by days 7–14 of a PEP regimen, with or without simultaneous administration of RIG[17]. Like RIG, the role of NM57 in passive immunization is to provide neutralizing antibodies at the site of exposure before patients start producing their own antibodies as a result of vaccination[3]. The present Phase IIa clinical trial aimed to evaluate the rabies virus neutralizing activity, safety and immunogenicity of the study drug alone, and not in combination with the rabies vaccine. In order to be consistent with the evaluation criteria of earlier clinical trials, the detection rate of RVNA (> 0.05 IU/mL) and its level, especially in the early stage after administration, could be used to predict its efficacy[18,19]. Our study showed that the detection of RVNA > 0.05 IU/mL was 100% on days 3–42 in all three groups, without significant differences. The RVNA level peaked on day 3 in all three groups. At each follow-up point, the GMC in Group B was significantly higher than that in Groups A and C. AUCs over days 0–14 and 0–42 in Group B were larger than those in Groups A and C. This suggested that the rabies virus neutralizing activity in subjects treated with 40 IU/kg NM57 was superior to that in those treated with 20 IU/kg NM57 or 20 IU/kg HRIG when not combined with rabies vaccine. The rabies virus neutralizing activity was similar in the latter two groups.
We noted that nearly half of the participants (28/60, 46.67%) had RVNA > 0.05 IU/mL at baseline. It cannot be inferred that these participants had a history of rabies vaccination or RIG administration, but it may have been caused by the innate immune system, such as complement with some neutralizing activity. However, to exclude the impact of baseline factors, mITT was also used for analysis, and the results showed that RNVA was similar to FAS.
We found that in the FAS, the GMC on day 13 in Group A was higher than that on day 7 (0.1890 vs. 0.1764 IU/mL). As shown in spiking studies[20], the estimated limit of detection of RFFIT was 0.118 IU/mL, and 0.1 IU/mL or lower. There was little variation in the antibody titer exhibited by RFFIT. The lower accuracy of RFFIT may increase variability in GMC. This may explain the elevated GMC on day 13 in Group A. However, these samples could not be retested, due to insufficient volume. Given that, we still believe that this test has some degree of reproducibility, since the GMCs in Phase Ia clinical trial also showed similar antibody titers and attenuation, but there are limitations in evaluating the neutralizing antibody capacity of low titers.
In the present study, only one case of positive anti-antibody was found in Group B. The participant developed grade 1 fatigue and asthenia on the day after administration, (which were relieved on the same day) and completed all subsequent evaluations.
Our study was the first to evaluate the neutralizing activity and safety of anti-rabies mAb NM57 and HRIG in Chinese adults aged 18–55 years, which fills the gap left by the Phase I trial. In addition, a preliminary study on the dose of NM57 was conducted, laying a foundation for the Phase IIb clinical trial (combined with vaccine).
In conclusion, our study demonstrated the comparable safety of NM57 and HRIG in Chinese healthy adults, and the superior rabies virus neutralizing activity of 40 IU/kg NM57 to that of 20 IU/kg NM57 and 20 IU/kg HRIG, and similar neutralizing activity in the latter two groups. These findings provided a strong reference for a population-enlarged, vaccine-combined, Phase IIb clinical trial.
Funds:
This study was supported by 2021 Beijing Key Specialty Program for Major Epidemic Prevention and Control

 Quick Links
 DownLoad: