

-
Chronic obstructive pulmonary disease (COPD) is a common, preventable, and treatable disease characterized by persistent airflow limitation. The chronic airflow limitation progressively traps gas during expiration, resulting in hyperinflation, increased dyspnea, and limitations in exercise capacity. Acute exacerbation of COPD (AECOPD) is defined as an acute worsening of respiratory symptoms necessitating additional therapy. The severity of AECOPD and its increasing frequency is associated with a higher risk of death [1]. However, there is a lack of effective indicators to predict AECOPD. A deteriorating airflow limitation is associated with an increasing prevalence of exacerbations [2]. Forced expiratory volume in 1 sec (FEV1) is an indicator of airflow limitation, but it lacks sufficient precision to be used clinically as a predictor of exacerbation or mortality in patients with COPD [3]. Only a weak correlation is observed between FEV1, symptoms, and impaired health status of patients[4]. Thus, it is important to explore other effective indicators for predicting AECOPD.
Exercise capacity is limited in COPD patients and is significantly correlated with overall survival [5]. The probable mechanisms include impaired oxygen delivery to skeletal muscle and ventilatory limitations [6]. Cardiopulmonary exercise testing (CPET) is used to assess exercise tolerance and evaluate the pathophysiological mechanism(s) of dyspnea and exercise limitation in patients with COPD [7]. Oxygen pulse (O2P), an important CPET variable, is a noninvasive and reliable method used to estimate stroke volume and cardiac function [8] with the exclusion of coexisting diseases, but it has rarely been used to evaluate the severity of COPD. O2P is defined as oxygen uptake (V̇O2) divided by heart rate (HR). One study showed that O2P is impaired during exercise in patients with COPD, and this is partly related to lung hyperinflation [9]. Miniati et al. [10] reported that peak O2P is significantly lower in patients with moderate to severe emphysema than in those with no or mild emphysema. Thus, O2P may be an important indicator for differentiating COPD severity. O2Pmax represents the O2P at maximal exercise and reflects the maximal aerobic metabolic function. O2Pmax is extensively used for testing patients with cardiovascular diseases, but it has limited use in those with COPD. Furthermore, increased hyperinflation and gas trapping occur during an exacerbation, with reduced expiratory flow [11]. A worsening of gas exchange can also result in hypoxemia [12]. O2P is directly related to hyperinflation and reflects gas exchange, so O2P may be a better predictor of AECOPD. Accordingly, we hypothesized that O2Pmax has a role in COPD and may be related to AECOPD.
In this study, we examined the relationship between O2Pmax and exercise capacity, ventilatory conditions, gas exchange efficiency, and health-related quality of life (HRQL). We also estimated the predictive value of O2Pmax for AECOPD and determined the cut-off value.
-
This retrospective analysis involved patients with COPD who underwent incremental cardiopulmonary exercise in our exercise laboratory at Beijing Friendship Hospital, Capital Medical University (Beijing, China) from 1 January 2017 to 31 December 2020. This study was conducted in compliance with the Declaration of Helsinki. The Institutional Ethics Committee of Beijing Friendship Hospital of Capital Medical University approved this study (no. 2021-P2-334-01).
-
All participants were men and women aged ≥ 40 years with a body mass index of 18–32 kg/m2 and no episodes of AECOPD within the previous 6 weeks. All of the participants had been diagnosed with COPD and a grade I, II, III, or IV airflow limitation according to the Global Initiative for Chronic Obstructive Lung Disease (GOLD) criteria and underwent CPET in our clinic. After enrollment, the participants’ smoking history, comorbidities (hypertension, coronary heart disease, type 2 diabetes, and hypercholesterolemia), medications used for COPD, and medications used for cardiovascular disease were recorded. The patients were followed up outside of the hospital by telephone. AECOPD was classified as mild (treated with short-acting bronchodilators only), moderate (treated with short-acting bronchodilators plus antibiotics and/or oral corticosteroids), or severe (required hospitalization or visits to the emergency room) [13]. The exclusion criteria were respiratory diseases other than COPD, heart failure, uncontrolled diabetes mellitus, uncontrolled hypertension, orthopedic problems, neurologic problems, and hemopathy.
-
All participants underwent static spirometry (MasterScreen Body; CareFusion, San Diego, CA, USA), including measurements of FEV1, forced vital capacity (FVC), vital capacity (VC), peak expiratory flow, and maximal mid-expiratory flow rate 75/25. Body plethysmography was performed to measure the residual volume (RV), total lung capacity (TLC), and the transfer factor of the lungs for carbon monoxide/alveolar volume. All pulmonary function tests were performed according to the American Thoracic Society/European Respiratory Society guidelines[14].
-
CPET was performed according to the American Thoracic Society/European Respiratory Society guidelines [15]. All patients rested for 3 min, performed unloaded pedaling for 3 min, and then underwent an incremental, symptom-limited exercise test using an electronically braked cycle ergometer (ViaSprint, CareFusion, Hoechberg, Germany) at a pedaling rate of 40–70 rpm (approximately 60 rpm). The work rate (WR) was set to 5–20 W/min and was gradually increased by 5–15 W/min (5 W/min if FEV1 < 1.0 L and 10 W/min if FEV1 ≥ 1.0 L). The test ended when the cadence fell below 40 rpm and did not return with an exhortation, the patients requested termination, or the technician terminated the test for safety [16]. The limiting symptom was defined as the inability to maintain pedaling frequency or the development of intolerable shortness of breath. Chest pain (suggesting myocardial ischemia), ventricular tachycardia, and blood pressure (BP) ≥ 240/130 mmHg also prevented further exercise. The O2Pmax was defined as V̇O2max/HR. According to the current guidelines [17], O2Pmax values ≥ 80% of the predicted value were considered normal, whereas O2Pmax < 80% of the predicted value was considered pathological. Accordingly, Group 1 was defined as patients with impaired O2Pmax (< 80% predicted), and Group N was defined as patients with normal O2Pmax (≥ 80% predicted). V̇O2, carbon dioxide production (V̇CO2), minute ventilation (V̇E), breathing reserve (BR), and 12-lead electrocardiography were measured continuously. BP was measured at the end of every 2 min. Load was reported at maximum exertion. V̇O2/kg, the ventilatory equivalent for carbon dioxide (EqCO2), and HR recovery after 1 min of rest (HRR1) were calculated automatically. The anaerobic threshold (AT) was identified using the modified V-slope method.
-
The COPD Assessment Test (CAT) and the St. George’s Respiratory Questionnaire (SGRQ) were used to measure the impaired health status of patients with COPD. The SGRQ includes four categories, such as symptoms, physical activities, psychosocial impacts, and the total score. The CAT total score ranges from 0 to 40, and the SGRQ total score ranges from 0 to 100. An SGRQ score ≥ 25 was used as the threshold for breathlessness, and the equivalent cut-off point for the CAT was 10[13]. The modified British Medical Research Council Questionnaire (mMRC) was used to assess dyspnea severity. The mMRC score ranges from 0 to 5, and ≥ 2 was considered the threshold for separating “less breathlessness” from “more breathlessness.” Because our patients were using mouthpieces and could not conveniently answer the doctors’ questions during exercise, the dyspnea level and leg muscle fatigue were scored using Borg’s 10-point category-ratio scale (Borg CR10 scale) after the patients finished exercising. A Borg CR10 scale score of 4–6 indicated moderate to severe symptoms.
-
Fifty-seven patients (63%) completed the 3-year follow-up. AECOPD was tracked during the next 3 years. Telephone calls were made to the patients every 4 months to determine whether they had experienced any exacerbations, had taken any short-acting bronchodilators, antibiotics, or oral corticosteroids, or had been hospitalized. According to the GOLD [13], patients with AECOPD (AE2 group) developed more than one acute exacerbation episode within 1 year. Patients without AECOPD (AE1 group) had developed no or only one acute exacerbation episode within the year.
-
Continuous data were expressed as mean ± standard deviation, number, and percentage, or median (IQR), while categorical data were expressed as frequencies and percentages. Continuous data were compared using the t-test or Mann-Whitney test, and categorical data were compared using the chi-square test. A P-value < 0.05 was considered significant.
Pearson’s correlation coefficient (r) was used to assess the correlations between the static lung function variables (FEV1/FVC%, FEV1%, FVC%, and VC) and the CPET variables (AT%, WRAT, WRmax, WR%, V̇O2AT, V̇O2max, V̇O2%, V̇O2/kgmax, V̇O2/kg%, V̇Emax, V̇E%, BRAT, BRmax, EqCO2AT, EqCO2max, and HRR1) and O2Pmax.
Univariate logistic regression analysis was performed to assess the efficiency of O2Pmax for predicting AECOPD. Static lung function and CPET variables that were significantly different between the AE2 and AE1 groups were assessed to identify risk factors for AECOPD using multivariate logistic regression analysis. Wald’s test was used to obtain the logistic regression parameters.
The discriminative ability of O2Pmax in predicting AECOPD was evaluated by receiver operating characteristic (ROC) analysis. The area under the ROC curve (AUC) and the 95% confidence interval (CI) were calculated. The best cut-off value was determined.
-
Table 1 shows the patient demographics and baseline characteristics. Ninety-one patients with COPD were divided into Group 1 (n = 27) and Group N (n = 64) according to their O2Pmax value. No significant differences in age, sex, body height, body mass index, smoking history, comorbidities, or medications were observed between the two groups. However, significant differences in body weight and classification of the airflow limitation were detected between the two groups (P < 0.05). The airflow limitation was more severe in Group 1 than in Group N.
Item Group 1 (n = 27) Group N (n = 64) All (n = 91) P-value Demographic Age (years) 65.1 ± 7.6 64.4 ± 7.3 64.6 ± 7.4 0.682 Male/Female (n) 23/4 52/12 75/16 0.652 Height (cm) 169.5 ± 5.4 167.4 ± 6.9 168.0 ± 6.5 0.167 Weight (kg) 73.9 ± 13.3 66.7 ± 9.3 68.9 ± 11.0 0.015 BMI (kg/m2) 24.8 ± 3.6 23.8 ± 3.1 24.1 ± 3.3 0.160 Smoking (n) 0.292 Non-smoker 4 (15%) 6 (9%) 10 (11%) Current smoker 20 (74%) 42 (66%) 62 (68%) Ex-smoker 3 (11%) 16 (25%) 19 (21%) GOLD (n) n (27) n (64) 0.014 I 1 (4%) 8 (13%) 9 (10%) II 14 (52%) 43 (67%) 57 (63%) III 9 (33%) 13 (20%) 22 (24%) IV 3 (11%) 0 (0%) 3 (3%) Comorbidities (n) n (22) n (53) 0.398 Hypertension 8 28 36 CHD 4 6 10 Type 2 diabetes 9 14 23 Hypercholesterolemia 1 5 6 Medications for COPD (n) n (27) n (64) 0.716 None 16 37 53 LABA 1 2 LAMA 1 7 LABA + LAMA 0 1 LABA + ICS 2 7 LABA + LAMA + ICS 7 10 Medications for CVD (n) n (13) n (45) 0.680 Beta-blockers 3 14 Aspirin 1 6 ACEI 1 1 CCB 3 12 ARBs 3 4 Statin 2 8 Note. Data are presented as mean ± standard deviation or numbers (percentage). All demographic data except sex were compared using the t-test. Other data were compared using the chi-square test. Bold numbers indicate a significant difference (P < 0.05) between the two groups. Abbreviations: BMI, body mass index; GOLD, Global Initiative for Chronic Obstructive Lung Disease; CHD, coronary heart disease; LABA, long-acting beta 2 agonist; LAMA, long-acting antimuscarinic antagonist; ICS, inhaled corticosteroid; CVD, cardiovascular disease; ACEI, angiotensin-converting enzyme inhibitor; CCB, calcium channel blocker; ARB, angiotensin receptor blocker. Table 1. Baseline characteristics of Group 1 (O2Pmax < 80% predicted) and Group N (O2Pmax ≥ 80% predicted)
-
Table 2 shows the static lung function parameters. Patients with a lower O2Pmax had lower FVC%, VC%, FEV1%, and FEV1/FVC% values (P < 0.05).
Item Group 1
(n = 27)Group N
(n = 64)All
(n = 91)P-value FVC (% predicted) 75.00 ± 16.67 86.80 ± 16.57 83.30 ± 1.82 0.003 VC (% predicted) 72.55 ± 16.34 84.45 ± 16.29 80.92 ± 1.79 0.003 FEV1 (% predicted) 51.49 ± 20.33 63.79 ± 16.15 60.14 ± 1.92 0.003 FEV1/FVC (%) 52.25 ± 13.07 58.34 ± 10.46 56.53 ± 1.21 0.038 RV/ TLC (%) 0.57 ± 0.11 0.55 ± 0.17 0.56 ± 0.02 0.618 PEF (% predicted) 60.81 ± 24.02 69.80 ± 21.70 67.14 ± 2.37 0.084 MMEF75/25(% predicted) 20.03 ± 11.40 24.01 ± 11.00 22.83 ± 1.17 0.121 TLCO/VA (% predicted) 73.41 ± 26.16 81.11 ± 21.56 78.83 ± 2.43 0.148 Note. Data are presented as mean ± standard deviation. Data were compared using the t-test. Bold numbers indicate a significant difference (P < 0.05) between the two groups. Abbreviations: FVC, forced vital capacity; VC, vital capacity; FEV1, forced expiratory volume in 1 s; RV, residual volume; TLC, total lung capacity; PEF, peak expiratory flow; MMEF75/25, maximal mid-expiratory flow rate 75/25; TLCO/VA, transfer factor of the lungs for carbon monoxide/alveolar volume. Table 2. Differences in the static lung function test parameters between Group 1 (O2Pmax < 80% predicted) and Group N (O2Pmax ≥ 80% predicted)
-
Table 3 shows the CPET variables. AT, WR, V̇O2, V̇O2/kg, HR, systolic BP, diastolic BP, V̇E, BR, and EqCO2 were measured at the AT and maximum exercise during CPET. HRR1 was calculated after the exercise. Significant differences in AT, WR%, V̇O2%, V̇O2/kg%, V̇E%, EqCO2AT, and EqCO2max were observed between the two groups (P < 0.05). Among these variables, EqCO2AT and EqCO2max were higher in patients with impaired O2Pmax, whereas the other variables were lower. Significant differences were also detected in HRR1 (P < 0.05), which was regarded as a circulatory parameter.
Item Group 1 (n = 27) Group N (n = 64) All (n = 91) P-value AT (%) 37.92 ± 9.34 54.51 ± 11.85 49.59 ± 13.47 < 0.001 WR (% predicted) 57.67 ± 15.07 90.84 ± 22.92 81.00 ± 25.80 < 0.001 V̇O2 (% predicted) 55.37 ± 8.21 77.86 ± 13.37 71.19 ± 15.85 < 0.001 V̇O2/kg (% predicted) 54.78 ± 8.37 77.63 ± 12.18 70.85 ± 15.31 < 0.001 HRAT (beats/min) 106.70 ± 12.14 106.83 ± 14.06 106.79 ± 13.45 0.968 HRmax (beats/min) 130.59 ± 16.70 130.86 ± 18.80 130.78 ± 13.11 0.949 SBPAT (mmHg) 140.96 ± 24.68 137.53 ± 23.47 138.55 ± 23.75 0.542 SBPmax (mmHg) 167.63 ± 23.07 161.31 ± 31.08 163.19 ± 28.95 0.345 DBPAT (mmHg) 81.19 ± 12.57 83.77 ± 18.98 83.00 ± 17.30 0.519 DBPmax (mmHg) 90.41 ± 17.47 94.94 ± 29.50 93.58 ± 26.45 0.460 V̇E (% predicted) 47.26 ± 11.73 62.83 ± 14.02 58.21 ± 15.12 < 0.001 BRAT (mL/min) 42.56 ± 18.74 50.94 ± 14.03 48.45 ± 15.94 0.043 BR (% predicted) 71.11 ± 70.12 73.14 ± 64.31 72.54 ± 65.70 0.894 EqCO2AT 35.65 ± 6.05 32.33 ± 4.94 33.31 ± 5.48 0.007 EqCO2max 34.10 ± 6.93 30.93 ± 5.86 31.87 ± 6.32 0.028 HRR1 (beats/min) 14.78 ± 7.66 19.28 ± 9.66 17.95 ± 9.30 0.034 Note. Data are presented as mean ± standard deviation. Data were compared using the t-test. Bold numbers indicate a significant difference (P < 0.05) between the two groups. Abbreviations: AT, anaerobic threshold; WR, work rate; V̇O2, oxygen uptake; V̇O2/kg, oxygen uptake per kilogram; HR, heart rate; SBP, systolic blood pressure; DBP, diastolic blood pressure; V̇E, minute ventilation; BR, breathing reserve; EqCO2, ventilatory equivalent for carbon dioxide; HRR1, heart rate recovery after 1 min of rest. Table 3. Differences in the CPET parameters between Group 1 (O2Pmax < 80% predicted) and Group N (O2Pmax ≥ 80% predicted)
-
Table 4 shows the CAT, mMRC, Borg CR10 scale, and SGRQ scores. The Borg CR10 scale, SGRQ total, SGRQ symptom, and SGRQ activity scores were significantly higher in Group 1 than those in Group N (P < 0.05).
Item Group 1 (n = 27) Group N (n = 64) All (n = 91) P-value CAT (points) 12.50 ± 5.32 9.79 ± 4.01 10.79 ± 4.66 0.084 mMRC (points) 1.71 ± 0.73 1.29 ± 0.76 1.45 ± 0.76 0.099 Borg CR10 (points) 2.64 ± 1.21 1.56 ± 1.45 1.96 ± 1.45 0.025 SGRQ, total (points) 41.78 ± 12.46 25.61 ± 17.15 33.31 ± 16.89 0.024 SGRQ, symptom (points) 54.30 ± 19.34 29.47 ± 17.51 41.29 ± 21.98 0.006 SGRQ, activity (points) 55.89 ± 11.11 35.65 ± 25.67 45.29 ± 22.19 0.032 SGRQ, impact (points) 33.57 ± 15.99 19.66 ± 15.12 26.28 ± 16.73 0.055 Note. Data are presented as mean ± standard deviation. Data were compared using the t-test. Bold numbers indicate a significant difference (P < 0.05) between the two groups. The CAT, mMRC, and SGRQ were evaluated before CPET; the Borg CR10 was evaluated immediately after CPET. Abbreviations: CAT, COPD Assessment Test; mMRC, modified Medical Research Council scale; Borg CR10, Borg’s 10-point category-ratio scale; SGRQ, St. George’s Respiratory Questionnaire. Table 4. Differences in the dyspnea scores between Group 1 (O2Pmax < 80% predicted) and Group N (O2Pmax ≥ 80% predicted)
-
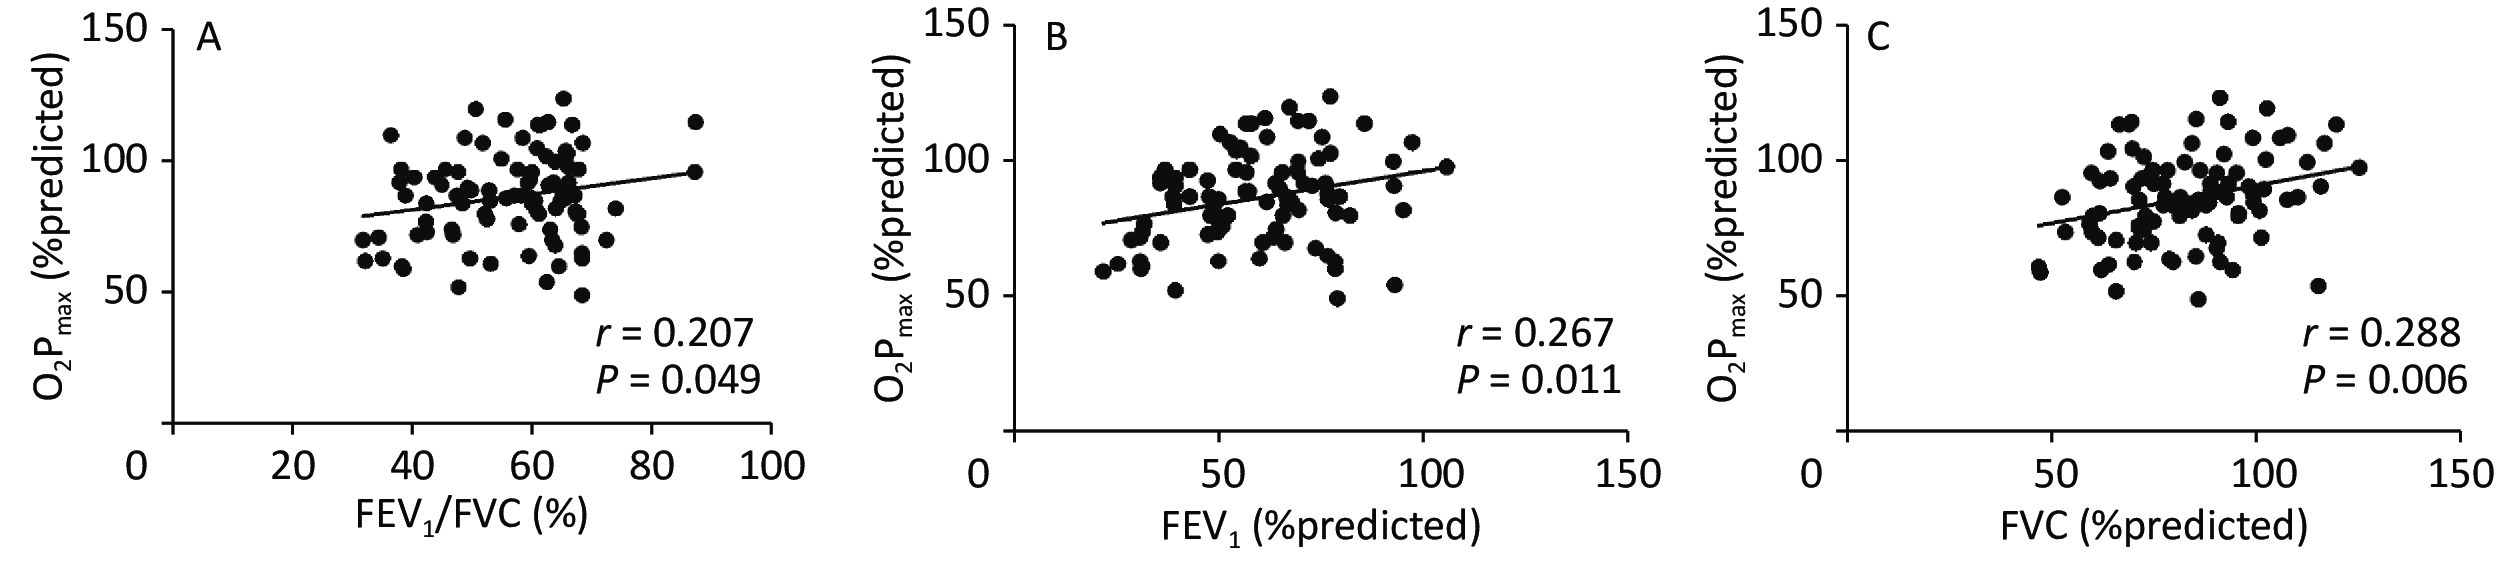
Figure 1 shows the correlation coefficients between O2Pmax and FEV1/FVC%, FEV1%, and FVC%, which were regarded as lung ventilation function variables. O2Pmax was slightly but significantly correlated with FEV1/FVC% (r = 0.207, P < 0.05), FEV1% (r = 0.267, P < 0.05), and FVC% (r = 0.288, P < 0.01).
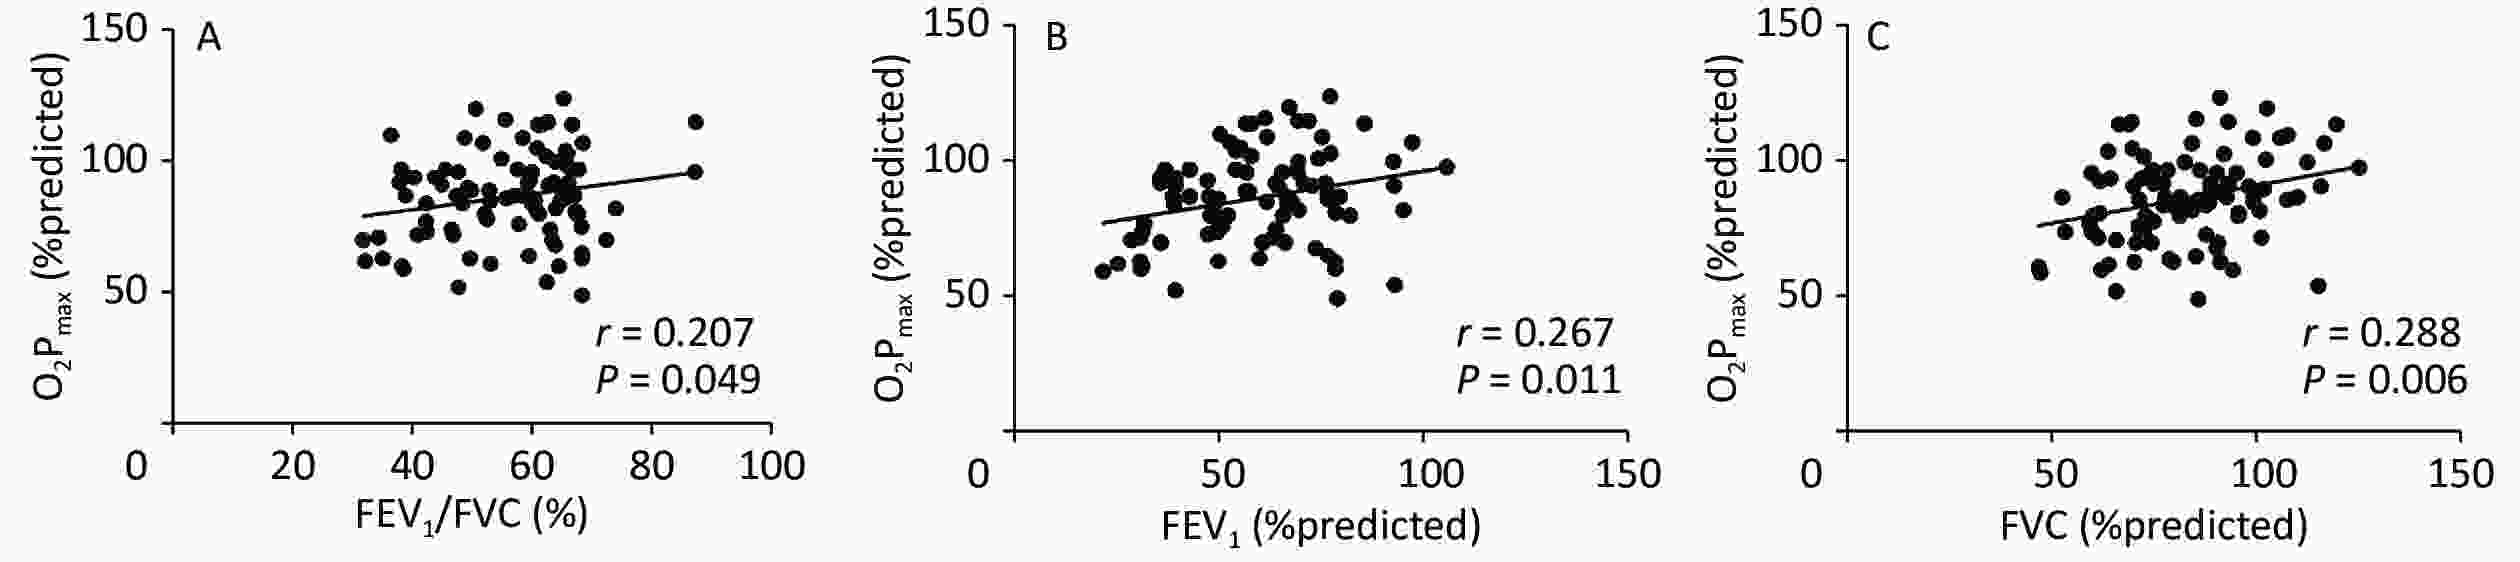
Figure 1. Correlations between O2Pmax and FEV1/FVC%, FEV1%, and FVC%. Abbreviations: O2P, oxygen pulse; FEV1, forced expiratory volume in 1 sec; FVC, forced vital capacity.
-
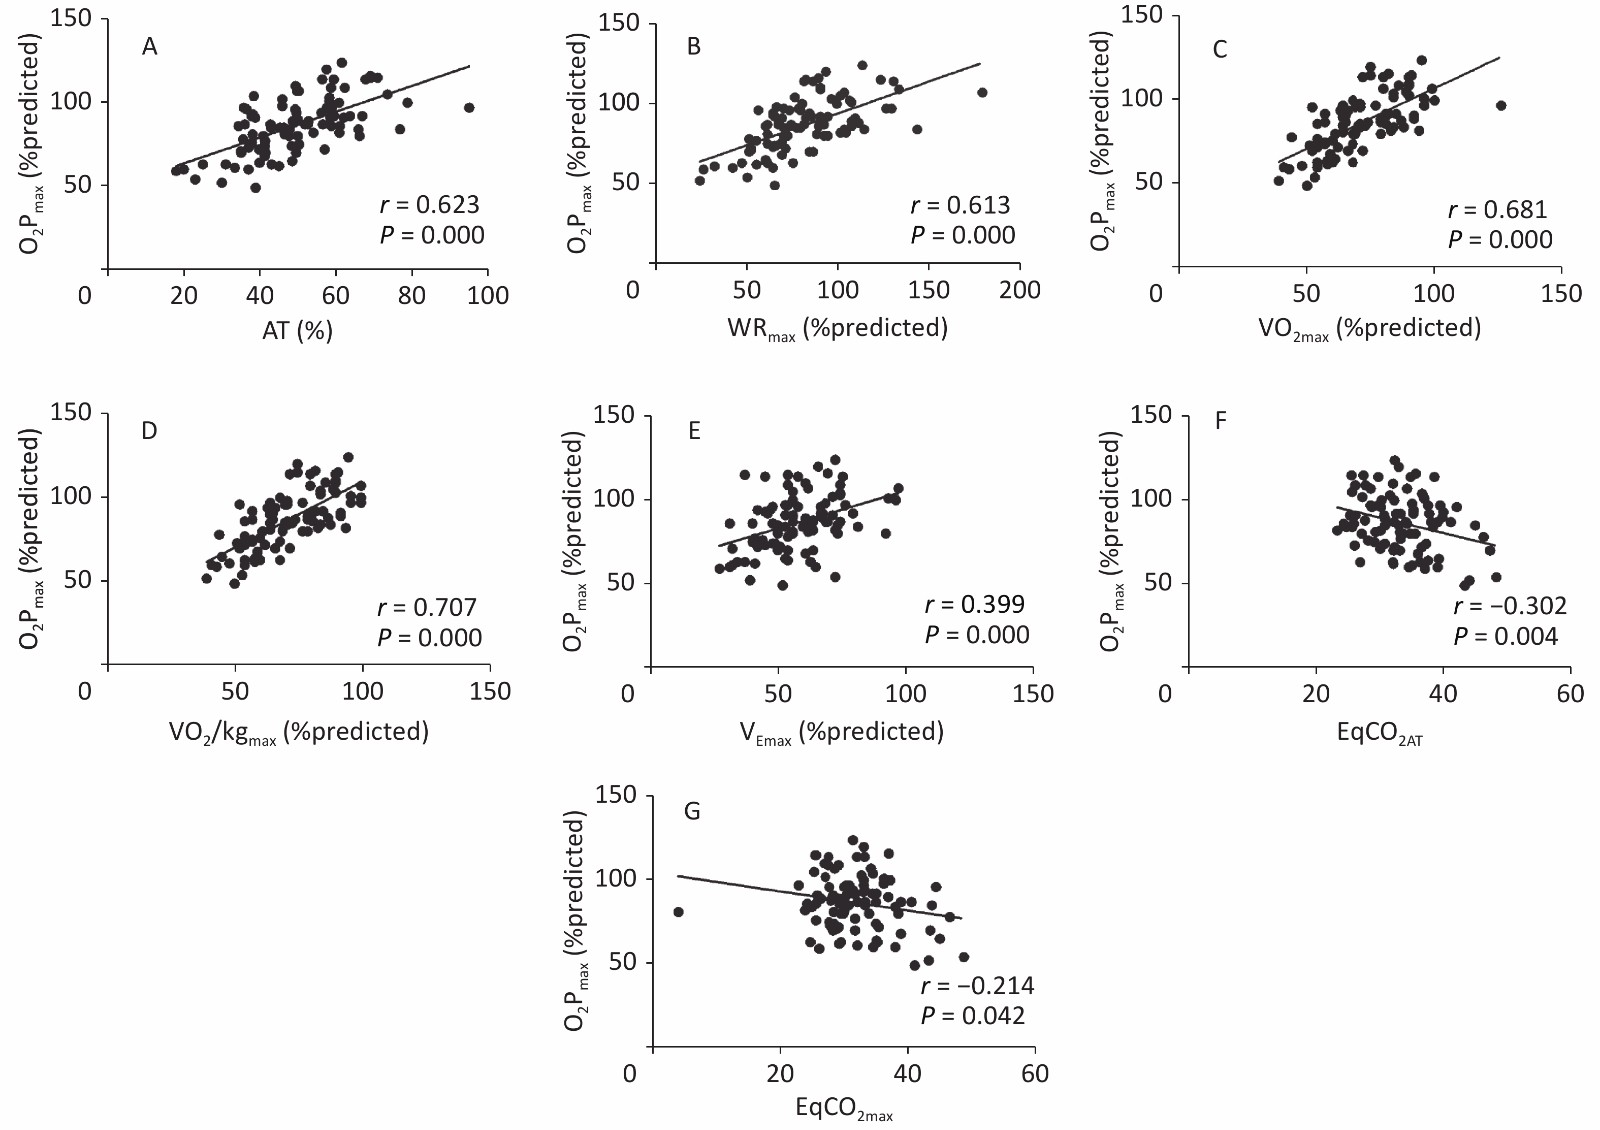
Figure 2 shows the correlation coefficients between O2Pmax and the CPET variables. O2Pmax was positively correlated with AT (r = 0.623, P < 0.001), WR% (r = 0.613, P < 0.001), V̇O2max% (r = 0.681, P < 0.001), V̇O2/kgmax% (r = 0.707, P < 0.001), and V̇Emax% (r = 0.399, P < 0.001), but negatively correlated with EqCO2AT (r = −0.302, P < 0.01) and EqCO2max (r = −0.214, P < 0.05).

Figure 2. Correlations between O2Pmax and the CPET parameters Abbreviations: O2P, oxygen pulse; AT, anaerobic threshold; WR, work rate; V̇O2, oxygen uptake; V̇O2/kg, oxygen uptake per kilogram; V̇E, minute ventilation; EqCO2, ventilatory equivalent for carbon dioxide.
-
Table 5 shows that FVC%, FEV1%, O2Pmax%, WRmax, and V̇O2max were significantly lower in the AE2 group than in the AE1 group (P < 0.05).
Item AE1 group (n = 30) AE2 group (n = 27) P-value Age (Years) 63.73 ± 8.09 64.30 ± 6.92 0.780 Weight (kg) 69.00 ± 8.60 70.48 ± 13.83 0.625 Smoke (numbers) 27.50 (40.75) 15.00 (30.00) 0.257 Male/Female (n) 25/5 23/4 0.261 FVC (% predicted) 87.08 ± 16.94 76.84 ± 13.88 0.016 FEV1 (% predicted) 63.52 ± 16.25 51.52 ± 17.78 0.010 FEV1/FVC (%) 57.44 ± 9.26 52.12 ± 13.13 0.080 O2Pmax (% predicted) 93.23 ± 13.10 79.93 ± 15.41 0.001 WRmax (watts) 101.70 ± 21.63 80.48 ± 24.66 0.001 V̇O2max (mL/min) 1350.23 ± 230.16 1141.15 ± 279.00 0.003 Note. Data are presented as mean ± standard deviation, median (IQR), or number. Sex was compared using the chi-square test, smoke was compared using the Mann-Whitney test, and the remaining data were compared using the t-test. Bold numbers indicate a significant difference (P < 0.05) between the two groups. Abbreviations: AE, acute exacerbation; FVC, forced vital capacity; FEV1, forced expiratory volume in 1 s; O2P, oxygen pulse; WR, work rate; V̇O2, oxygen uptake. Table 5. Characteristics, pulmonary function, and CPET data of the patients with COPD grouped in acute exacerbation
-
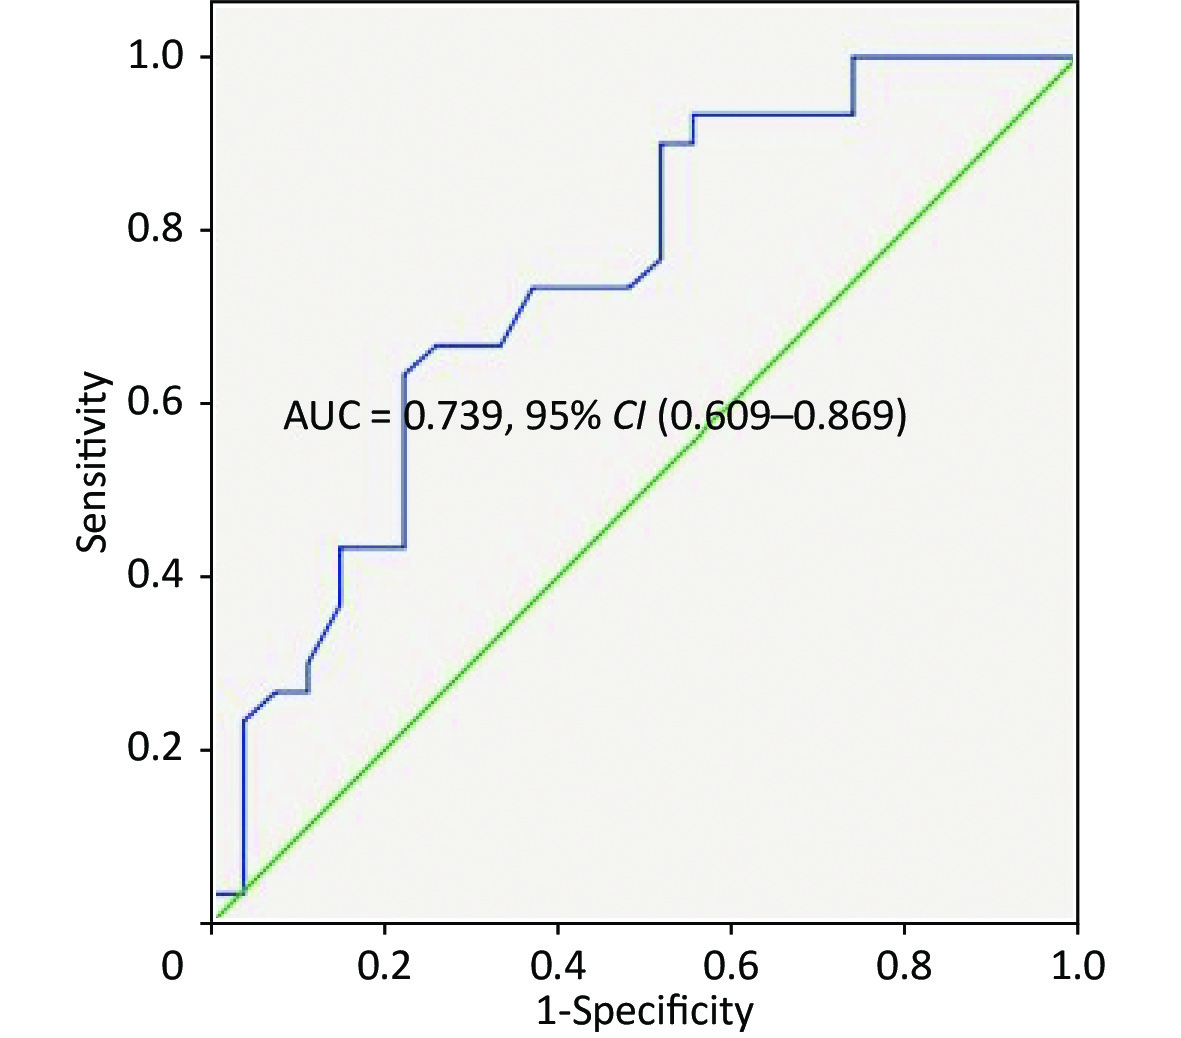
The univariate logistic regression confirmed that O2Pmax was an independent predictor of AECOPD [odds ratio (OR), 1.068; 95% CI, 1.023–1.116; P = 0.003]. Five variables (FVC%, FEV1%, O2Pmax, WRmax, and V̇O2max) were used to build a logistic regression model to predict AECOPD in a multivariate analysis (Tables 6-7). Only O2Pmax was a predictor of AECOPD (OR = 1.062, 95% CI = 1.012–1.114, P = 0.015). ROC curve analysis was applied to categorize the optimal cut-off value of O2Pmax for exacerbation (Figure 3). The AUC was 0.739 (95% CI = 0.609–0.869, P = 0.002). The cut-off value was 89.5%, with a sensitivity of 63.30% and a specificity of 77.80%.
Item β P-value OR 95% CI FVC (% predicted) 0.012 0.724 1.012 (0.949–1.078) FEV1 (% predicted) 0.004 0.898 1.004 (0.946–1.065) O2Pmax (% predicted) 0.060 0.015 1.062 (1.012–1.114) WRmax (watts) 0.052 0.215 1.053 (0.970–1.143) V̇O2max (mL/min) –0.002 0.608 0.998 (0.992–1.005) Note. Only O2Pmax had a predictive effect for AECOPD (OR = 1.062, 95% CI = 1.012–1.114, P = 0.015). Bold numbers indicate a significant difference (P < 0.05). Abbreviations: FVC, forced vital capacity; FEV1, forced expiratory volume in 1 s; O2P, oxygen pulse; WR, work rate; V̇O2, oxygen uptake; OR, odds ratio; CI, confidence interval. Table 6. Multivariate logistic regression analysis of lung function and the CPET data in patients with AECOPD
Item β P-value OR 95% CI O2Pmax (% predicted) 0.066 0.003 1.068 (1.023–1.116) Note. O2Pmax was a predictor of AECOPD (OR = 1,068, 95% CI = 1.023–1.116, P = 0.003). The bold number indicates a significant difference (P < 0.05) between the two groups. Abbreviations: OR, odds ratio; CI, confidence interval. Table 7. Univariate logistic regression analysis of O2Pmax in patients with AECOPD
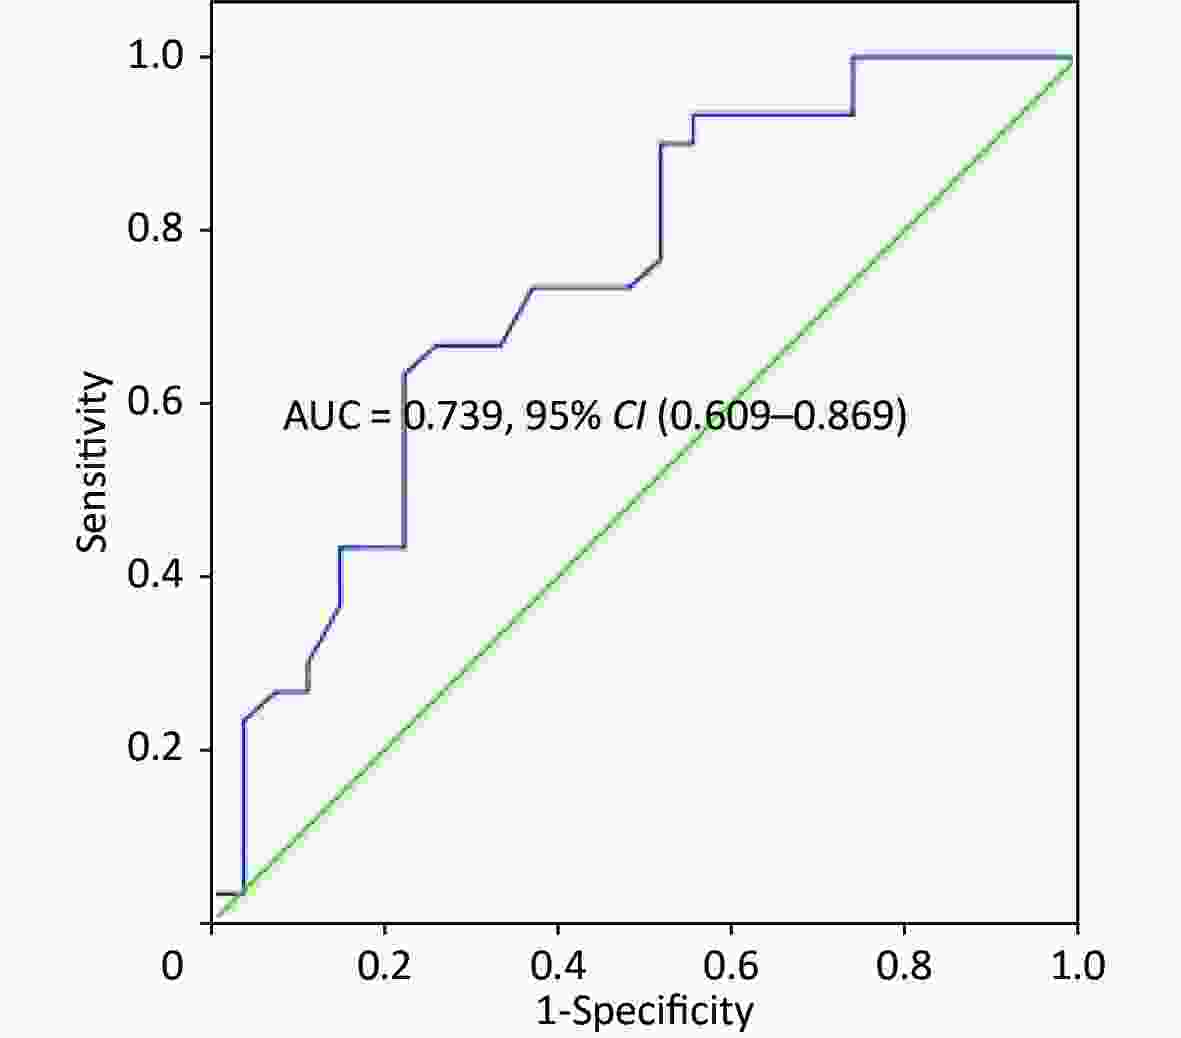
Figure 3. ROC curve of O2Pmax as an overall predictor of AECOPD. Abbreviations: AUC, area under the ROC curve; CI, confidence interval.
-
The main finding of the present study was that impaired O2Pmax in patients with COPD indicated an impaired ventilatory condition, gas exchange efficiency, exercise capacity, and HRQL. The correlation analysis showed that O2Pmax was correlated with FEV1/FVC%, FEV1%, FVC%, WR, AT, V̇O2, V̇O2/kg, V̇E, and EqCO2. Moreover, O2Pmax was significantly different between the AE2 and AE1 groups, which was a new finding. The univariate and multivariate logistic regression analyses demonstrated for the first time that O2Pmax predicted AECOPD (OR 1.068, 95% CI = 1.023–1.116). The optimal O2Pmax cut-off value was 89.5%. The AUC was 0.739 (0.609–0.869) with a sensitivity of 0.633 and a specificity of 0.778.
V̇O2 represents metabolic efficiency, and WR represents exercise capacity. The AT represents a transition point from aerobic to anaerobic metabolism, and a lower AT indicates reduced oxygen delivery to muscle cells. Declines in AT%, WR, and V̇O2 contribute to exercise intolerance [18]. The present study indicated that AT, WR%, V̇O2%, V̇O2/kg%, and V̇E% were lower in Group 2 than those in Group 1 (impaired O2Pmax group). This finding suggests that O2Pmax might be an effective indicator for estimating exercise capacity. Patients with COPD develop dynamic hyperinflation during exercise. Dynamic hyperinflation can reduce left ventricular stroke volume secondary to the increased intrathoracic pressure, which, in turn, decreases preload by reducing venous return and the volume of the left ventricle. This explains why O2Pmax is impaired in patients with COPD. Hyperinflation leads to limited cardiac performance, which occurs when there is a mechanical limitation to an increase in V̇E. Therefore, dynamic hyperinflation in patients with COPD may adversely affect exercise tolerance by reducing O2Pmax. Moreover, lung hyperinflation impairs cardiopulmonary interactions and leads to impaired muscle oxygen availability during exercise. Research has also shown that impaired circulation is not usually a limiting factor for exercise intolerance in patients with COPD [6]. Thus, O2Pmax may be a predictor of exercise capacity independent of cardiovascular function. The present study also demonstrated that O2Pmax was highly positively correlated with AT, WR%, V̇O2max%, and V̇O2/kg%. Montes de Oca et al.[16] showed that inspiratory intrathoracic pressure has a direct relationship with O2P at peak exercise in patients with severe COPD. Torres-Castro et al. [19] reported that V̇O2peak and Wmax decrease in patients with COPD and pulmonary hypertension, in line with the decrease in O2P. An inadequate increase in stroke volume may contribute to the inability of V̇O2 to increase. These results explain why V̇O2 was positively correlated with O2Pmax. WR and O2Pmax represent exercise capacity; thus, it is easy to understand why O2Pmax was positive correlated with WR. In addition, the circulatory system is responsible for oxygen delivery. When the metabolic demands begin to exceed oxygen delivery to contracting muscles, anaerobic metabolism begins. The AT is the exercise level that reflects the metabolic condition of anaerobic glycolysis [20]. A lower AT is observed if a patient’s oxygen consumption efficiency is poor. The AT reflects oxygen consumption efficiency, and circulatory function can be used to determine the AT. This explains why O2Pmax was associated with the AT in our study.
The present study also illustrated that O2Pmax can be used to assess a ventilation obstruction. FVC%, VC%, FEV1%, FEV1/FVC%, V̇E%, and BRAT were lower, and EqCO2AT and EqCO2max were higher in patients with impaired O2Pmax than in those without impaired O2Pmax. Additionally, O2Pmax was negatively correlated with EqCO2AT, and EqCO2max was positively correlated with FEV1/FVC%, FEV1%, FVC%, and V̇Emax%. Our data corroborate the findings of Frazão et al. [21], who reported that the ability to increase V̇E during aerobic exercise is impaired in patients with COPD because exhalation may not be completed prior to the onset of the next breath, causing an increase in operational lung volume and progressive air retention. EqCO2 is a measure of ventilatory efficiency and is calculated as V̇E divided by V̇CO2. EqCO2 symbolizes the capacity to remove carbon dioxide. In patients with COPD who develop impaired O2Pmax, these higher EqCO2 values may be explained by disproportional reductions in V̇E and perfusion. The decrease in ventilation and perfusion are different [21], and perfusion may have a higher degree of reduction in patients with impaired O2Pmax. The correlations between V̇Emax%, EqCO2AT, EqCO2max, and O2Pmax can be explained by the fact that airflow limitation impairs cardiac function [21]. The increase in inspiratory intrathoracic pressure decreases lung elastic recoil pressure. The combined effects of decreased lung elastic recoil pressure and increased airway resistance result in reduced V̇E and the development of hyperinflation [21]. Improvement in ventilatory mechanics results in improved cardiac function, which manifests as a decrease in HR with improved O2P [22]. Lung hyperinflation also causes mechanical constraints on the heart and a reduction in preload [23]. These interactions between hyperinflation, ventilation and cardiac function may explain why O2Pmax was positively correlated with V̇Emax%. EqCO2 was negatively correlated with V̇E, and O2Pmax was negatively correlated with EqCO2.
The positive correlations between FEV1/FVC%, FEV1%, FVC%, and O2Pmax can be explained by the fact that the decreases in FEV1/FVC%, FEV1%, and FVC% contribute to lung hyperinflation, which, in turn, reduces left ventricular stroke volume. Furthermore, O2P is negatively correlated with lung hyperinflation [24], and lung hyperinflation is negatively correlated with FEV1 [25]. In addition, Silvestre et al. [26] suggested that the association between lung function and exercise capacity may be related to specific abnormalities in cardiopulmonary performance. All of these findings support the relationships between FEV1/FVC%, FEV1%, FVC%, and O2Pmax. BR reflects the respiratory reserve capacity during extreme exercise, and a lower BR is the main feature of ventilation limitation in patients with pulmonary disease. It is calculated as the maximum ventilatory volume minus V̇E. BR decreases in patients with COPD but increases in those with cardiovascular disease. The present study showed that BR decreased in patients with impaired O2Pmax, whereas no correlation was detected between BR and O2Pmax. This finding could indicate that the decreased O2Pmax in patients with COPD is not only caused by reduced filling of the ventricles but may also be attributable to other mechanisms.
HRR is a marker of cardiac autonomic function independent of the workload and the change in HR during exercise. A low HRR is a common finding in patients with impaired lung function and is associated with decreased survival in patients with COPD [27]. In these patients, autonomic nervous dysfunction contributes to the increased work of breathing, which promotes a wider airway caliber [27]. HRR1 is defined as the decrease from peak HR to 1 min of recovery and is an independent predictor of morbidity and all-cause mortality [28]. To our knowledge, no study has explored the correlation between HRR1 and O2P in patients with COPD until now. Our present results indicate that HRR1 decreased significantly in patients with impaired O2Pmax. This may be attributed to the fact that both parameters are regulated by the autonomic nervous system, and an increase in sympathetic tone and/or a decrease in parasympathetic tone may reduce HRR1 and contribute to tachyarrhythmia.
COPD is largely characterized by breathlessness. The mMRC is considered adequate for assessing breathlessness symptoms. However, COPD affects patients beyond dyspnea. The SGRQ is the most comprehensive disease-specific health status questionnaire. The CAT is simpler. The Borg CR10 scale is mainly used to evaluate dyspnea and leg muscle fatigue during maximum exercise [29]. Because our patients had instruments in their mouths and could not conveniently answer questions during exercise, we evaluated the patients using the Borg CR10 scale at the end of the exercise. As a result, the Borg CR10 scale score and the SGRQ symptom, activity, and total scores were higher in the O2Pmax impaired group than those in the other groups. Souza et al. [30] showed that patients with COPD who had lower activities of daily living exhibit lower O2P, which may reflect the presence of a limiting cardiac component. Lan et al. [31] indicated that the increased O2Pmax is accompanied by improvements in the SGRQ. Therefore, O2Pmax is a valid indicator of HRQL and should be measured in patients with COPD. This may be attributed to the increase in right ventricular afterload during exercise, impairing stroke volume, which was augmented by increased intrathoracic pressure swings and is related to O2Pmax [32].
AECOPD is associated with an increased risk of death [33]. It is defined as an acute worsening of respiratory symptoms that results in additional therapy [34]. AECOPD is classified as mild (treated with short-acting bronchodilators only), moderate (treated with short-acting bronchodilators plus antibiotics and/or oral corticosteroids), or severe (requires hospitalization or an emergency room visit). No effective indicator has been established to predict AECOPD. History of earlier AECOPD may be a predictor of frequent exacerbations [35]. Deteriorating airflow limitation is associated with an increasing prevalence of exacerbations [2], but FEV1 lacks sufficient precision to be used clinically as a predictor of exacerbations or mortality in patients with COPD[36]. A novelty of our study is that O2Pmax was an effective predictor of AECOPD, and, to the best of our knowledge, this is the first study to identify the O2Pmax cut-off value for predicting AECOPD. Wu et al. [37] reported that patients with impaired peak O2P were hospitalized more frequently during a 1-year follow-up. In the present study, the O2Pmax decreased in the AE2 group. Multivariate and univariate logistic regression analyses showed that O2Pmax predicted AECOPD. We used a ROC curve to determine the best cut-off value of O2Pmax for AECOPD (89.5%). The AUC was 0.739 (0.609–0.869) with a sensitivity of 0.633 and a specificity of 0.778. Our findings indicate moderate accuracy of O2Pmax for predicting AECOPD. Further research is needed to validate whether O2Pmax, in combination with other parameters, would increase the accuracy of prediction. Nevertheless, it is important to inform patients of the high risk of acute exacerbations once the CPET reveals an impaired O2Pmax value (< 89.5%). Doctors should choose higher-level treatment strategies for these patients.
Why lower O2Pmax is associated with more frequent AECOPD is not entirely clear. To our knowledge, progressive respiratory failure, cardiovascular disease, and other diseases are the primary cause of death in patients with COPD hospitalized for an exacerbation [36]. In addition, deteriorating airflow limitation is associated with an increasing prevalence of exacerbations [2]. Hyperinflation and gas trapping increase with the reduced expiratory flow during exacerbations [11]. Therefore, the association between impaired O2Pmax and AECOPD may be related to hyperinflation, which can be caused by airflow limitation and is associated with poor cardiac function. A larger scale study is needed to validate the role of O2Pmax in the risk of AECOPD.
This study had several limitations. First, this was a retrospective study, and not all of the patients finished the 3-year follow-up for AECOPD. Additionally, the sample size was small. Second, O2Pmax is an effective indicator of cardiac function and muscle function, but the echocardiographic parameters and stroke volume were not tested. Third, we did not measure dynamic lung hyperinflation parameters, such as the end-expiratory lung volume, inspiratory capacity, or RV using CPET. Thus, the evidence indicating that O2Pmax is related to dynamic lung hyperinflation is insufficient. Fourth, because not all of the enrolled patients underwent hemoglobin concentration and blood gas analyses, we did not consider these factors in the analysis. Hemoglobin is very important for oxygen carrying capacity, and blood gas values reflect disease severity to some extent. Nevertheless, our current study found that an indicator can play a role in the assessment of COPD severity and prognosis.
-
This present study illustrated that impaired O2Pmax indicates impairments in exercise capacity, ventilatory condition, gas exchange efficiency, and HRQL. The most important finding was that O2Pmax was an independent predictor of AECOPD. This is the first study to identify the O2Pmax cut-off value.
Effect of Maximal Oxygen Pulse on Patients with Chronic Obstructive Pulmonary Disease
doi: 10.3967/bes2022.107
Funds:
This study was supported by the National Natural Science Foundation of China [No. 82000043]; Key Clinical Specialty Construction Program of Beijing (2020-2022); and Beijing Hospitals Authority Youth Program [No. QML20180107]
- Received Date: 2022-05-08
- Accepted Date: 2022-08-03
-
Key words:
- Oxygen pulse /
- Chronic obstructive pulmonary disease /
- Cardiopulmonary exercise test /
- Acute exacerbation
Abstract:
The authors declare that they have no competing interests.
| Citation: | LI Yun Xiao, WANG Jun, WU Bo, LIN Fang, TAN Chun Ting, YU Gang Gang, NIE Shan, ZHAO Ran Ran, XU Bo. Effect of Maximal Oxygen Pulse on Patients with Chronic Obstructive Pulmonary Disease[J]. Biomedical and Environmental Sciences, 2022, 35(9): 830-841. doi: 10.3967/bes2022.107

|

 Quick Links
 DownLoad: