


-
Arterial stiffness, a key factor in vascular aging, has been shown to be associated with micro- and macro-vascular complications, and is an independent predictor of cardiovascular outcomes and mortality[1]. Generally, among different methodologies to assess arterial stiffness, pulse wave velocity (PWV) is considered to be the simplest, most reproducible, and non-invasive measurement, as assessed by measuring the time required for the pulse wave to propagate a given distance along the blood vessel[2, 3]. Epidemiologic studies have demonstrated that carotid-femoral PWV (cfPWV) and brachial-ankle PWV (baPWV) have predictive value for cardiovascular outcomes and all-cause mortality in different populations[4–8]. Indeed, the cfPWV was considered the gold standard for measuring arterial stiffness and targeting organ damage by the 2018 ESC/ESH Guidelines for the management of arterial hypertension[9]. Nevertheless, considering the requirement for expensive devices, trained staff, and lack of a standardized method, the widespread application of cfPWV and baPWV in clinical practice is limited[10,11]. Thus, equations for evaluating the estimated PWV (ePWV), including age and the mean blood pressure (MBP), for both healthy populations and those with cardiovascular risk factors have been developed[12, 13]. This estimated index of the PWV not only compensates for the inconvenience of device requirement and strict measurement conditions, but also revealed the potentially complex interactions between age and BP in consideration of its prognostic value for cardiovascular disease (CVD) outcomes independent of traditional risk scores, and even the cfPWV[12].
Previous studies have shown significant associations between increased ePWV and cardiovascular outcomes[14–18]. Moreover, some studies have demonstrated that the risk of all-cause mortality increases as the ePWV increases[14, 19,20]; however, evidence in community-based general populations remains extremely limited, especially in Chinese populations[15]. Considering the feasibility of reducing arterial stiffness via treatment or intervention, early detection of populations with higher ePWV levels and control of ePWV progression are necessary to mitigate worsening arterial stiffness and reduce the risk of death[21–23]. Several studies have provided evidence that progression of the measured PWV is associated with mortality, which was entirely focused on patients, such as patients undergoing hemodialysis therapy, and patients with end-stage renal failure, resistant hypertension, and diabetes[24–27]. The association between changes in ePWV and all-cause mortality in the general population has not been determined, and no relevant studies have been conducted involving Chinese populations.
Thus, using large-scale data from the China Health and Retirement Longitudinal Study (CHARLS), the aims of this study were as follows: 1) determine the association between ePWV and all-cause mortality in middle-aged and elderly Chinese (ePWV analysis); and 2) determine the association between changes in the ePWV with the corresponding all-cause mortality in middle-aged and elderly Chinese (ΔePWV analysis).
-
This study was based on the data set of the CHARLS. Details of the study design have been reported elsewhere[28]. Briefly, the baseline survey was conducted in 2011 involving 17,708 participants who were recruited using the multistage, stratified probability-proportional-to-size sampling (PPS) strategy. The response rate was 80.5%. The CHARLS survey included face-to-face comprehensive questionnaire interviews, physical examinations, and metabolic testing. The participants had follow-up evaluations in 2013 (wave 2), 2015 (wave 3), and 2018 (wave 4). The CHARLS study was approved by the Biomedical Ethics Review Committee of Peking University. Written informed consent was obtained from all participants.
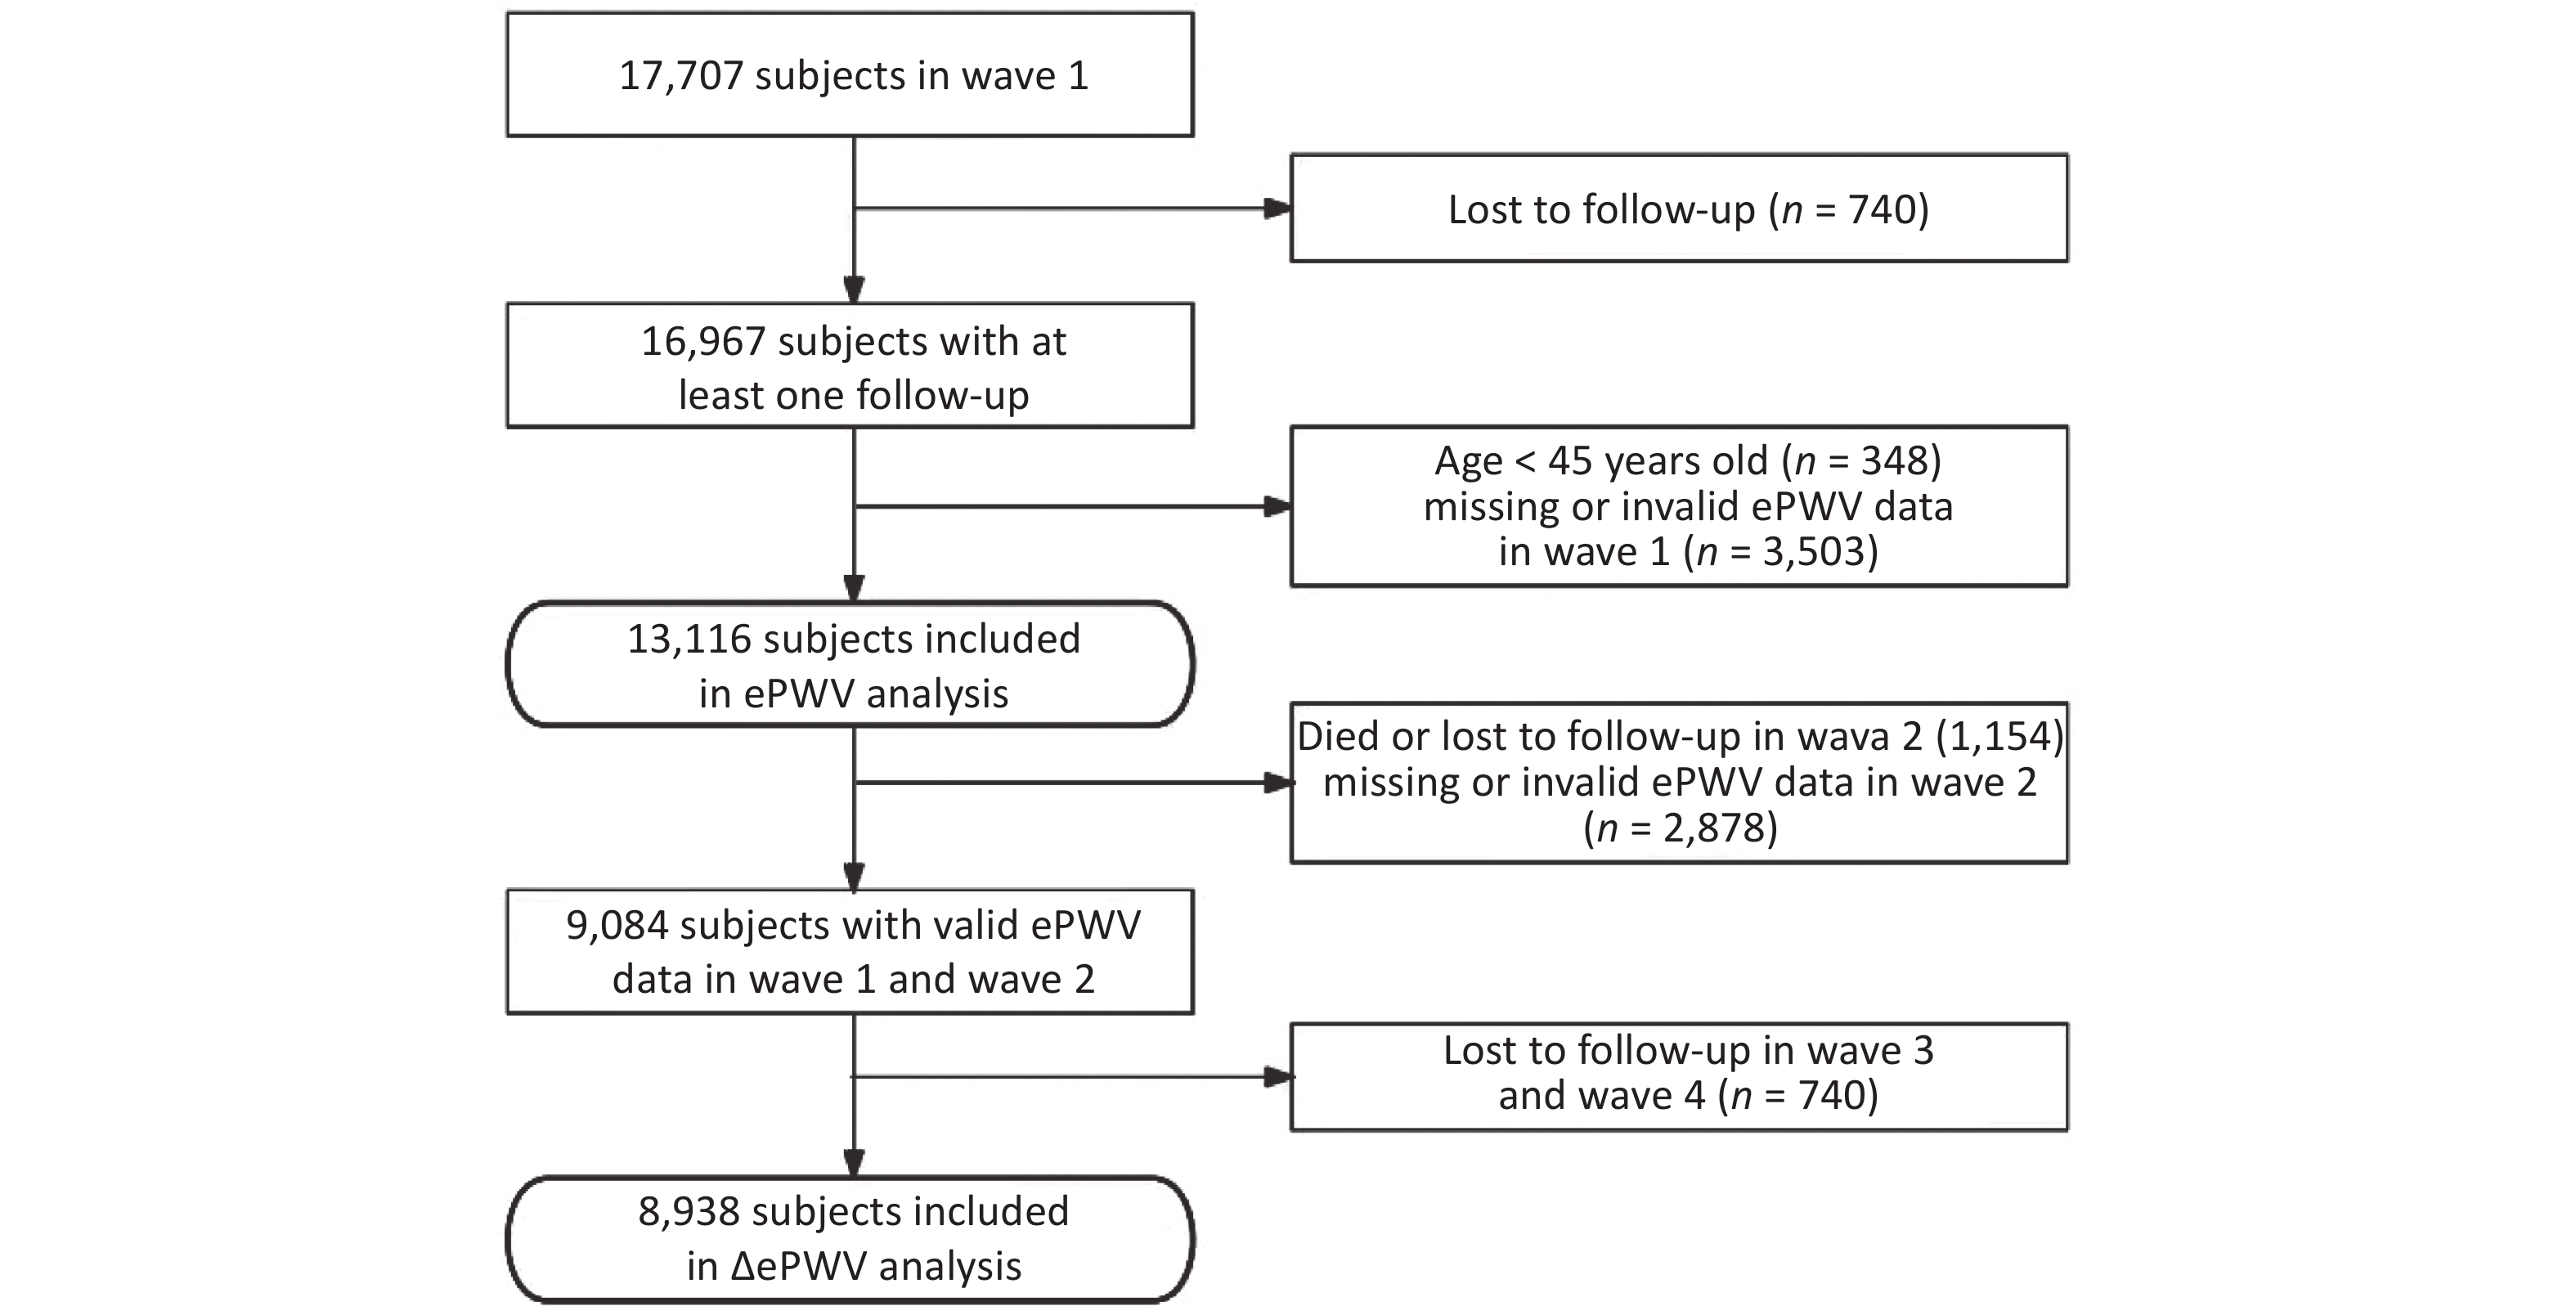
The inclusion criteria for participants undergoing ePWV analysis in this study were as follows: 1) at least one follow-up evaluation; 2) ≥ 45 years of age; and 3) valid ePWV data in wave 1. Of note, missing ePWV data were considered if age or BP values were missing. A diastolic blood pressure (DBP) > 280 mmHg invalidated ePWV data. Of the 13,116 subjects included in the ePWV analysis, after excluding 1,154 participants who died or were lost to follow-up in wave 2, the 2,878 participants without valid ePWV data in wave 2, and the 740 participants lost to follow-up since 2015, a total of 8,938 participants were included in the final ΔePWV analysis. The flow of the inclusion and exclusion criteria is shown in Figure 1.

Figure 1. Flowchart of inclusion and exclusion criteria of the study. ePWV: Estimated pulse wave velocity. ΔePWV was defined as the difference of ePWV between wave 2 and wave 1.
-
During waves 1 and 2, BP was measured three times in a sitting, relaxed, and quiet state by electronic sphygmomanometer (Omron HEM-7200); the average systolic blood pressure (SBP) and DBP were used. The calculation of ePWV adopted the equation described by Greve et al.[12], which was derived by the Reference Values for Arterial Stiffness’ Collaboration[13]. For participants who presented with cardiovascular risk factors (smoking, hypertension, dyslipidemia, or diabetes), the following equation was used: ePWV = 9.587 − 0.402 × age + 4.560 × 10⁻³ × age2 − 2.621 × 10⁻⁵ × age2 × MBP + 3.176 × 10⁻³ × age × MBP − 1.832 × 10⁻² × MBP. For participants without any cardiovascular risk factor, the following equation was used: ePWV = 4.62 − 0.13 × age + 0.0018 × age2 + 0.0006 × age × MBP + 0.0284 × MBP. MBP was calculated as follows: DBP + 0.4 (SBP − DBP). For ePWV analysis, we classified participants into four groups based on the ePWV quartile.
ΔePWV was defined as the difference in ePWV between waves 2 and 1 with a median 2.0-year interval,i.e., ΔePWV = ePWV2 − ePWV1. For ΔePWV analysis, participants were categorized into four groups based on the ΔePWV quartile.
-
The outcome of interest in the current study was all-cause mortality, which was confirmed by family members via death registration certificates. We considered the death information obtained by verbal autopsy questionnaire in CHARLS as all-cause mortality. The exact time of death time in wave 2 was recorded. Thus, the interval between the time of the baseline survey (wave 1) and the exact death date was considered as the survival time. In waves 3 and 4, however, only interview status (dead or alive) was recorded, and the survival time was calculated from the time of wave 1 to the median of two follow-up times (the wave with information of death and the last follow-up wave)[29]. For those who did not die during the study, the follow-up period was calculated from wave 1 to the latest interview. Compared with the ePWV analysis mentioned above, the starting point of the survival time calculation was replaced with the interview time of wave 2 in the ΔePWV analysis.
-
The standardized questionnaires in CHARLS contained information on demographic characteristics, lifestyle factors, health status, and functioning. Except for illiteracy, participants were defined as having received formal education. Smoking status was classified into non-smokers (never) and smokers (ever). We categorized drinking status as never, past, or current. Weight and height were measured using a standardized protocol, and body mass index (BMI) was calculated as the weight in kilograms divided by the height in meters squared. Blood test was also conducted among participants, including total cholesterol, triglycerides, high-density lipoprotein cholesterol (HDL-C), low-density lipoprotein cholesterol (LDL-C), hemoglobin A1c (HbA1c), and fasting plasma glucose (FPG). A history of chronic disease (hypertension, dyslipidemia, diabetes, and cancer) was defined via the combination of self-reported disease diagnosed by physicians, use of medications for related diseases, and physical and biochemical examinations. Hypertension was defined as self-reported, physician-diagnosed hypertension, and/or current use of antihypertensive drugs, and/or a SBP ≥ 140 mmHg and/or a DBP ≥ 90 mmHg. Of note, hypertensive participants who received antihypertensive treatment were considered as treated subjects, and others were untreated patients in subgroup analyses. Dyslipidemia was defined as a self-reported history of physician-diagnosed dyslipidemia, and/or any treatment to control blood lipid levels, and/or a total cholesterol level ≥ 240 mg/dL, and/or a triglycerides level > 200 mg/dL, and/or an LDL-C concentration > 160 mg/dL, and/or an HDL-C concentration < 40 mg/dL[30]. Diabetes was defined as self-reported, physician-diagnosed diabetes and/or any treatment to control diabetes, and/or a FPG ≥ 126 mg/dL and/or an HbA1c concentration ≥ 6.5%[31]. The definition of cancer was based on self-reported, physician-diagnosed cancer and/or any use of treatment. A history of CVD was defined as a self-reported, physician-diagnosed myocardial infarction, coronary heart disease, angina, congestive heart failure, stroke, or other heart problems.
-
Baseline characteristics are shown according to the ePWV classification. The characteristics of the study population according to ΔePWV quartile groups are also presented. Normally-distributed continuous variables are expressed as the mean ± standard deviation (SD), and non-normally distributed continuous variables as the median with interquartile range (25%–75%). Categorical variables are expressed as a frequency with percentages. Missing data were imputed with multiple imputation using the Markov-chain Monte Carlo (MCMC) method in SAS by the MI procedure with an average of 5 replications. Incidence rates per 1,000 person-years were calculated by ePWV or ΔePWV categories. Because the proportional hazards assumption had proved to be true with Schoenfeld residuals, we used the Cox proportional hazards regression model to determine the association between ePWV or ΔePWV with all-cause mortality. ePWV or ΔePWV in Cox regression models was included as a categorical variable based on quartile groups (the first quartile group as the reference group) or continuous variable (per SD increase). P values for trend were evaluated, including the median of each category of ePWV or ΔePWV as a continuous variable in the model[32]. We displayed the results of the crude and adjusted models, which were adjusted for gender, smoking status, alcohol consumption status, histories of hypertension, dyslipidemia, diabetes, CVD and cancer, and BMI at baseline in the ePWV analysis. The adjusted model of the ΔePWV analysis was adjusted for the aforementioned covariates using wave 2 data, as well as baseline ePWV.
We also carried out subgroup analyses according to demographic and lifestyle characteristics as well as a history of chronic diseases: age ( ≥ 60 or < 60 years of age); gender (male or female); marital status (married or other); education level (formal education or no formal education); smoking status (never or ever); alcohol consumption status (never, past, or current); a history of hypertension (yes for treated, yes for untreated, or no); dyslipidemia (yes or no); diabetes (yes or no); CVD (yes or no); cancer (yes or no); and BMI ( ≥ 25 kg/m2 or < 25 kg/m2). P values for interaction were calculated using a two-sample Z-test[33]. The significance threshold for double-subgroup and triple-subgroup was 0.05 and 0.025, respectively. Sensitivity analyses were also conducted in three parts. To compromise reverse causation, we further excluded deaths within the first 2 years of follow-up for ePWV analysis. To explore the association between ePWV or ΔePWV and all-cause mortality in a healthy population, we further excluded the participants with a history of chronic diseases. To test the predictive performance of ePWV as well as the changes on mortality independent of age and BP, models were further adjusted for age and MBP.
Statistical analyses were performed using SAS software (version 9.4; SAS Institute, Cary, NC, USA) and graphs were plotted using R software (version 4.0.2; The R Foundation, Boston, MA). All tests were two-sided with statistical significance set at a P < 0.05.
-
Of 13,116 participants at baseline, the mean ± SD age was 59.6 ± 9.7 years and 47.6% were males (Table 1). The mean ± SD ePWV was 9.7 ± 2.0 m/s, and the mean ± SD ePWV of the four quartile groups was 7.5 ± 0.5 m/s, 8.8 ± 0.3 m/s, 10.0 ± 0.4 m/s, and 12.4 ± 1.3 m/s, respectively. Participants with a higher ePWV were more likely to be older, male, have a lower education level, smokers, alcohol drinkers, and more inclined to have a history of hypertension, dyslipidemia, diabetes, or CVD (P < 0.001).
Characteristic Total
(n = 13,116)First quartile
(n = 3,279)Second quartile
(n = 3,278)Third quartile
(n = 3,280)Fourth quartile
(n = 3,279)P value Age, years 59.6 ± 9.7 50.5 ± 4.4 55.8 ± 5.4 61.2 ± 6.1 70.7 ± 8.0 < 0.0001 Men, n (%) 6,241 (47.6) 1,414 (43.1) 1,557 (47.5) 1,681 (51.3) 1,589 (48.5) < 0.0001 Married, n (%) 11,389 (86.8) 3,125 (95.3) 3,051 (93.1) 2,882 (87.9) 2,331 (71.1) < 0.0001 Education level, n (%) < 0.0001 No formal education 3,769 (28.7) 596 (18.2) 802 (24.5) 915 (27.9) 1,456 (44.4) Formal education 9,347 (71.3) 2,683 (81.8) 2,476 (75.5) 2,365 (72.1) 1,823 (55.6) Smoking status, n (%) < 0.0001 Never 7,883 (60.1) 2,084 (63.6) 1,992 (60.8) 1,900 (57.9) 1,907 (58.2) Ever 5,233 (39.9) 1,195 (36.4) 1,286 (39.2) 1,380 (42.1) 1,372 (41.8) Drinking status, n (%) < 0.0001 Never 59,037 (68.9) 2,369 (72.2) 2,236 (68.2) 2,218 (67.6) 2,214 (67.5) Past 825 (6.3) 113 (3.4) 183 (5.6) 226 (6.9) 303 (9.2) Current 3,254 (24.8) 797 (24.3) 859 (26.2) 836 (25.5) 762 (23.2) History of chronic disease, n (%) Hypertension 5,371 (40.9) 224 (6.8) 864 (26.4) 1,741 (53.1) 2,542 (77.5) < 0.0001 Dyslipidemia 4,898 (37.3) 1,099 (33.5) 1,175 (35.8) 1,289 (39.3) 1,335 (40.7) < 0.0001 Diabetes 2,228 (17.0) 423 (12.9) 521 (15.9) 589 (18.0) 695 (21.2) < 0.0001 CVD 1,754 (13.4) 248 (7.6) 505 (15.4) 358 (10.9) 643 (19.6) < 0.0001 Cancer 131 (1.0) 36 (1.1) 42 (1.3) 30 (0.9) 23 (0.7) 0.1051 SBP, mmHg 130.8 ± 21.5 112.1 ± 9.9 124.1 ± 12.2 134.9 ± 16.1 152.2 ± 21.9 < 0.0001 DBP, mmHg 75.9 ± 12.1 67.4 ± 8.2 75.0 ± 9.6 78.9 ± 11.4 82.3 ± 13.2 < 0.0001 ePWV, m/s 9.7 ± 2.0 7.5 ± 0.5 8.8 ± 0.3 10.0 ± 0.4 12.4 ± 1.3 < 0.0001 BMI, kg/m2 23.4 ± 3.8 23.2 ± 3.4 23.7 ± 3.7 23.7 ± 3.9 23.2 ± 4.2 < 0.0001 Waist circumference, cm 85.3 ± 10.2 83.0 ± 9.2 85.2 ± 9.7 86.3 ± 10.4 86.6 ± 10.9 < 0.0001 Total cholesterol, mg/dL 193.3 ± 34.6 188.7 ± 33.0 193.7 ± 34.7 194.9 ± 35.5 196.0 ± 34.6 < 0.0001 Triglycerides,
mg/dL112.4
(78.8–160.2)105.7
(74.3–154.9)113.7
(78.8–162.3)115.9
(80.7–162.1)114.9
(80.5–162.1)< 0.0001 HDL-C, mg/dL 51.1 ± 13.8 51.5 ± 13.4 50.8 ± 13.4 50.8 ± 14.2 51.5 ± 14.3 0.0054 LDL-C, mg/dL 116.1 ± 31.2 112.8 ± 29.6 116.2 ± 31.2 117.4 ± 32.1 118.0 ± 31.6 < 0.0001 FPG, mg/dL 110.2 ± 33.8 105.9 ± 28.6 109.6 ± 31.4 112.3 ± 39.4 113.0 ± 34.5 < 0.0001 HbA1c, % 5.3 ± 0.7 5.2 ± 0.6 5.3 ± 0.7 5.3 ± 0.8 5.3 ± 0.8 < 0.0001 Note. CVD: Cardiovascular disease; SBP: Systolic blood pressure; DBP: Diastolic blood pressure; ePWV: Estimated pulse wave velocity; BMI: Body mass index; HDL-C: High-density lipoprotein cholesterol; LDL-C: Low-density lipoprotein cholesterol; FPG: Fasting plasma glucose; HbA1c: Hemoglobin A1c. As for continuous variables, data were presented as mean ± SD if normally distributed, and as median with interquartile range (25%–75%) if non-normally distributed. Categorical variables were expressed as frequency with percentages. Table 1. Baseline characteristics of study population according to estimated pulse wave velocity
There were 8,938 CHARLS participants included in the ΔePWV analysis. The mean ± SD age was 59.5 ± 9.2 years in wave 1 and 47.1% were male (Supplementary Table S1, available in www.besjournal.com). The median ΔePWV in the first quartile group was negative (−0.70 m/s); the other median ΔePWV values were positive in the 2nd−4th quartiles (0.08 m/s, 0.61 m/s, and 1.42 m/s, respectively). The proportion of males, alcohol drinkers, and patients with hypertension or dyslipidemia was higher among participants with a higher ΔePWV (Supplementary Table S2, available in www.besjournal.com).
Characteristic Total
(n = 8,938)First quartile
(n = 2,234)Second quartile
(n = 2,235)Third Quartile
(n = 2,234)Fourth quartile
(n = 2,235)P value Age, years 59.5 ± 9.2 59.5 ± 9.1 58.5 ± 9.0 58.9 ± 9.5 61.0 ± 9.2 < 0.0001 Men, n (%) 4,209 (47.1) 975 (43.6) 980 (43.8) 1,065 (47.7) 1,189 (53.2) < 0.0001 Married, n (%) 7,868 (88.0) 1,978 (88.5) 1,971 (88.2) 1,968 (88.1) 1,951 (87.3) 0.6223 Education level, n (%) 0.3634 No formal education 2,528 (28.3) 629 (28.2) 614 (27.5) 639 (28.6) 646 (28.9) Formal education 6,410 (71.7) 1,605 (71.8) 1,621 (72.5) 1,595 (71.4) 1,589 (71.1) Smoking status < 0.0001 Never 5,435 (60.8) 1,447 (64.8) 1,427 (64.0) 1,352 (60.5) 1,209 (54.1) Ever 3,498 (39.2) 787 (35.2) 804 (36.0) 881 (39.5) 1,026 (45.9) Drinking status < 0.0001 Never 6,162 (69.0) 1,607 (72.0) 1,561 (70.0) 1,558 (69.8) 1,436 (64.3) Past 558 (6.3) 120 (5.4) 134 (6.0) 140 (6.3) 164 (7.3) Current 2,206 (24.7) 506 (22.7) 534 (24.0) 533 (23.9) 633 (28.3) History of chronic disease, n (%) Hypertension 3,575 (40.0) 1,291 (57.8) 829 (37.1) 697 (31.2) 758 (33.9) < 0.0001 Dyslipidemia 3,364 (37.6) 977 (43.7) 819 (36.6) 769 (34.4) 799 (35.7) < 0.0001 Diabetes 1,460 (16.3) 406 (18.2) 354 (15.8) 328 (14.7) 372 (16.6) 0.0144 CVD 1,168 (13.1) 324 (14.5) 258 (11.6) 277 (12.4) 309 (13.8) 0.0144 Cancer 83 (0.9) 16 (0.7) 24 (1.1) 17 (0.8) 26 (1.2) 0.3042 SBP, mmHg 130.3 ± 21.2 143.1 ± 22.2 130.3 ± 19.3 125.2 ± 18.7 122.6 ± 18.0 < 0.0001 DBP, mmHg 75.6 ± 12.1 83.3 ± 11.5 76.2 ± 10.7 72.6 ± 10.9 70.2 ± 11.0 < 0.0001 ePWV, m/s 9.6 ± 1.8 10.3 ± 1.8 9.5 ± 1.8 9.3 ± 1.8 9.4 ± 1.7 < 0.0001 BMI, kg/m2 23.1 ± 3.8 23.5 ± 3.8 23.2 ± 3.7 23.0 ± 3.8 22.7 ± 4.0 0.8162 Waist circumference, cm 84.3 ± 12.2 85.2 ± 12.9 84.4 ± 11.6 84.0 ± 11.7 83.3 ± 12.5 < 0.0001 Total cholesterol, mg/dL 195.1 ± 36.7 196.1 ± 35.4 195.4 ± 35.9 193.3 ± 37.0 195.5 ± 38.6 0.1503 Triglycerides, mg/dL 114.6
(83.2–168.1)122.1
(86.7–176.1)115.9
(84.1–167.3)108.8
(81.4–161.1)112.4
(79.6–166.4)< 0.0001 HDL-C, mg/dL 51.7 ± 12.0 51.0 ± 11.8 51.8 ± 11.4 51.7 ± 12.1 52.3 ± 12.7 0.0231 LDL-C, mg/dL 112.9 ± 28.8 113.0 ± 28.4 113.2 ± 28.7 112.1 ± 28.2 113.1 ± 29.7 0.6856 FPG, mg/dL 103.7 ± 35.6 105.4 ± 38.6 102.2 ± 33.1 101.9 ± 30.4 105.3 ± 39.3 0.0026 HbA1c, % 5.2 ± 1.0 5.3 ± 1.1 5.2 ± 1.0 5.2 ± 1.0 5.2 ± 1.0 0.0297 Note. CVD: Cardiovascular disease; SBP: Systolic blood pressure; DBP: Diastolic blood pressure; ePWV: Estimated pulse wave velocity; BMI: Body mass index; HDL-C: High-density lipoprotein cholesterol; LDL-C: low-density lipoprotein cholesterol; FPG: fasting plasma glucose; HbA1c: Hemoglobin A1c. As for continuous variables, data were presented as mean ± SD if normally distributed, and as median with interquartile range (25%–75%) if non-normally distributed. Categorical variables were expressed as frequency with percentages. ΔePWV was defined as the difference of ePWV between Wave 2 and Wave 1. Table S1. Characteristics of study population at Wave1 according to ΔePWV quartiles.
Characteristic Total
(n = 8,938)First quartile
(n = 2,234)Second quartile
(n = 2,235)Third quartile
(n = 2,234)Fourth quartile (n = 2,235) P value Age, years 61.5 ± 9.2 61.5 ± 9.1 60.5 ± 9.0 60.9 ± 9.5 63.0 ± 9.2 < 0.0001 Men, n (%) 4,209 (47.1) 975 (43.6) 980 (43.8) 1,065 (47.7) 1,189 (53.2) < 0.0001 Married, n (%) 7,718 (86.4) 1,939 (86.8) 1,934 (86.5) 1,940 (86.8) 1,905 (85.2) 0.3545 Education level, n (%) 0.8561 No formal education 2,521 (28.2) 625 (28.0) 619 (27.7) 633 (28.3) 644 (28.8) Formal education 6,417 (71.8) 1,609 (72.0) 1,616 (72.3) 1,601 (71.7) 1,591 (71.2) Smoking status, n (%) 0.0664 Never 8,588 (96.1) 2,136 (95.6) 2,167 (97.0) 2,148 (96.2) 2,137 (95.6) Ever 350 (3.9) 98 (4.4) 68 (3.0) 86 (3.8) 98 (4.4) Drinking status, n (%) < 0.0001 Never 5,879 (65.8) 1,505 (67.4) 1,514 (67.7) 1,496 (67.0) 1,364 (61.0) Past 819 (9.2) 227 (10.2) 199 (8.9) 189 (8.5) 204 (9.1) Current 2,240 (25.1) 502 (22.5) 522 (23.4) 549 (24.6) 667 (29.8) History of chronic disease, n (%) Hypertension 3,804 (42.6) 825 (36.9) 710 (31.8) 833 (37.3) 1,436 (64.3) < 0.0001 Dyslipidemia 2,977 (33.3) 863 (38.6) 729 (32.6) 673 (30.1) 712 (31.9) < 0.0001 Diabetes 1,368 (15.3) 383 (17.1) 327 (14.6) 310 (13.9) 348 (15.6) 0.0165 CVD 1,168 (13.1) 324 (14.5) 258 (11.5) 277 (12.4) 309 (13.8) 0.0139 Cancer 68 (0.8) 13 (0.6) 17 (0.8) 18 (0.8) 20 (0.9) 0.6734 SBP, mmHg 131.5 ± 21.0 122.5 ± 17.5 126.6 ± 18.5 131.0 ± 18.6 145.8 ± 21.4 < 0.0001 DBP, mmHg 76.0 ± 11.9 70.7 ± 10.5 73.3 ± 10.5 76.2 ± 10.9 83.6 ± 11.9 < 0.0001 ePWV, m/s 10.0 ± 1.9 9.5 ± 1.7 9.6 ± 1.8 9.9 ± 1.8 11.0 ± 1.8 < 0.0001 BMI, kg/m2 23.7 ± 3.8 23.9 ± 3.8 23.7 ± 3.9 23.7 ± 3.7 23.5 ± 3.8 0.0065 Waist circumference, cm 86.8 ± 10.3 87.3 ± 10.4 86.3 ± 10.2 86.6 ± 10.2 87.1 ± 10.5 0.0178 Total cholesterol, mg/dL 193.6 ± 35.3 196.3 ± 34.8 194.2 ± 37.4 191.1 ± 33.8 193.0 ± 34.9 < 0.0001 Triglycerides, mg/dL 110.6
(77.0−157.5)116.8
(81.4−164.6)108.0
(74.3−156.6)109.7
(75.2−153.1)109.7
(77.9−155.4)< 0.0001 HDL-C, mg/dL 51.5 ± 14.2 50.6 ± 14.5 51.4 ± 13.7 51.7 ± 14.1 52.4 ± 14.6 0.0001 LDL-C, mg/dL 116.3 ± 31.7 117.5 ± 32.7 117.0 ± 32.7 114.9 ± 29.4 115.7 ± 32.0 0.0181 FPG, mg/dL 110.1 ± 33.4 111.3 ± 37.3 109.1 ± 30.7 109.2 ± 31.0 110.8 ± 34.2 0.3678 HbA1c, % 5.3 ± 0.8 5.3 ± 0.8 5.2 ± 0.7 5.2 ± 0.7 5.3 ± 0.8 0.3265 Note. CVD: Cardiovascular disease; SBP: Systolic blood pressure; DBP: Diastolic blood pressure; ePWV: Estimated pulse wave velocity; BMI: Body mass index; HDL-C: High-density lipoprotein cholesterol; LDL-C: low-density lipoprotein cholesterol; FPG: fasting plasma glucose; HbA1c: Hemoglobin A1c. As for continuous variables, data were presented as mean ± SD if normally distributed, and as median with interquartile range (25%–75%) if non-normally distributed. Categorical variables were expressed as frequency with percentages. ΔePWV was defined as the difference of ePWV between Wave 2 and Wave 1. Table S2. Characteristics of study population at Wave2 according to ΔePWV quartiles.
-
As shown in Table 2, during a median follow-up period of 7.0 years, participants with a higher ePWV had a higher all-cause mortality rate. After adjustment for gender, smoking status, alcohol consumption status, histories of hypertension, dyslipidemia, diabetes, CVD, and cancer, and the BMI at baseline, the positive association between ePWV and all-cause mortality (P for trend < 0.001) was observed. The multivariate-adjusted hazard ratios (HRs, 95% CI) for all-cause mortality (vs. quartile 1) were 1.69 (1.31−2.18), 3.09 (2.44−3.91), and 8.54 (6.78−10.75) for participants in the 2nd, 3rd, and 4th ePWV quartiles, respectively. The HR (95% CI) per increase of ePWV for all-cause mortality was 2.32 (2.20−2.45) after full adjustment for confounders, which was consistent with the results considering ePWV as a categorical variable.
Characteristic First
quartile
(n = 3,279)Second
quartile
(n = 3,278)Third
quartile
(n = 3,280)Fourth
quartile
(n = 3,279)P
trendper SD increase Person-years 21,767 21,623 21,292 19,494 Cases, n 95 160 300 801 Incidence rate (per 1,000 person-years) 4.4 7.4 14.1 41.1 Crude model, HR (95% CI) 1.00 (Ref) 1.69 (1.31–2.18) 3.21 (2.55–4.05) 9.37 (7.58–11.60) < 0.0001 2.27 (2.17–2.37) Adjusted model, HR (95% CI) 1.00 (Ref) 1.69 (1.31–2.18) 3.09 (2.44–3.91) 8.54 (6.78–10.75) < 0.0001 2.32 (2.20–2.45) Note. HR, hazard ratio; CI, confidence interval; SD, standard deviation; ePWV, estimated pulse wave velocity. Model was adjusted for baseline sex, smoking status, drinking status, history of hypertension, dyslipidemia, diabetes, CVD and cancer, and body mass index. Table 2. Hazard ratios of all-cause mortality associated with ePWV
-
During a median follow-up of 5.0 years, 658 deaths were identified (Table 3). In the unadjusted analysis, by comparing quartiles 2 and 3 with quartile 1, the associations between ΔePWV and all-cause mortality did not reach statistical significance. In the quartile 4 group, however, the HR (95% CI) for all-cause mortality was 1.28 (1.04−1.57). After adjustment for sex, smoking status, alcohol consumption status, histories of hypertension, dyslipidemia, diabetes, CVD and cancer, BMI, and baseline ePWV, an increased ePWV was significantly associated with a higher risk of all-cause mortality (P for trend < 0.001), with a 43% (95% CI, 15%−79%) and 90% (95% CI, 52%−137%) increased risk of death for participants in quartiles 3 and 4, respectively. Furthermore, each SD increase in ΔePWV was significantly associated with a 1.28-fold increase (95% CI, 1.18−1.38) in all-cause mortality after multivariate adjustment.
Characteristic First
quartile
(n = 2,234)Second
quartile
(n = 2,235)Third
quartile
(n = 2,234)Fourth
quartile
(n = 2,235)P
trendper SD increase Person-years 10,463 10,595 10,636 10,473 Cases, n 162 131 157 208 Incidence rate (per 1,000 person-years) 15.5 12.4 14.8 19.9 Crude model, HR (95% CI) 1.00 (Ref) 0.80 (0.64–1.01) 0.95 (0.77–1.19) 1.28 (1.04–1.57) 0.0049 1.10 (1.02–1.19) Adjusted model, HR (95% CI) 1.00 (Ref) 1.13 (0.90–1.43) 1.43 (1.15–1.79) 1.90 (1.52–2.37) < 0.0001 1.28 (1.18–1.38) Note. HR, hazard ratio; CI, confidence interval; SD, standard deviation; ePWV, estimated pulse wave velocity. ΔePWV was defined as the difference of ePWV between Wave 2 and Wave 1. Model was adjusted for sex, smoking status, drinking status, history of hypertension, dyslipidemia, diabetes, CVD and cancer, body mass index, and baseline ePWV. Table 3. Hazard ratios of all-cause mortality associated with ΔePWV
-
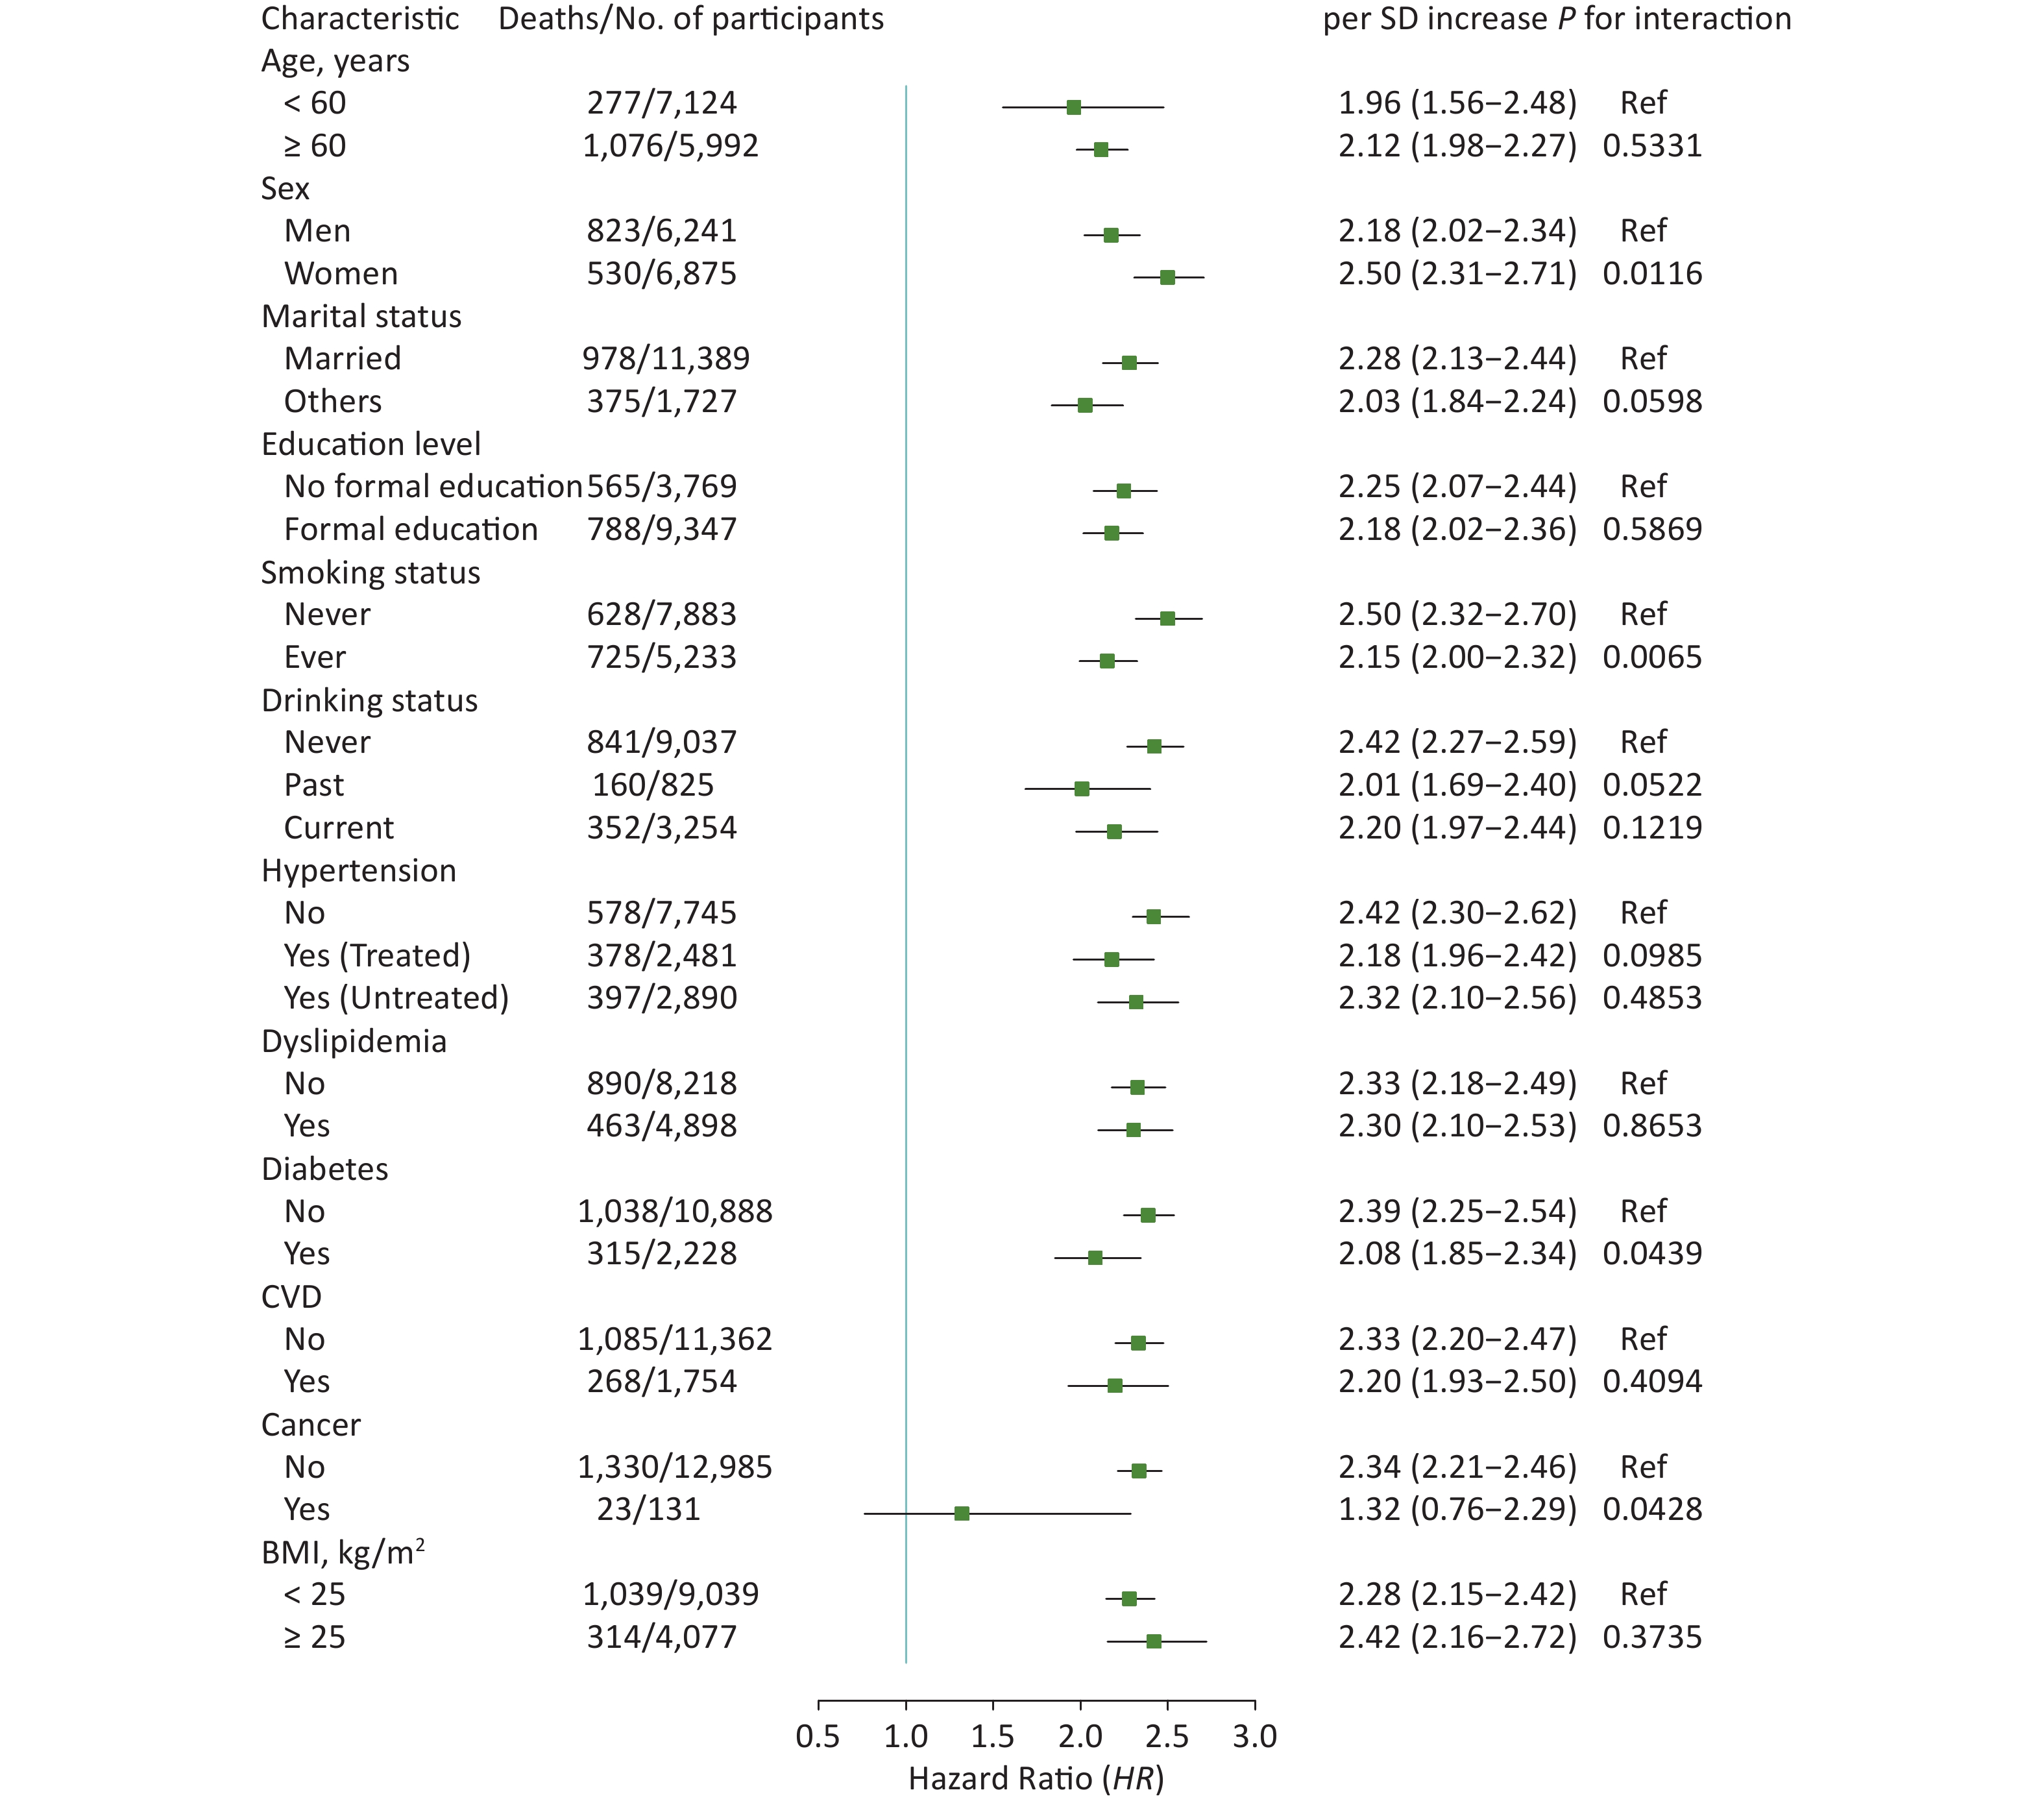
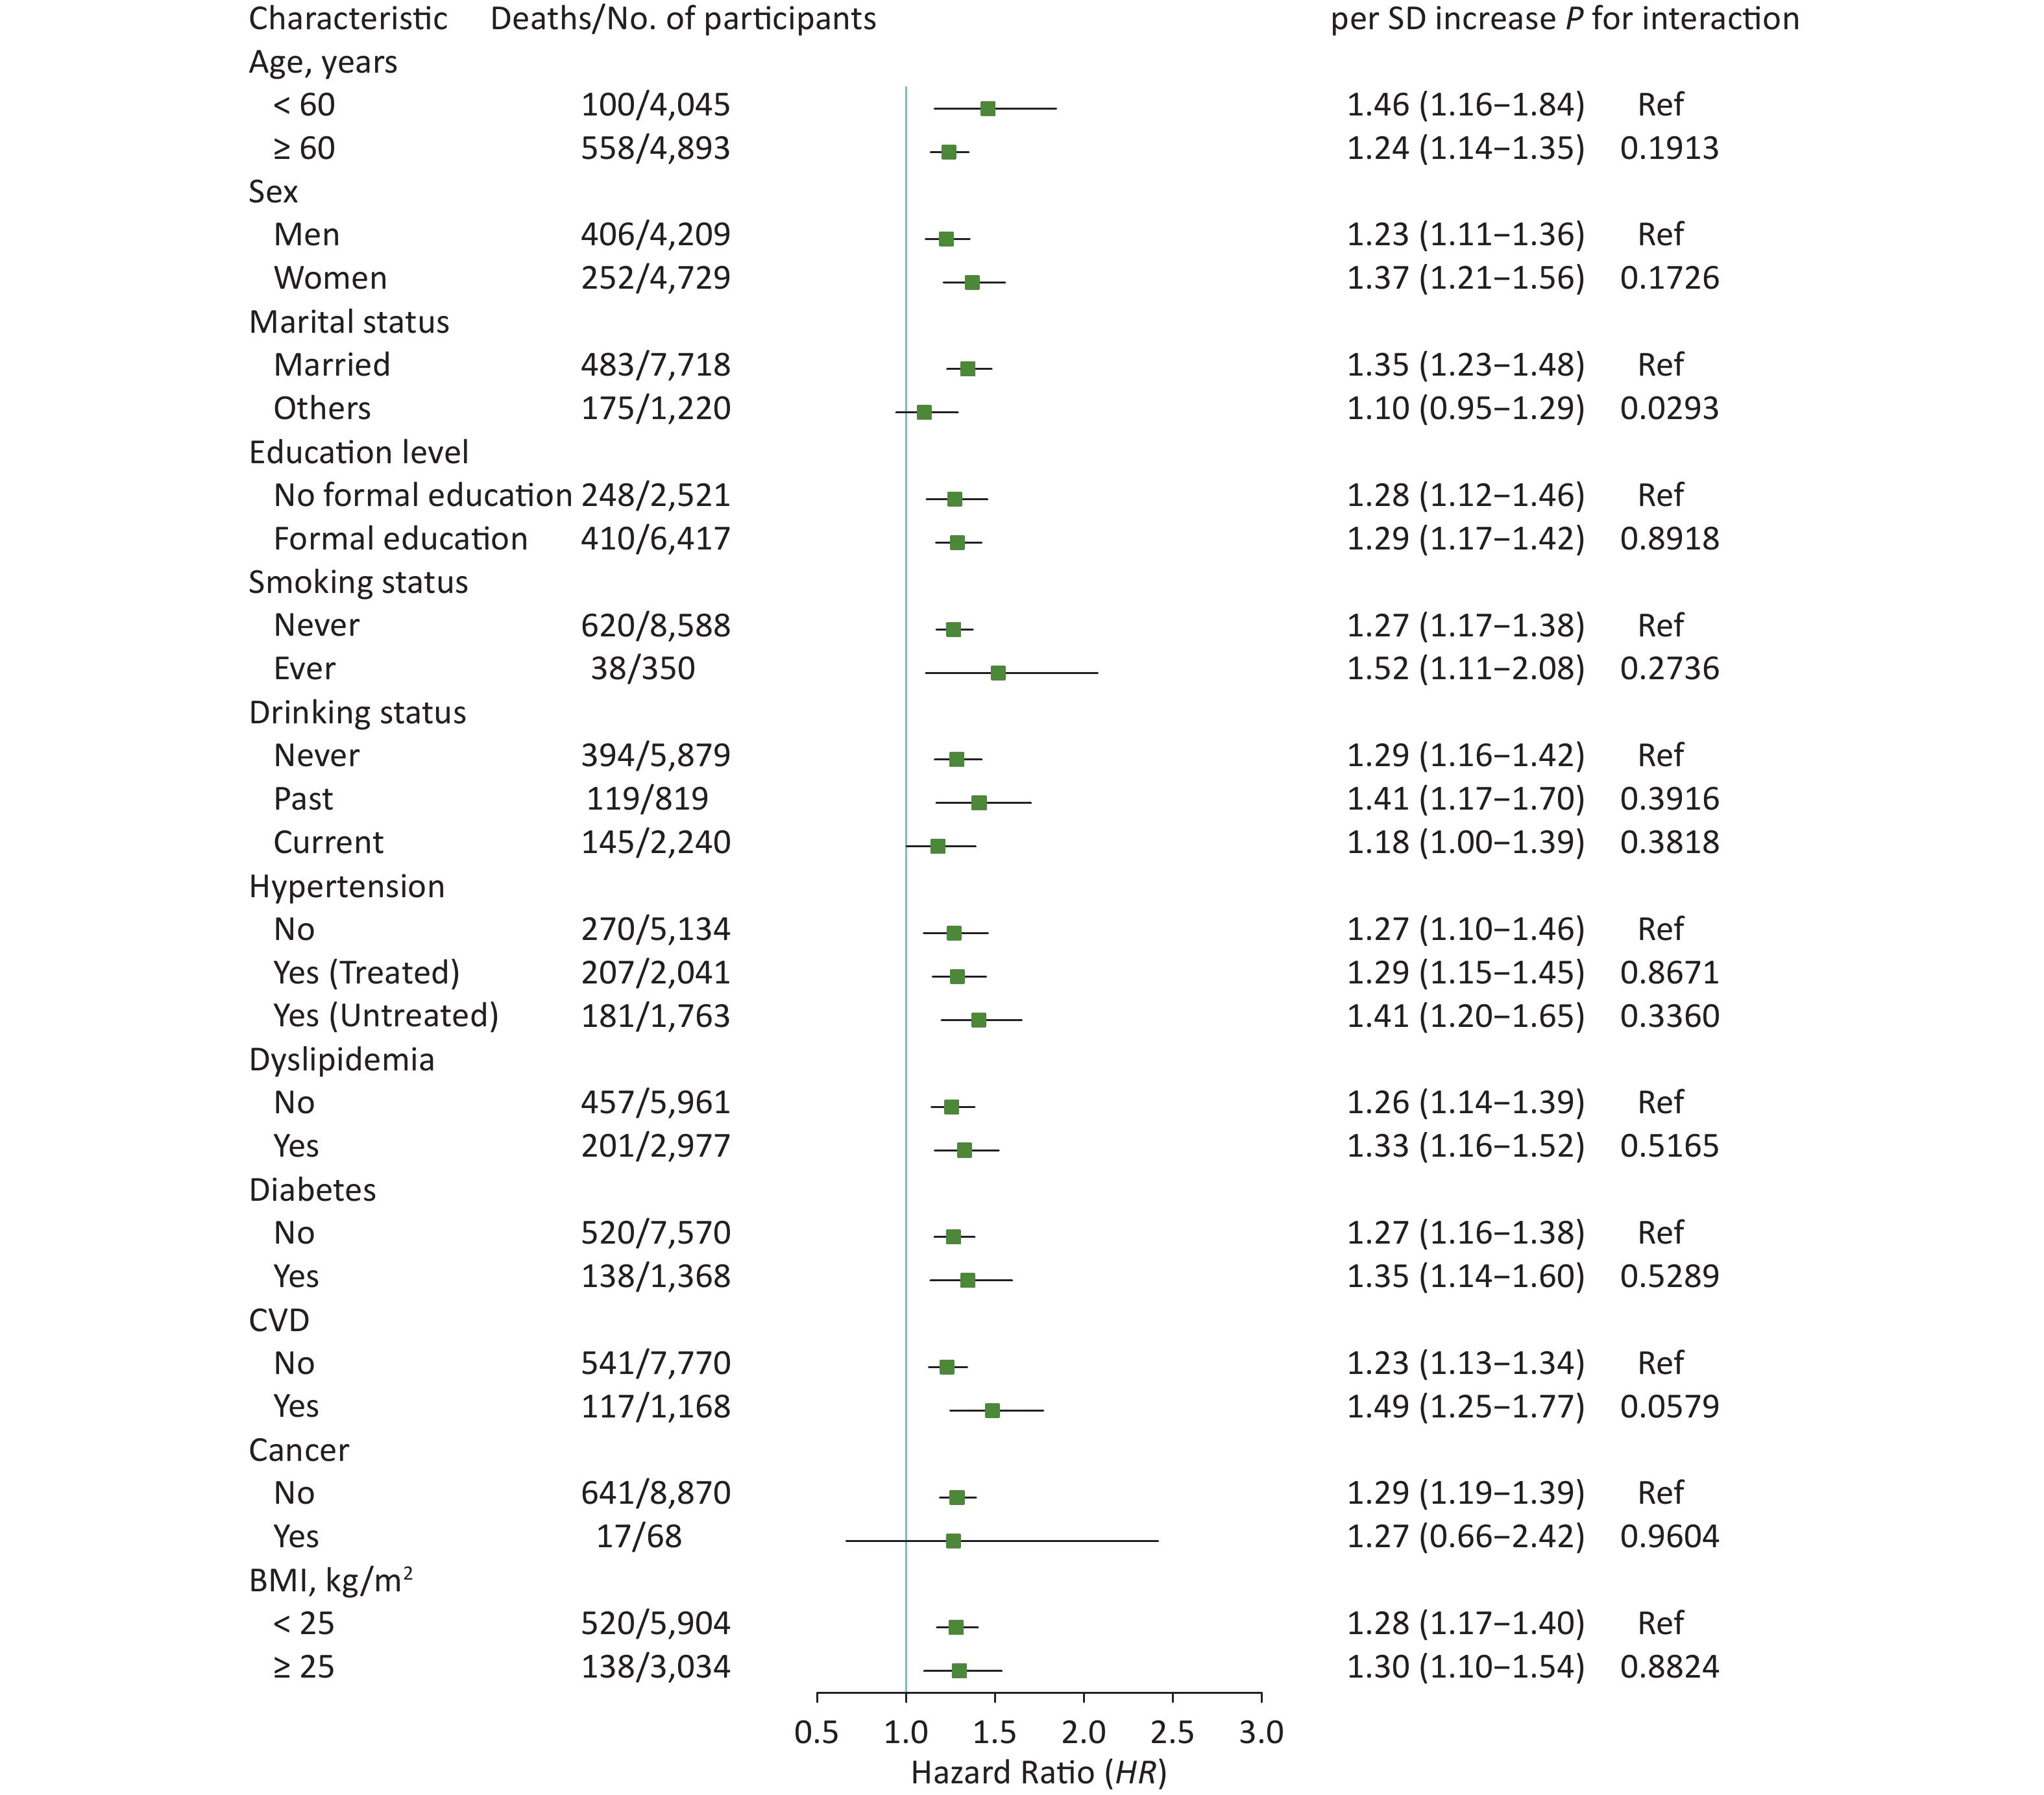
In subgroup analyses, the results did not substantially change when stratified by specific factors (Figures 2 and 3). The associations between ePWV and all-cause mortality were more pronounced among participants who were female (P for interaction = 0.0116), never smokers (P for interaction = 0.0065), or without diabetes (P for interaction = 0.0439) or cancer (P for interaction = 0.0428). The results of ΔePWV analyses were consistent, except when stratified by marital status (P for interaction = 0.0293). In sensitivity analyses, after excluding those who died during the 2 years of follow-up, the positive association between ePWV and all-cause mortality remained statistically significant. Similar results were also obtained when participants with a history of chronic diseases were excluded or when models were further adjusted for age and MBP (Supplementary Table S3, available in www.besjournal.com).
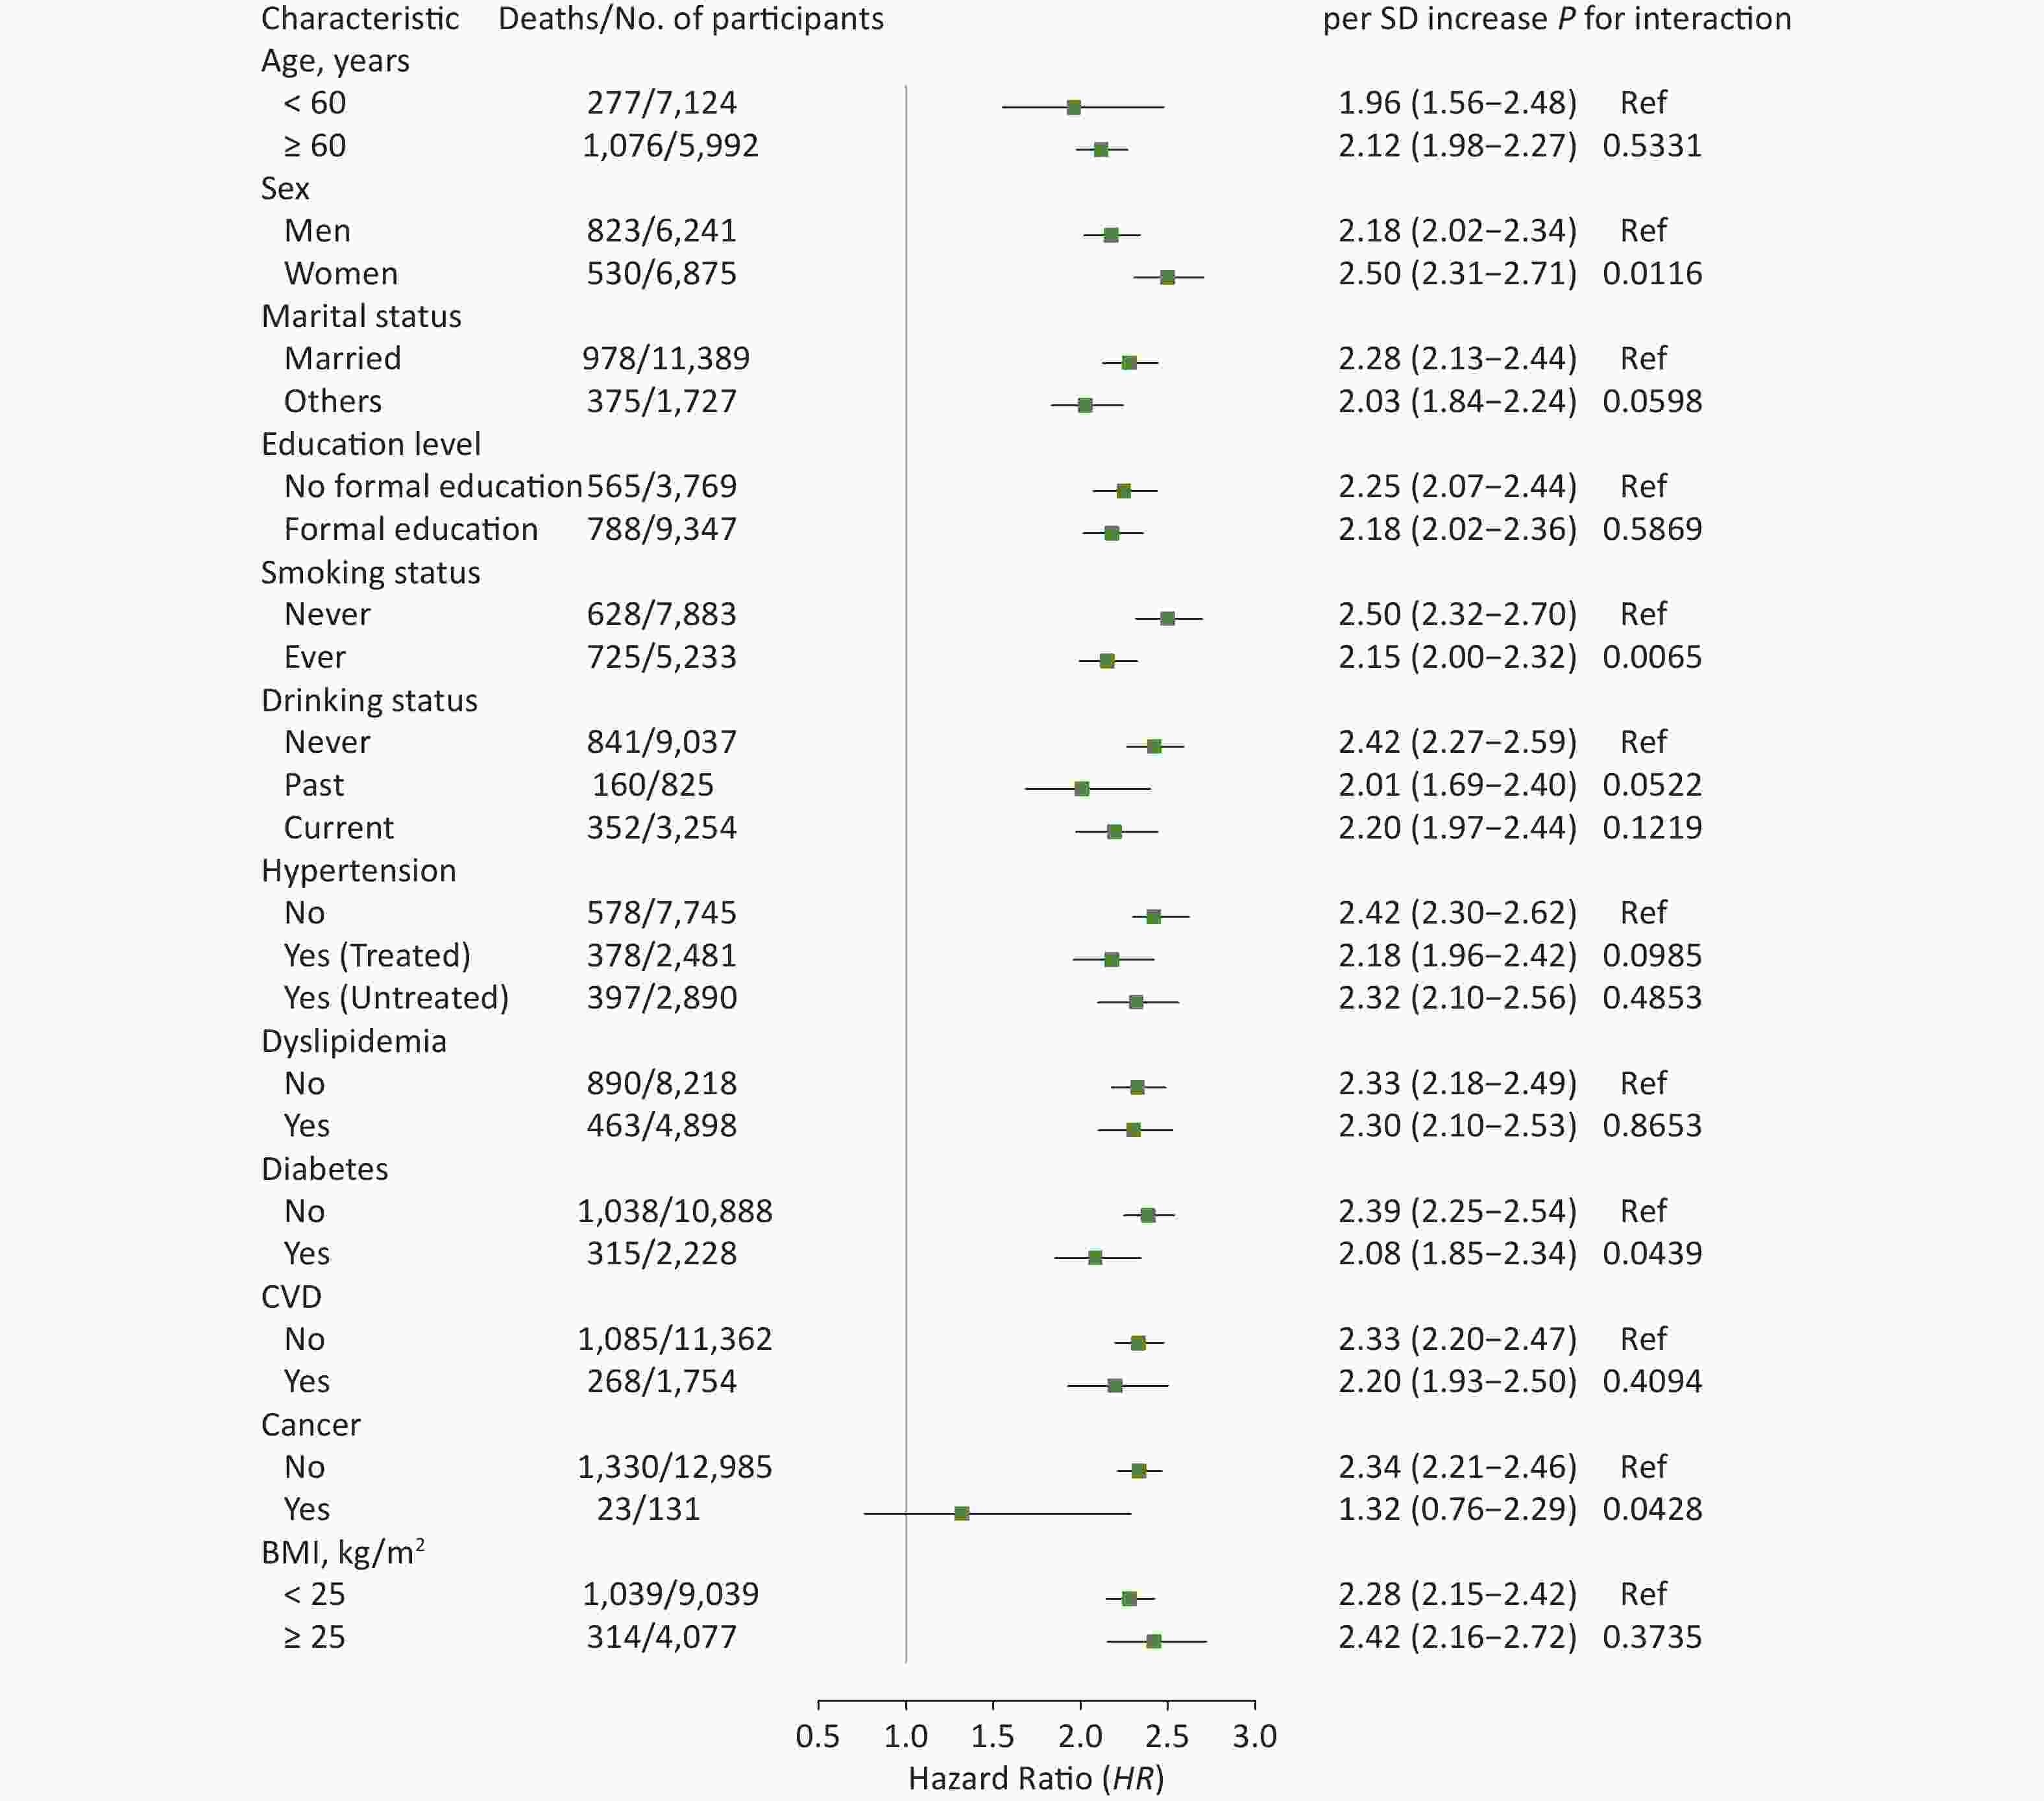
Figure 2. Hazard ratios (95% CI) of all-cause mortality associated with ePWV stratified by different factors. CI: confidence interval; ePWV: estimated pulse wave velocity; CVD: cardiovascular disease; BMI: body mass index. Model was adjusted for baseline sex, smoking status, drinking status, history of hypertension, dyslipidemia, diabetes, CVD and cancer, and body mass index.

Figure 3. Hazard Ratios (95% CI) of all-cause mortality associated with ΔePWV stratified by different factors. CI: confidence interval; ePWV: estimated pulse wave velocity; CVD: cardiovascular disease; BMI: body mass index. ΔePWV was defined as the difference of ePWV between wave 2 and wave 1. Model was adjusted for sex, smoking status, drinking status, history of hypertension, dyslipidemia, diabetes, CVD and cancer, body mass index, and baseline ePWV.
Characteristic Person-years Cases, n Incidence rate (per 1,000 person-years) HR (95% CI) ePWV Excluding cases occurred during the first 2 years of follow-up First quartile 21,346 80 3.7 1.00 (Ref) Second quartile 21,358 121 5.7 1.50 (1.13−1.99) Third quartile 21,153 234 11.0 2.85 (2.19−3.70) Fourth quartile 20,003 628 31.4 7.77 (6.03−10.00) P trend < 0.0001 per SD increase 1.52 (1.48−1.57) Excluding cases with history of chronic disease First quartile 10,681 38 3.5 1.00 (Ref) Second quartile 10,655 58 5.4 1.51 (1.00−2.28) Third quartile 10,591 121 11.4 3.18 (2.19−4.60) Fourth quartile 9,641 372 38.6 9.99 (7.00−14.26) P trend < 0.0001 per SD increase 2.37 (2.19−2.56) Model further adjusted for age and MBP First quartile 21,767 95 4.4 1.00 (Ref) Second quartile 21,623 160 7.4 0.95 (0.73, 1.24) Third quartile 21,292 300 14.1 0.99 (0.76, 1,29) Fourth quartile 19,494 801 41.1 1.05 (0.75, 1.47) P trend 0.4482 per SD increase 1.59 (1.25, 2.00) ΔePWV Excluding cases with history of chronic disease First quartile 5,483 82 15.0 1.00 (Ref) Second quartile 5,574 63 11.3 1.08 (0.78−1.50) Third quartile 5,609 70 12.5 1.31 (0.95−1.81) Fourth quartile 5,527 96 17.4 1.63 (1.21−2.21) P trend 0.0082 per SD increase 1.16 (1.04-1.30) Model further adjusted for age and MBP First quartile 10,463 162 15.5 1.00 (Ref) Second quartile 10,595 131 12.4 1.01 (0.78, 1.31) Third quartile 10,636 157 14.8 1.20 (0.90, 1.60) Fourth quartile 10,473 208 19.9 1.45 (1.00, 2.08) P trend 0.0306 per SD increase 1.24 (1.04, 1.48) Note. HR: Hazard ratio; CI: Confidence interval; ePWV: Estimated pulse wave velocity. ΔePWV was defined as the difference of ePWV between Wave 2 and Wave 1. Model of ePWV analyses was adjusted for baseline sex, smoking status, drinking status, history of hypertension, dyslipidemia, diabetes, CVD and cancer, body mass index. Model of ΔePWV analyses was adjusted for the aforementioned covariates using Wave 2 data as well as baseline ePWV. Table S3. Hazard ratios (HRs) (95% CI) of all-cause mortality associated with ePWV and ΔePWV in sensitivity analyses
-
In the present study using large-scale data from CHARLS, we showed that an increased ePWV was associated with a higher risk of all-cause mortality and provided the first evidence that progression in ePWV was indicative of all-cause mortality in middle-aged and elderly Chinese. These results were consistent in subgroup analyses and even after excluding participants with hypertension, diabetes, dyslipidemia, CVD, and cancer. Our findings provided evidence for the clinical significance of ePWV as a convenient alternative to apparatus-measured PWV, and is of clinical significance in implementing measures to slow ePWV progression.
The association between arterial stiffness measured by cfPWV or baPWV and a higher risk of CVD and all-cause mortality has been widely verified[4, 5, 7, 8, 34–37]. According to a systematic review and meta-analysis consisting of 17 longitudinal studies[4], the pooled relative risk ratios [RRs (95% CI)] of all-cause mortality for the high (vs. low) PWV group and for PWV per SD increment were 1.90 (1.61–2.24) and 1.42 (1.29–1.58), respectively. A previous study showed that subjects in the top decile of baPWV had a higher risk of all-cause mortality in an elderly Chinese population, while this association was not apparent in a population < 60 years of age[38]. The ePWV has been calculated using the equations containing age and MBP parameters[13], and has shown predictive performance similar to or greater than the measured PWV. Previous results were based on specific populations, including patients with hypertension or CVD, or apparently healthy populations[14, 18, 20, 39], while our study extended to the general population and demonstrated that with an elevation in the ePWV, the risk of all-cause mortality also increased independent of history of typical chronic diseases, such as hypertension and diabetes.
An increase in the number of cardiovascular risk factors accelerates the progression of vascular aging, as reflected by PWV[40]. Because the dynamic changes of ePWV may better indicate worsening arterial stiffness, effective intervention with modifiable risk factors, particularly hypertension, is therefore needed to mitigate ePWV progression, thus lowering the mortality risk. Reducing arterial stiffness and achieving healthy vascular aging is possible by controlling weight status, restricting dietary sodium, proper exercise, or use of medications, such as antihypertensive agents and statins[21, 22, 41–44]. Thus, controlling progression of ePWV with prompt treatment could be clinically significant. Despite the limited number of relevant studies, the prognostic value of PWV changes has been revealed. Previous studies conducted among a small sample-size of end-stage renal disease (ESRD) patients undergoing hemodialysis and participants with resistant hypertension or diabetes confirmed the association between the progression of arterial stiffness, as reflected by cfPWV, and worse survival status[24–27]; however, there was a lack of evidence with respect to the general population. In our findings, changes in ePWV with a 2.0-year interval also showed a strong correlation with all-cause mortality in the general Chinese population > 45 years of age, especially in the 3rd and 4th quartile groups, in which ePWV increased more sharply. This is the first study to investigate the implications of changes in ePWV for all-cause mortality in a Chinese population, and it shed light on the further exploration of the clinical significance of ePWV changes in different ethnic and racial groups.
In our subgroup analyses, the results were consistent. Of note, when stratified by prevalence and treatment of hypertension, the difference in the risk of all-cause mortality in association with ePWV was marginally significant compared with normotensive participants (Figure 2). According to Sheng et al.[38], the HR for all-cause mortality was greater in hypertensive patients in the top decile of the baPWV group. The subtle inconsistency of these results might be explained as follows. Sheng et al.[38] focused on the participants in the top decile of baPWV in whom hypertension status and arterial stiffness, as reflected by baPWV, are more closely correlated. In contrast, antihypertensive treatment was only reported in the questionnaire interview without further investigation on specific types of antihypertensive drugs in CHARLS. The medication status and the effect of antihypertensive drugs when measuring BP was not clearly clarified, thus leading to potential bias in the subgroup analysis. Therefore, with respect to the relationship between PWV and the risk of all-cause mortality, the role of hypertension and antihypertensive treatment needs to be further evaluated in a more representative population. In addition, the difference in association between ePWV changes and the risk of death was marginally significant among people with and without a history of CVD (P for interaction = 0.0579), suggesting that people with CVD should pay attention to this indicator.
Arterial stiffness increases with age and BP, which are major determinants of PWV and are reflected in the calculation equations of ePWV[13], whereas the pathophysiologic mechanism of worsening arterial stiffness in all-cause mortality is not fully understood. It is known that CV mortality accounts for all-cause mortality in relation to arterial stiffness[14], and arterial stiffness has also been shown to be associated with a higher risk of chronic kidney disease (CKD), neurovascular disease, and cognitive decline[45, 46]. The process of vascular aging includes oxidative stress, chronic inflammation, and cellular senescence, which shares the pathways with cardiovascular and non-cardiovascular morbidity and mortality[47]. These causes might jointly unveil a potential link between arterial stiffness and all-cause mortality.
There were several strengths in this study, such as the large-scale general population recruited by the PPS strategy, a prospective study design with a long-term period and a high rate of follow-up, and the dependable and detailed questionnaire interview and standardized physical examination, which enabled the accuracy of the ePWV calculation and other potential confounding factors. Some limitations of this study should also be addressed. First, the exact time of death was not investigated since wave 2 in CHARLS. Owing to the short time span of each follow-up, the update of death information was relatively timely. Furthermore, we calculated the time of death as the median of two follow-up times before and after death to minimize this error. Second, a history of chronic diseases was self-reported. To reduce the ambiguity of self-reported status, we also included a history of treatment and biochemical indicators. Additionally, similar results were shown in our sensitivity analyses after excluding participants with chronic diseases. Third, participants without a valid ePWV value, whose characteristics were similar to those of the included population grouped by ePWV quartile in the 2nd and 3rd quartile groups, but with higher mortality risk, were excluded, which might underestimate the risk in groups; otherwise, ePWV and its changes were more predictive of deaths. Fourth, our study only involved middle-aged and elderly Chinese population, so the findings might not be generalizable to other ethnic and racial groups. Therefore, future studies are warranted to consolidate those results in different populations.
-
In summary, based on data from the CHARLS, the current study provided evidence that increased ePWV and progression of ePWV were indicative of all-cause mortality in middle-aged and elderly Chinese. Participants with higher ePWV and more significant ePWV changes were more prone to die. Thus, to reduce the incidence of all-cause mortality and achieve healthy vascular aging, effective intervention or prompt treatment should be adopted in clinical practice to mitigate or reverse the progression of ePWV.
HTML
Study Population
Calculation of ePWV and ΔePWV
Ascertainment of All-cause Mortality
Covariates
Statistical Analysis
Characteristics of the Study Population by ePWV or ΔePWV
Association of ePWV with All-cause Mortality
Association of ΔePWV with All-cause Mortality
Subgroup and Sensitivity Analyses
CONFLICT OF INTEREST None.
 22155Supplementary Materials.pdf
|

|

 Quick Links
 DownLoad: