


-
Hemorrhagic fever with renal syndrome (HFRS) is a rodent-borne disease characterized by fever, hemorrhage, and kidney damage [1-3], which seriously threatens residential health and lives [4-5], particularly in the Guanzhong Plain of Shaanxi Province [6]. Since 2009, the Guanzhong Plain has been the most severely afflicted HFRS epidemic area, while HFRS prevalence has decreased in the majority of the epidemic areas in China [6-7]. Although rodent control measures and vaccination have been adopted in this area, the HFRS epidemic still show a high incidence trend [8-9]. Simultaneously, the Guanzhong Plain experienced rapid economic development, which led to precipitous land use changes, and cultivated land has been converted into construction land [10]. Land use changes can greatly damage the original living environment of reservoir hosts and add to their exposure to human environments, which may lead to more contact opportunities between humans and hosts, thereby increasing infection risk [11]. The roles of natural environmental and socioeconomic factors in this area are pressing topics that must be addressed.
Many studies have been conducted on the factors influencing the HFRS epidemic in this highly HFRS epidemic area [12-15]. Both natural environmental and socioeconomic factors have affected the HFRS epidemic by influencing the ecological niches of humans and rodents and human-rodent contact opportunities. Meteorological factors, including temperature, humidity and precipitation, have also been found to be closely related to the growth of reservoir hosts populations and the spread of the virus [16], implying that the sudden increase in precipitation may have been an important factor leading to the HFRS outbreak in Shaanxi Province from 2010 to 2012 [17]. Complicated landform types also affect rodent habitats. For instance, more than 90% of the counties with relatively high HFRS incidence rates in Shaanxi Province are concentrated in plain areas [18]. Vegetation coverage and land-use types were found to be closely related to the survival, reproduction, and population density of reservoir hosts [19-20]. The vast cultivated land, good crop growth, and lush vegetation in central Shaanxi Province provided adequate food sources and habitat for reservoir hosts, which led to a serious HFRS epidemic [7,17]. Moreover, socioeconomic activities during urbanization increase the frequency of contact between reservoir hosts and humans [7], but such socioeconomic development could also improve sanitary conditions and vaccination, thereby controlling the occurrence and spread of HFRS [21]. Additionally, rodent density and virus-carrying rate are closely related to HFRS incidence [8]; however, these data are difficult to obtain and use in research because of their availability and quality. Recently, MaxEnt models have been gradually used in infectious disease research, which can explore the potential geographic and ecological potential of disease transmission based on information on vectors, hosts, pathogens, or population cases in disease transmission, combined with changes in related geographic landscape and ecological elements [11, 22-23].
Previous studies have provided a preliminary understanding of the HFRS epidemic in Shaanxi Province, focusing on the spatiotemporal characteristics and influencing factors of the HFRS epidemic in a single administrative division [24-26]. Little research has been conducted using a fine-scale spatial assessment of the HFRS epidemic, but this is a critical assessment to determine whether natural environmental or socioeconomic factors are more important in the area. In this study, Chang’an District and Hu County in the Guanzhong Plain of Shaanxi Province were selected as our study areas, which both have high HFRS epidemic prevalence and similar geographical environments, but they have different levels of economic development. This area provides an opportunity to compare similarities and differences in influencing factors. In this study, MaxEnt models were built based on HFRS case data from 2014 to 2016 and meteorological, landscape, and socioeconomic data, to investigate the influencing factors of this high-epidemic area and compare the main influencing factors in regions with different levels of economic development. This study provides useful information for local epidemic prevention and control strategy development in the Guanzhong Plain, especially in areas with obvious urban and rural differences.
-
Chang’an District and Hu County are HFRS-prevalent areas in the Guanzhong Plain of Shaanxi Province [27]. Notably, Hu County was upgraded to Huyi District in 2017, but we reference it as Hu County because our data were collected from 2014 to 2016. Both areas are located in the Weihe Basin in the central part of Shaanxi Province, bordering the Weihe River to the north (Figure 1). The terrain is high in the south and low in the north. The total area of Chang’an District and Hu County is 1,580 km2 and 1,282 km2, respectively. Chang’an District and Hu County border east to west, and both have a continental monsoon climate with four distinct seasons. The annual average temperature and the annual precipitation of Chang’an District are 15.5 °C and 600 mm, respectively, and those of Hu County are 13.5 °C and 627 mm, respectively. The two places have natural environmental similarities but considerable socioeconomic differences, with the socioeconomic conditions of Chang’an District far superior to those of Hu County [28]. Compared with Hu County, Chang’an District has a higher rate of urbanization, a more developed economy, a higher proportion of non-agricultural population, and a higher population density. The permanent population and Gross Domestic Product (GDP) of Chang’an District were 1,118,300 people and 51.388 billion yuan in 2015, and those of Hu County were 570,300 people and 15.541 billion yuan for the same year [28].
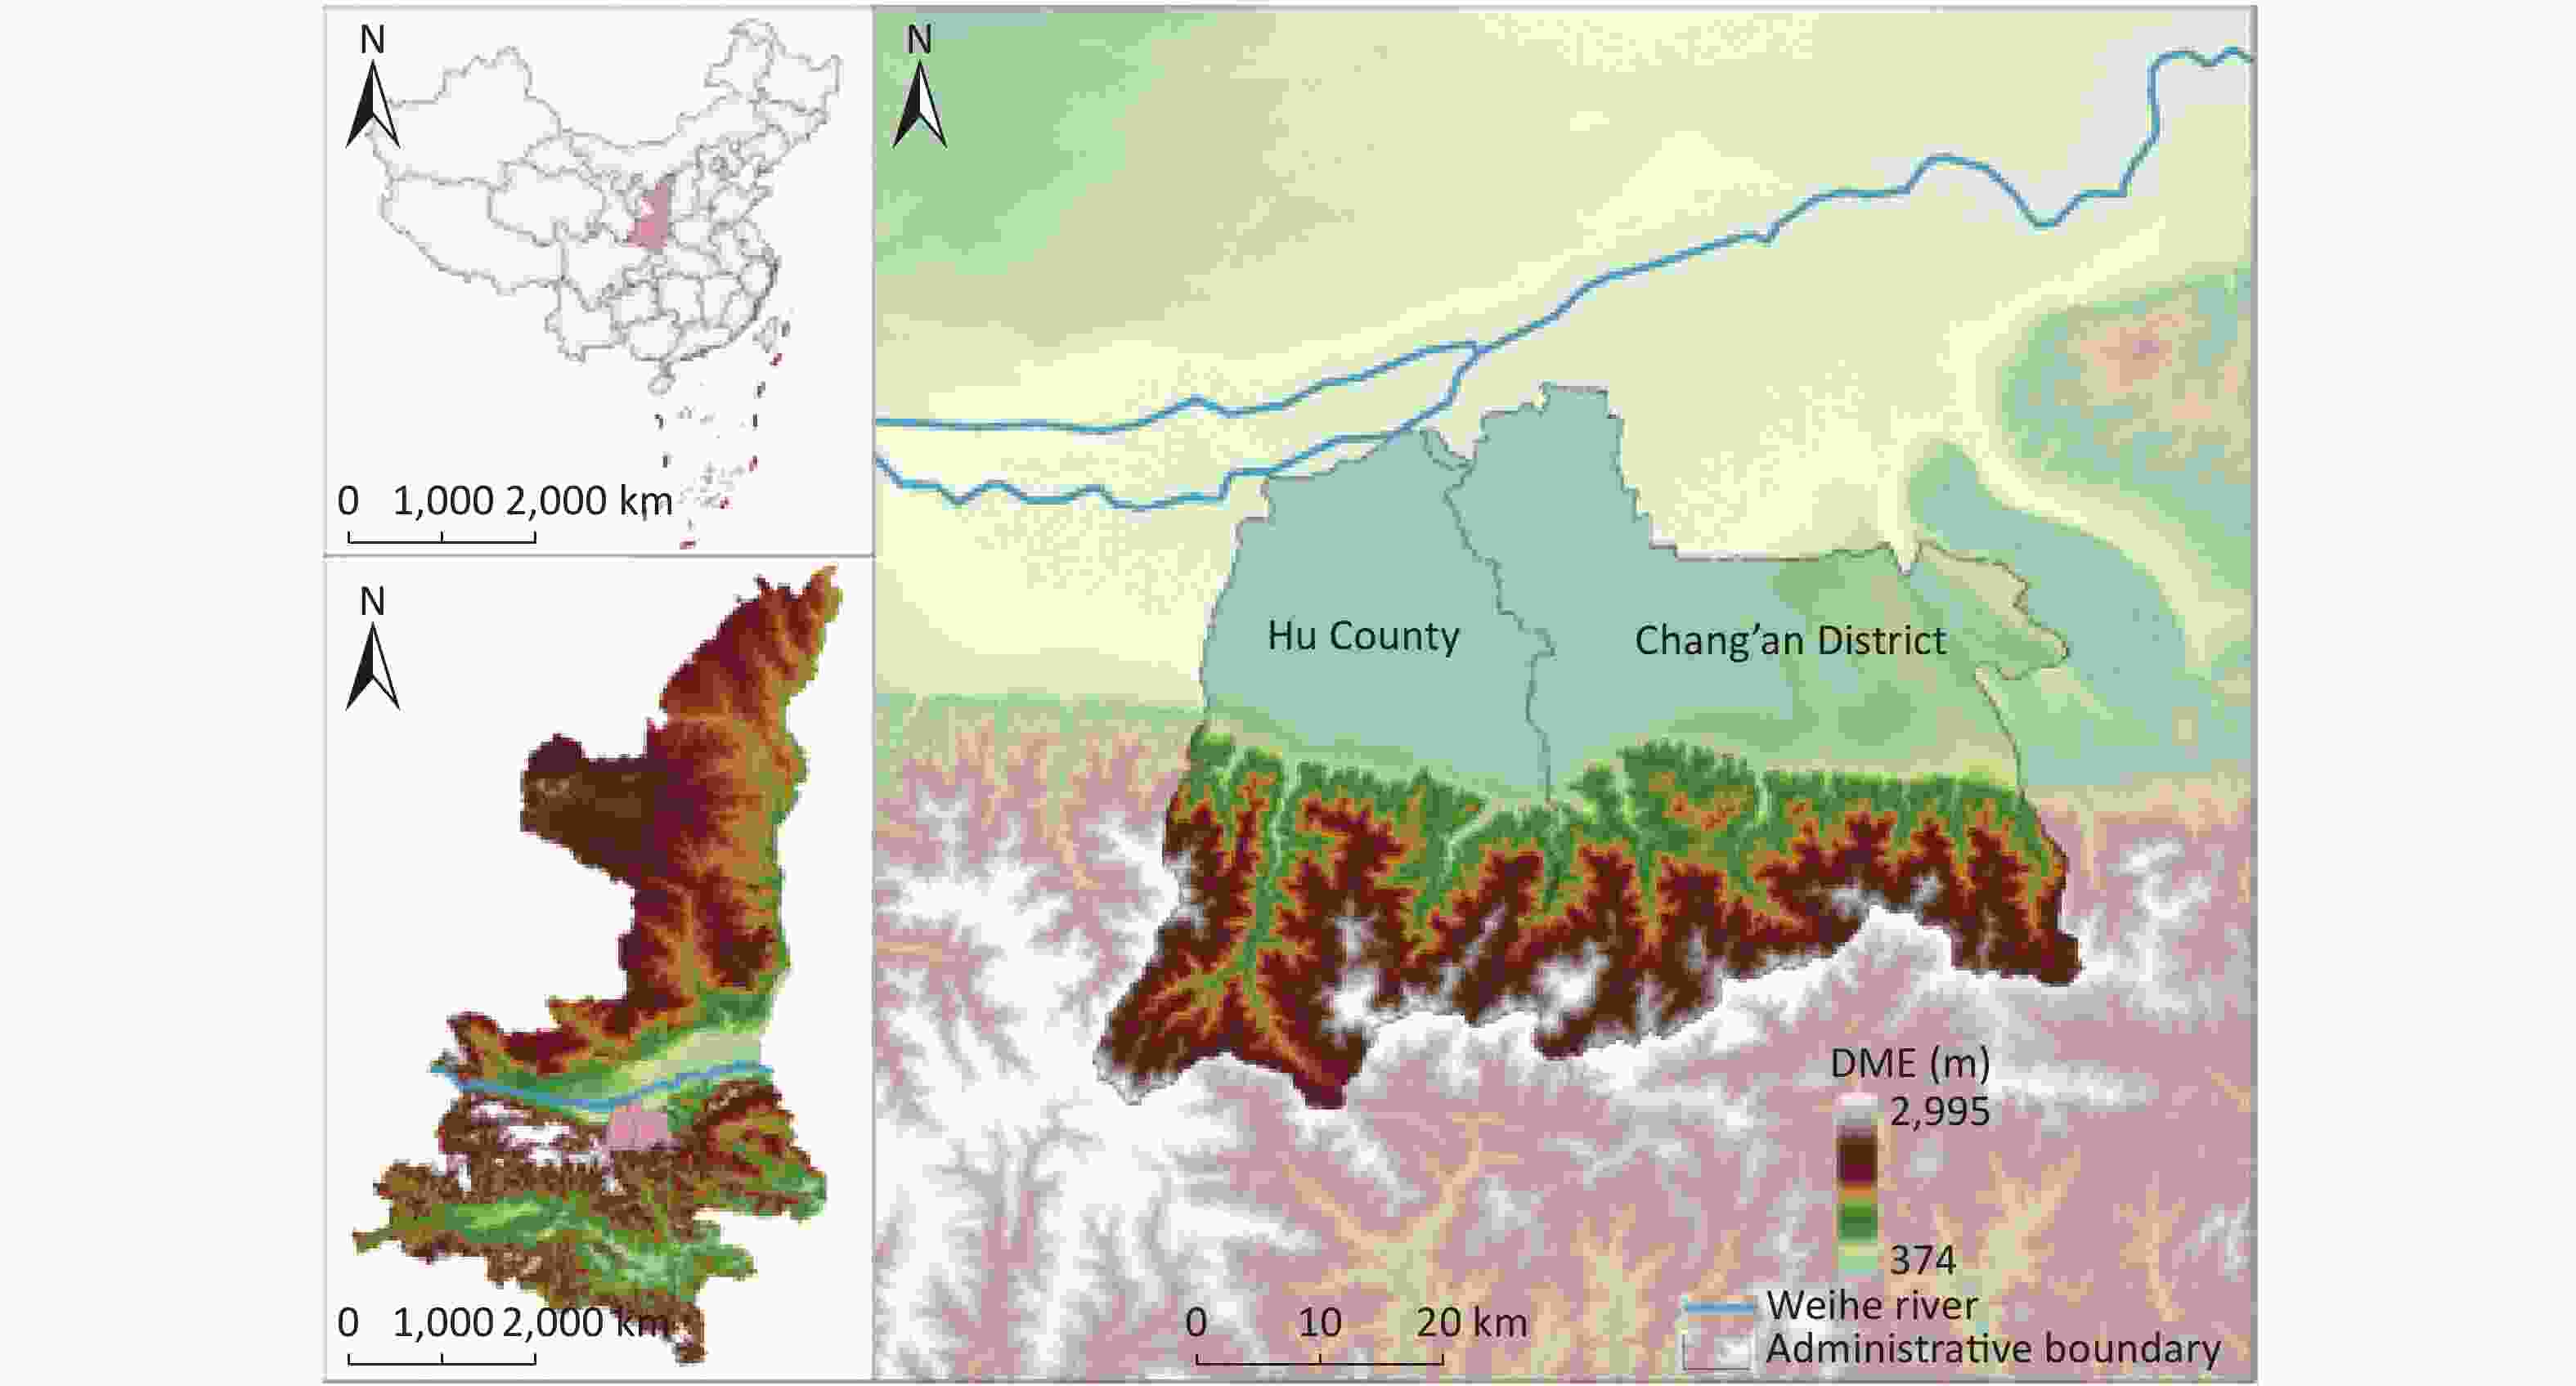
Figure 1. The study area.
-
HFRS Data HFRS reported cases and incidence data from 2014 to 2016 in Shaanxi Province were obtained from the Chinese Center for Disease Control and Prevention. After desensitization, the information involved in patient privacy of all reported HFRS cases was strictly encrypted, and each case only included information such as gender, age, and the detailed address of their current residence. Geocoding the family addresses of HFRS cases yielded HFRS case-point data. Overall, 440 and 165 HFRS cases were reported in Chang’an District and Hu County from 2014 to 2016, respectively, with average annual crude incidence rates of 15.055/10−5 and 9.648/10−5, respectively.
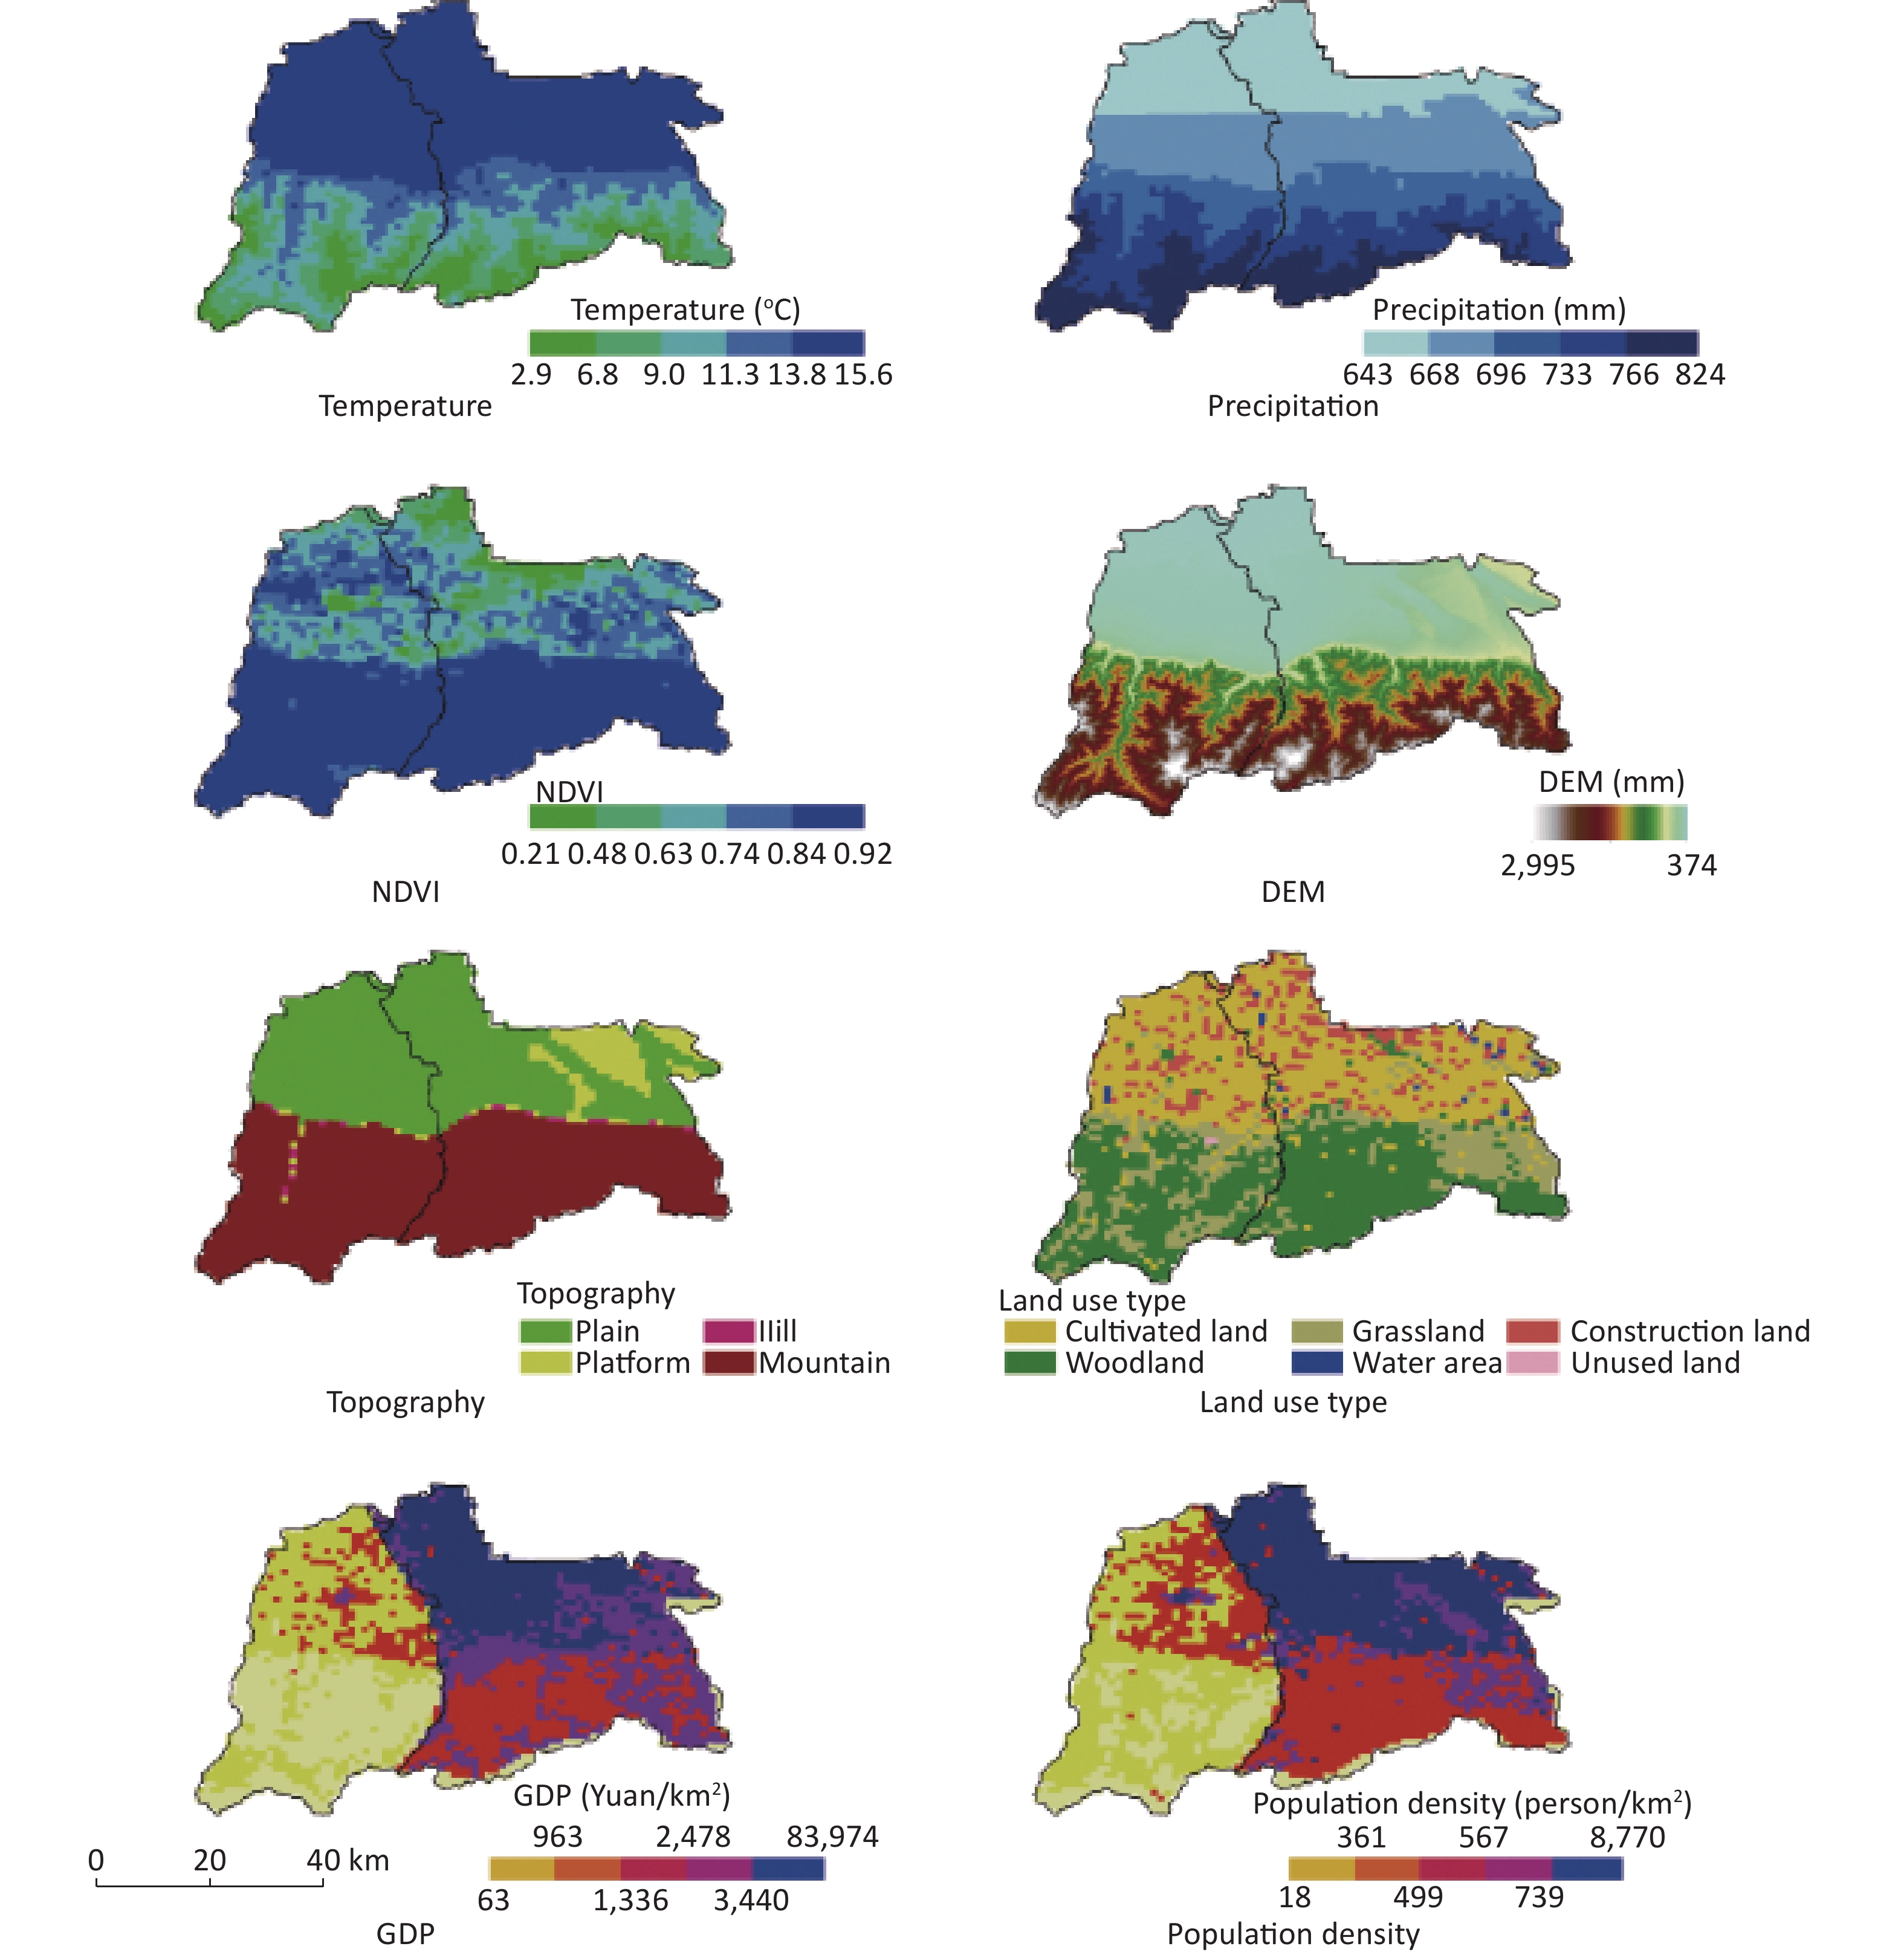
Natural Environmental and Socio-economic Data According to previous studies on the influencing factors of the HFRS epidemic and the availability of data, information on environmental variables, including temperature, precipitation, normalized difference vegetation index (NDVI), digital elevation model (DEM), topography, land use, GDP, and population density (Table 1), were collected to build the MaxEnt model and analyze its influence on the HFRS epidemic. These variables effectively represent the climate characteristics, natural surface environment, and socioeconomic characteristics in the interior of the study area. Figure 2 shows a spatial distribution map of environmental variables in Chang’an District and Hu County in 2015. All environmental data were obtained from the Resource and Environmental Data Cloud Platform of the Resource and Environmental Science Data Center of the Chinese Academy of Sciences (http://www.resdc.cn/). The spatial resolution of all the variables was 1 km.
Factors Data Variable Time scale Data type Meteorological factors Temperature average annual temperature 2014–2016 Continuous Precipitation average annual precipitation 2014–2016 Continuous Landscape factors NDVI annual NDVI 2014–2016 Continuous DEM DEM Permanent Continuous Topography plain, platform, hill, mountain Permanent Categorical Socio-economic factors Land use type cultivated land, woodland, grassland, water area,
construction land, unused land2015 Categorical GDP 1 km grid GDP data 2015 Continuous Population density 1 km grid population density data 2015 Continuous Note. NDVI, normalized difference vegetation index; DEM, digital elevation model; GDP, Gross Domestic Product. Table 1. Variables used to construct MaxEnt model in this study
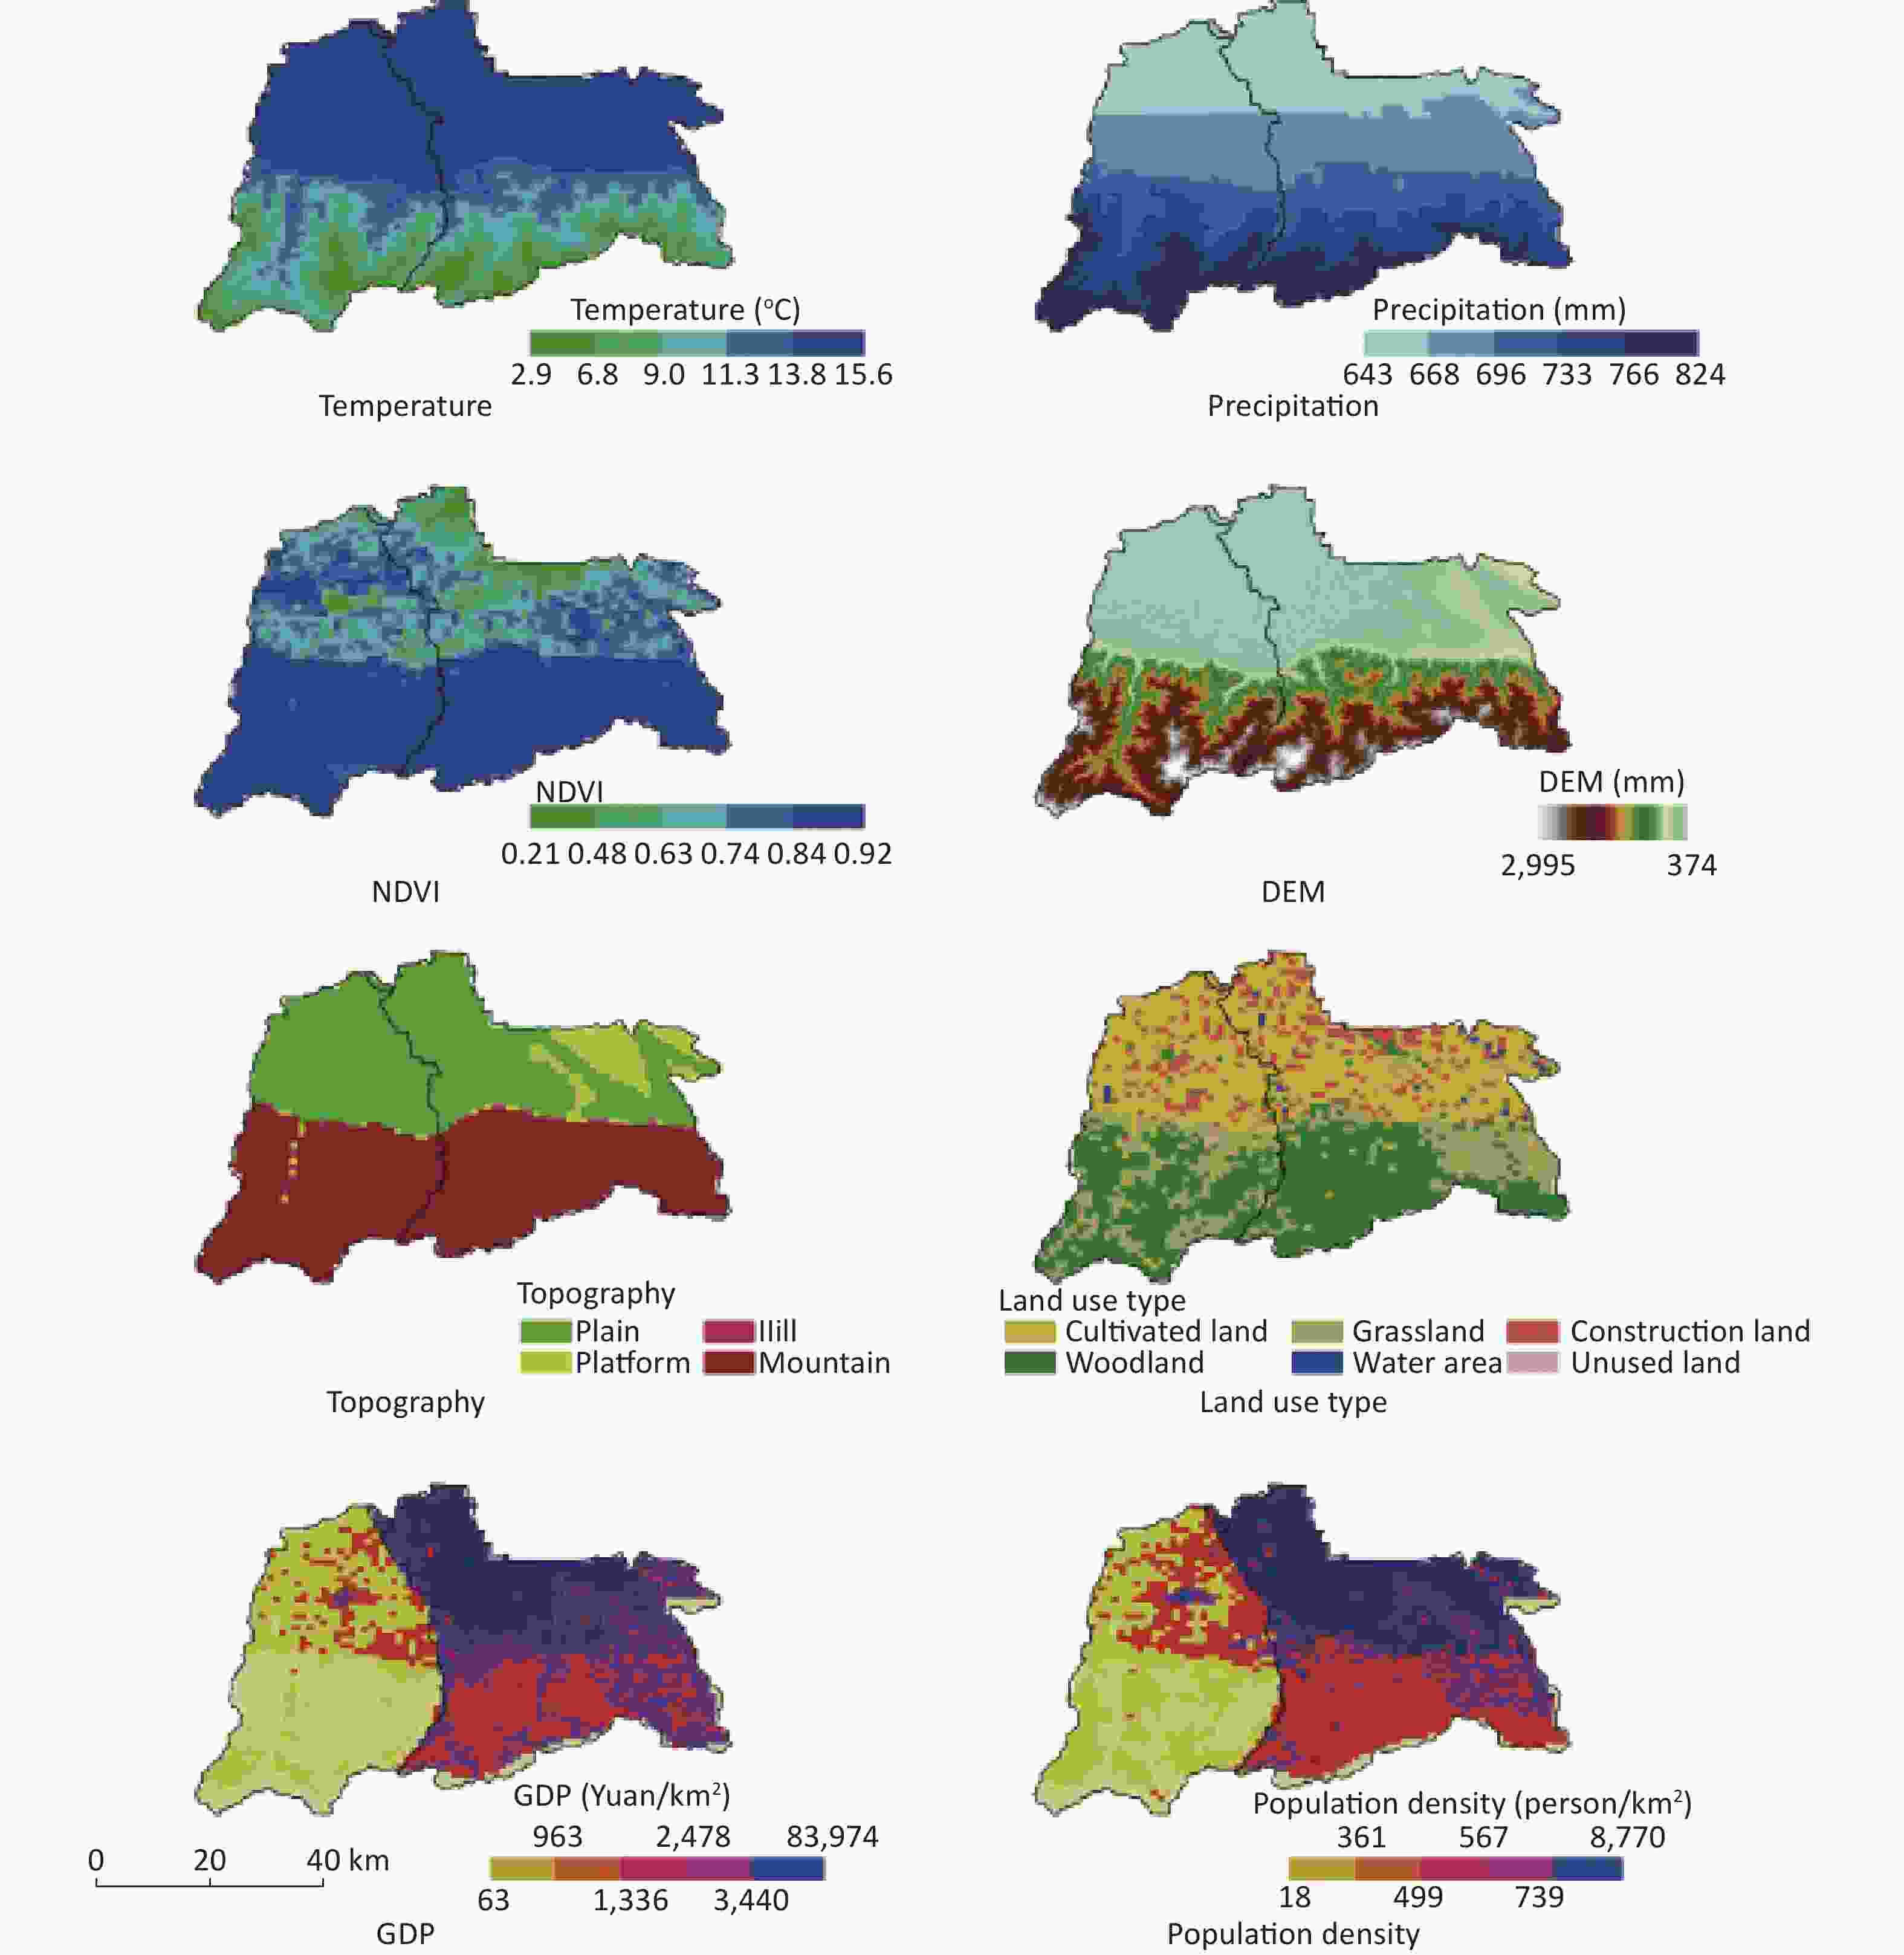
Figure 2. Spatial distribution map of environmental variables in Chang'an District and Hu County in 2015. NDVI, normalized difference vegetation index; DEM, digital elevation model; GDP, Gross Domestic Product.
-
Maximum Entropy Model (MaxEnt Model) The MaxEnt model is a general-purpose machine learning technology based on the principle of maximum entropy that uses known case points and a set of predictor variables to estimate disease distributions [29-30]. In this study, we assumed that the study area
$ X $ was composed of a finite number of grid cells,$ \pi $ was the distribution of HFRS cases in the study area,$ \pi \left(x\right) $ was the value assigned to each unit$ x $ by the distribution of$ \pi $ , and their sum was 1. Given the various predictor variables$ {f}_{j}(j=\mathrm{1,2},\cdots ,n) $ (Equations 1 and 2), according to the approximate expected distribution of$ \pi $ , the entropy of$\widetilde{\pi }$ (Equation 3) gives the distribution with the largest entropy as the HFRS optimal distribution:$$ \widetilde{\pi }\left[{f}_{j}\right]=\frac{1}{m}{\sum }_{i=1}^{m}{f}_{j}\left({x}_{i}\right) $$ (1) $$ \widehat{\pi }\left[{f}_{j}\right]=\widetilde{\pi }\left[{f}_{j}\right] $$ (2) $$ H\left(\widehat{\pi }\right)=-{\sum }_{x\in X}\widehat{\pi }\left(x\right)\widehat{\mathit{ln}\pi }\left(x\right) $$ (3) where
$ H\left(\widehat{\pi }\right) $ is the entropy of the expected distribution$ \widehat{\pi } $ ,$ {x}_{i} $ is the i-th unit of$ X $ in the study area,$ m $ is the number of units,$ {f}_{j} $ is the environmental variable, and$\widetilde{\pi }\left[{f}_{j}\right]$ is the sample point where the environment variable is at the prior mean value under the distribution,$ \stackrel{~}{\pi } $ .The probability distribution of the maximum entropy method is the same as that of the Gibbs probability distribution (Equation 4), and both maximize the similarity of all the sample points and reduce the loss function (Equation 5). With the variables used by Maxent being empirical rather than determined actual values, overfitting the training data is possible. To reduce overfitting, it is necessary to relax the limits of the environmental variables appropriately (Equation 6). Simultaneously, to enable Maxent to effectively select important environmental variables, the Gibbs distribution that minimizes the logarithmic loss and limits the excessive weight of the environmental variables
$ {\lambda }_{j} $ (Equation 7) is used to represent the probability distribution of the maximum entropy value:$$ {q}_{\lambda }\left(x\right)=\frac{{e}^{\lambda \cdot f\left(x\right)}}{{Z}_{\lambda }} $$ (4) $$ \widetilde{\pi }\left[-\mathit{ln}({q}_{\lambda })\right] $$ (5) where
$ \lambda $ is a vector representing the weight of all environmental variables,$ f $ is a vector of all environmental variables, and$ {Z}_{\lambda } $ is a standardized constant to ensure that the sum of$ {q}_{\lambda } $ is 1.$$ \left|\widehat{\pi }\left[{f}_{j}\right]-\widetilde{\pi }\left[{f}_{j}\right]\right|\le {\beta }_{j} $$ (6) $$ \widetilde{\pi }\left[-\mathit{ln}({q}_{\lambda })\right]+{\sum }_{j}{\beta }_{j}\left|{\lambda }_{j}\right| $$ (7) Here,
$ {\beta }_{j} $ is a constant,$\widetilde{\pi }\left[-\mathit{ln}({q}_{\lambda })\right]$ is a loss function, and$ {\sum }_{j}{\beta }_{j}\left|{\lambda }_{j}\right| $ represents the restriction on the weight of the environmental variables.MaxEnt models were constructed by MaxEnt 3.3.3k software by importing the HFRS case distribution and environmental data into the “Samples” and “Environmental layers” of the model, respectively, and selecting 75% of the case distribution data as the training sample, with the remaining 25% of the case distribution data being used as the test sample. The model was run 10 times independently, with the model repeatedly generated by bootstrapping the training and test samples for each run. The maximum number of background points was set to 10,000, and the option to “add samples to background” was checked. The resulting output format was selected as “logistic,” and each grid value of the output result ranged from 0 to 1, representing the spread risk of the HFRS epidemic. The output result of the model was divided into two empirical thresholds generated by the model, that is, the “maximum training sensitivity plus specificity logistic threshold” and “balance training omission, predicted area, and threshold value logistic threshold”.
Model Construction and Evaluation To compare the similarities and differences of factors influencing HFRS epidemics in regions with different levels of economic development, MaxEnt models were built based on HFRS case data from 2014 to 2016 and meteorological, landscape, and socioeconomic data after correlation analysis, and the fitting effect of the model was tested according to the area under the curve (AUC).
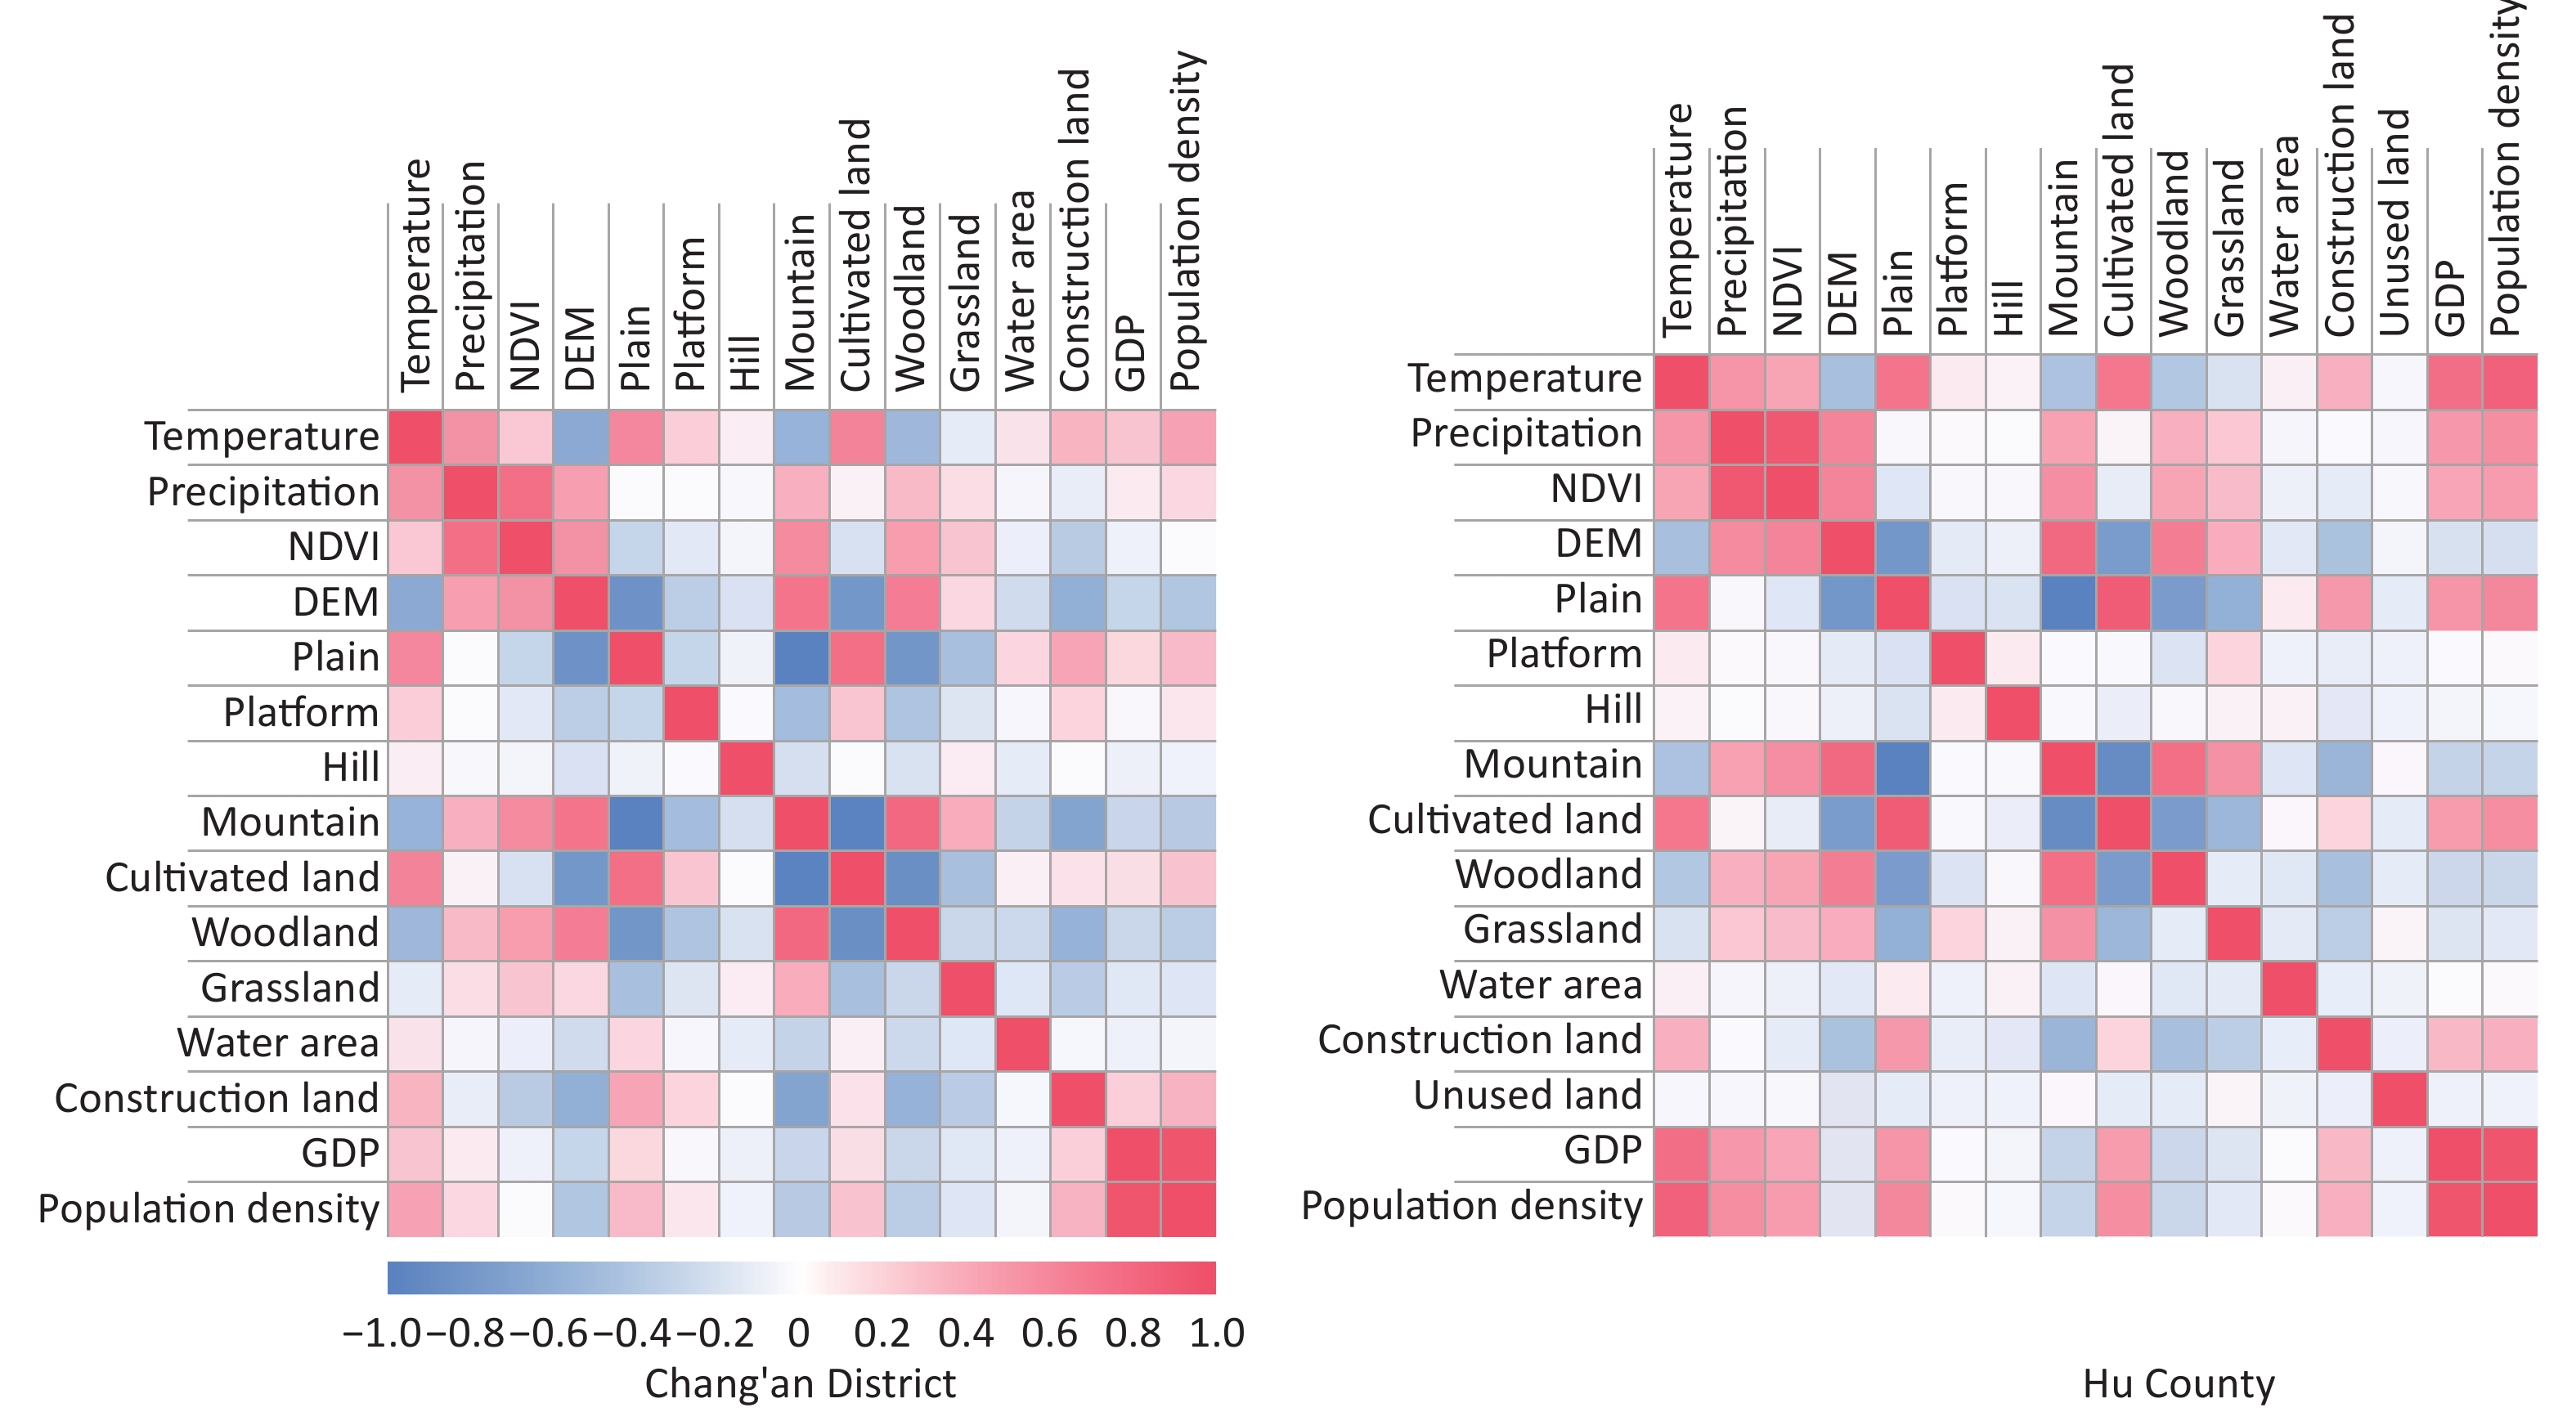
A high degree of correlation between variables may affect the output results of the MaxEnt model [31-32]. There is a collinearity problem among the environmental variables participating in MaxEnt model construction. This study first calculated the correlation coefficients between all environmental variables (Figure 3). With the very high correlation between GDP and population density, the optimal model was selected based on the model fitting results, and the environmental variables were finally selected, including temperature, precipitation, NDVI, DEM, topography, land use type, and population density, to analyze the influencing factors of the HFRS epidemic.
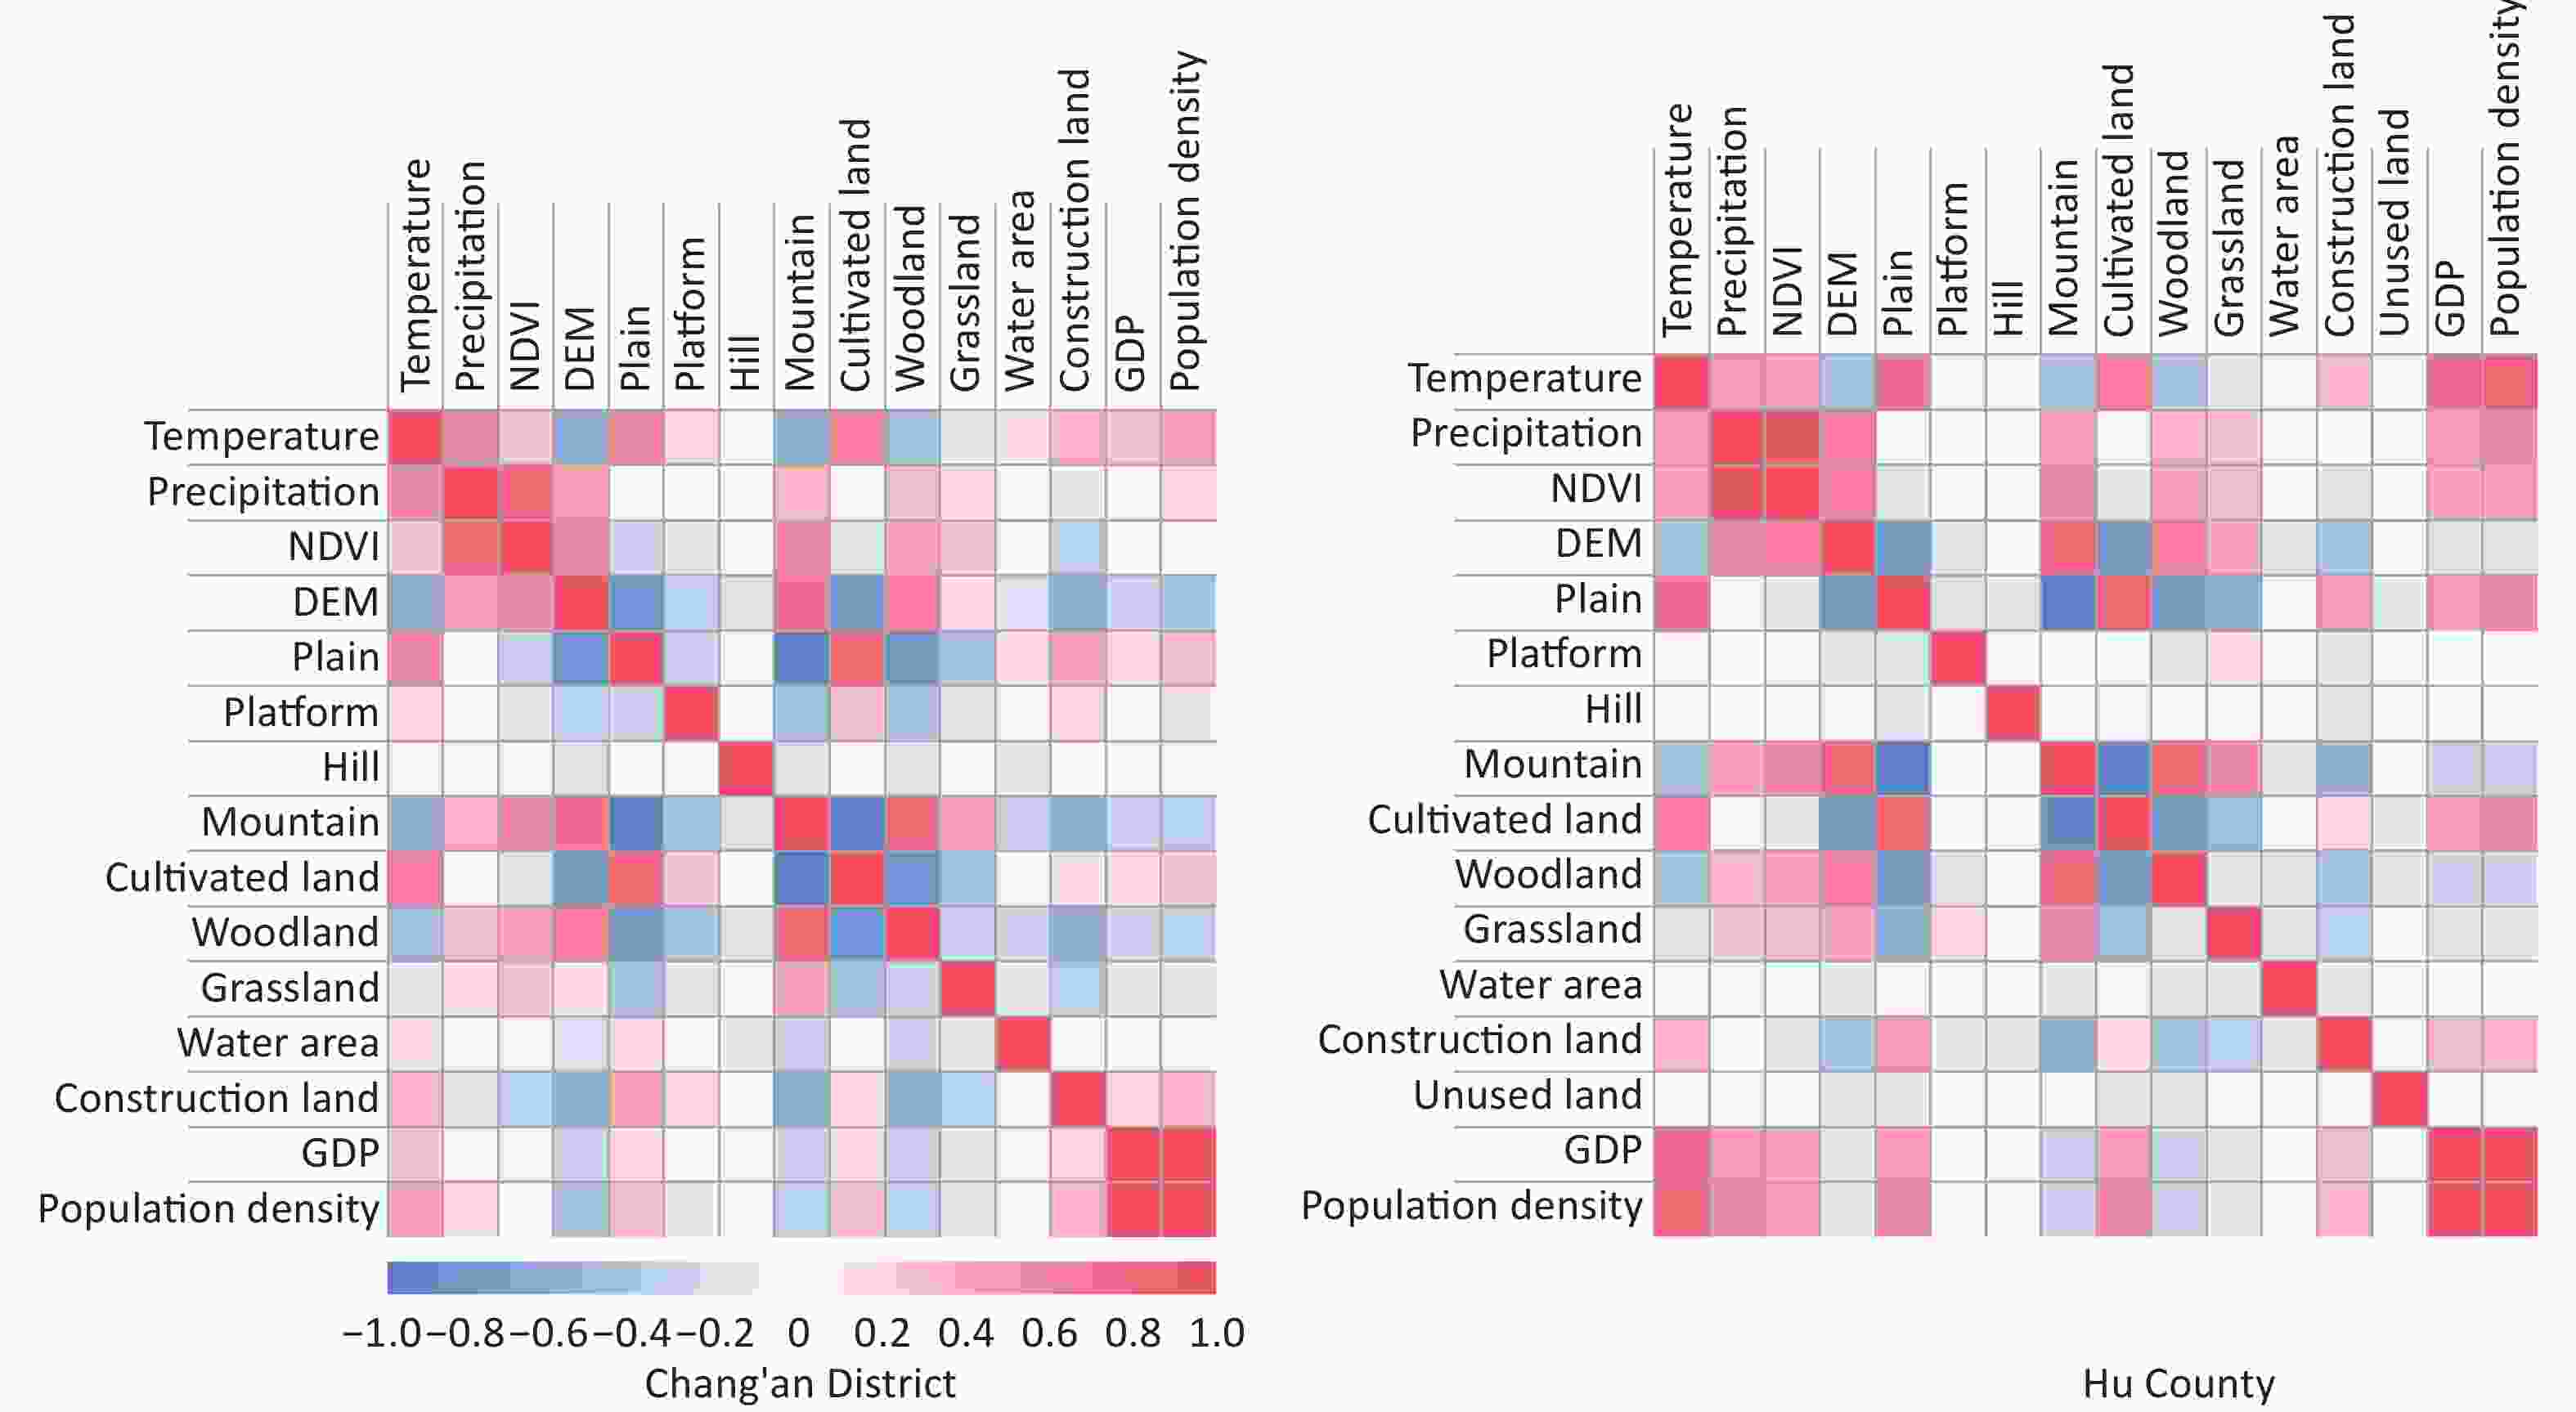
Figure 3. Correlation coefficient between environmental variables in Chang'an District and Hu County. NDVI, normalized difference vegetation index; DEM, digital elevation model; GDP, Gross Domestic Product.
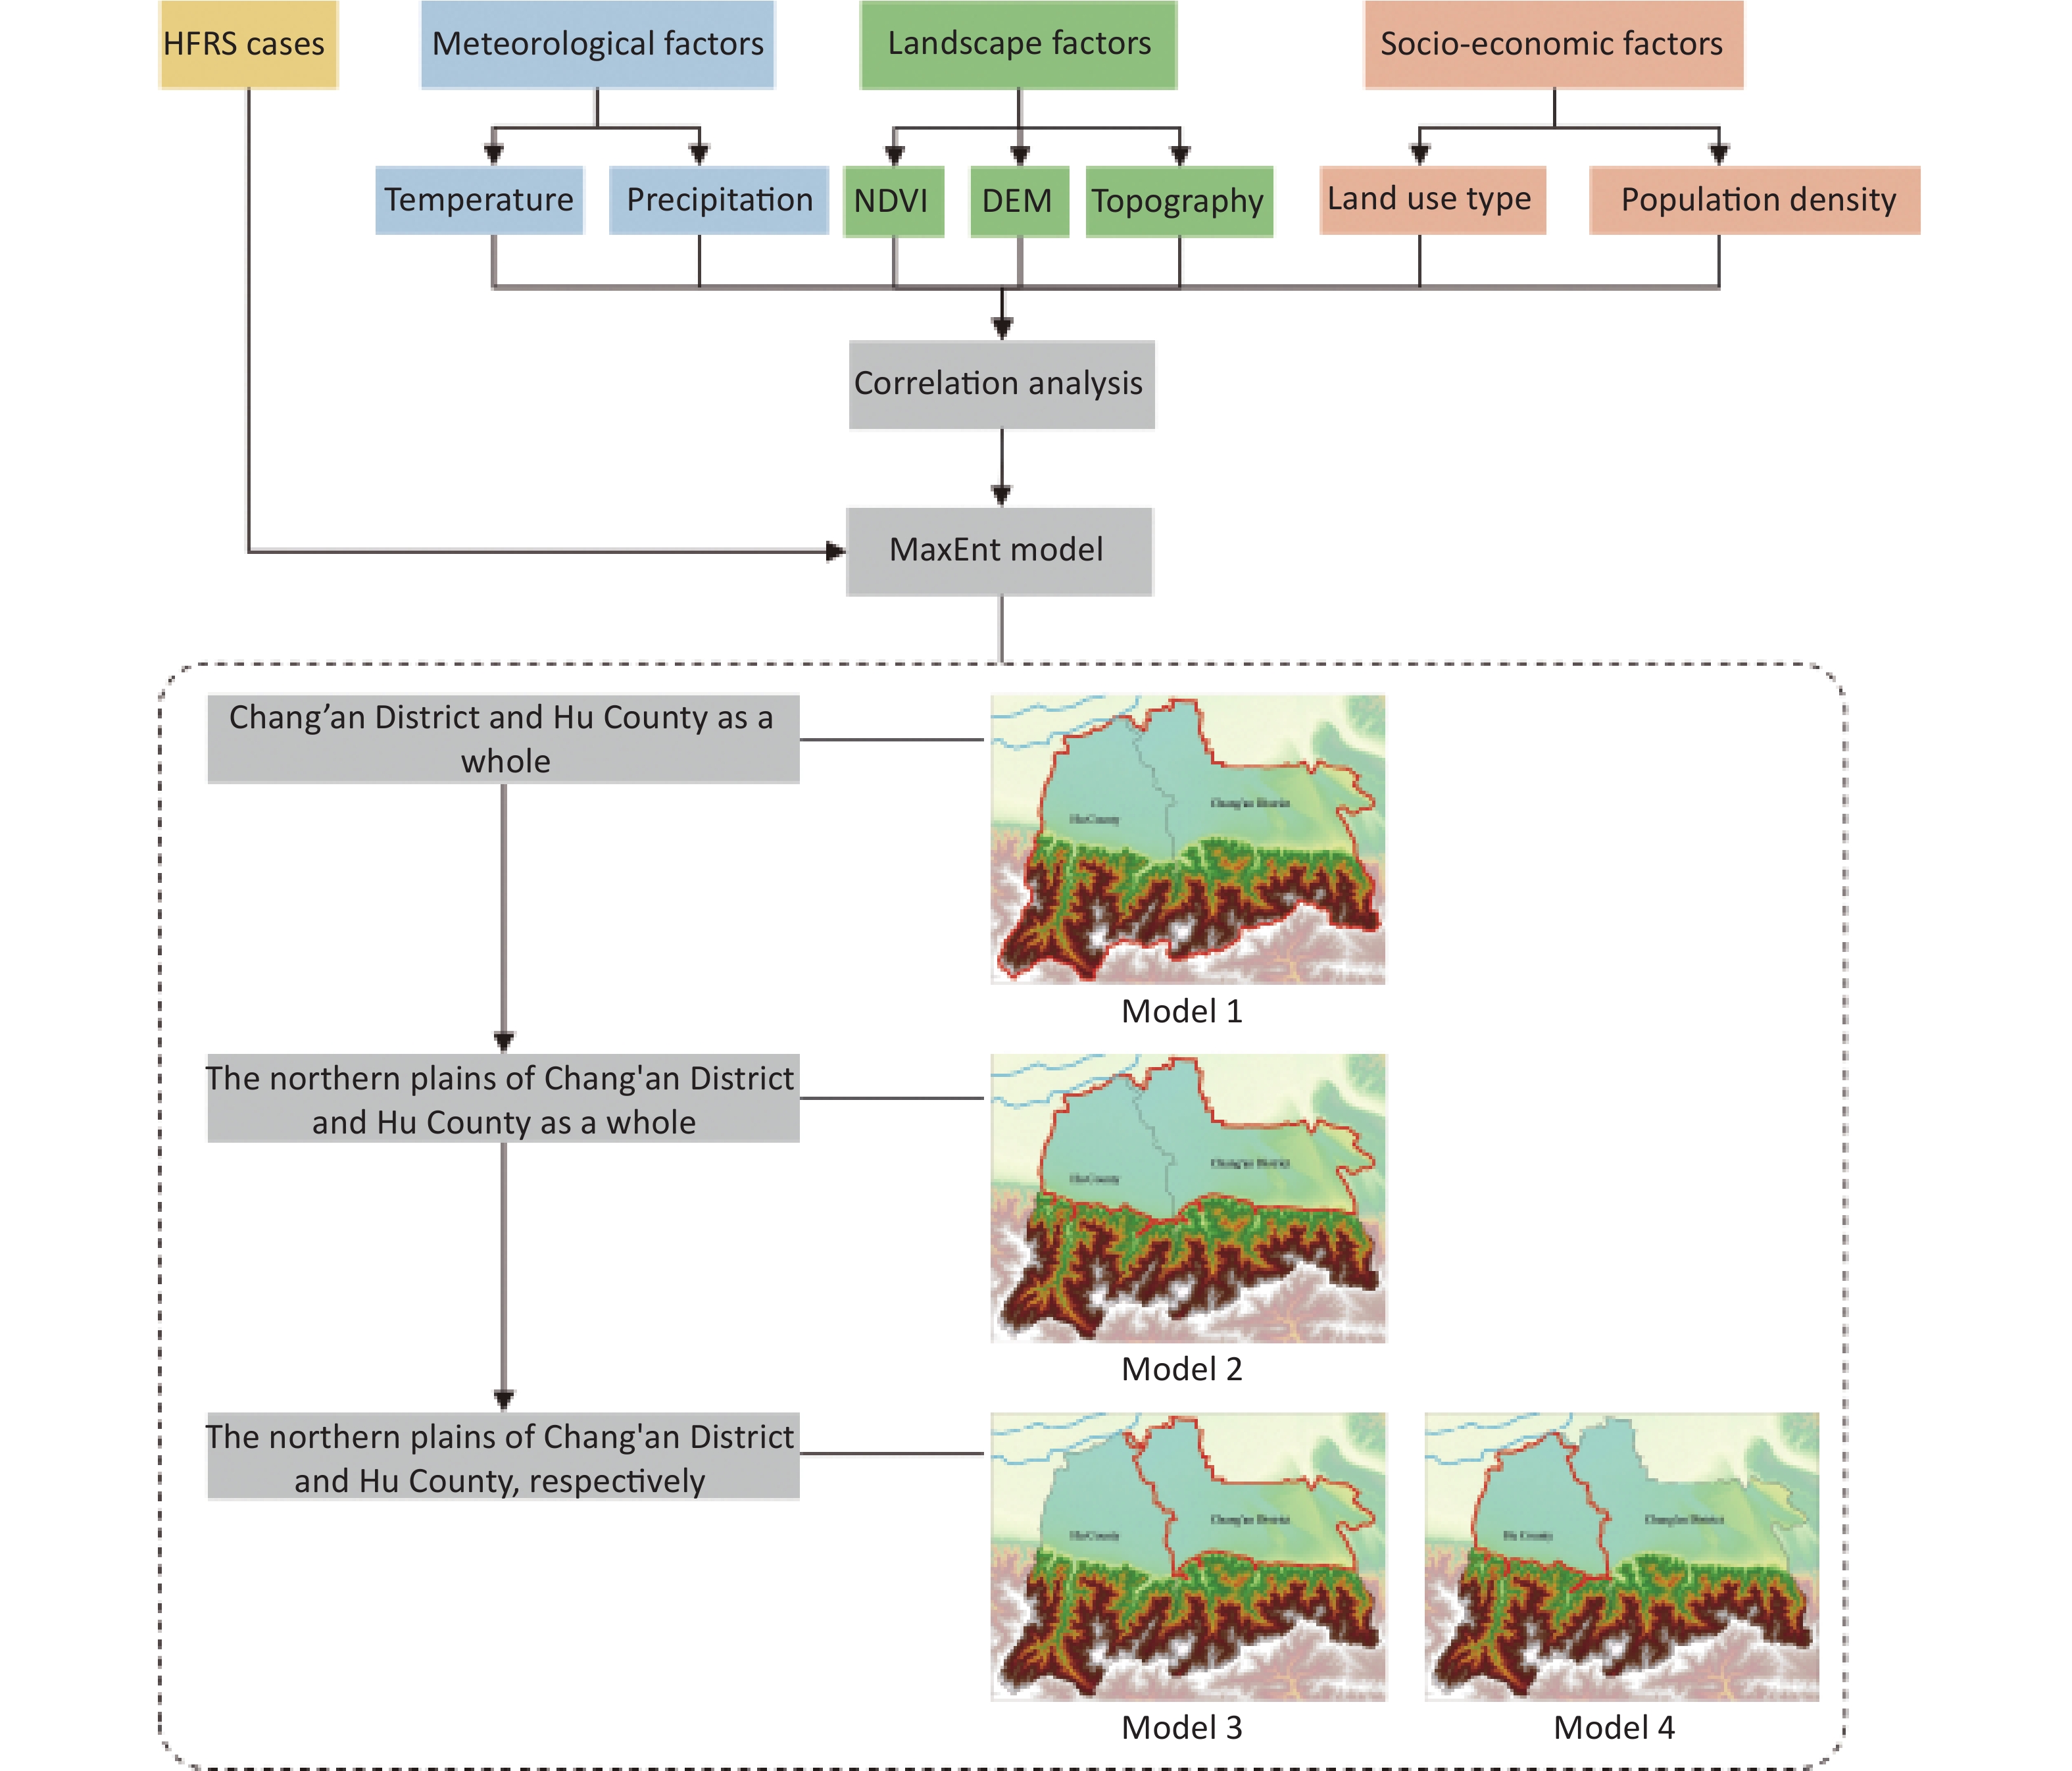
Figure 4 shows a flowchart of MaxEnt model construction. To analyze the risk factors influencing HFRS epidemic in Chang’an District and Hu County, the MaxEnt model was first constructed with Chang’an District and Hu County as a whole (Model 1) to analyze the dominant influencing factors of the epidemic situation in the overarching area. To analyze influencing factors other than topography, both northern plains were taken as a whole to construct a MaxEnt model (Model 2) to analyze the main influencing factors of HFRS spatial differentiation in the northern plains since more than 95% of the cases in Chang’an District and Hu County were located in their northern plains. As such, to compare the similarities and differences of factors influencing the HFRS epidemic in regions with different levels of economic development, two MaxEnt models were constructed for the northern plains of Chang’an District and Hu County (Models 3 and 4, respectively).
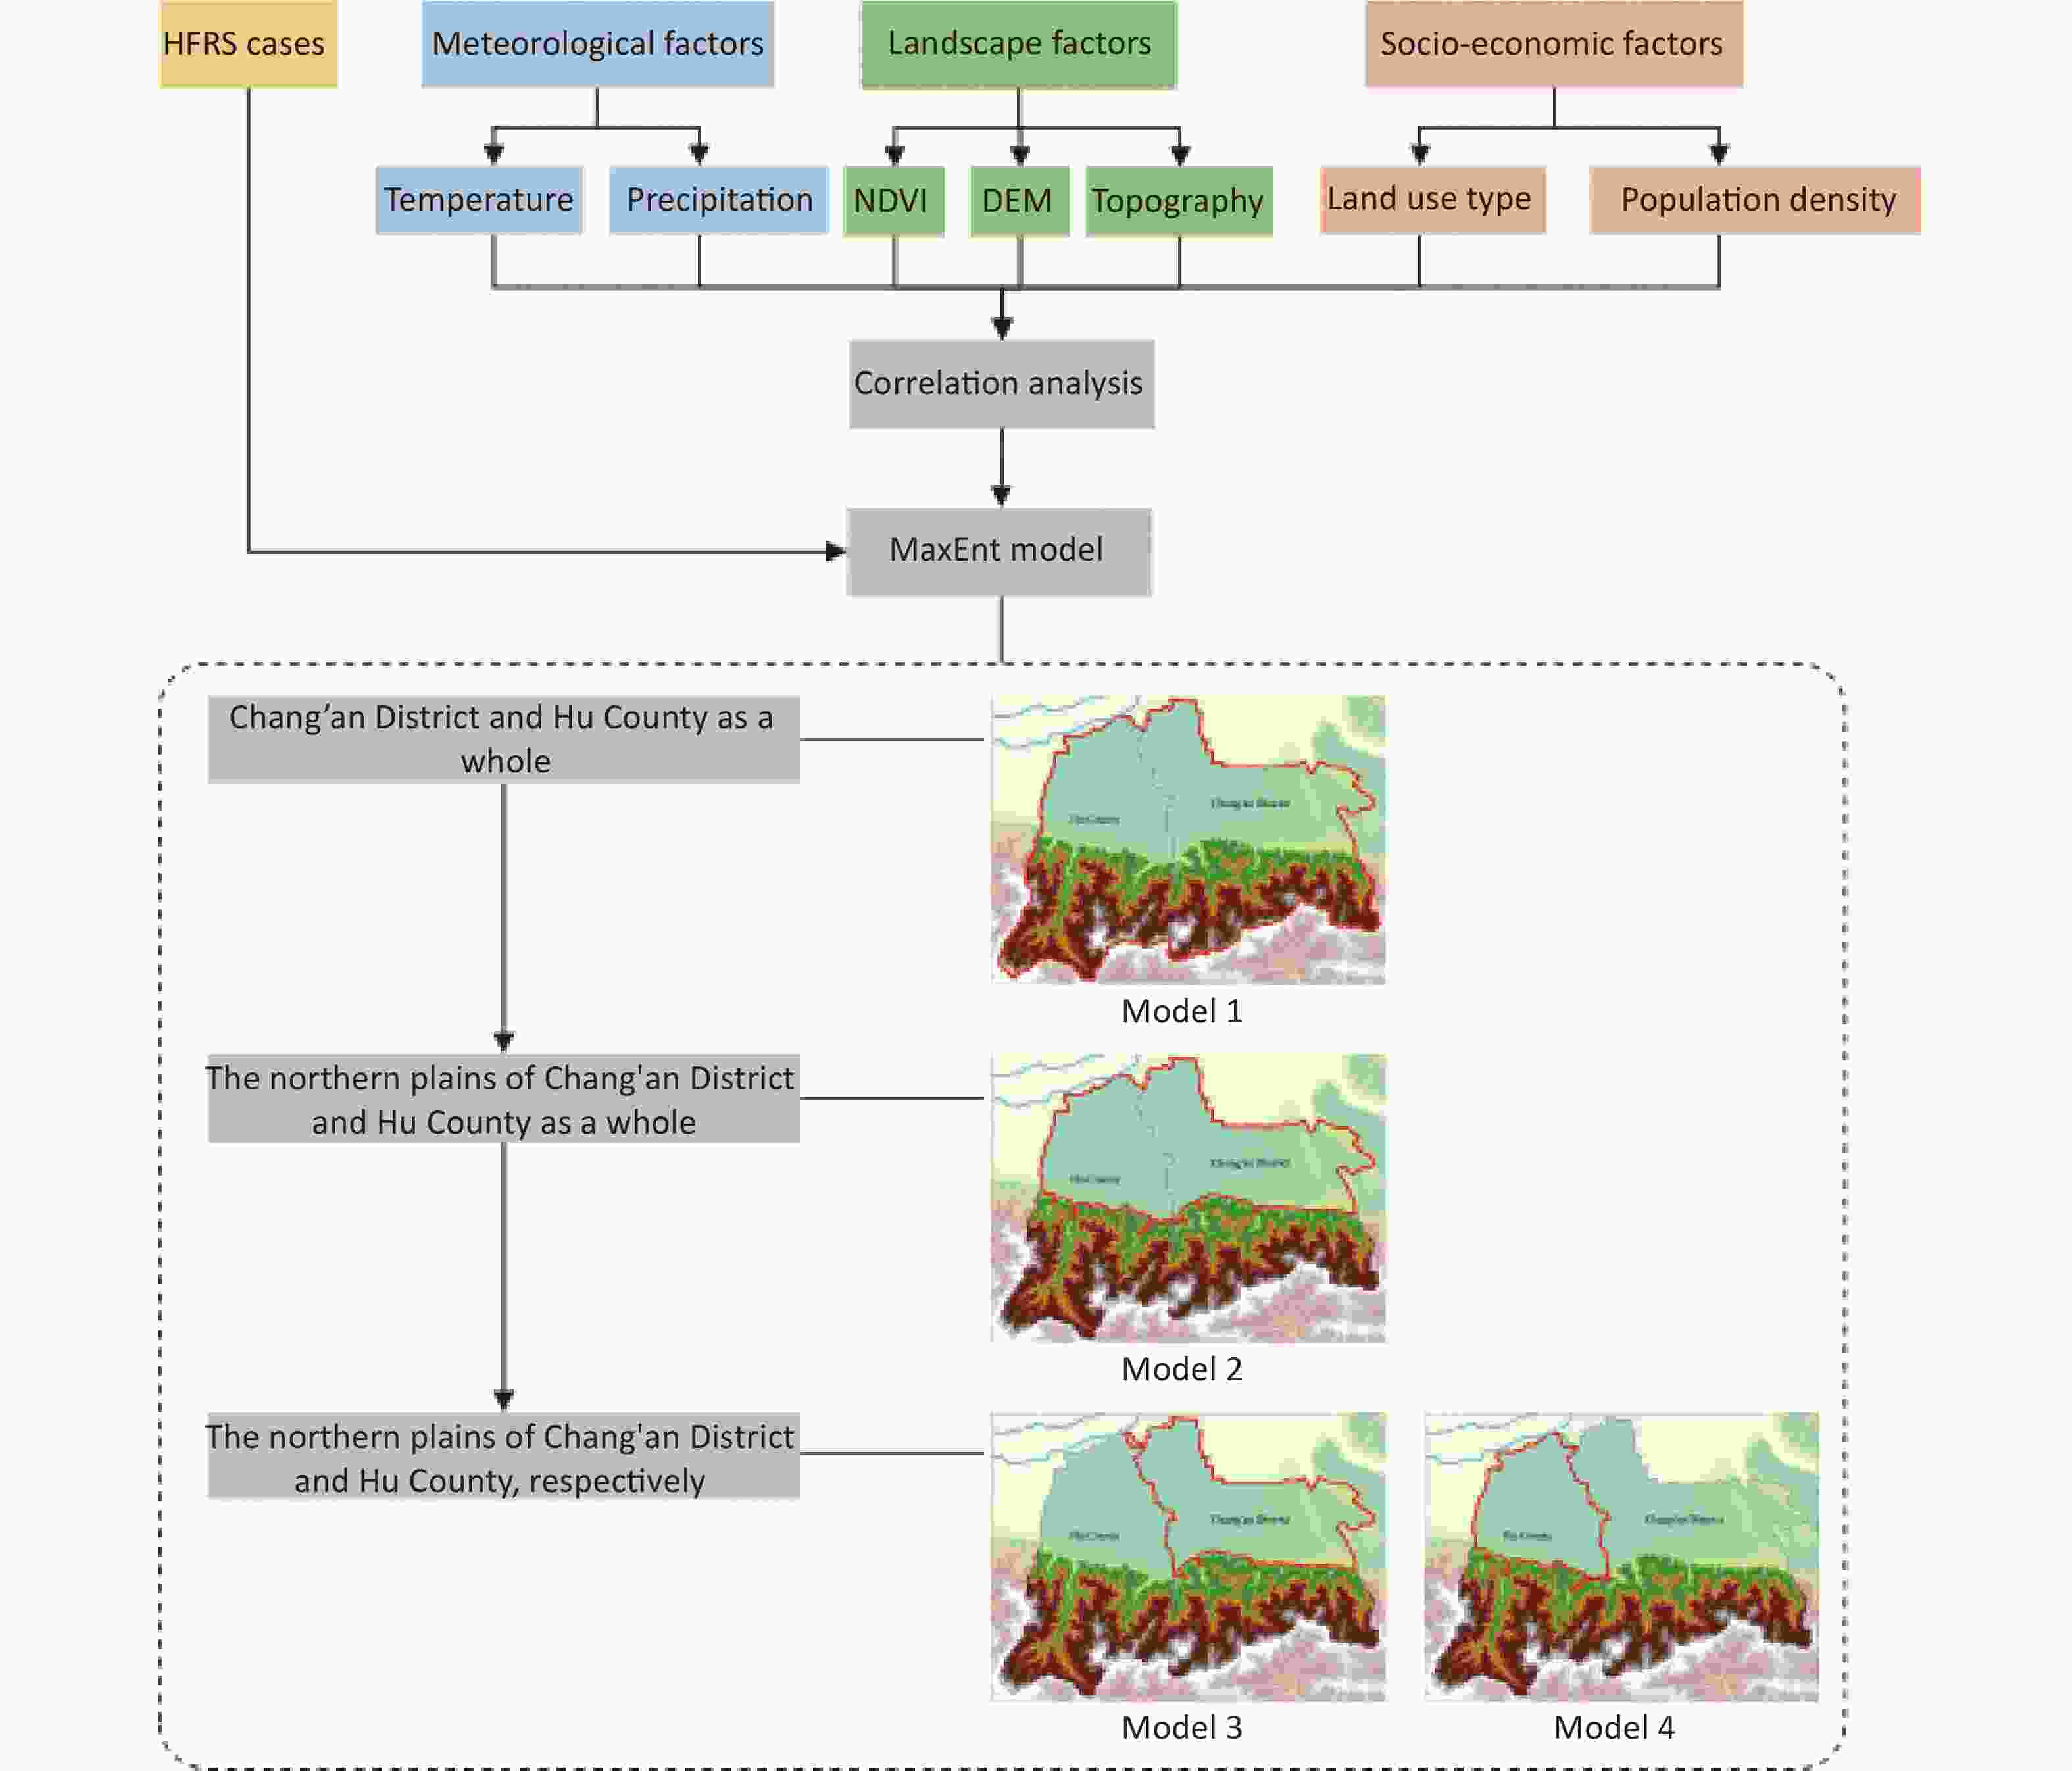
Figure 4. The flowchart of MaxEnt model construction.
To evaluate the results of the model, we divided the HFRS case-distribution data into two parts. We used 75% of the HFRS case data from 2014 to 2016 as the training sample and the remaining 25% of the HFRS case data as the test sample. Meanwhile, during the modeling process, the training and test samples were combined with 10,000 background points to draw the receiver operating characteristic curve (ROC), and the AUC was calculated. Each value of the predicted result was used as a possible judgment threshold using the ROC curve, and the corresponding sensitivity and specificity were calculated. The false-positive rate, that is, the specificity, was plotted as the abscissa, and the true-positive rate, that is, the sensitivity, was plotted as the ordinate. AUC can be used as a measure of the prediction accuracy of the model, with its value ranging from 0 to 1. The larger the value, the stronger the judgment of the model [33]. It is generally considered that the diagnostic value is low when AUC is between 0.5 and 0.7, medium when AUC is between 0.7 and 0.9, and high when AUC is greater than 0.9 [34-36].
-
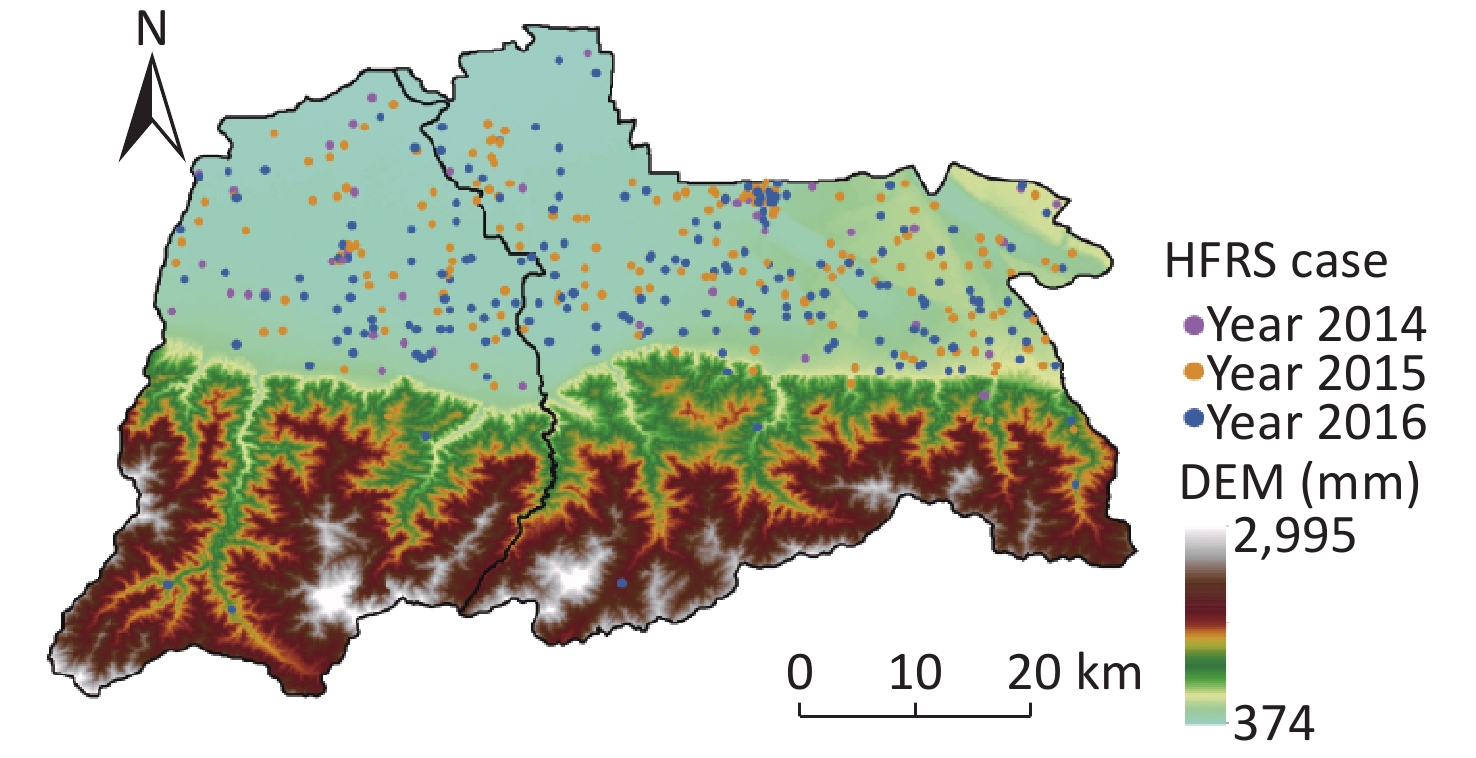
The annual HFRS incidences of Chang’an District were 6.305/105, 22.048/105, and 16.813/105 from 2014 to 2016, while those of Hu County were 5.451/105, 11.571/105, and 11.923/105 for the same period. The annual HFRS incidences in these areas were far higher than that in Shaanxi Province, which were 2.761/105, 3.706/105, and 2.460/105, respectively. According to the spatial distribution of HFRS cases, more than 95% of HFRS cases were in northern areas with altitudes of less than 800 m (Figure 5). In areas with densely distributed HFRS cases, the topography was dominated by plains, while there were a few cases scattered along the valley in the southern region. Meanwhile, the difference in the spatial distribution of the two places was that the distribution of HFRS cases in Chang’an District was closer to the southern mountainous area than in Hu County. The spatial distribution results showed that the HFRS cases in this area were densely distributed in the northern low-altitude plain.

Figure 5. Distribution of HFRS cases in Chang'an District and Hu County from 2014 to 2016.
-
Table 2 shows the training and test AUCs of the four MaxEnt models. Taking Chang’an District and Hu County as a whole (Model 1), the AUC value of the MaxEnt model reached 0.78. In the northern plains, where more than 95% of the cases were distributed (Model 2), the AUC value of the MaxEnt model reached 0.61. To analyze the effects of economic variables on HFRS epidemic in areas with different economic development stages, the model AUCs of the plains in Chang’an District (Model 3) and Hu County (Model 4) were 0.56 and 0.61, respectively. Considering the entire area (Model 1), the model was satisfactory, which indicated that the model we built in this area was efficient in explaining the influencing factors. Excluding landscape, the AUC of the other models (Models 2, 3, and 4) decreased; however, these models were also efficient in explaining the other key influencing factors in the plain areas owing to the satisfying effects of the whole area model.
Model Area Training AUC Test AUC Model 1 Chang’an District and Hu County as a whole 0.80 0.78 Model 2 The northern plains of Chang’an District and Hu County as a whole 0.65 0.61 Model 3 The northern plains of Chang’an District 0.65 0.56 Model 4 The northern plains of Hu County 0.69 0.61 Table 2. MaxEnt model results in different areas
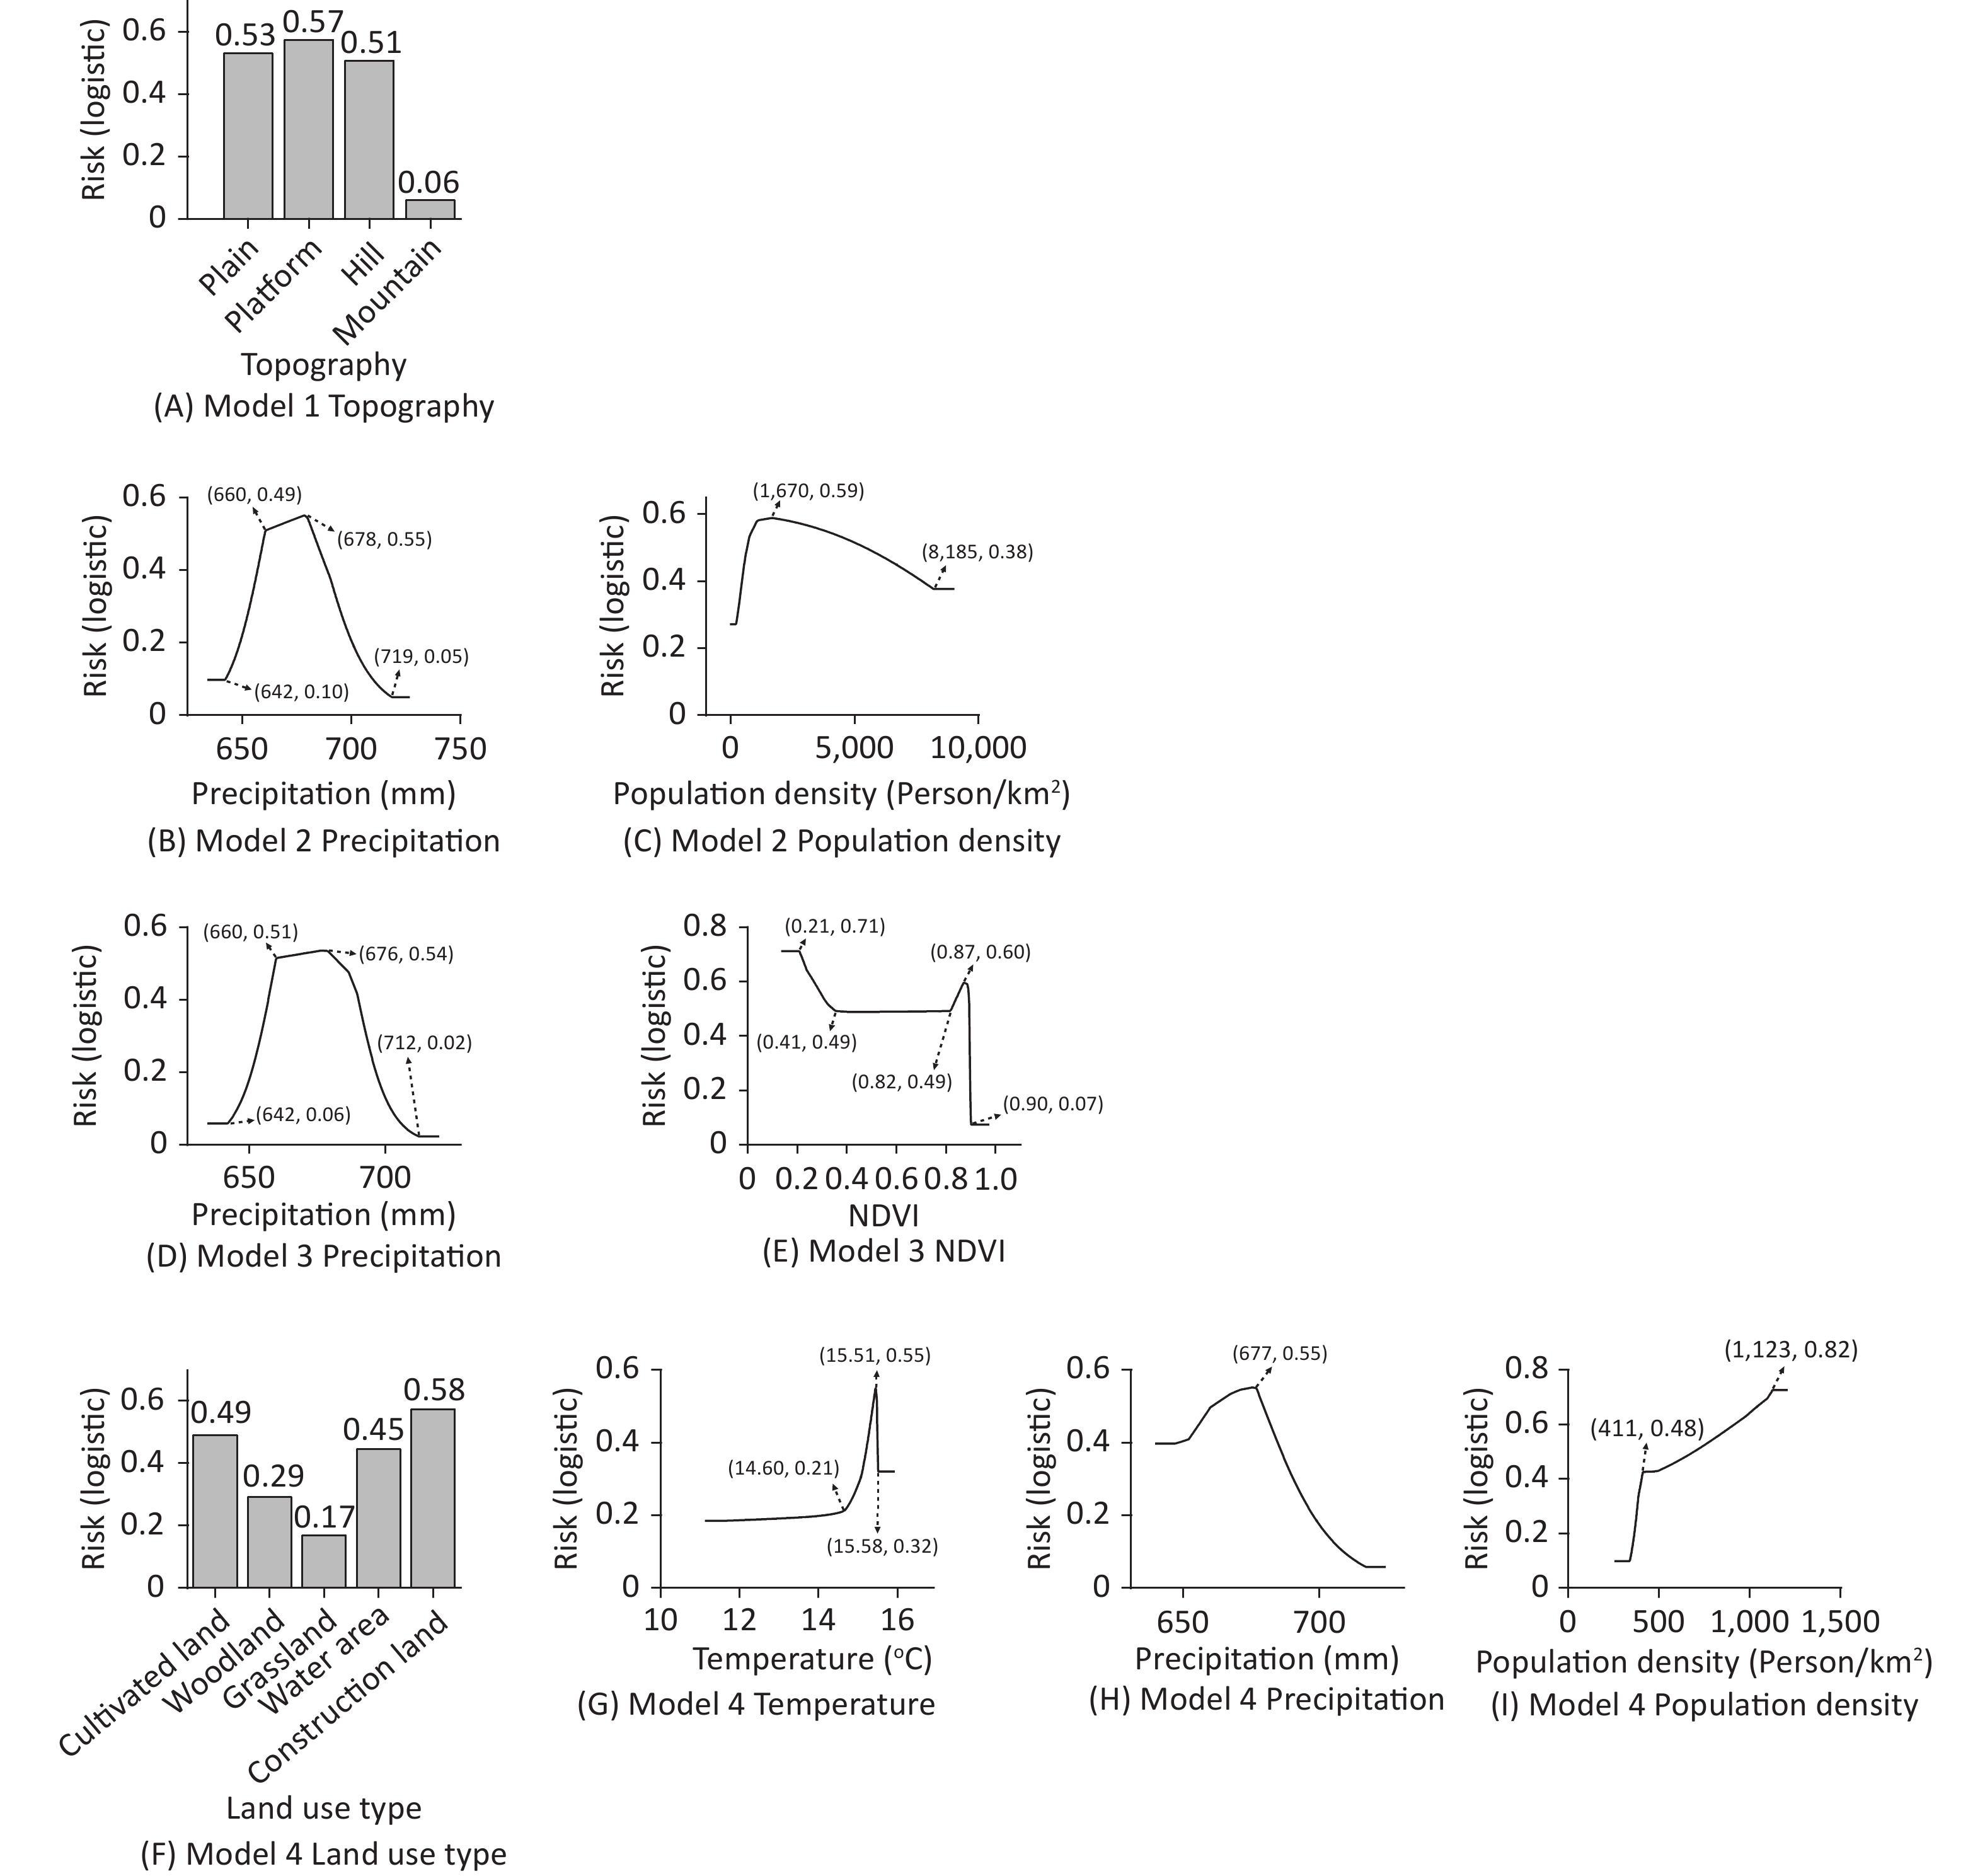
The MaxEnt model results (Table 3) showed that topography type was the environmental variable with the highest contribution to the MaxEnt model in the whole area (Model 1), reaching 84.1%, which was a key variable influencing the spatial distribution of HFRS cases. Additionally, precipitation and population density contributed 8.9% and 5.4%, respectively, to the MaxEnt model. Excluding the impact of topography, the spatial distribution of the HFRS epidemic was closely related to the precipitation and population density in the northern plains of the total area (Model 2), with contribution rates were 60.7% and 28.0%, respectively. Considering only the northern plains of Chang’an District, precipitation and NDVI jointly affected the spatial distribution of HFRS epidemic (Model 3), with contribution rates reaching 66.4% and 25.2%, respectively. In the northern plains of Hu County, land-use type, temperature, precipitation, and population density had the highest contribution rates to the spatial distribution of the HFRS epidemic in the plains of Hu County (Model 4), reaching 32.3%, 31.2%, 16.9%, and 16.8%, respectively. These results showed that topography was the dominant factor influencing the HFRS epidemic in Chang’an District and Hu County and that precipitation and population density jointly affected the HFRS epidemic in the northern plains. Furthermore, in the northern plain of Chang’an District, the HFRS epidemic was primarily influenced by natural environmental factors while in the northern plain of Hu County, it was primarily influenced by socioeconomic factors and meteorological factors.
Variable Model 1, % (n) Model 2, % (n) Model 3, % (n) Model 4, % (n) Topography 84.1 (1) — — — Precipitation 8.9 (2) 60.7 (1) 66.4 (1) 16.9 (3) Population density 5.4 (3) 28.0 (2) 3.1 (4) 16.8 (4) NDVI 0.7 (4) 6.8 (3) 25.2 (2) 2.8 (5) DEM 0.4 (5) — — — Temperature 0.4 (6) 1.4 (5) 4.2 (3) 31.2 (2) Land use type 0.1 (7) 3.1 (4) 1.1 (5) 32.3 (1) Note. Model 1, 2, 3, and 4 were built for Chang’an District and Hu County as a whole, the plains of Chang’an District and Hu County, the plains of Chang’an District and the plains of Hu County, respectively. NDVI, normalized difference vegetation index; DEM, digital elevation model. Table 3. Contribution rates (%) and ranking of environmental variables in the MaxEnt models
-
The topography was the dominant factor in this area. From the HFRS risk values of different landform types (Figure 6A), plains, platforms, and hills were identified as the main risk factors influencing the HFRS epidemic, and mountains had the lowest risk of HFRS spreading.
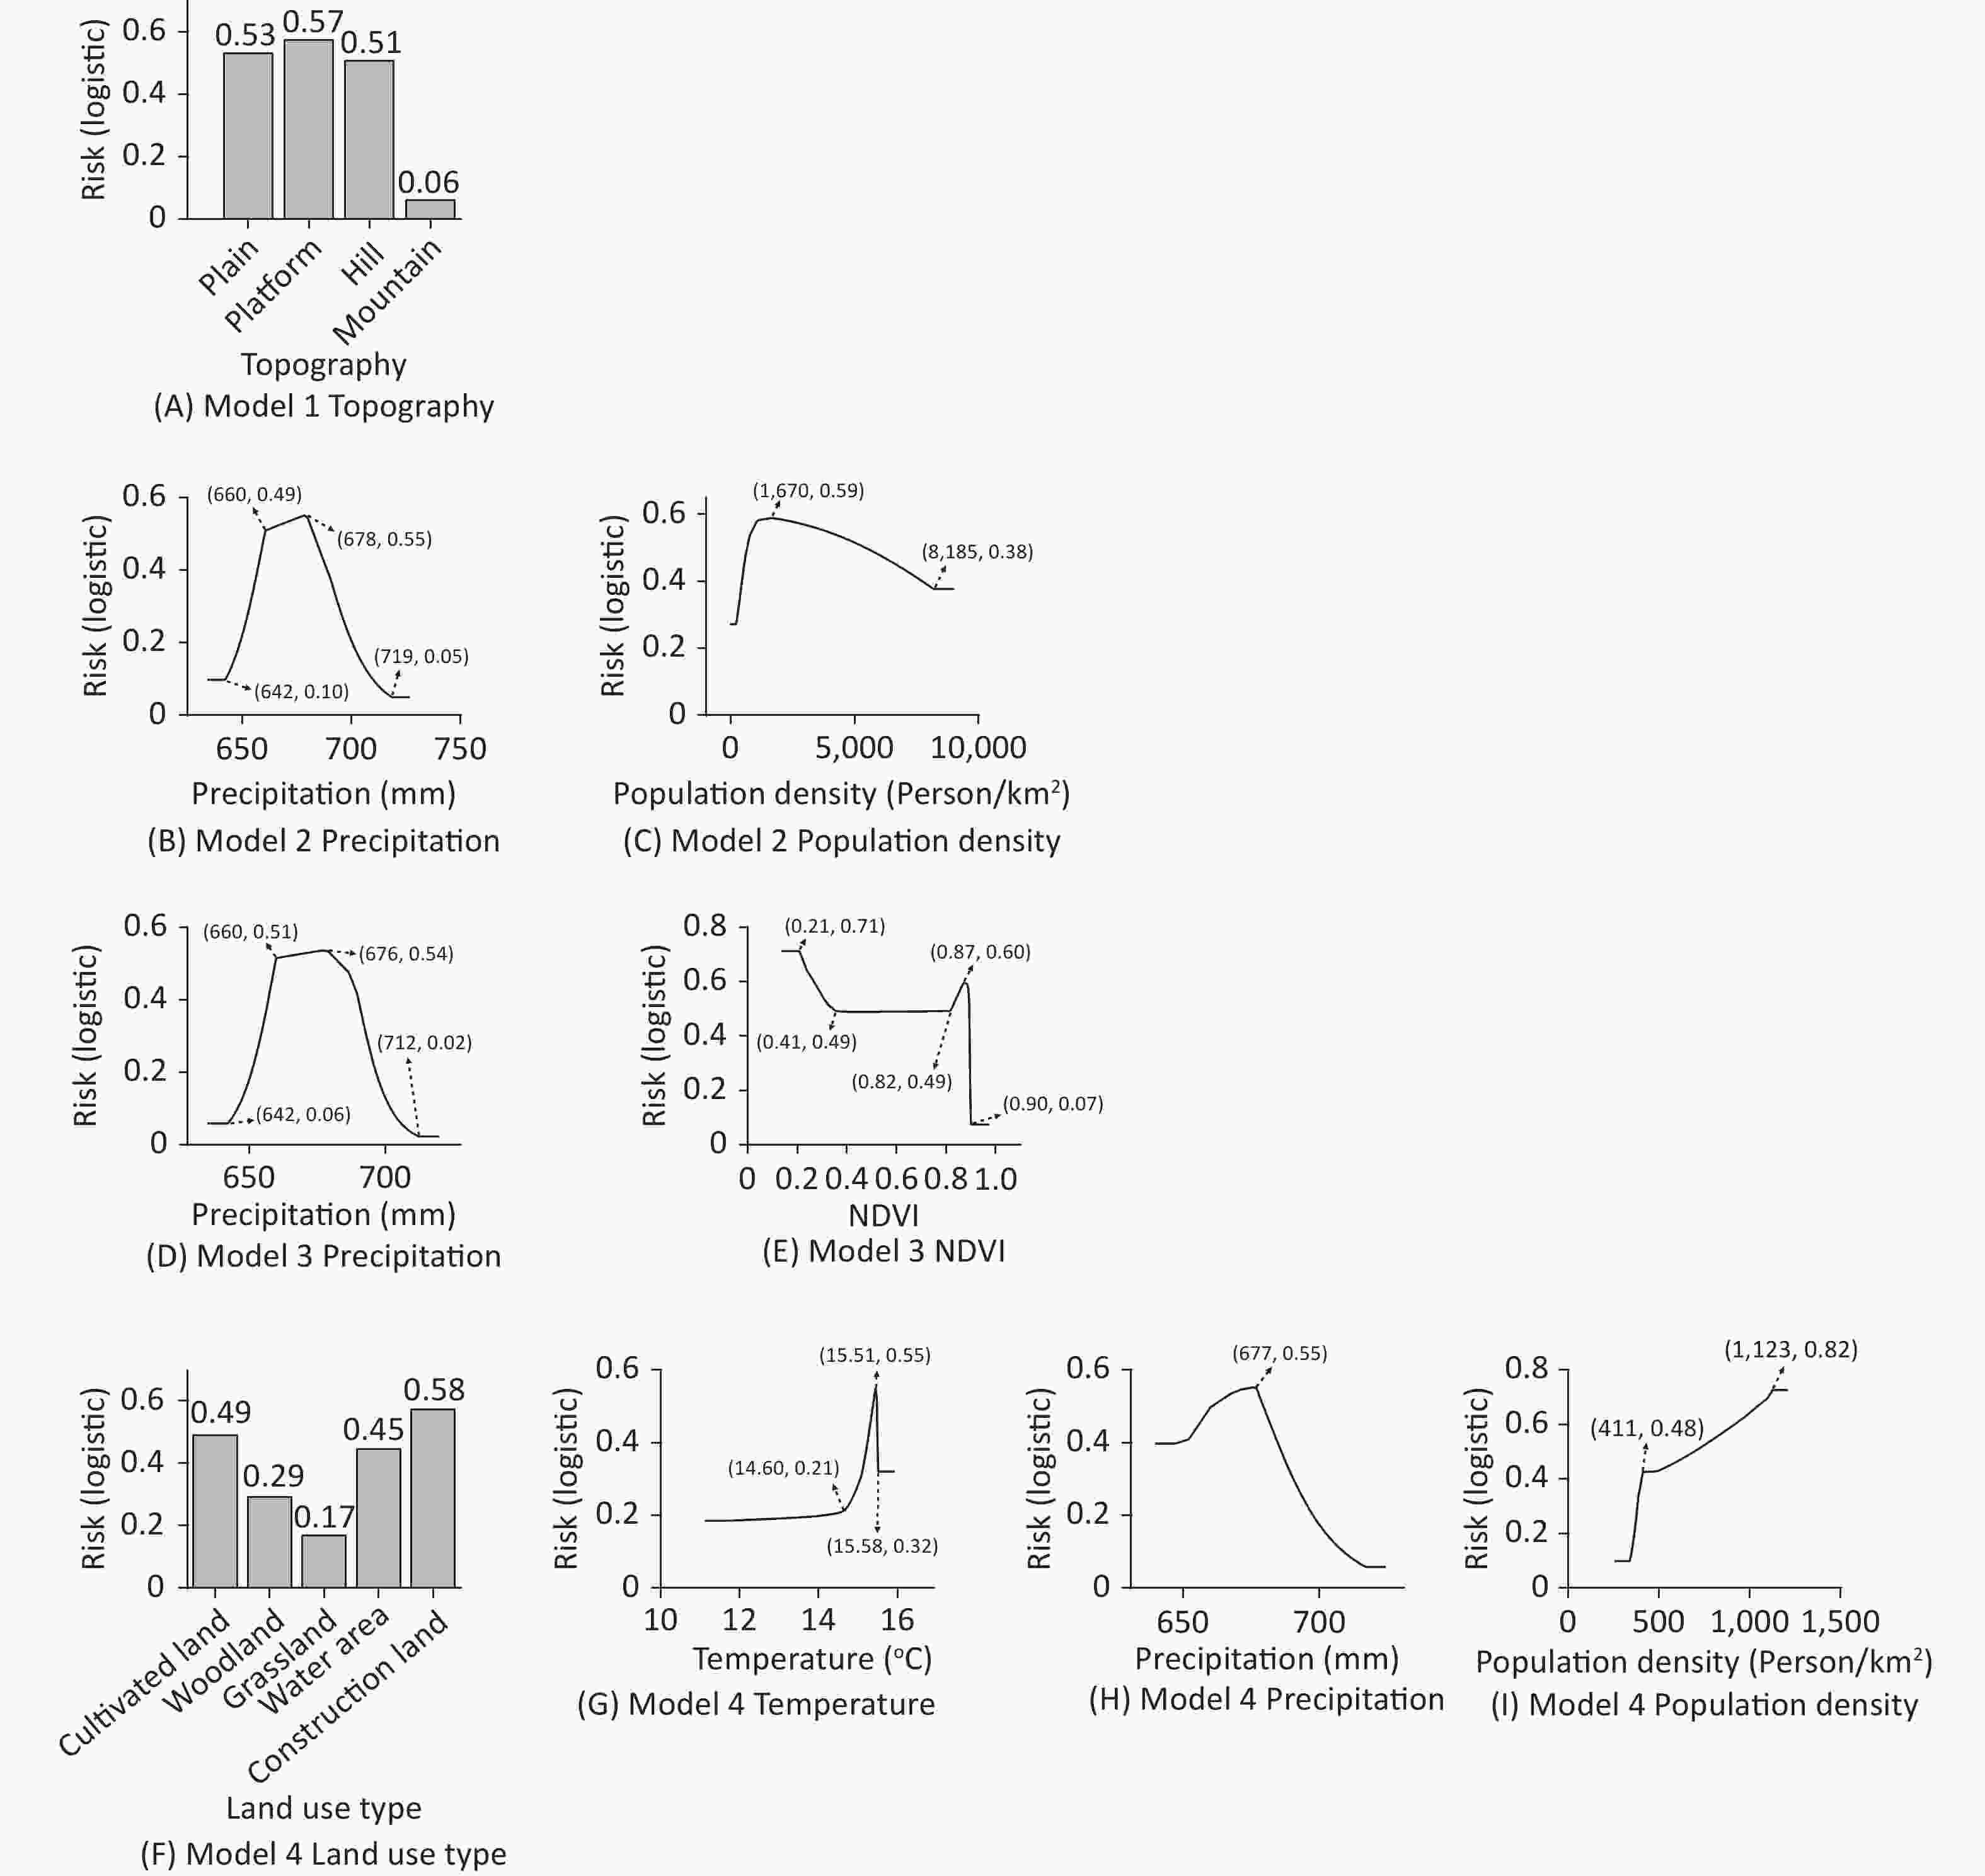
Figure 6. Response curve of influencing factors in four models. (A) Model 1, (B) Model 2, (C) Model 3, and (F−I) Model 4 were constructed for Chang’an District and Hu County as a whole, the plains of Chang’an District and Hu County, the plains of Chang’an District, and the plains of Hu County, respectively. The influencing factors whose contribution rates of each model were higher than 10% are shown in this figure. When the variable was continuous, the response curve of the variable to the spread of the HFRS epidemic was drawn; when the variable was categorical, the risk value of each type of variable to the spread of the HFRS epidemic was drawn.
Removing topography effects, precipitation, and population density jointly affected the spatial differentiation of the HFRS epidemic in the northern plains. From the response curve of HFRS epidemic risk to different precipitation areas, Models 2 and 3 (Figures 6B and 6D) showed that the HFRS epidemic risk increased rapidly with an increase in precipitation and then slowed down. When the precipitation was 678 and 676 mm, the HFRS transmission risk reached its highest value, and then the risk of HFRS transmission decreased as precipitation increased. The response curve for Model 4 differed slightly (Figure 6H); that is, when the precipitation was lower than 677 mm, the risk of HFRS transmission in Hu County remained high. On the plain of Chang’an District and Hu County as a whole (Figure 6C), the risk of HFRS epidemic transmission increased as population density increased. When the population density reached 1,670 Person/km2, the risk of HFRS epidemic spread was greater, and the risk of HFRS epidemic spread decreased as the population density increased.
In addition to precipitation, the HFRS epidemic in the plain of Chang’an District was also closely related to the NDVI. As shown in Figure 6E, the spread risk of the epidemic in the low-NDVI area was higher than that in the high-NDVI area, and the peak transmission risk was mainly concentrated below 0.41 and approximately 0.87. Apart from precipitation, the HFRS epidemic in the plain of Hu County was also related to temperature, land use, and population density. According to the risk impact of HFRS on different land-use types (Figure 6F), construction and cultivated lands were the main risk areas for the spread of HFRS, followed by water areas, woodlands, and grassland. In terms of the HFRS epidemic transmission risk to different temperature areas (Figure 6G), the risk of epidemic transmission increased as the temperature increased. When the temperature was 15.51 °C, the epidemic transmission risk was the highest, and then the risk was reduced. In terms of the HFRS epidemic transmission risk to different population density areas (Figure 6I), the risk of an HFRS epidemic spreading intensified as population density increased. When the population density reached 1,123 Person/km2, the risk of HFRS epidemic spread was the highest, then the risk of HFRS epidemic spread remained relatively flat.
-
The HFRS epidemic in the Guanzhong Plain of Shaanxi Province has a long history since the first case was occurred in 1955 [37]. Although various measures, such as rodent control and vaccination, have been implemented [38], the HFRS epidemic in this area remains severe. In 2021, the HFRS epidemic in Xi’an City under the background of the COVID-19 epidemic attracted national attention, which also indicated that the HFRS epidemic in the Guanzhong Plain should be given more attention and explored more deeply [39]. Simultaneously, urbanization profoundly affected this area. Because the ecological changes in rodent habitats and elevated rodent-human contact opportunities that accompany urbanization, may increase the HFRS epidemic risk [40]. This typical region of the Guanzhong Plain can provide opportunities to explore the specific effects of meteorological conditions, geographical environment, and socioeconomic characteristics on the HFRS epidemic. Chang’an District and Hu County were selected as the study areas to compare the impact of meteorology, topography, and socioeconomic characteristics on HFRS based on MaxEnt models. The results showed that the HFRS epidemic in Chang’an District and Hu County was concentrated in the northern area at an altitude of less than 800 m, which was closely related to topography. The precipitation and population density jointly affected the spatial differentiation of the HFRS epidemic in the northern plains. The HFRS epidemic was predominantly influenced by natural environmental factors, including precipitation and NDVI, in the plain of the relatively developed Chang’an District, while in the plain of developing Hu County, it was predominantly influenced by socioeconomic and meteorological factors.
Topography macroscopically determined the spatial distribution of HFRS cases in Chang’an District and Hu County, while precipitation and population density affected the local distribution differences. More than 95% of HFRS cases were distributed in northern areas with altitudes less than 800 m in Chang’an District and Hu County, showing the close relationship to the topography. The northern plains are rich in vegetation and crops under a suitable climate that could provide rich food sources and living environments for rodents [18]. A study showed that Xi'an was an Apodemus focus, and Apodemus agrarius was the dominant reservoir host [41]. When the altitude was higher than 800 m, Apodemus agrarius died due to hypoxia, and most of them lived at an altitude of approximately 345–600 m [41]. Although a small number of HFRS cases were scattered in the southern mountainous areas of Chang’an District and Hu County, they were primarily distributed in valleys with lower elevations. Additionally, the topography of the northern area is dominated by plains, with a denser population and a more developed economy. Another study showed that a large number of Apodemus agrarius appeared around the city with the acceleration of urbanization, greatly increasing the risk of population exposure [42]. Therefore, it is recommended that the deployment of HFRS epidemic prevention and control resources in Chang’an District and Hu County should focus on the northern plains with suitable precipitation and densely distributed populations.
Precipitation was the leading influencing factor in the northern plains with a contribution rate of 60.7%. The precipitation in Chang’an District and Hu County was characterized more in the south and less in the north. The annual precipitation in low-altitude areas was between 642 and 719 mm, which was the risk range for the spread of HFRS. Precipitation can directly affect the vitality and infectivity of Hantavirus by affecting humidity conditions. Furthermore, it can affect the living environment of rodents, thus indirectly affecting the spread of HFRS. A moderate amount of precipitation is conducive to vegetation growth and promotes the survival and reproduction of rodents [11, 43]. Excessive or continuous precipitation destroys the living environment of rodents and reduces their numbers [11]. Therefore, moderate precipitation promoted the spread of HFRS; however, the standards for "moderate precipitation" differ in different regions. For example, the high transmission risk of HFRS in the middle and lower reaches of the Xiangjiang River are primarily concentrated in the areas with an average annual temperature of 18 °C and precipitation of approximately 1,500 mm [11]. Consequently, it is crucial to have a clear understanding of the impact mechanism and intensity of local precipitation on HFRS epidemics. We suggest targeted prevention and control measures in areas with annual precipitation between 642 and 719 mm in the northern plains.
Population density was another important factor influencing the spatial differentiation of HFRS epidemic in northern plains, with a contribution rate of 28.0%. In 2015, the premanent population and GDP of Chang’an District were 1,118,300 people and 51.388 billion yuan, respectively, while those of Hu County were only 570,300 people and 15.541 billion yuan, respectively. The two regions were in different stages of economic development, with the economic development level of Chang’an District being considerably higher than that of Hu County. For Chang’an District, the development brought by this higher economic level, medical and health care, residential safety and health awareness, and vaccination could greatly reduce the chance of infection and suppress HFRS epidemic [21]. Hu County is currently in a rapidly developing stage of urbanization. Large-scale engineering construction, such as roads, bridges, and buildings, and other artificial activities bring in more immigrants and destroys the rodent habitat, which may result in frequent rodent activities, increase rodent and human contact opportunities, and lead to more HFRS infection [7]. The modelling results in the two compared areas also showed that the stage of economic development had an effect on the HFRS epidemic. In Chang’an District, where the economy was more developed, spatial differentiation of the HFRS epidemic was primarily affected by natural factors, such as precipitation and NDVI, while in the relatively undeveloped Hu County, spatial differentiation of the HFRS epidemic was primarily influenced by meteorological factors, such as temperature and precipitation, and socioeconomic factors, such as land use and population density. Overall, socioeconomic factors had a greater impact on the spatial differentiation of the HFRS epidemic in Hu County than in Chang’an District.
Furthermore, the most obvious difference between Chang’an District and Hu County was the effect of land use on HFRS prevalence. The land use types in the plain of Hu County were mainly construction land and cultivated land, where the higher risk of the HFRS epidemic in these areas may be related to the local urbanization process [44]. The conversion of cultivated land to construction land led to changes in the living environment of rodents, bringing more migrant workers to work on construction sites, which might upsurge the contact opportunities between humans and their reservoir hosts; however, farmers engaged in agricultural work in the wild, and frequent rodent contact opportunities led to a greater chance of being exposed to Hantavirus. Cultivated land also provides adequate food and sheltered habitat for rodents. In Hu County, HFRS case data from 2014 to 2016 showed that more than 76% of the cases were farmers, which confirmed that the HFRS epidemic risk value of cultivated land was higher. Therefore, we suggest that when formulating HFRS epidemic prevention and control measures, targeted scientific opinions should be provided based on the level of local economic development. For Chang’an District, with better economic development, we need to pay more attention to future precipitation trends to issue early warning notices to residents; however, in Hu County, where the economy is in the development process, it is necessary to pay more attention to the surrounding areas of construction land and cultivated land, especially in the urban-rural fringe area, to remind residents to maintain epidemic prevention.
Our study has some limitations; for example, we used the family address of the HFRS case to locate the case point, which would affect the analysis of the relationship between environmental factors and spatial distribution of the HFRS epidemic; however, this could not be improved because it is difficult to obtain an accurate infection location. Furthermore, the MaxEnt model was not specially constructed for disease analysis, and the model fitting results were not satisfactory, which has limitations for HFRS risk distribution predictions, but it can still be useful to identify the influencing factors of the HFRS epidemic, as there may be important undiscovered influencing factors in the northern plain area.
Overall, we analyzed the influencing factors of the HFRS epidemic in Chang’an District and Hu County by constructing MaxEnt models and discussed reasonable explanations for the concentrated distribution of HFRS cases in northern low-altitude areas. As evidenced in our study, the main factors influencing the HFRS epidemic in Chang’an District and Hu County at different stages of economic development were different, and targeted epidemic prevention and control measures should be formulated according to the key influencing factors of the respective economic development level. Since the epidemic situation in this typical high-incidence area of Shaanxi Province has changed greatly, it is pivotal to update the understanding of the epidemic situation and influencing factors promptly and to develop targeted prevention and control strategies.
-
HFRS is a Class B infectious disease in China, and confirmed cases must be reported to the Center for Disease Control and Prevention through the China National Notifiable Disease Surveillance System within 24 h. This data collection is part of routine public health surveillance and is exempt from institutional review board evaluation. Ethical approval for this study was not required in accordance with the local legislation and national guidelines.
Spatial Heterogeneity and Influencing Factors of HFRS Epidemics in Rural and Urban Areas: A Study in Guanzhong Plain of Shaanxi Province, China
doi: 10.3967/bes2022.130
Funds:
This research was funded by the National Natural Science Foundation of China [grant number 41901337 and 42071136]
- Received Date: 2022-06-20
- Accepted Date: 2022-09-16
-
Key words:
- Hemorrhagic fever with renal syndrome (HFRS) /
- Spatial heterogeneity /
- Influencing factors /
- Economic development stages /
- Fine scale /
- Maximum Entropy model
Abstract:
| Citation: | ZHU Ling Li, LI Yan Ping, LU Liang, LI Shu Juan, REN Hong Yan. Spatial Heterogeneity and Influencing Factors of HFRS Epidemics in Rural and Urban Areas: A Study in Guanzhong Plain of Shaanxi Province, China[J]. Biomedical and Environmental Sciences, 2022, 35(11): 1012-1024. doi: 10.3967/bes2022.130

|


 Quick Links
 DownLoad: