


-
Microplastics (MPs) and nanoplastics (NPs) pollutions have become a growing environmental concern as plastics production has increased to almost 360 million tonnes in 2018 [1]. MPs pollution had been reported in aquatic habitats from the poles [2] to the equator [3]. Furthermore, the translocation of MPs particles along food chain has been confirmed [4,5]. Indeed, MPs particles have been found not only in seafood [6,7], but also in processed food and beverages, including bottle water, salt, beer, milk, and sugar [8-11]. As for NPs (≤ 100 nm in diameter) pollution, it derived from the breaking down of MPs in the environment and some specific industrial or domestic applications such as biomedical products [12] and personal care products including toothpastes and cosmetics [13]. Unfortunately, NPs had the potential to translocate to a wide variety of organisms [14]. All these facts represent a potential dietary exposure pathway to the human body for both MPs and NPs.
According to our knowledge, toxic effects of MPs pollution found in mammals have revealed that MPs pollutants are able to induce gut microbiotadysbiosis [15,16], disturbances in lipid metabolism, oxidative damage, neurotoxicity [17] and reproductive disruption [18]. Maternal exposure to MPs (0.5 μm and 5 μm) can even increase the risk of metabolic disorder in their offspring [19]. As for NPs, experiments culturing human cerebral and epithelial cells [20] and human astrocytoma cells [21] have directly showed the oxidative stress and cytotoxic effects of NPs on human cells. In 2017, it was reported that NPs could penetrate the blood-brain barrier in fish and cause behavioral disorders [22]. Thereby, NPs are expected to be able to invade the human body more deeply in comparison to MPs. All of these findings suggest that MPs and/or NPs might be a potential threaten to human health. Thus, the European Food Safety Agency attempted to perform a risk assessment of MPs and NPs; however, the assessment could not be completed because the toxicokinetic data are insufficient [23]. Thus, the toxicokinetics of MPs and NPs are urgently needed to assess human health risks.
In fact, a study conducted 30 years ago [24] reported the absorption of 50 nm – 3 μm polystyrene (PS) beads with covalently-linked fluorescein after 10-day oral exposure. It was concluded that PS particles > 300 nm in size were absent from blood samples and no PS particles (of any size) were detected in the heart and lungs. In 2019, a 28-day oral feeding study [25] focused on micron-size PS (1–10 μm) and found that only a few particles were present in the intestinal wall. In 2021, NPs were found in mice spleen, lung, kidney, small intestine, large intestine, testis and brain after 28 days oral exposure [26]. All of these facts suggested that subacute exposure to MPs and/or NPs resulted in absorption into the blood, but the invasion was size-dependent. With respect to the acute exposure such as a single exposure, studies focusing on the toxicokinetics of MPs and NPs are limited in comparison to common nanomaterials such as silver and TiO2 [27]. Even if a single exposure might have few practical implications, its foundation role in obtaining basic toxicokinetics index is irreplaceable. The reason for the lack was unknown. The difficulty in tracking skill might be an obstacle performing studies in the related fields. It has been reported that conclusions pertaining to translocation of MPs and NPs drawn from fluorescence were suspected to be artifacts if the stability of the fluorescence label was not confirmed [28]. In addition, digestion by gastric acid after oral exposure affected the properties of MPs [29], which increased the complexity in relation to toxicokinetics. So far, the following questions on toxicokinetic data of MPs and NPs in mammals have not been answered: 1) Is there evidence on the uptake in blood for a single oral exposure? 2) Can MPs and NPs accumulate in adipose tissues due to lipophilicity? 3) Are MPs and NPs able to penetrate the blood-brain and blood-testis barriers in mammals as observed in fish?
The present study was designed to clarify the characteristics and differences in the absorption of MPs and NPs into the bodies of mammals after acute oral exposure. 100 nm, 3 μm and 10 μm PS beads with fluorescent dyes incorporated into the polymer matrix were fed by gavage once to male Kunming strain mice. The absorption level of MPs and NPs and the time-dependent characteristics in blood, various adipose tissues, the nervous system, and the reproductive system were measured by an IVIS Spectrum small-animal imaging system for 4 h. The observations were further proved by confocal laser scanning, histological examination, and transmission electron microscope. We believe that our findings will reveal the different absorption, distribution in vivo, and penetrating ability between MPs and NPs, and provide pilot evidence for toxicokinetics of MPs and NPs in mammals after confirming the leaching of fluorescence label and the impact of pH value imitating the condition in stomach.
-
100 nm (Cat. No. G100), 3 μm (Cat. No. G0300B), and 10 μm (Cat. No. G1000B) diameters of PS fluorescent beads (Fluoro-MaxTM Green Fluorescent Polymer Microspheres) were purchased from Thermo Fisher Scientific Corporation, USA. Those particles are internally dyed using proprietary Firefli fluorescent process and coupled with a dye-free surface in order to prevent dye leaching. The beads are packaged in deionized water with trace amounts of surfactant. The excitation spectrum was 488 nm and emission spectrum was 508 nm. The concentration of those fluorescent PS beads is 1% solids by weight which represents 1.8 × 10¹⁶ particles L−1 for 100 nm beads, 7.5 × 10¹¹ particles L−1 for 3 μm beads, and 1.9 × 10¹⁰ particles L−1 for 10 μm beads, respectively. They were stored at 4 °C in the dark and reversed gently before use.
-
Forty-eight male Kunming strain mice (20 ± 1 g) were purchased from Beijing HFK Bioscience Co., LTD (license number: 1103221911010176; Beijing China). All animals were acclimated under specific pathogen-free conditions for 1 week before starting the experiments. Animals were maintained in the Laboratory Animal Center of China Medical University at a room temperature of 23 ± 2 °C, a relative humidity of 45%–60% and a 12-h light/dark cycle. All mice were given free access to food and water, but fasted for 12 h before exposure. The experimental protocol was approved by the Ethical Requirements of Experimental Animals of China Medical University (Number: CMU2019216).
-
With respect to acute oral exposure dose, a study with 28 days of feeding [25] did not show a considerable health risk to mice. Thus, we decided to select the upper limit of the dose range proposed for fluorescence imaging [20 to 200 mg∙kg−1∙body weight (BW)] [30] as a single gavage dose in the current study. In our study, 400 μL suspension (1% solid by weight) was used to achieve 200 mg∙kg−1 BW for the mice of average 20 g∙BW.
With respect to particle size, a 100 nm diameter is the biggest size for NPs and was selected as an indicator of NPs. We initially focused on 2.5 μm referring to fine particulate matter (PM2.5) and a larger representative for MPs. Because 3 μm is the closest size to 2.5 μm among all tradable commodities and 10 μm tends to be distinguishable from 3 μm, the characteristics of these two sizes of MPs were explored and compared with NPs.
Mice were randomly divided into the following four groups: 0.9% normal saline control (n = 12), 100 nm PS fluorescent beads (n = 12), 3 μm PS fluorescent beads (n = 12) and 10 μm PS fluorescent beads (n = 12). All mice were fasted for 12 h and 400 μL PS beads (100 nm: 7.2 × 10¹² particles; 3 μm: 3.0 × 10⁸ particles; 10 μm: 7.6 × 10⁶ particles) were administered once by gavage. In the control group, mice were given the same volume of saline solution by the same route. Three mice from each group were sacrificed 0.5, 1, 2, and 4 h after gavage [31,32]. The administration time was determined according to the evaluation of nanoparticles using fluorescence imaging [30]. Blood was collected as much as possible after eyeball extraction. Mice were euthanized by cervical dislocation and tissues samples, including the subcutaneous fat, perirenal fat, peritesticular fat, cerebrum, cerebellum, testis, and epididymis were obtained and weighed for further measurements.
-
An IVIS Spectrum small-animal imaging system (IVIS Spectrum, PerkinElmer Inc, US) was used to measure fluorescence intensity of tissues to indicate the PS content (λEx 505 nm, λEm 515 nm). The same tissues from PS-treated and control groups were placed on one black paper and imaged at the same time. 100 μL of blood was taken to measure the fluorescence intensity with the same method as solid tissues. Entire tissues were selected as the region of interest for fluorescence analysis. The total radiant efficiency units from selected area were used to indicate the fluorescence intensity. Radiant efficiency was corrected for tissue weight (g) and volume (mL) in all calculations [31]. The fold increase of fluorescence intensity (folder = total radiant efficiency of tissue in exposure group/mean radiant efficiency of tissue in the control group) was calculated to indicate the change in strength. As for the blood, the fluidity of liquid resulted in the variation of radiant area (cm2) even for the same volume. Thus, radiant area was further corrected while calculating fold increase.
-
Solid tissues with significant fluorescent imaging were performed histological examination to corroborate the findings by IVIS Spectrum. Samples were immersed in fixative immediately after fluorescent imaging for at least 24 h. Dehydration and paraffin infiltration were conducted by putting sample in 75%–100% alcohol, xylene and paraffin for appropriate time. Embedding was undertaken through processing tissue sample in melted paraffin in cassettes. The embedded samples were frozen at −20 °C until paraffin solidify completely. Paraffin block was taken out and trimmed accordingly. Four µm sections were cut and treated by hematoxylin-eosin (HE) staining and DAPI dye, respectively.
-
For the blood sample, confocal laser scanning was conducted to confirm the presence of PS beads in blood even if the absorption was not found by IVIS Spectrum due to its detection limit. Ten μL blood sample was further examined (λEx 488 nm, λEm 500–550 nm) using Nikon A1-R (Japan) confocal laser scanning microscope (CLSM). In this study, a visual magnification of 600 × (a 10 × ocular and 60 × objective) was used for all CLSM examination.
-
The presence of PS beads in blood sample was further proved by transmission electron microscope (TEM, 200kV, JEM-2100F, JEOL) because it can achieve the highest image quality even for the particle with a size under 0.5 nm. Blood sample was added to an equal volume of hydrogen peroxide 30% and put in a 50 °C water bath until it became colorless. TEM examination was performed to enhance the evidence, especially for NPs.
-
The leaching of fluorescent dye was examined, especially for NPs. Two experiments were performed. The first experiment was performed by using the method reported by Schür et al. [28] which focused on NPs: 127 μm thick medical grade silicone rubber was placed in particle suspensions for 24 h, rinsed in ultrapure water after the incubation, and imaged by CLSM. There were three groups according to the dispersion status before incubation: 1) 0.9% normal saline control; 2) dispersing 100 nm PS suspension by reversing gently as conducted in this study; and 3) dispersing 100 nm PS suspension by sonicating for 30 min.
The second experiment was performed by TEM examination to further identify 100 nm and 3 μm PS hydrochloric acidbeads status after different dispersing methods. The numbers of PS beads with different sizes were counted for three view fields of each condition.
-
Low pH condition was reported to modulate the properties of MPs [29]. The pH value in stomach of mice is in the range of 2.98 to 4.04 [33]. With respect to 100 nm PS, the incubation of 24 h and dry overnight were needed for CLSM and TEM examinations. Thus, neutralization at 0.5, 1, 2, and 4 h was necessary. However, the dose changes and the impact of alkali made it difficult to make conclusion. Thus, only the impact of low pH on 3 μm PS beads was performed. The 3 μm PS beads were added to the solution with a pH of 2.61 in a 1:1 volume ratio. The status of 3 μm PS beads was examined by CLSM at 0, 0.5, 1, 2, and 4 h. In addition, the original status of both 100 nm and 3 μm PS beads were observed by TEM.
-
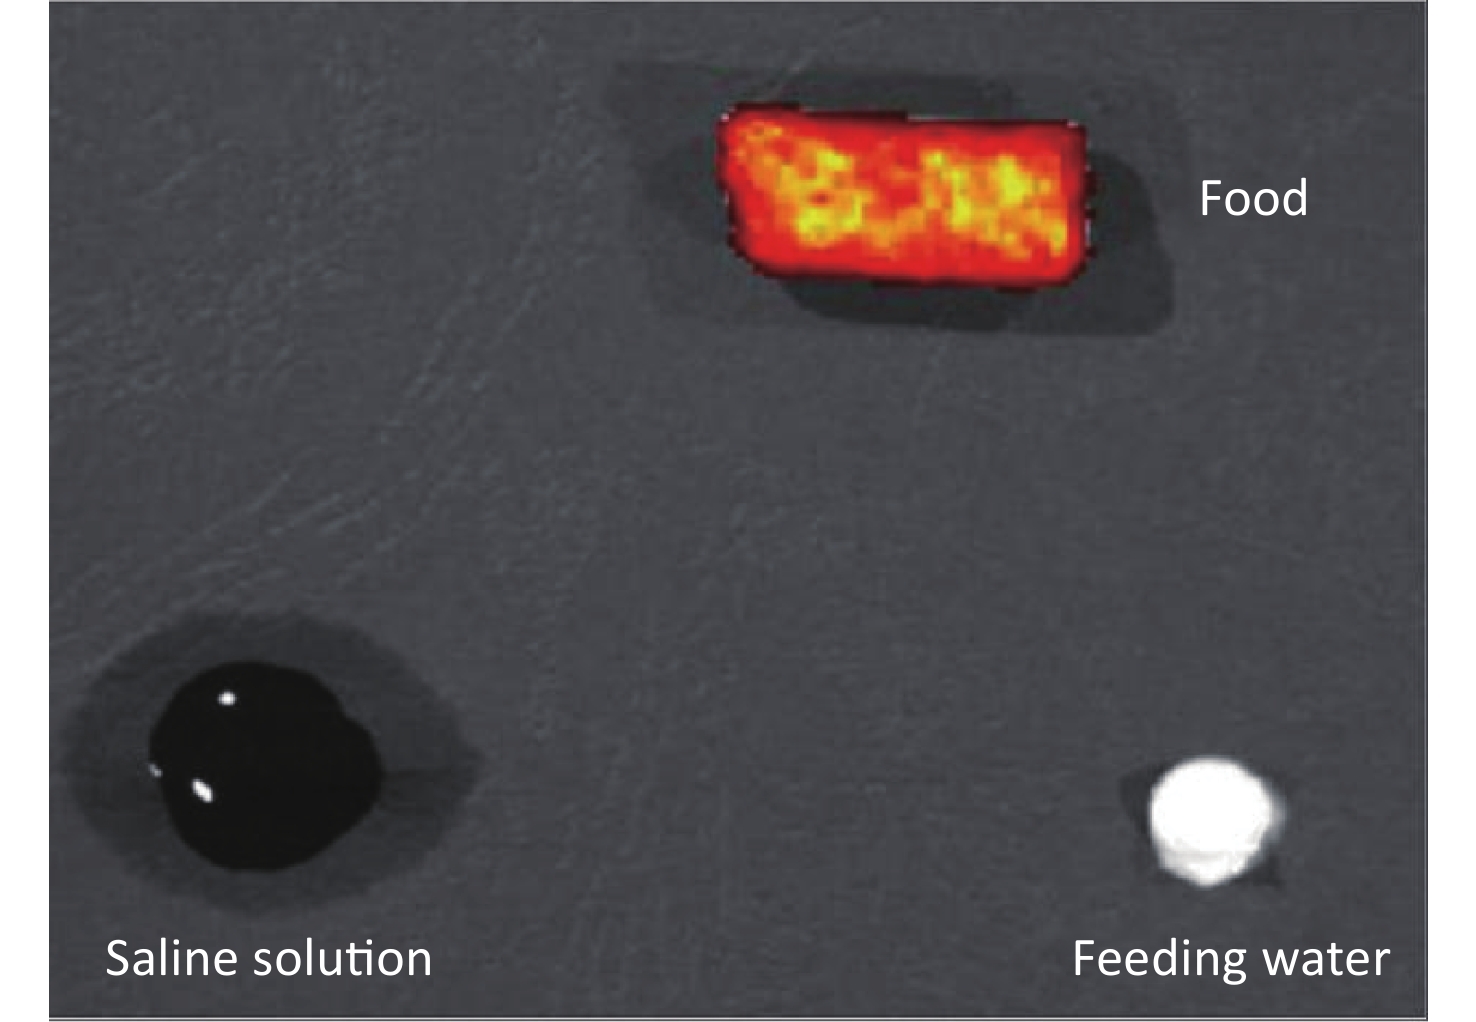
All surgical instruments were cleaned using ultrapure water and sterilized thoroughly before dissection. The tissues were thrice-rinsed with 0.9% normal saline to avoid cross-contamination from blood and dried on filter paper. All tubes, filter papers, saline solutions, and black papers used were detected by the IVIS Spectrum to assure the avoidance of fluorescence contamination. Also, the food and feeding water were measured, even if animals were fasted for 12 h. The imaging results showed that feeding water was free of fluorescence, but the food contained a strong fluorescence signal (Supplementary Figure S1 available in www.besjournal.com).
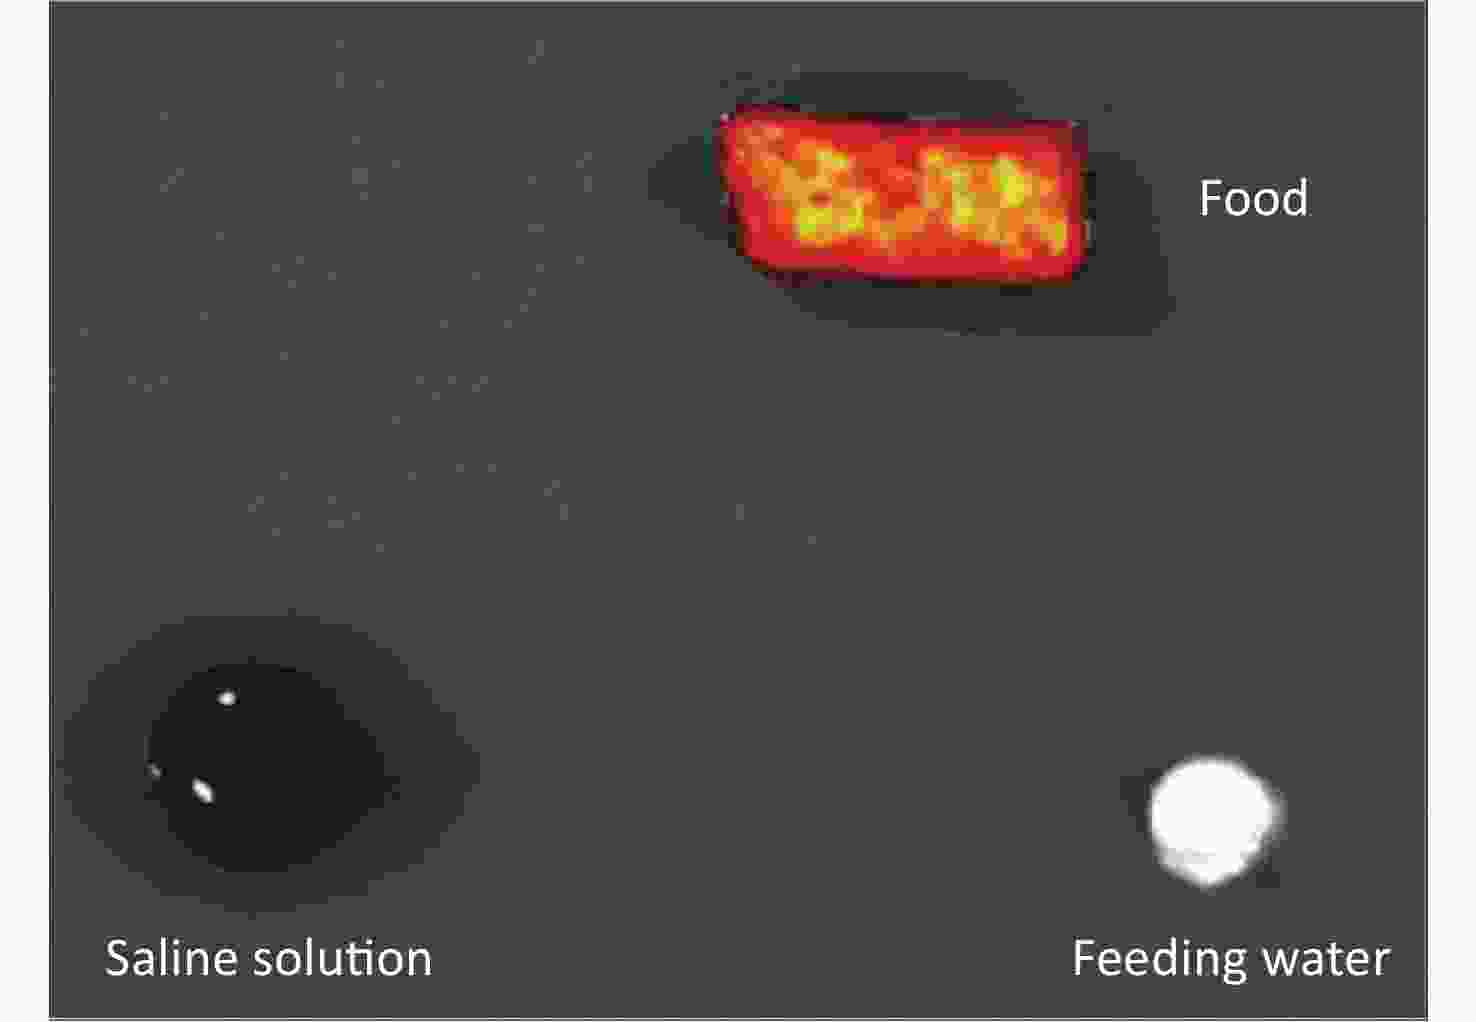
Figure S1. The fluorescence image of food, 0.9% saline solution and feeding water by IVIS Spectrum.
-
Data are expressed as the mean ± standard deviation (SD). Fluorescence intensity and fold-increase values were analyzed separately. The differences among time points were analyzed using one-way analysis of variance followed by the Least Significant Difference test for multiple comparisons. A P < 0.05 was considered significant. SPSS 13.0 software (SPSS Co., Ltd., Chicago, IL, USA) was used to perform data analysis.
-
Mice in the control group were given saline solution by gavage. IVIS Spectrum imaging showed that the levels of autofluorescence intensity differed among the tissues (Table 1). Blood had the lowest autofluorescent signal. By comparison, epididymis had the highest autofluorescence intensity (123 times that of blood). Due to the autofluorescence, the folder increase (PS-treated group vs. control group) was used to indicate the change in strength. Because no significant differences existed among the different time points for each tissue in the control group, mean value of different time points was calculated as mean radiant efficiency of tissue in the control group to increase the stability of the autofluorescence intensity.
Tissues Mean ± SD 0.5 h (n = 3) 1 h (n = 3) 2 h (n = 3) 4 h (n = 3) Total Epididymis 138.0 ± 91.5 106.0 ± 21.5 97.2 ± 14.7 81.9 ± 10.40 106.0 ± 46.1 Subcutaneous fat 93.4 ± 27.8 83.3 ± 15.8 64.0 ± 14.4 70.1 ± 16.3 77.7 ± 20.4 Testis 62.1 ± 10.1 69.4 ± 2.5 61.4 ± 4.9 70.2 ± 11.7 65.8 ± 8.16 Perirenal fat 47.6 ± 28.7 48.0 ± 19.2 44.9 ± 13.7 44.8 ± 16.0 46.3 ± 17.3 Peritesticular fat 39.4 ± 3.4 46.8 ± 24.9 50.2 ± 12.5 41.9 ± 12.8 44.6 ± 13.9 Cerebellum 16.7 ± 2.6 16.8 ± 2.5 21.8 ± 0.8 16.9 ± 2.8 18.1 ± 3.0 Cerebrum 18.0 ± 0.70 18.4 ± 0.4 17.3 ± 3.34 17.64 ± 3.4 17.8 ± 2.1 Blood* 0.97 ± 0.28 0.78 ± 0.24 0.88 ± 0.03 0.78 ± 0.03 0.86 ± 0.18 Note. *Adjusted by volume (mL). Table 1. Autofluorescence intensity of tissues in control group at different time points (unit: [(p/sec)/(μW/cm2)]/g, 1.00 x 10⁸)
-
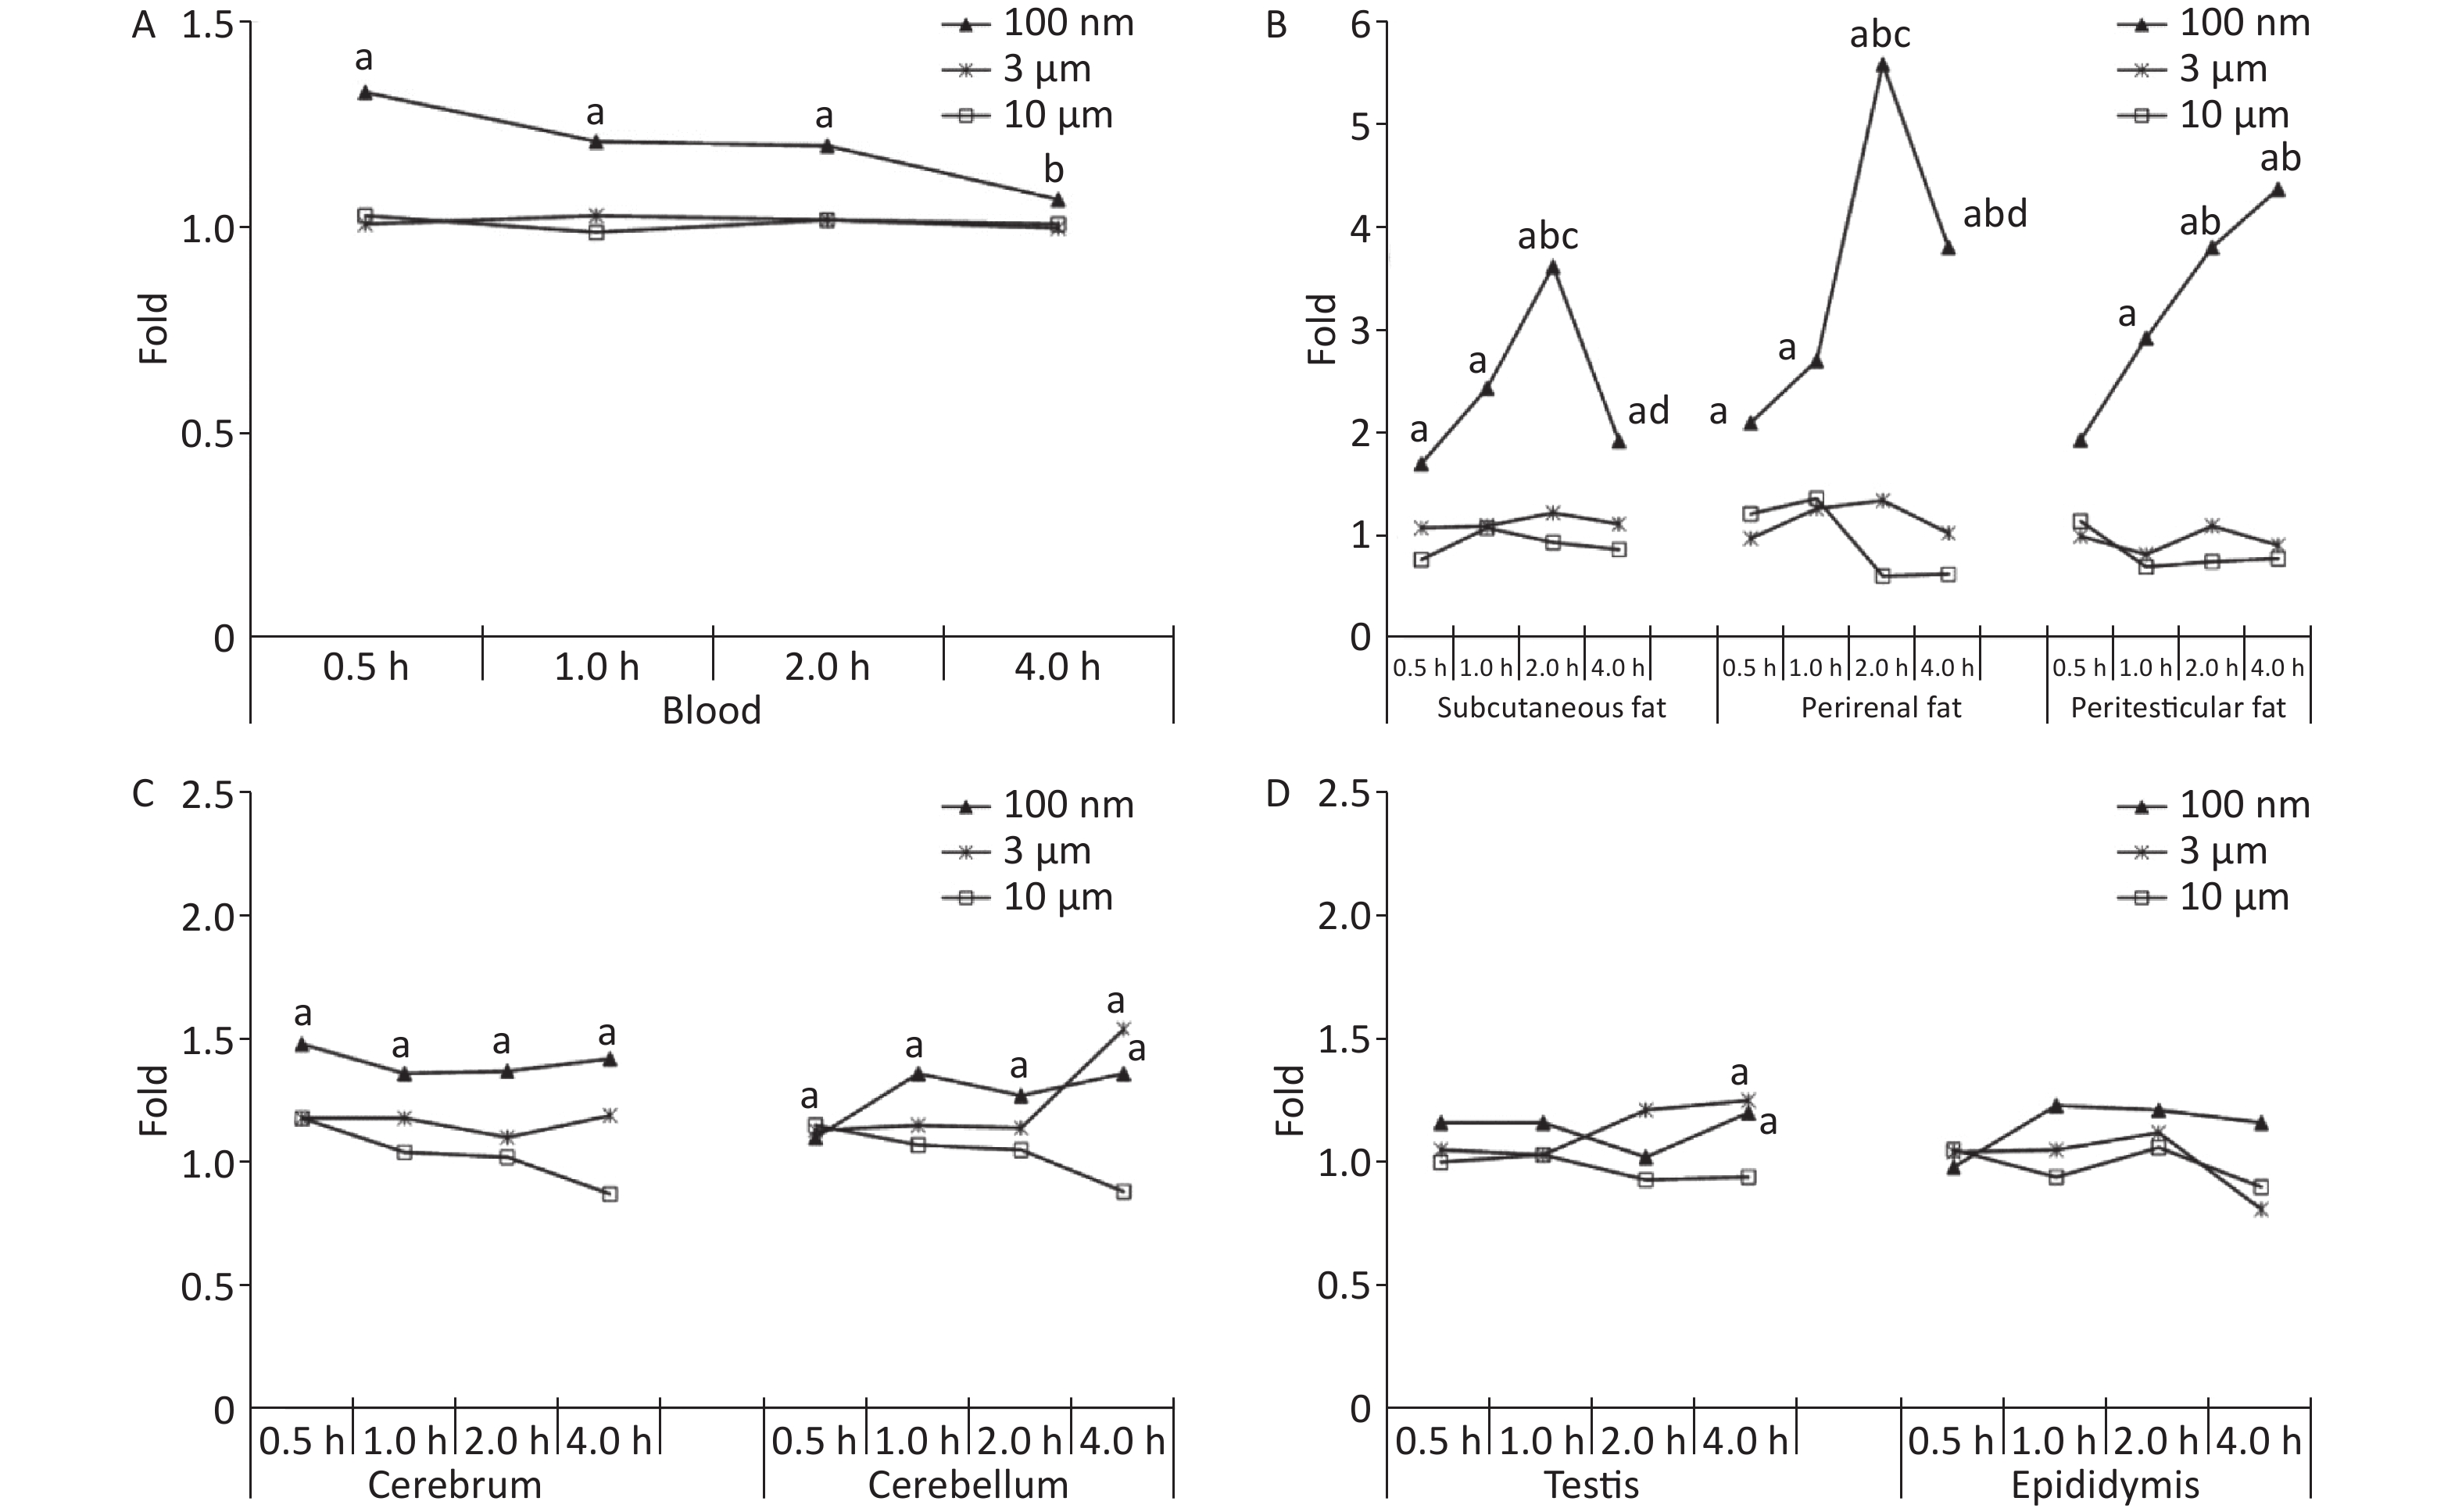
Figure 1A shows the time course changes of fluorescence intensity in blood after administering PS beads by gavage at a dose of 200 mg∙kg-1∙BW. In the 100 nm PS exposure group, the fluorescence intensity increased significantly at 0.5, 1, and 2 h (P < 0.05) in comparison to the control group; the highest level was at t = 0.5 h. Up to 4 h, the fluorescence intensity decreased to the same level as the control group and was significantly lower than level at 0.5 h (P < 0.05). By contrast, no changes were observed for 3 and 10 μm PS exposure.
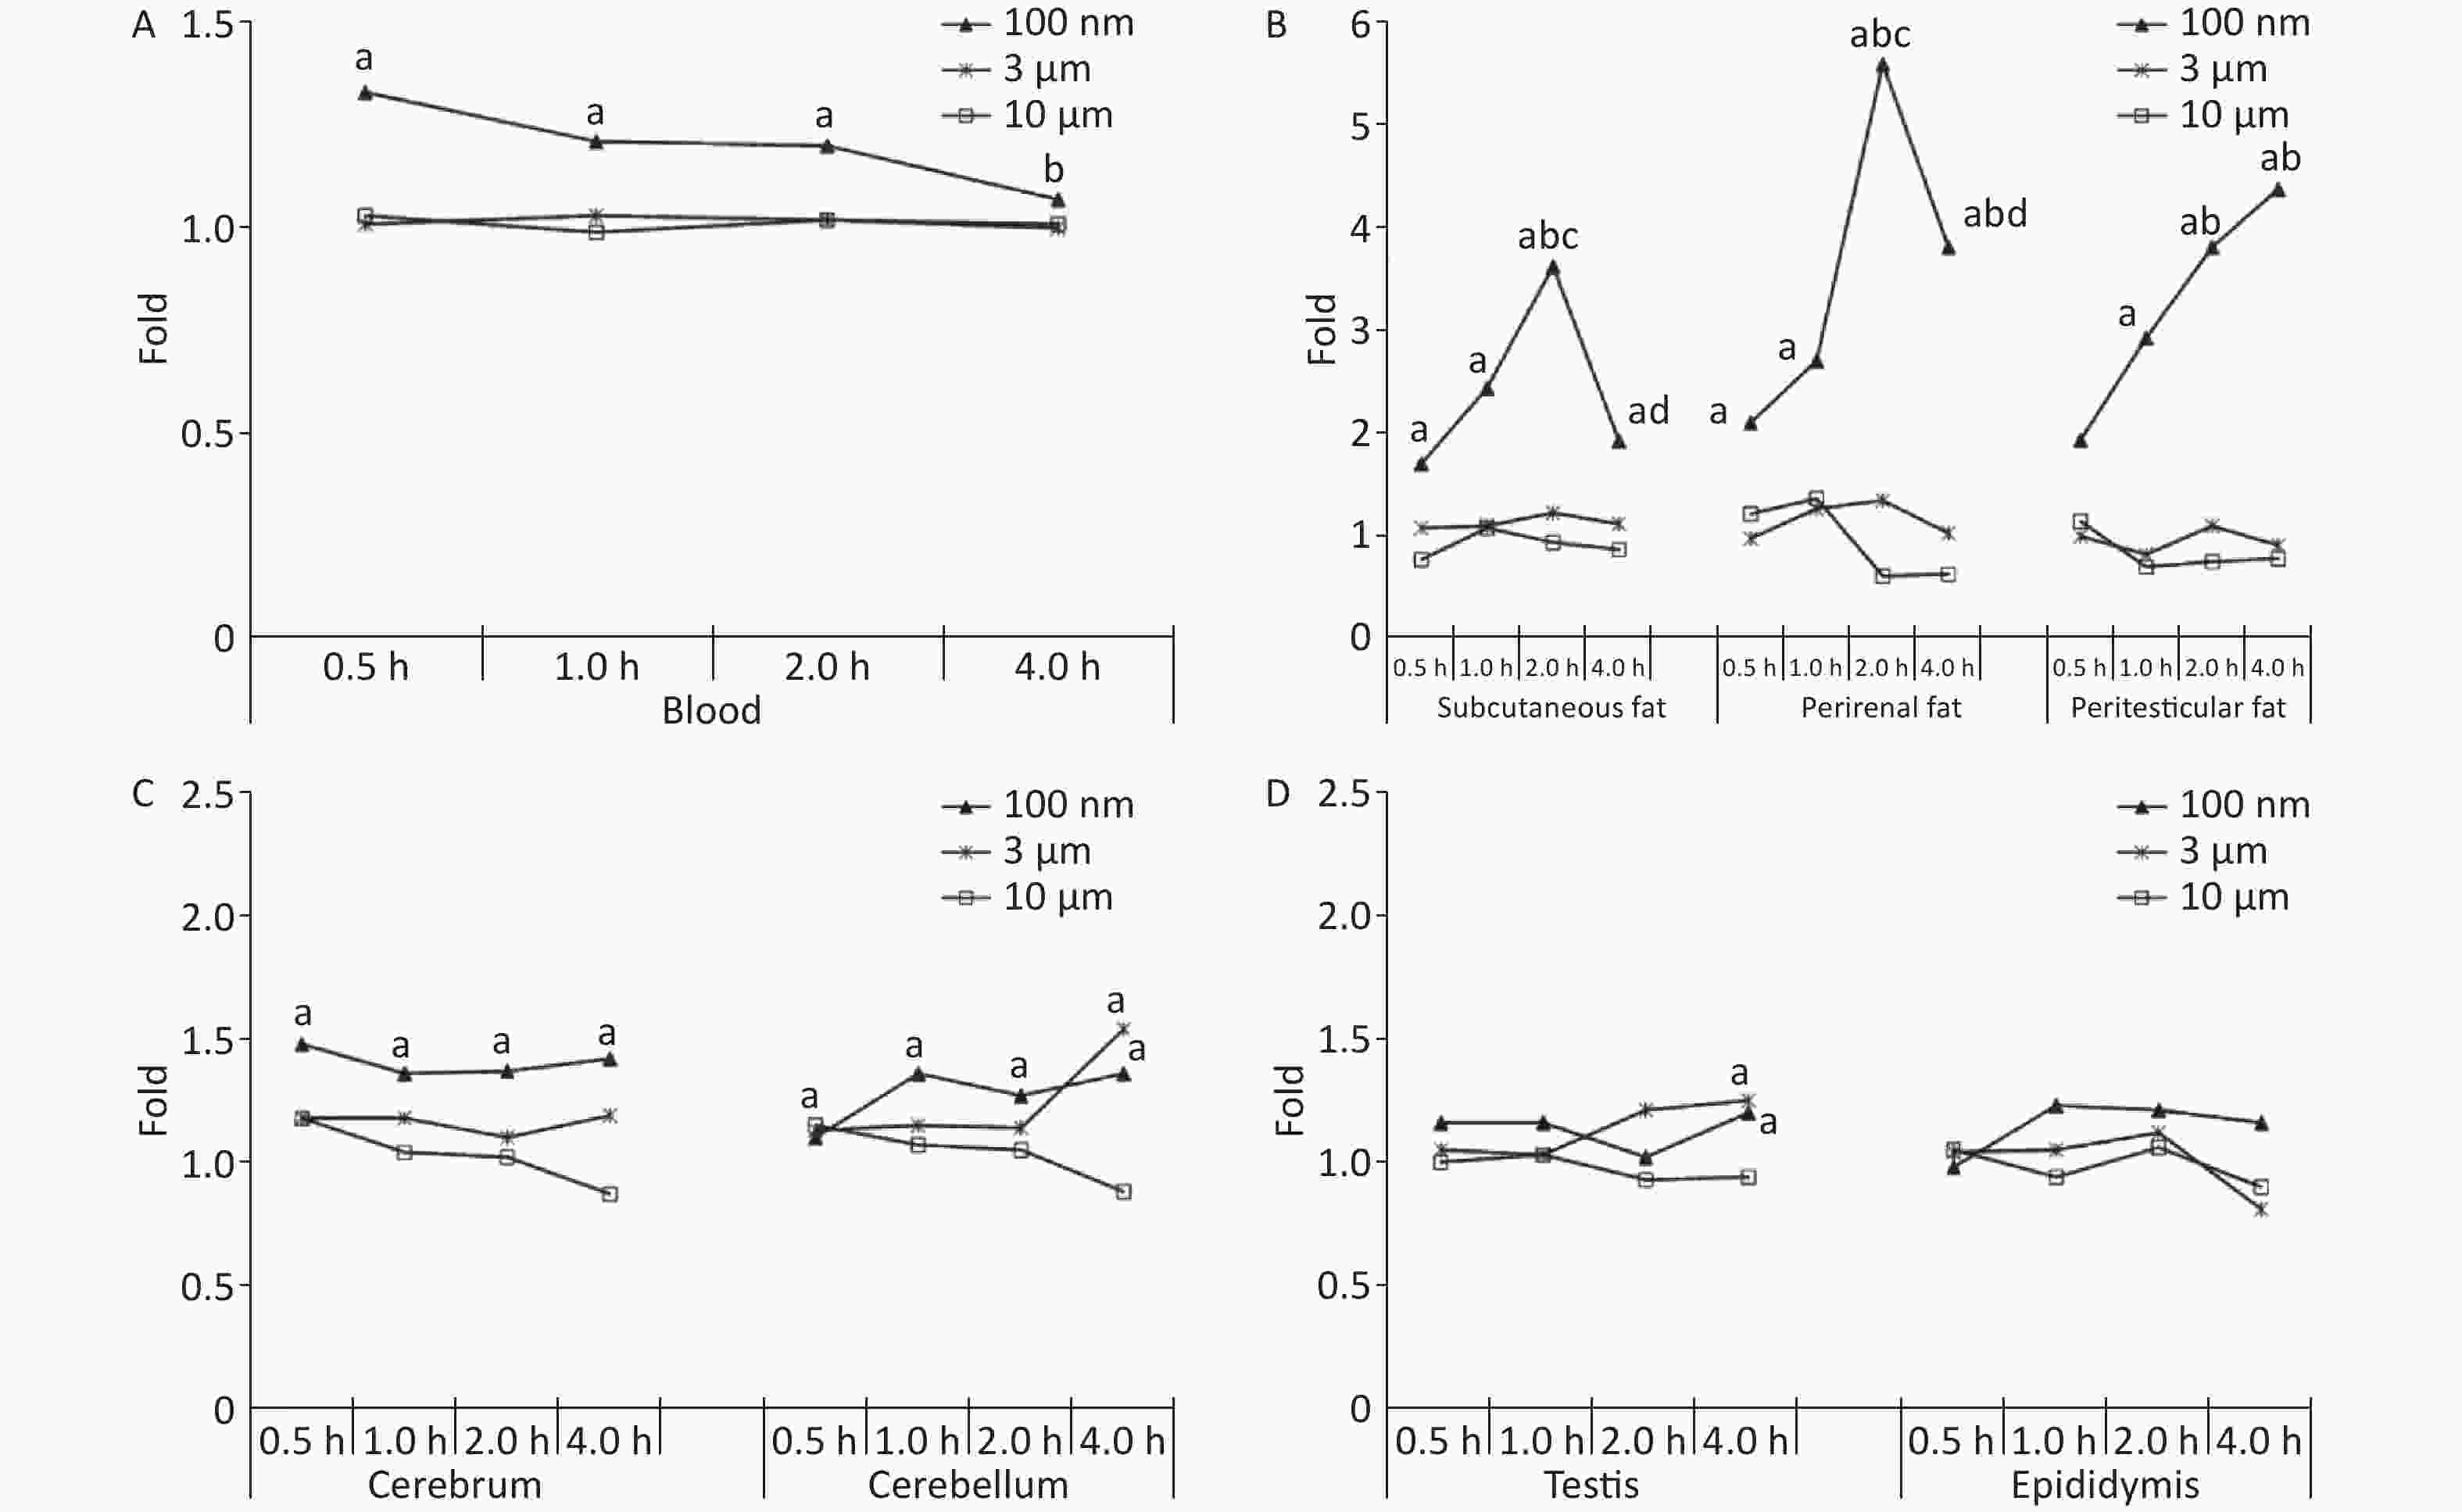
Figure 1. Time course changes of fluorescence intensity in blood, adipose tissues, nervous system, and reproductive system after administering PS beads by gavage at a dose of 200 mg∙kg−1∙BW. n = 3; (A) blood; (B) adipose tissues; (C) nervous system; (D) reproductive system. a, compared with control, P < 0.05; b, compared with 0.5 h, P < 0.05; c, compared with 1 h, P < 0.05; d, compared with 2 h, P < 0.05. PS, polystyrene
-
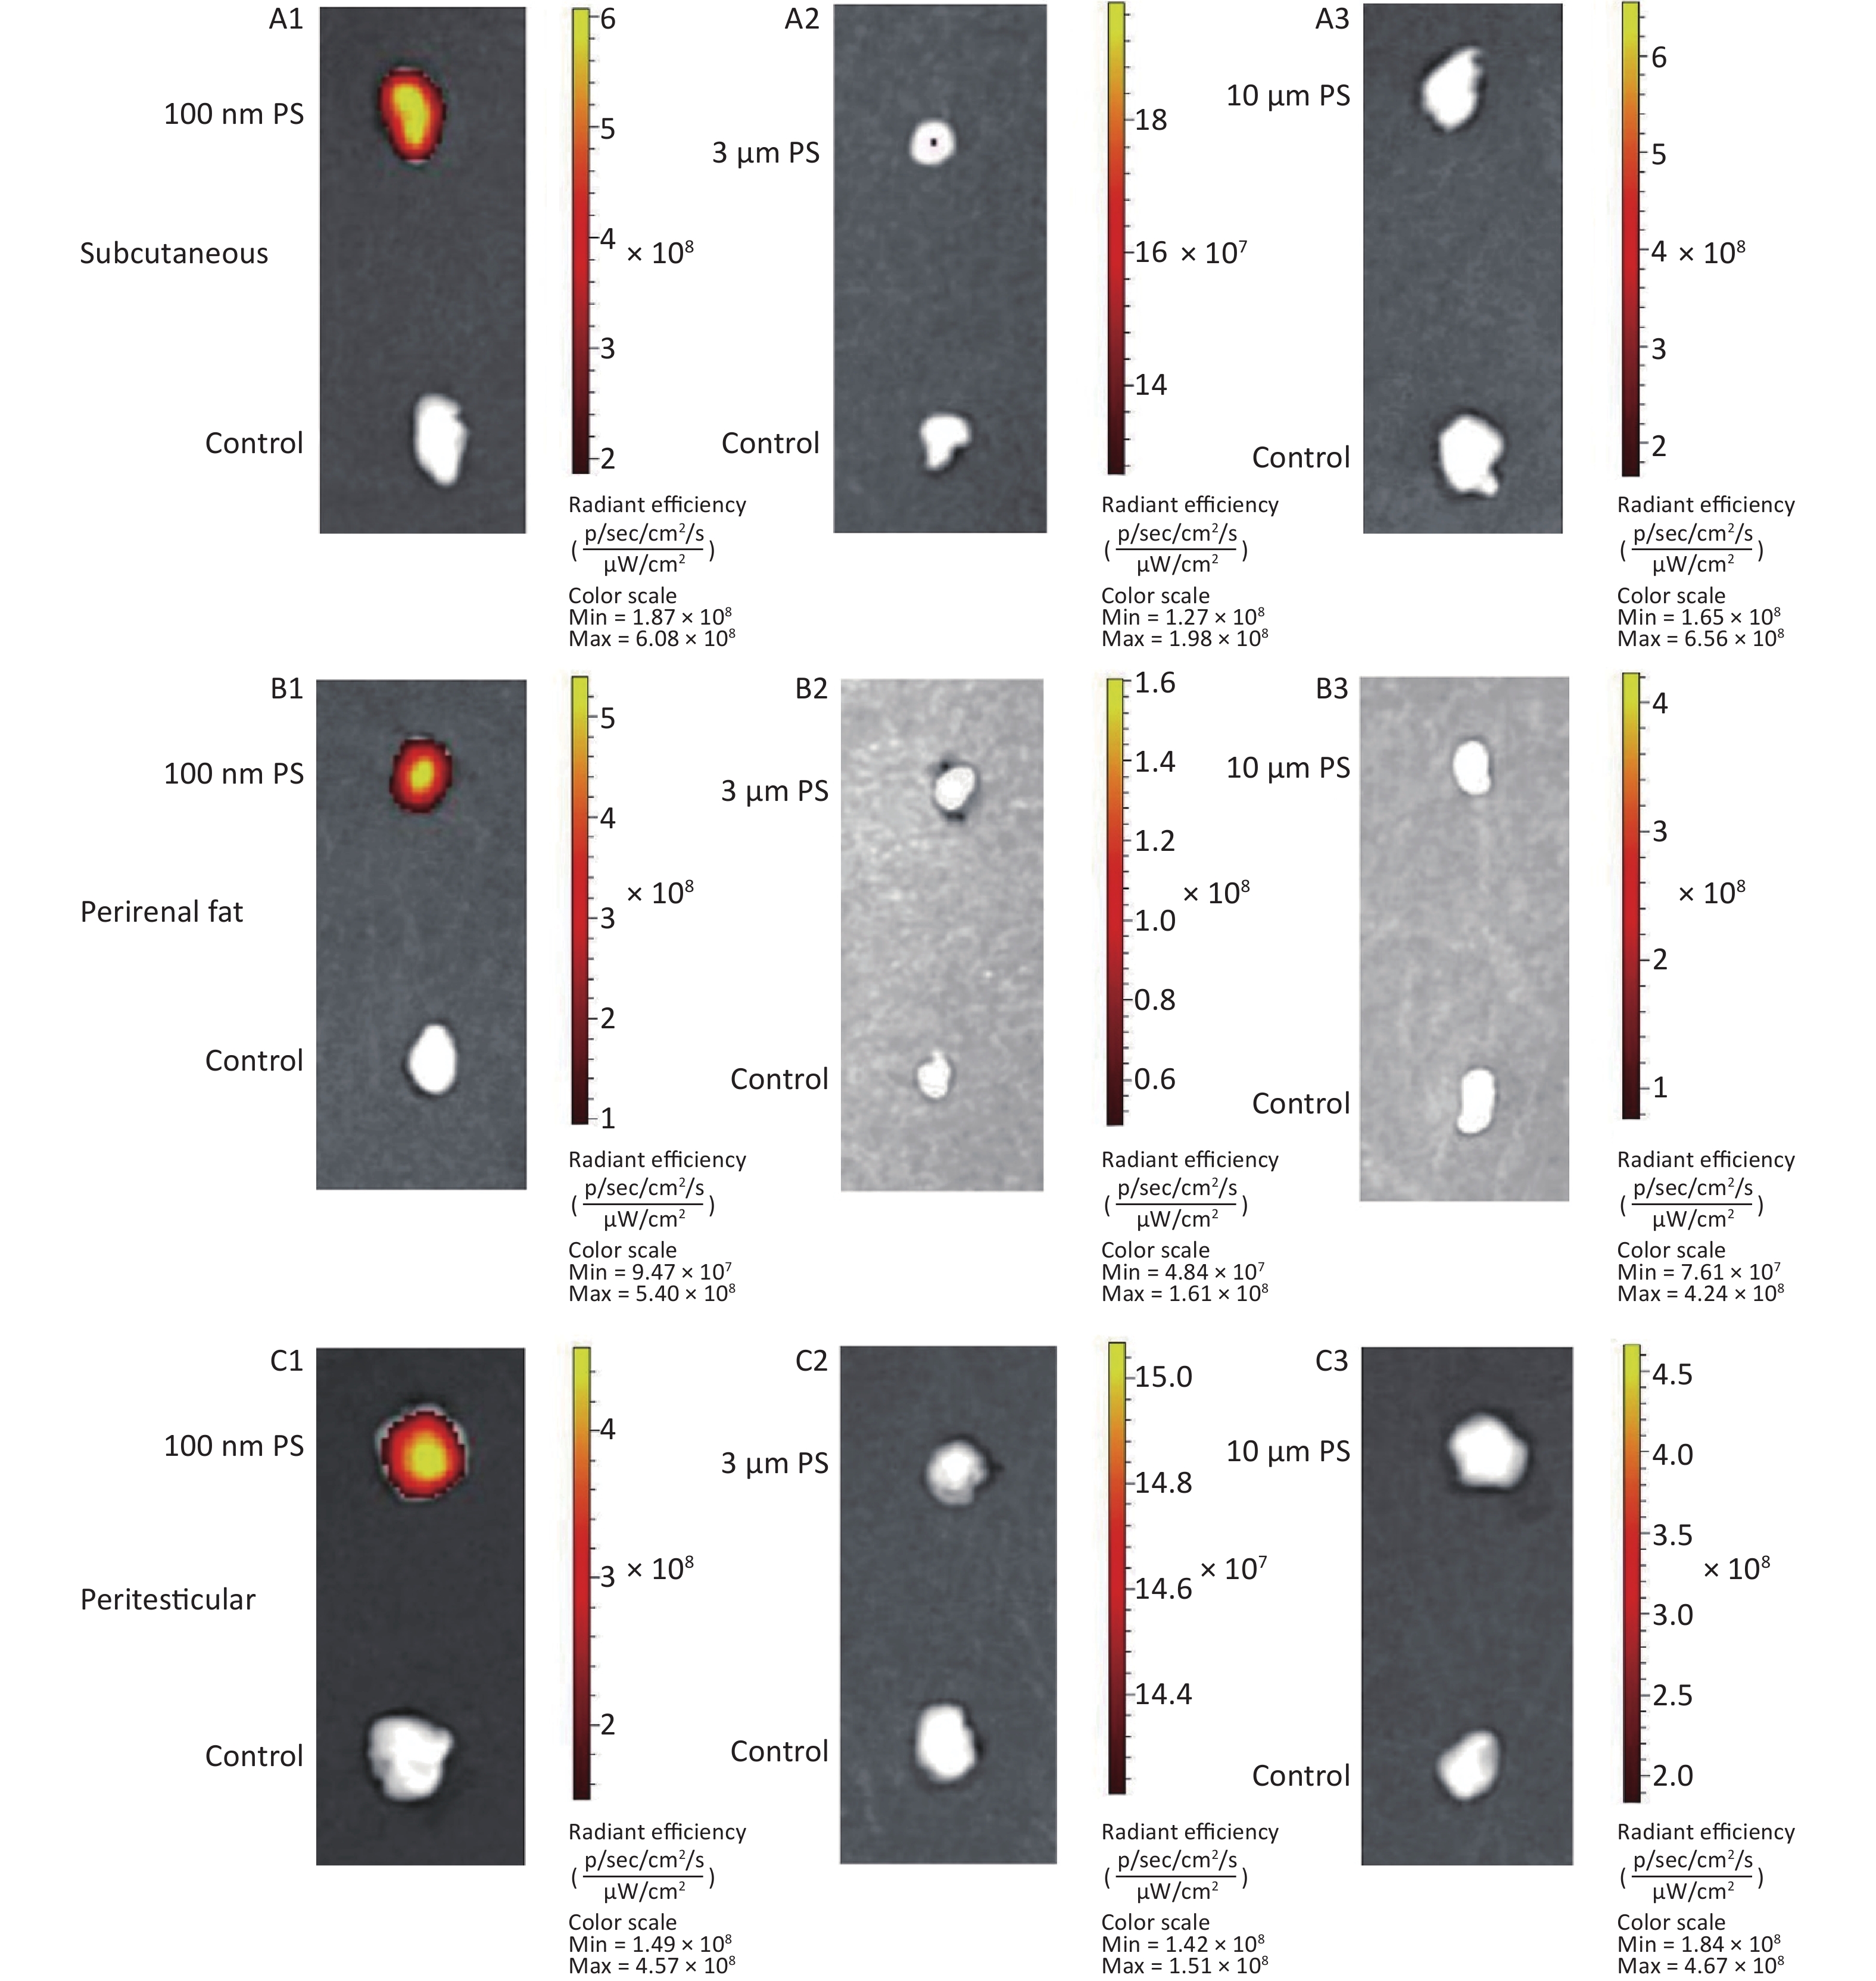
For all adipose tissues examined, the increases in fluorescence intensity in the 100 nm PS-treated group were significant, even at the first time point (P < 0.05). However, the change trend was different among different adipose tissues. For subcutaneous and perirenal fat, fluorescence intensity continued to increase for 2 h (P < 0.05) after exposure, then decreased significantly at 4 h, but was still at a significantly high level in comparison to the control group (P < 0.05). The highest increasing level of fluorescence intensity was 3.65 times and 5.63 times as the control group, respectively. For peritesticular fat, the fluorescence intensity continued to increase during the entire time period (P < 0.05). At the 4 h time point, fluorescence intensity reached the highest level (4.41 times). In contrast, there were no significant changes observed in the 3 and 10 μm PS-treated groups (Figure 1B and Supplementary Figure S2-1A1−C3, available in www.besjournal.com).
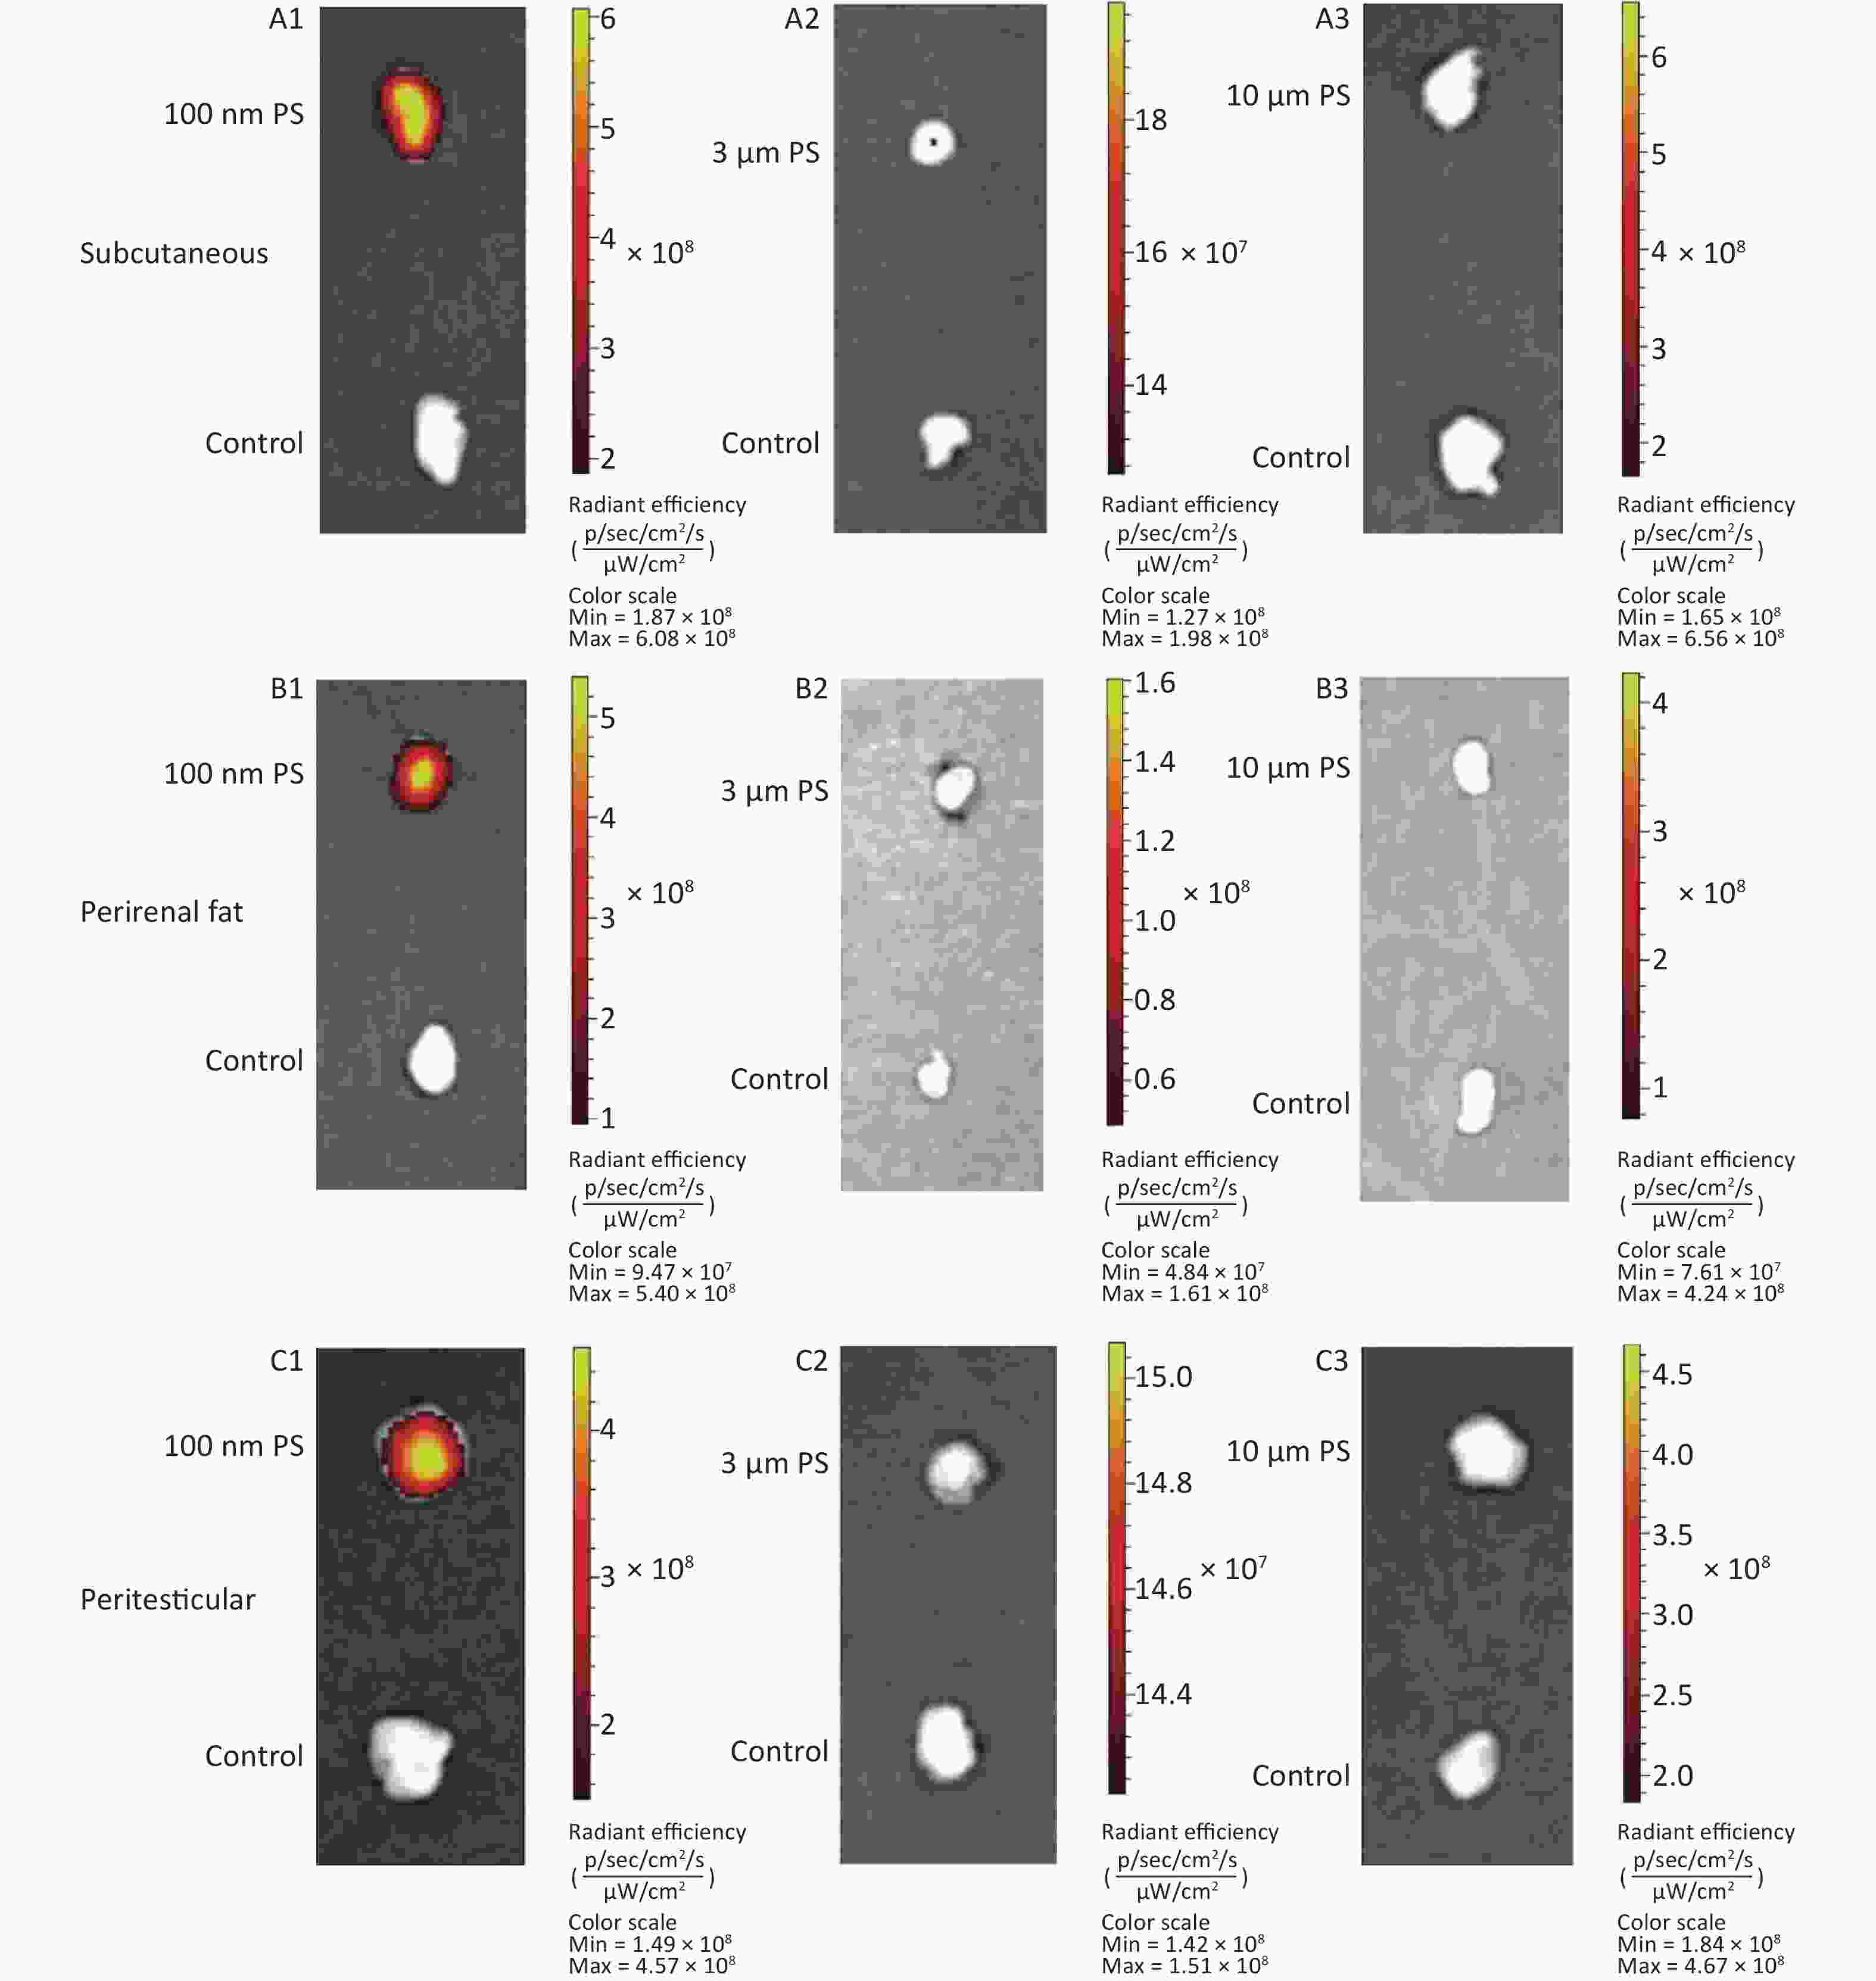
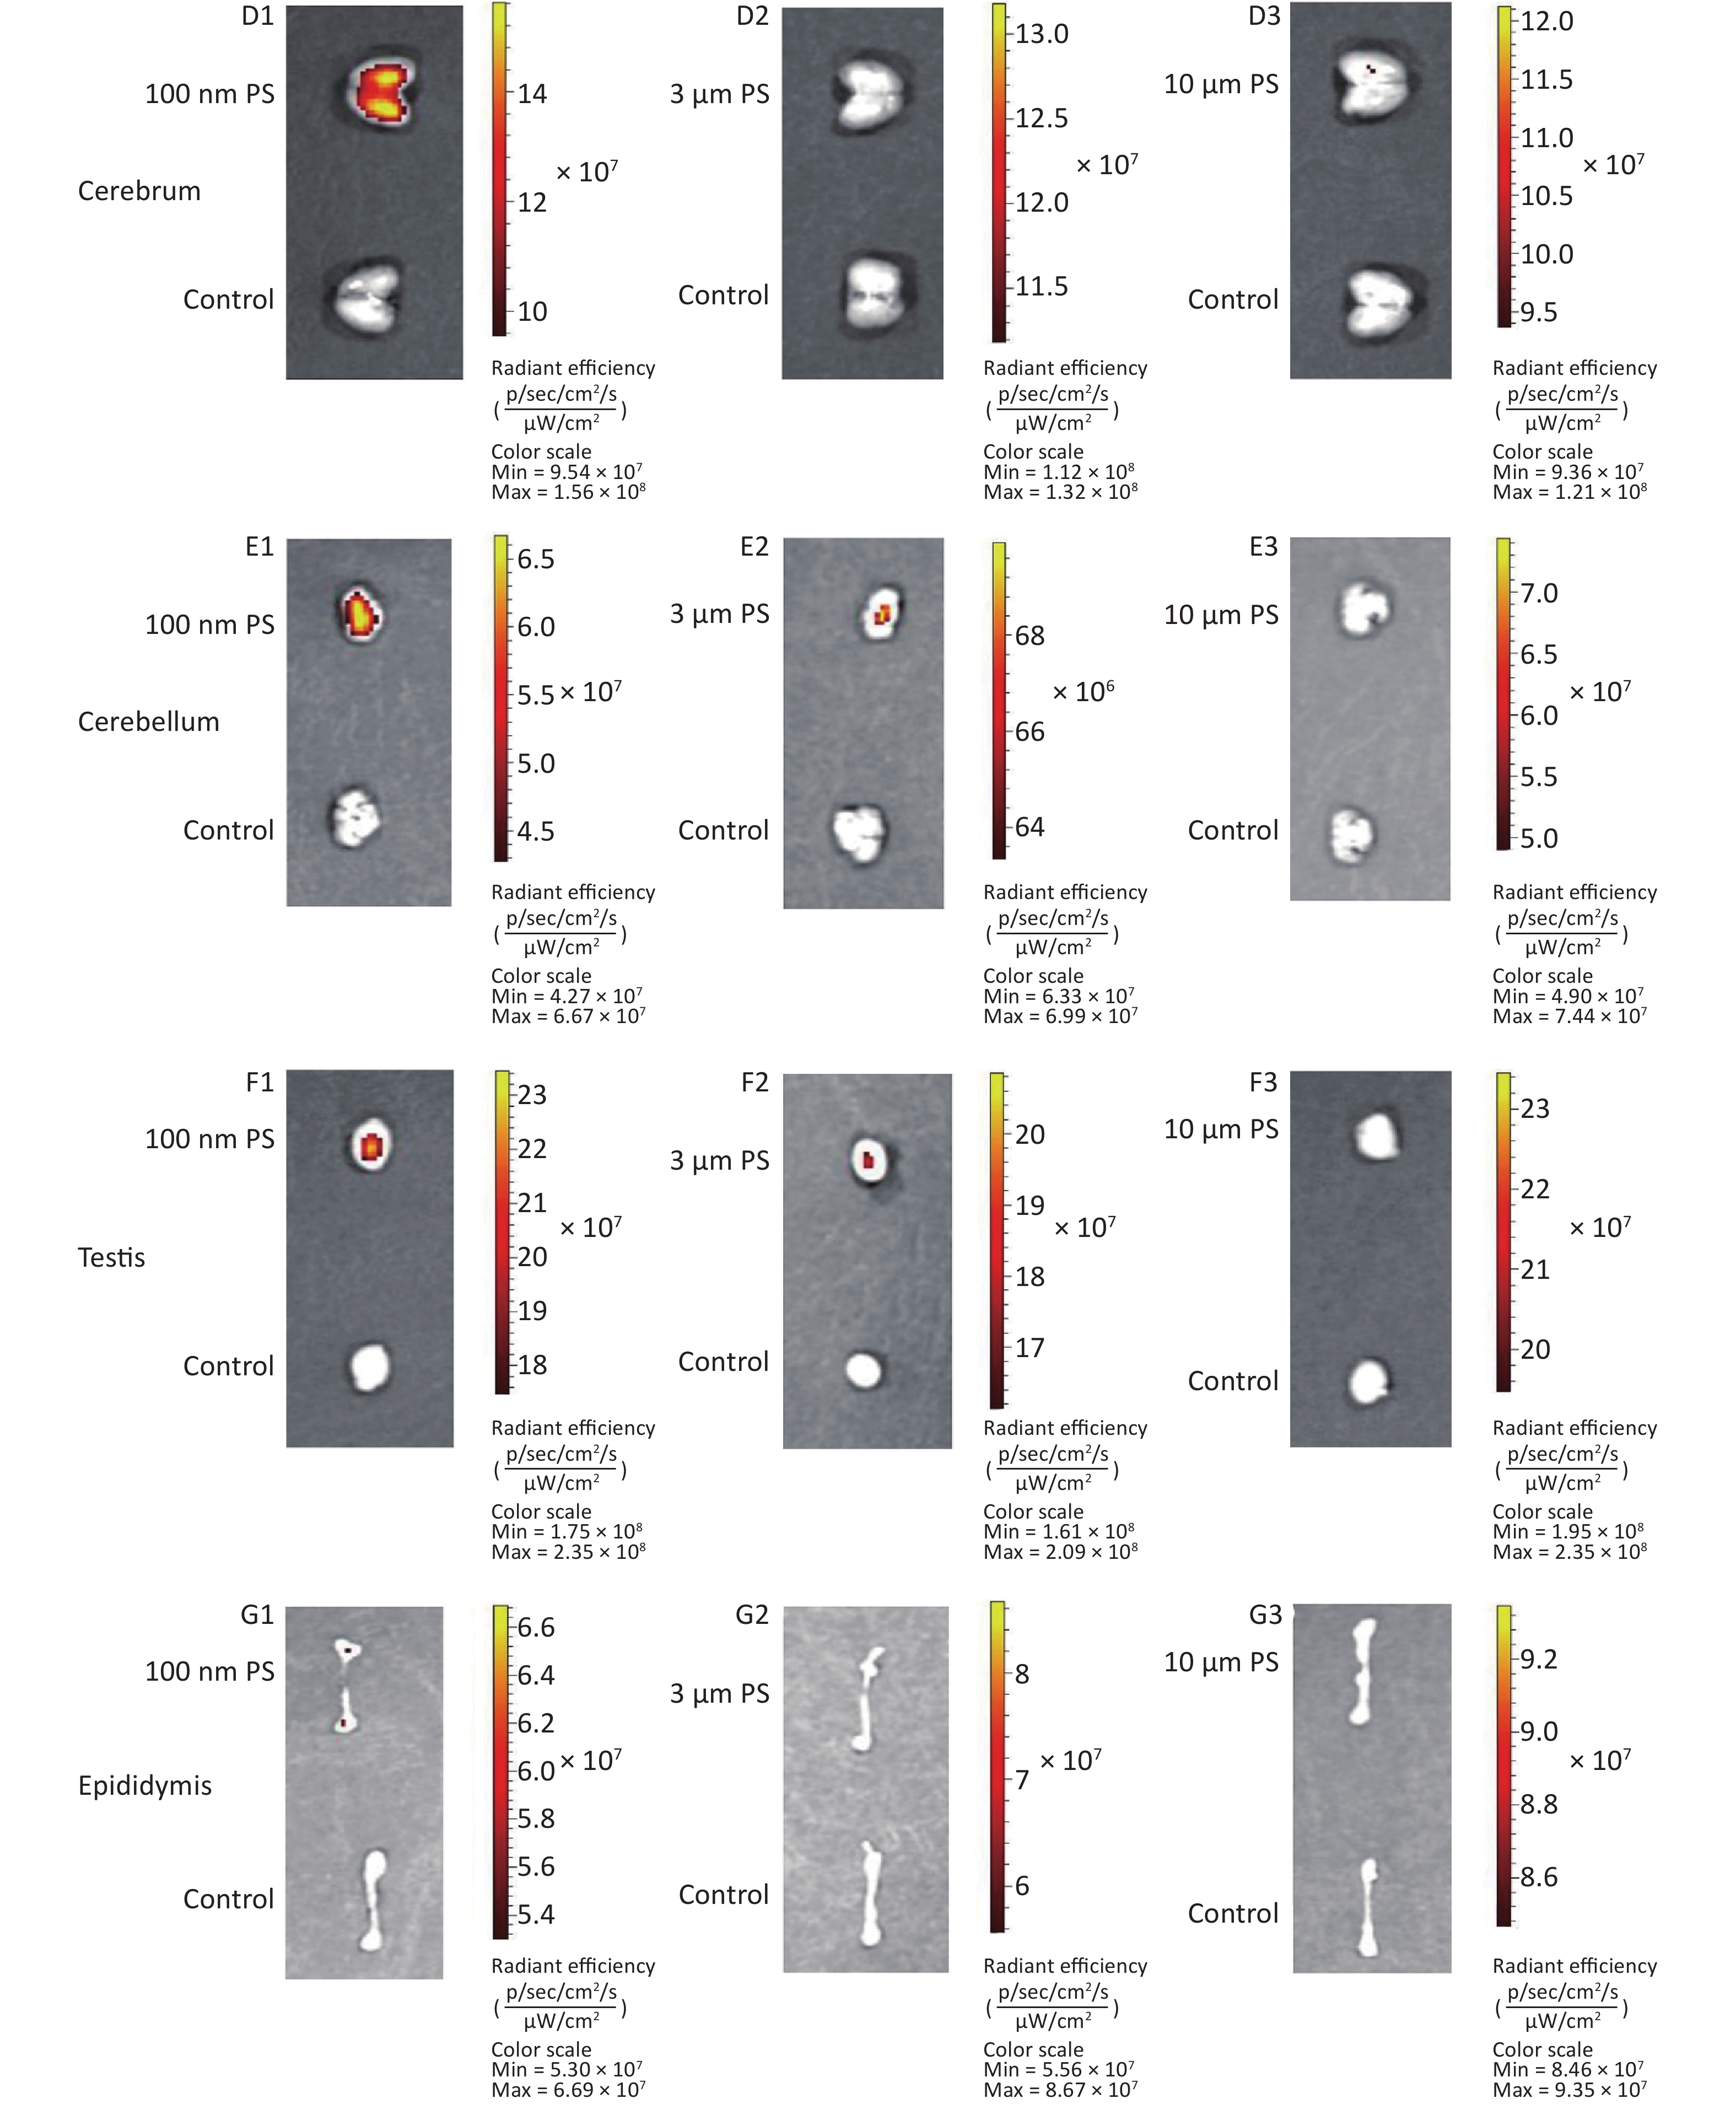
Figure S2-1. The IVIS Spectrum small-animal imaging system images for the tissues examined.
-
Cerebrum and cerebellum samples were detected by IVIS Spectrum. The results could reflect the ability of micro- and nano- PS beads to penetrate the blood-brain barrier. Figure 1C shows the time course changes of fluorescence intensity in the nervous system at different time points after PS beads exposure. After gavage at a dose of 200 mg∙kg−1∙BW, the fluorescence intensity of the cerebrum increased significantly at all time points (P < 0.05) in the 100 nm PS-treated group. With respect to the cerebellum, a significant increase in fluorescence intensity was also observed since the 1 h time point (P < 0.05). In the 3 μm PS-treated group, a significant increase in fluorescence intensity (1.54 times) was observed in the cerebellum 4 h after oral exposure (P < 0.05). In the 10 μm PS-treated group, no change was observed. The IVIS Spectrum small-animal imaging system images are shown in Supplementary Figure S2-2D1−E3.
-
Figure 1D shows the time course changes of fluorescence intensity in the reproductive system at different time points after PS beads exposure. In the testis, the increase in fluorescence intensity at 4 h was significant (fold = 1.19, P < 0.05) in the 100 nm PS-treated group; however, no significance existed in the epididymis even if the level reached a 1.22 fold increase. Interestingly, the autofluorescence intensity of the epididymis was nearly 2 times the level of the testis. In the 3 μm PS-treated group, a significant increase in fluorescence intensity also reached statistical significance (P = 0.047). No significant changes were demonstrated for the 10 μm PS beads. The images in IVIS Spectrum are shown in Supplementary Figure S2-2F1−G3.
-
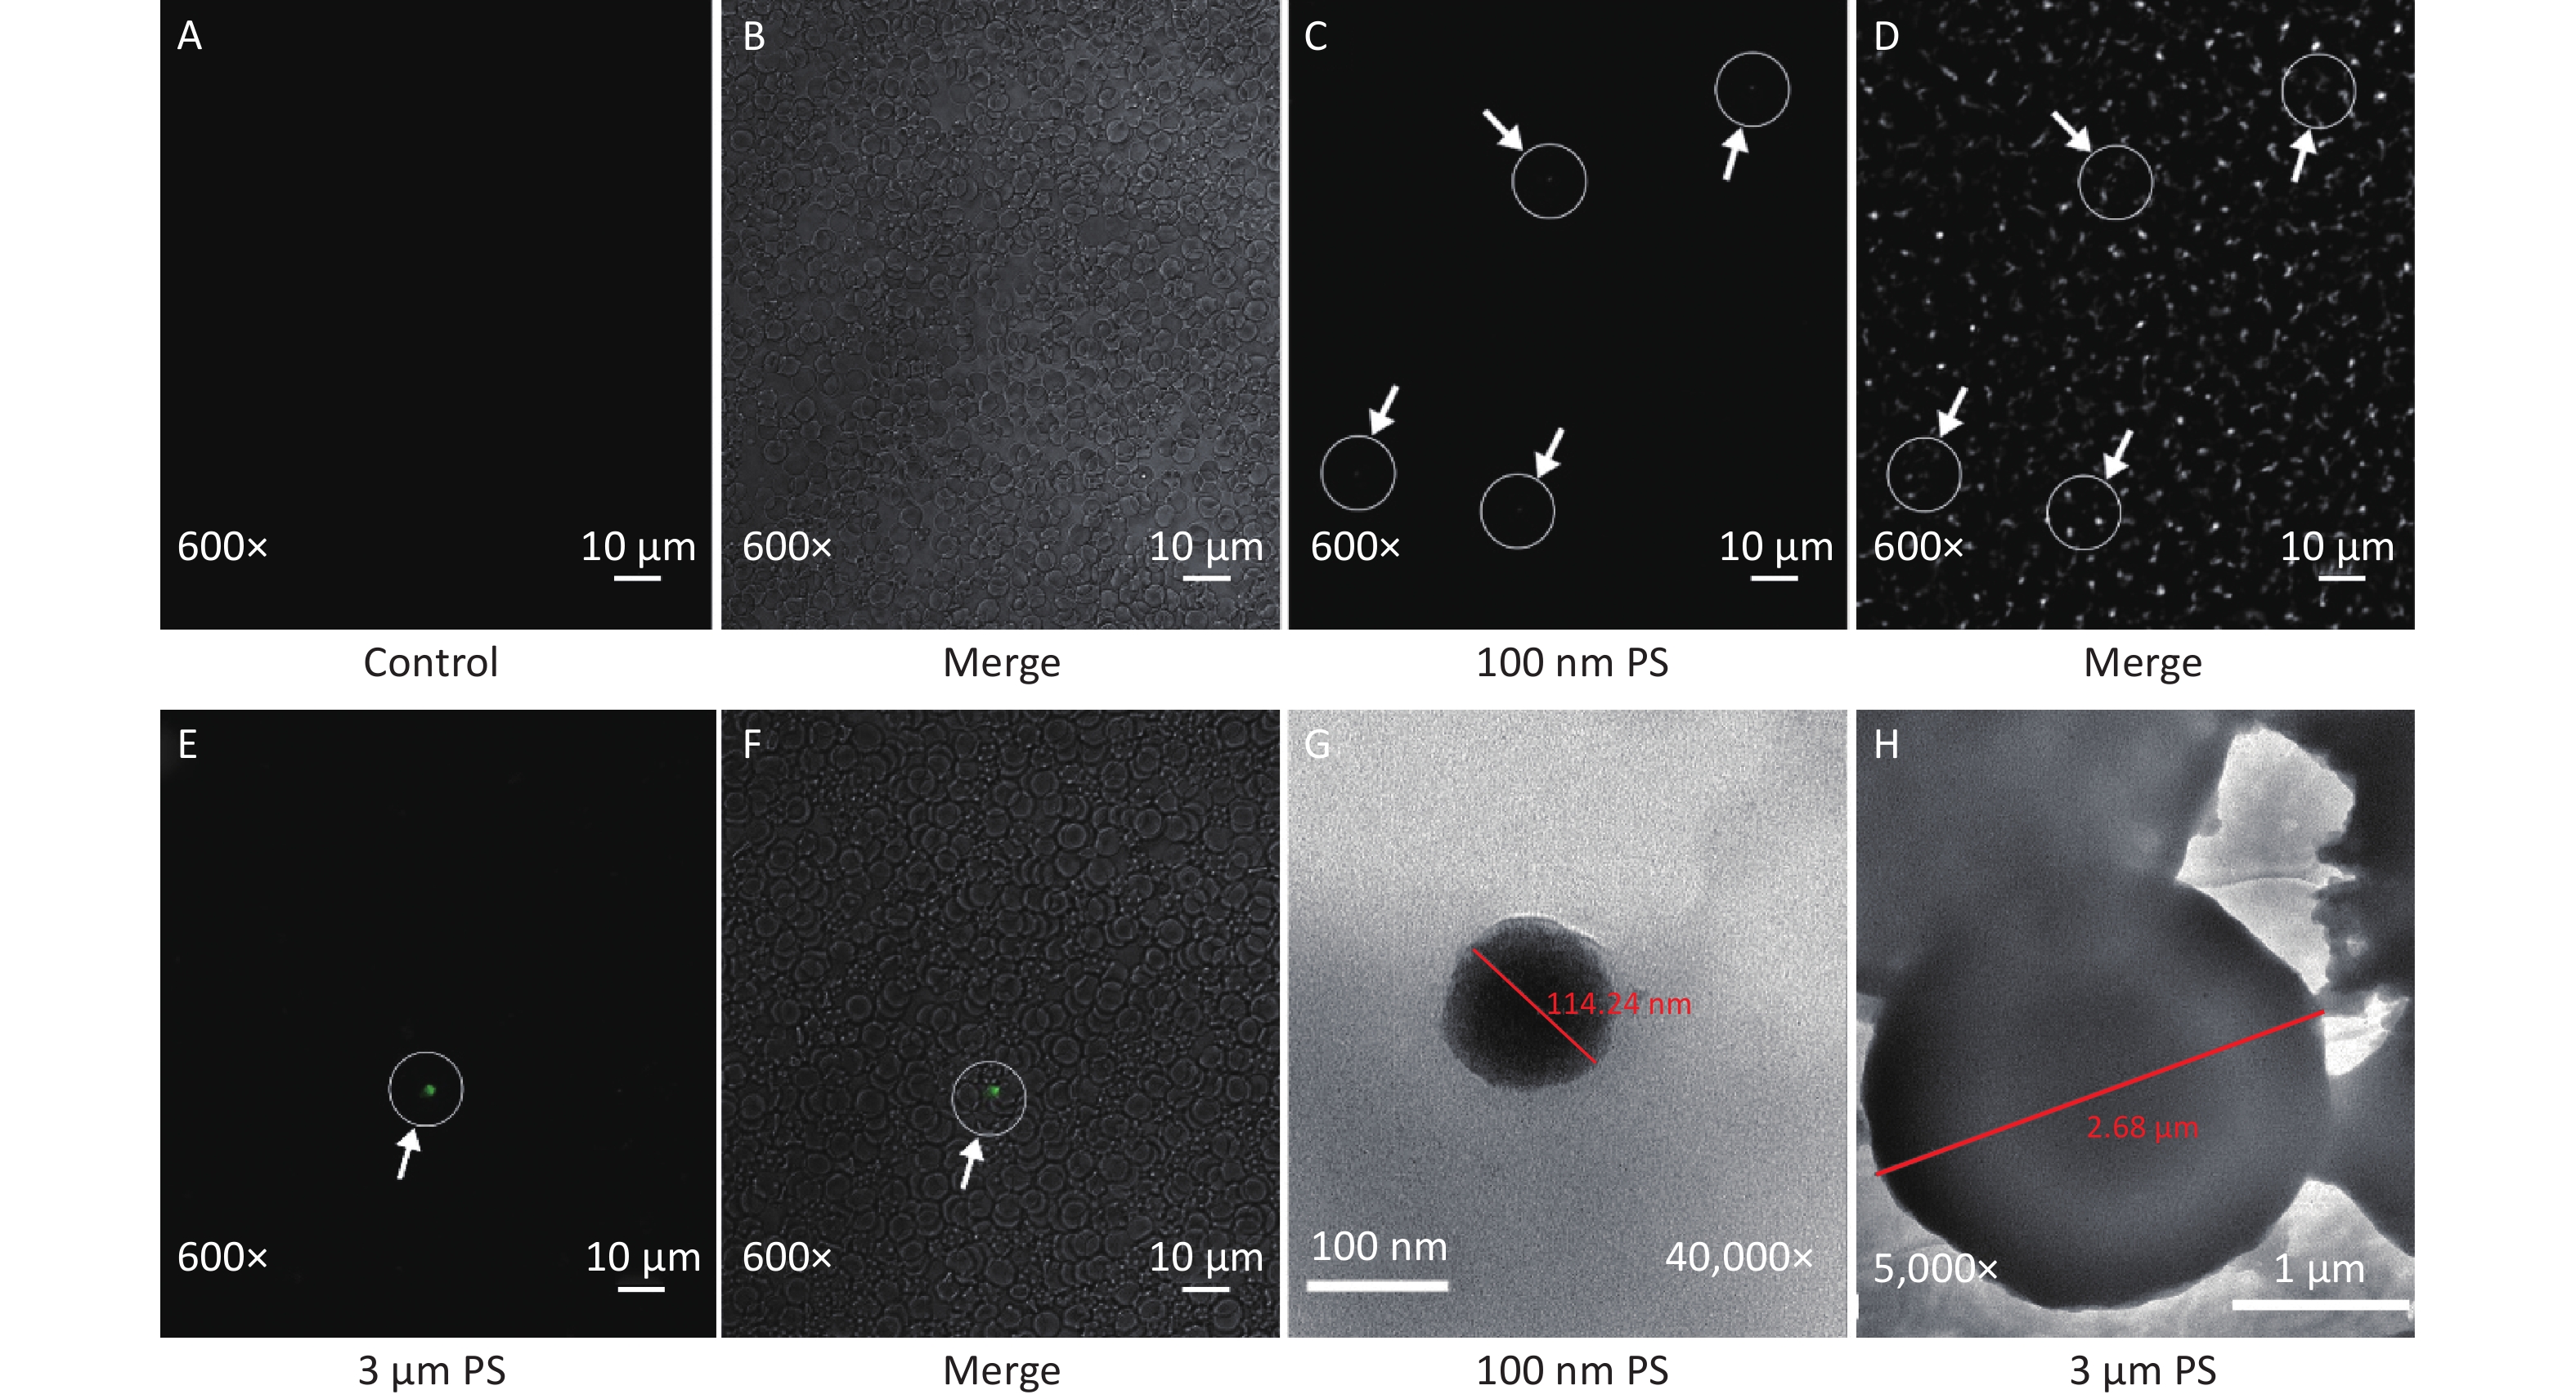
In this study, the absorption of PS beads in blood was confirmed by CLSM and results are shown in Figure 2. Since IVIS Spectrum revealed that blood sample at 0.5 h have the strongest fluorescent intensity in the 100 nm PS-treated group, the blood samples at 0.5 h was further examined by CLSM. Even if green PS beads was found (Figure 2C–D), it was difficult to pinpoint the exact location in blood stream due to its small size. As for the 3 μm PS-treated group, the blood samples were also examined by CLSM because significant increase were found in cerebrum and testis by IVIS spectrum at 4 h after exposure. Interesting, the presence of PS bead was found since 2 h after exposure (Figure 2E–F). No any green fluorescence beads was found in saline control group (Figure 2A–B).
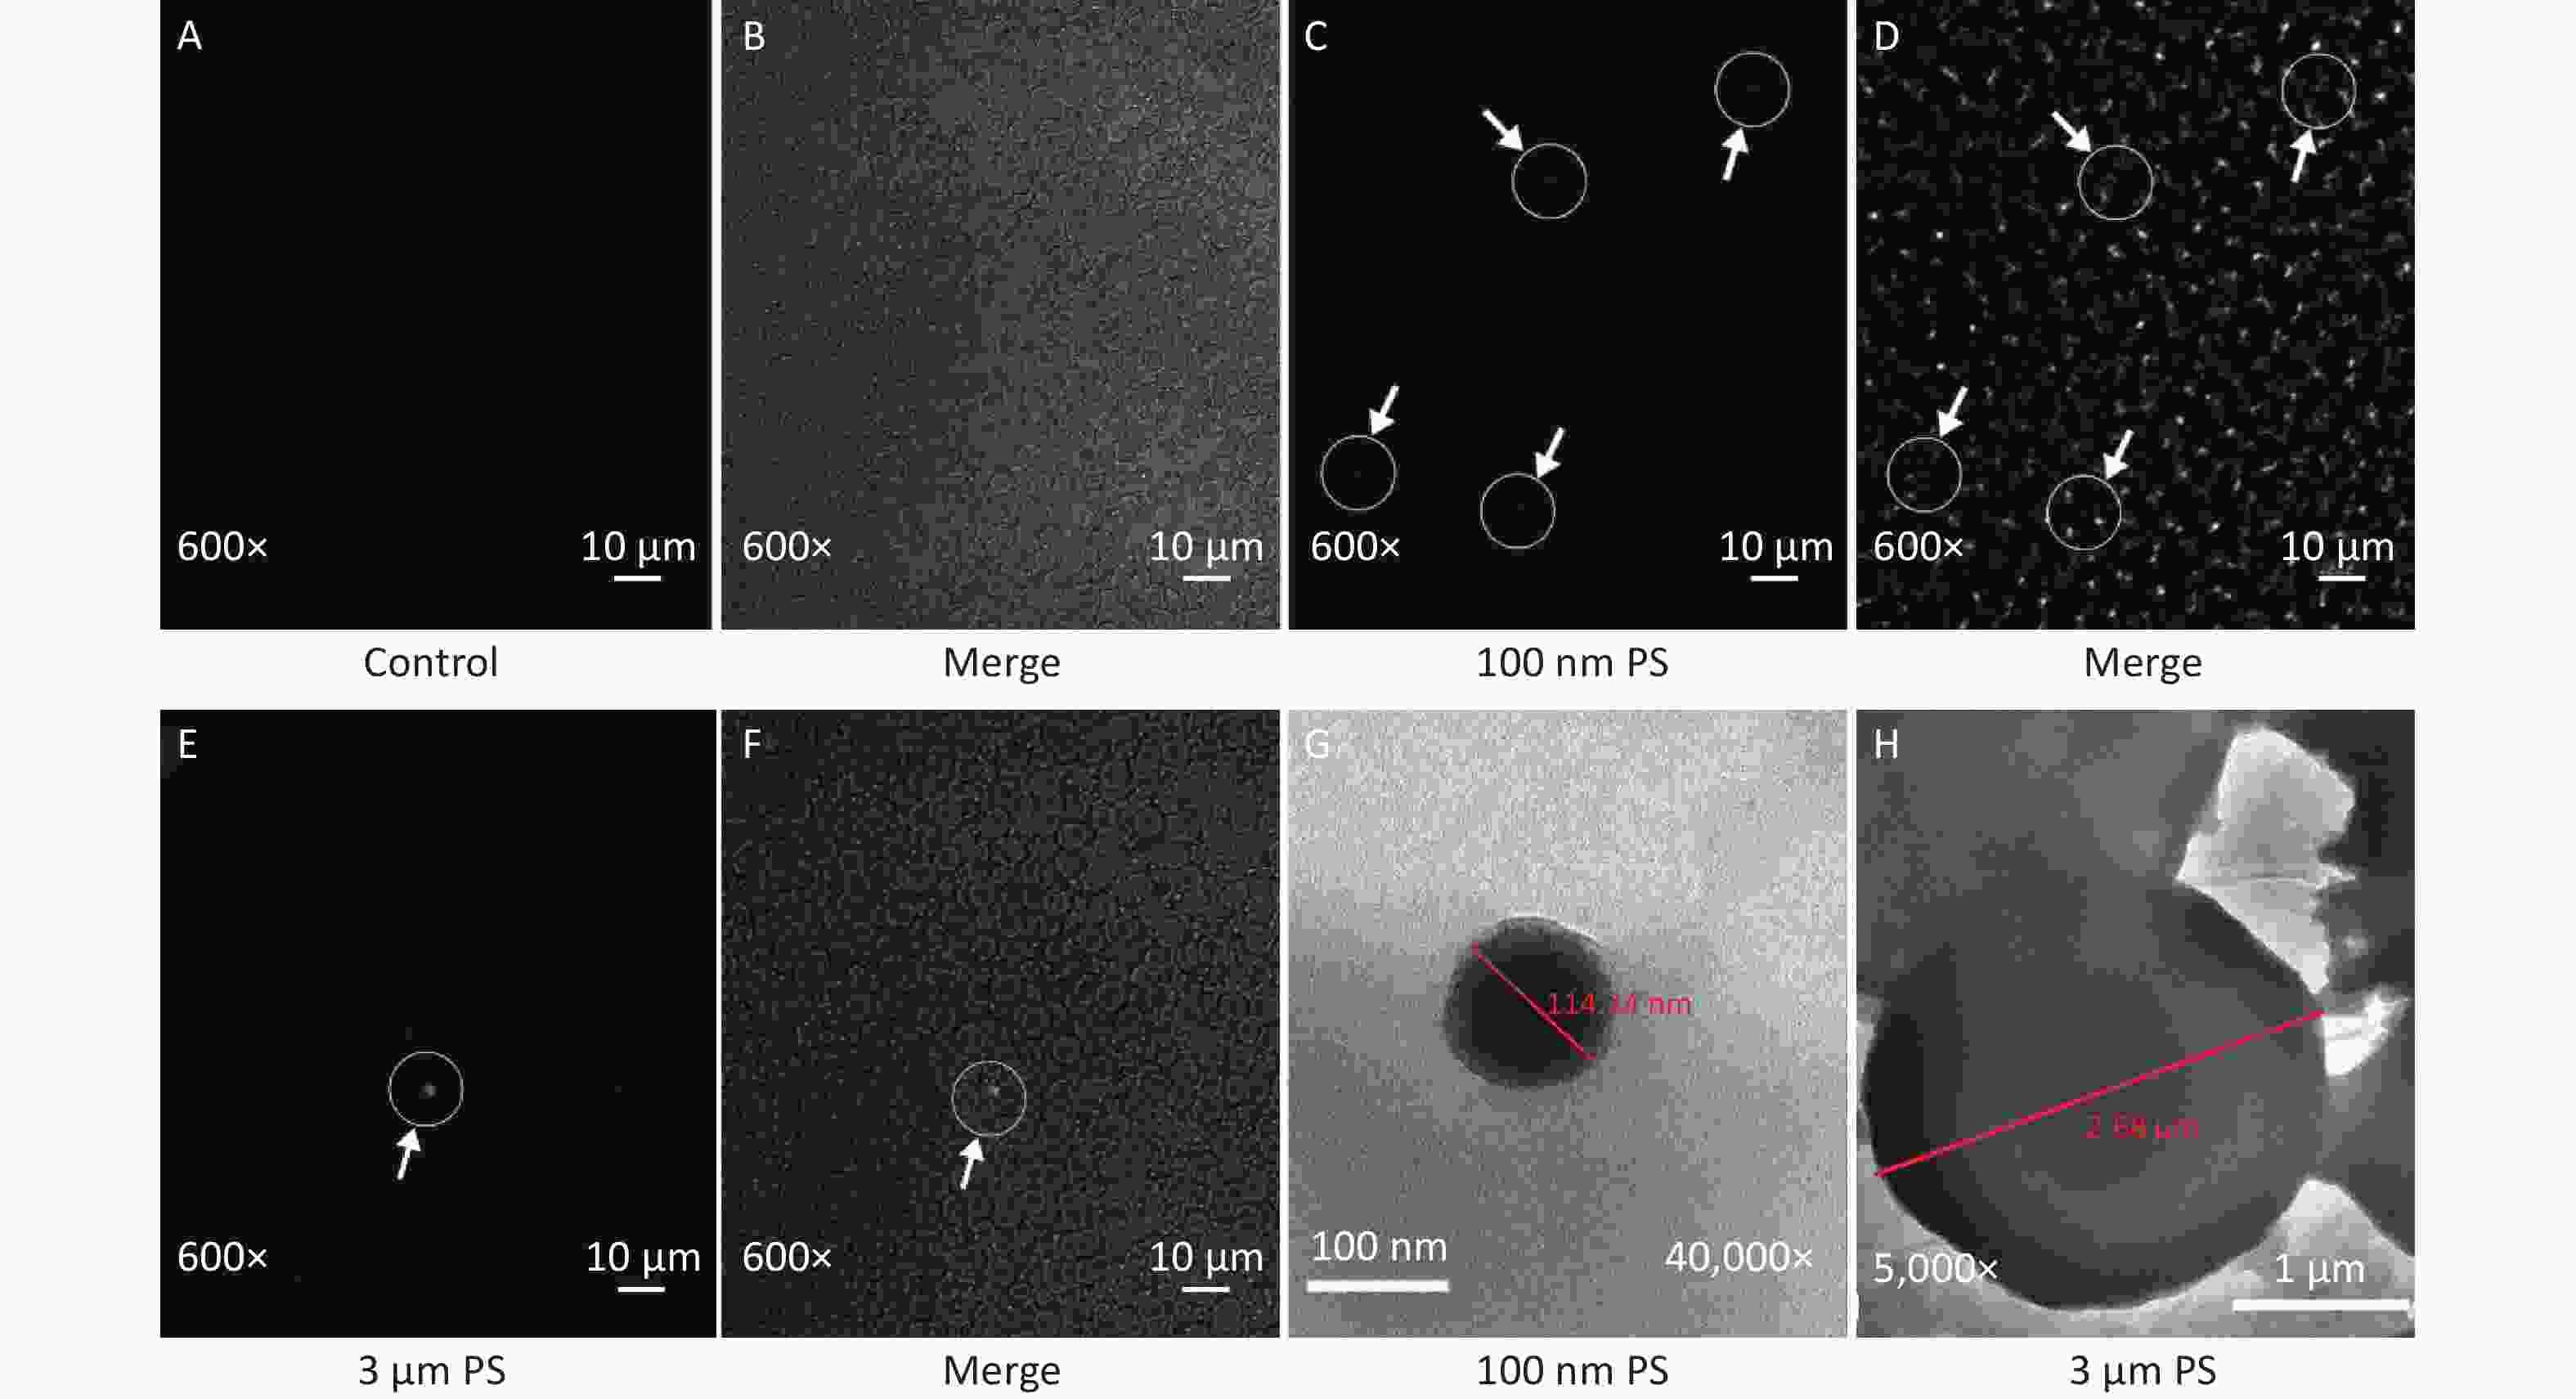
Figure 2. The evidence of PS beads in blood samples examined by CLSM and TEM. (A–B) are the fluorescence and bright-field images in the control group (600×). (C–D) are the images in 100 nm PS-treated group (600×). (E–F) are the images in 3 µm PS-treated group (600×). (G) (40,000×) is the TEM image for 100 nm PS bead. (H) (5,000×) is the TEM image for 3 µm PS bead. PS, polystyrene
Examination by TEM was also performed because the CLSM is not enough to distinguish the nanoparticle from fluorescent dye. Particles with diameter around 100 nm and 3 μm were found (Figure 2G–H).
-
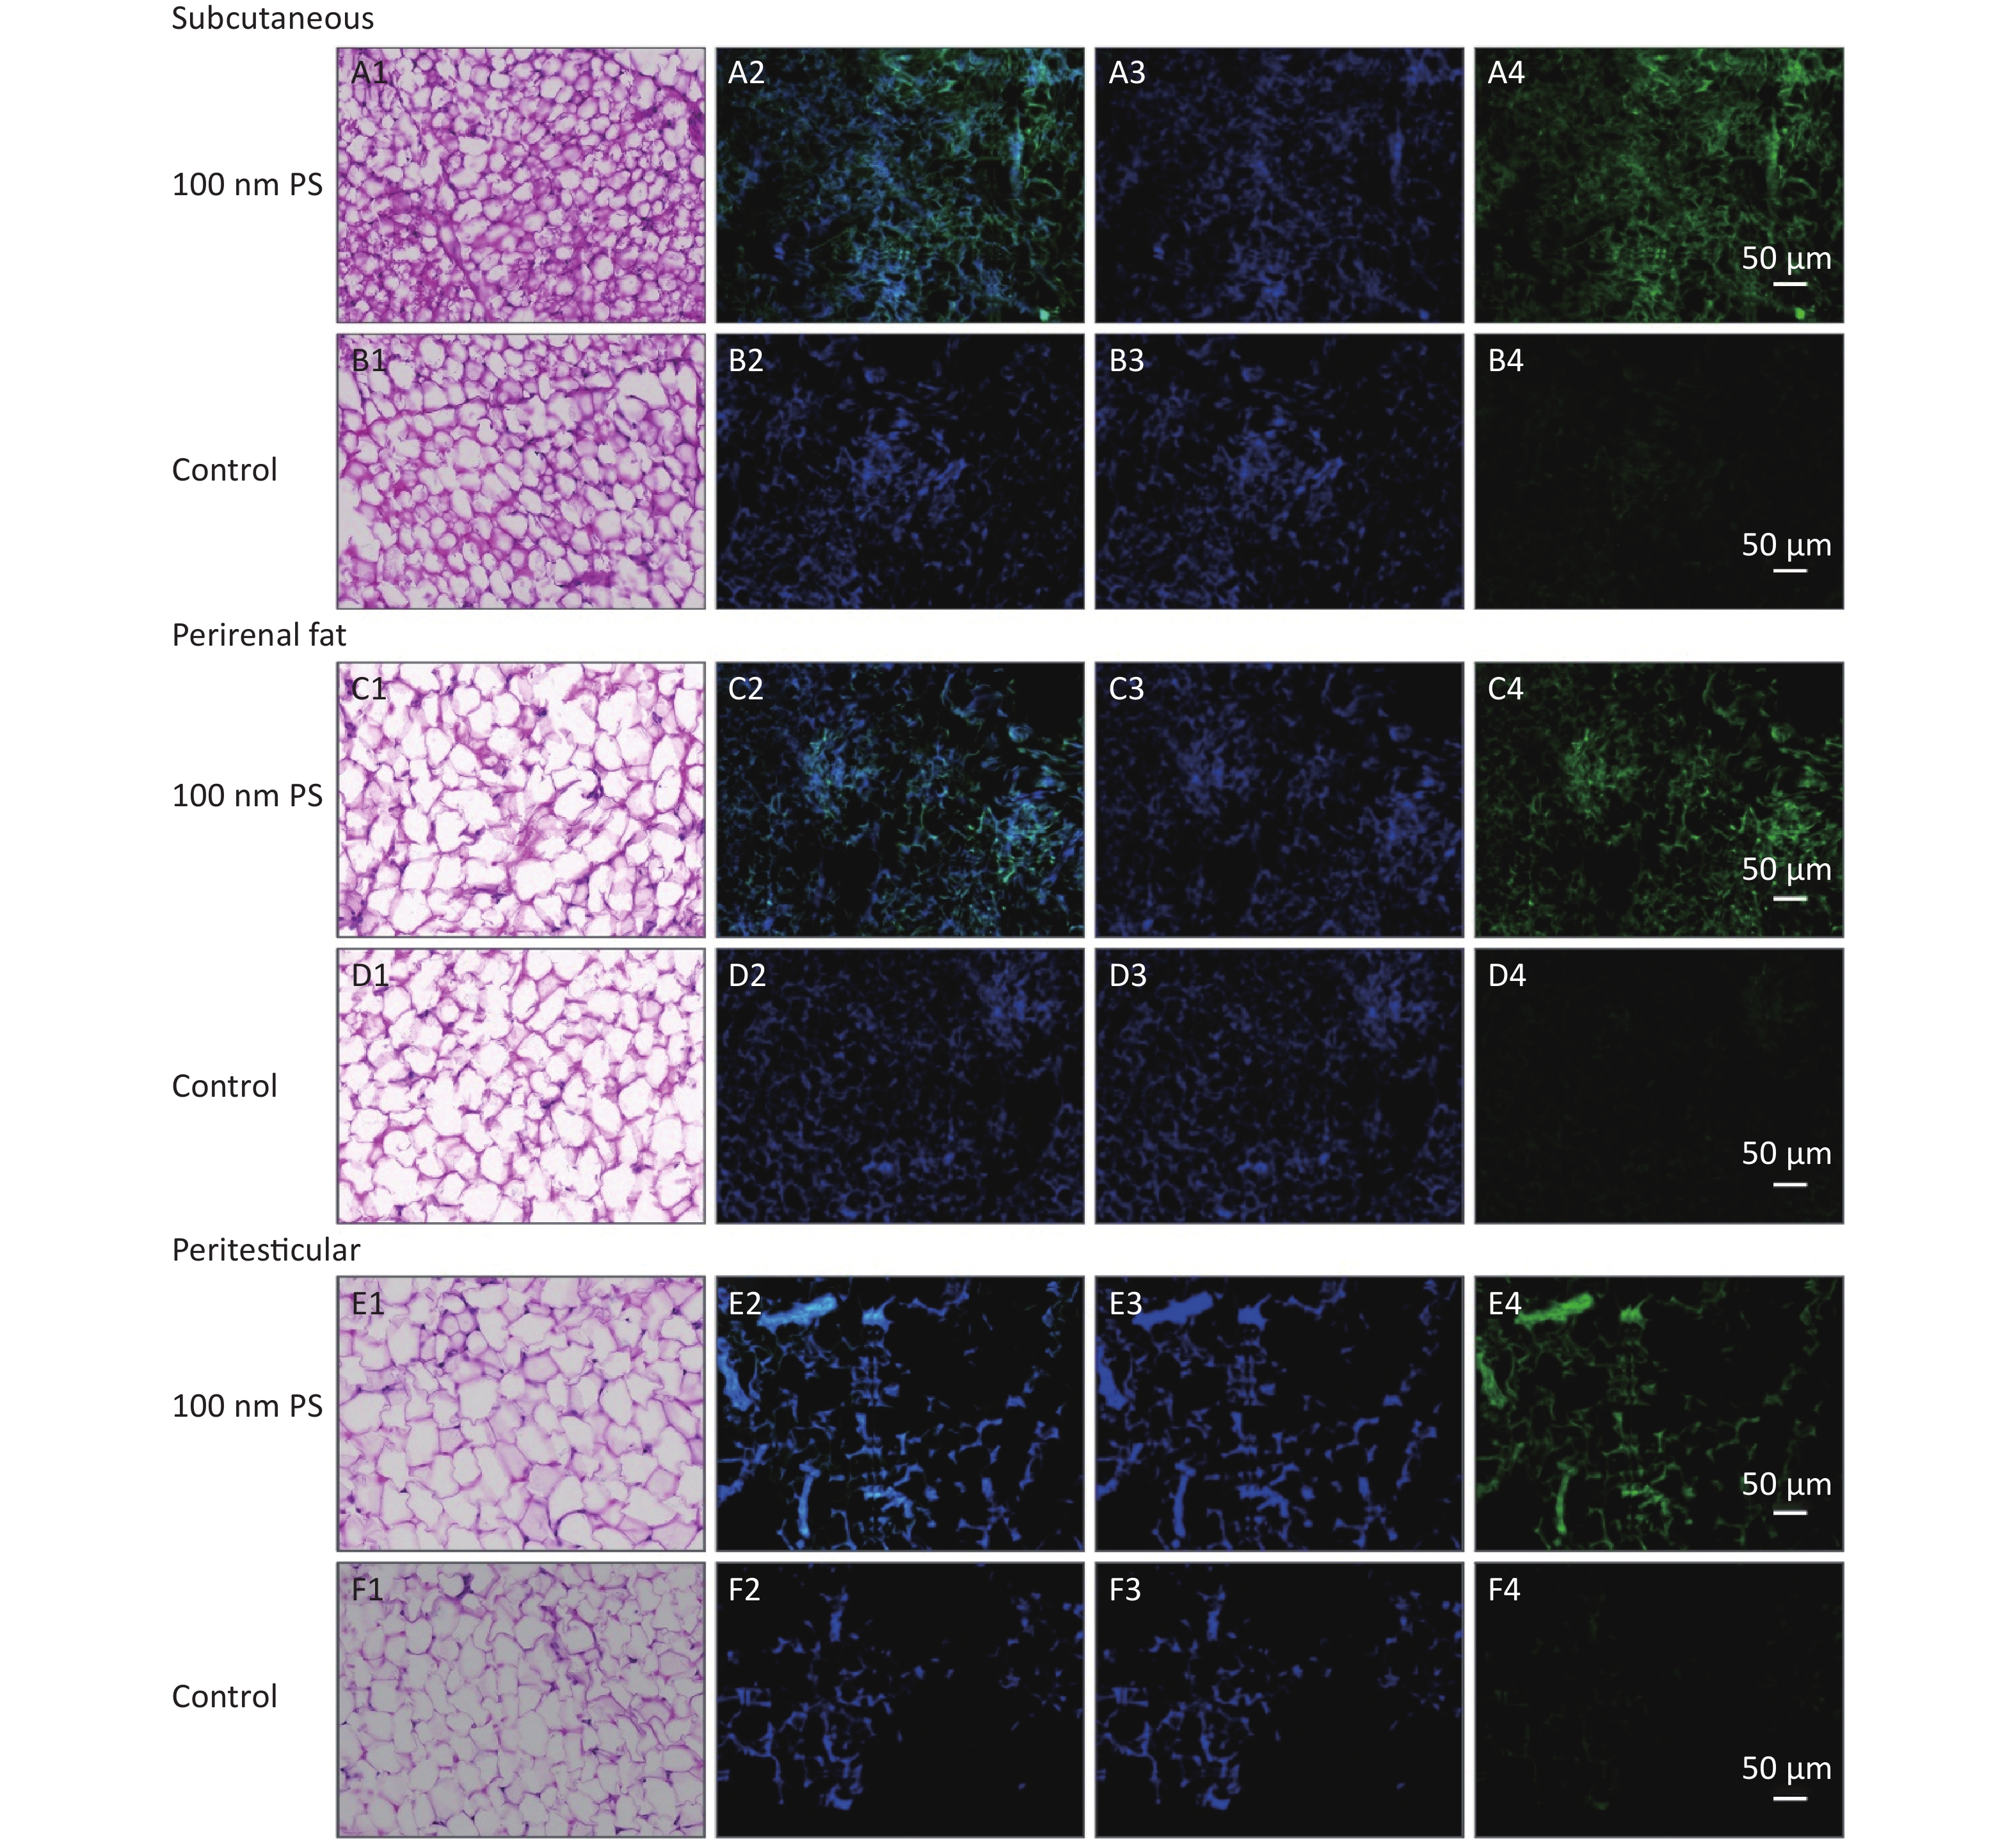
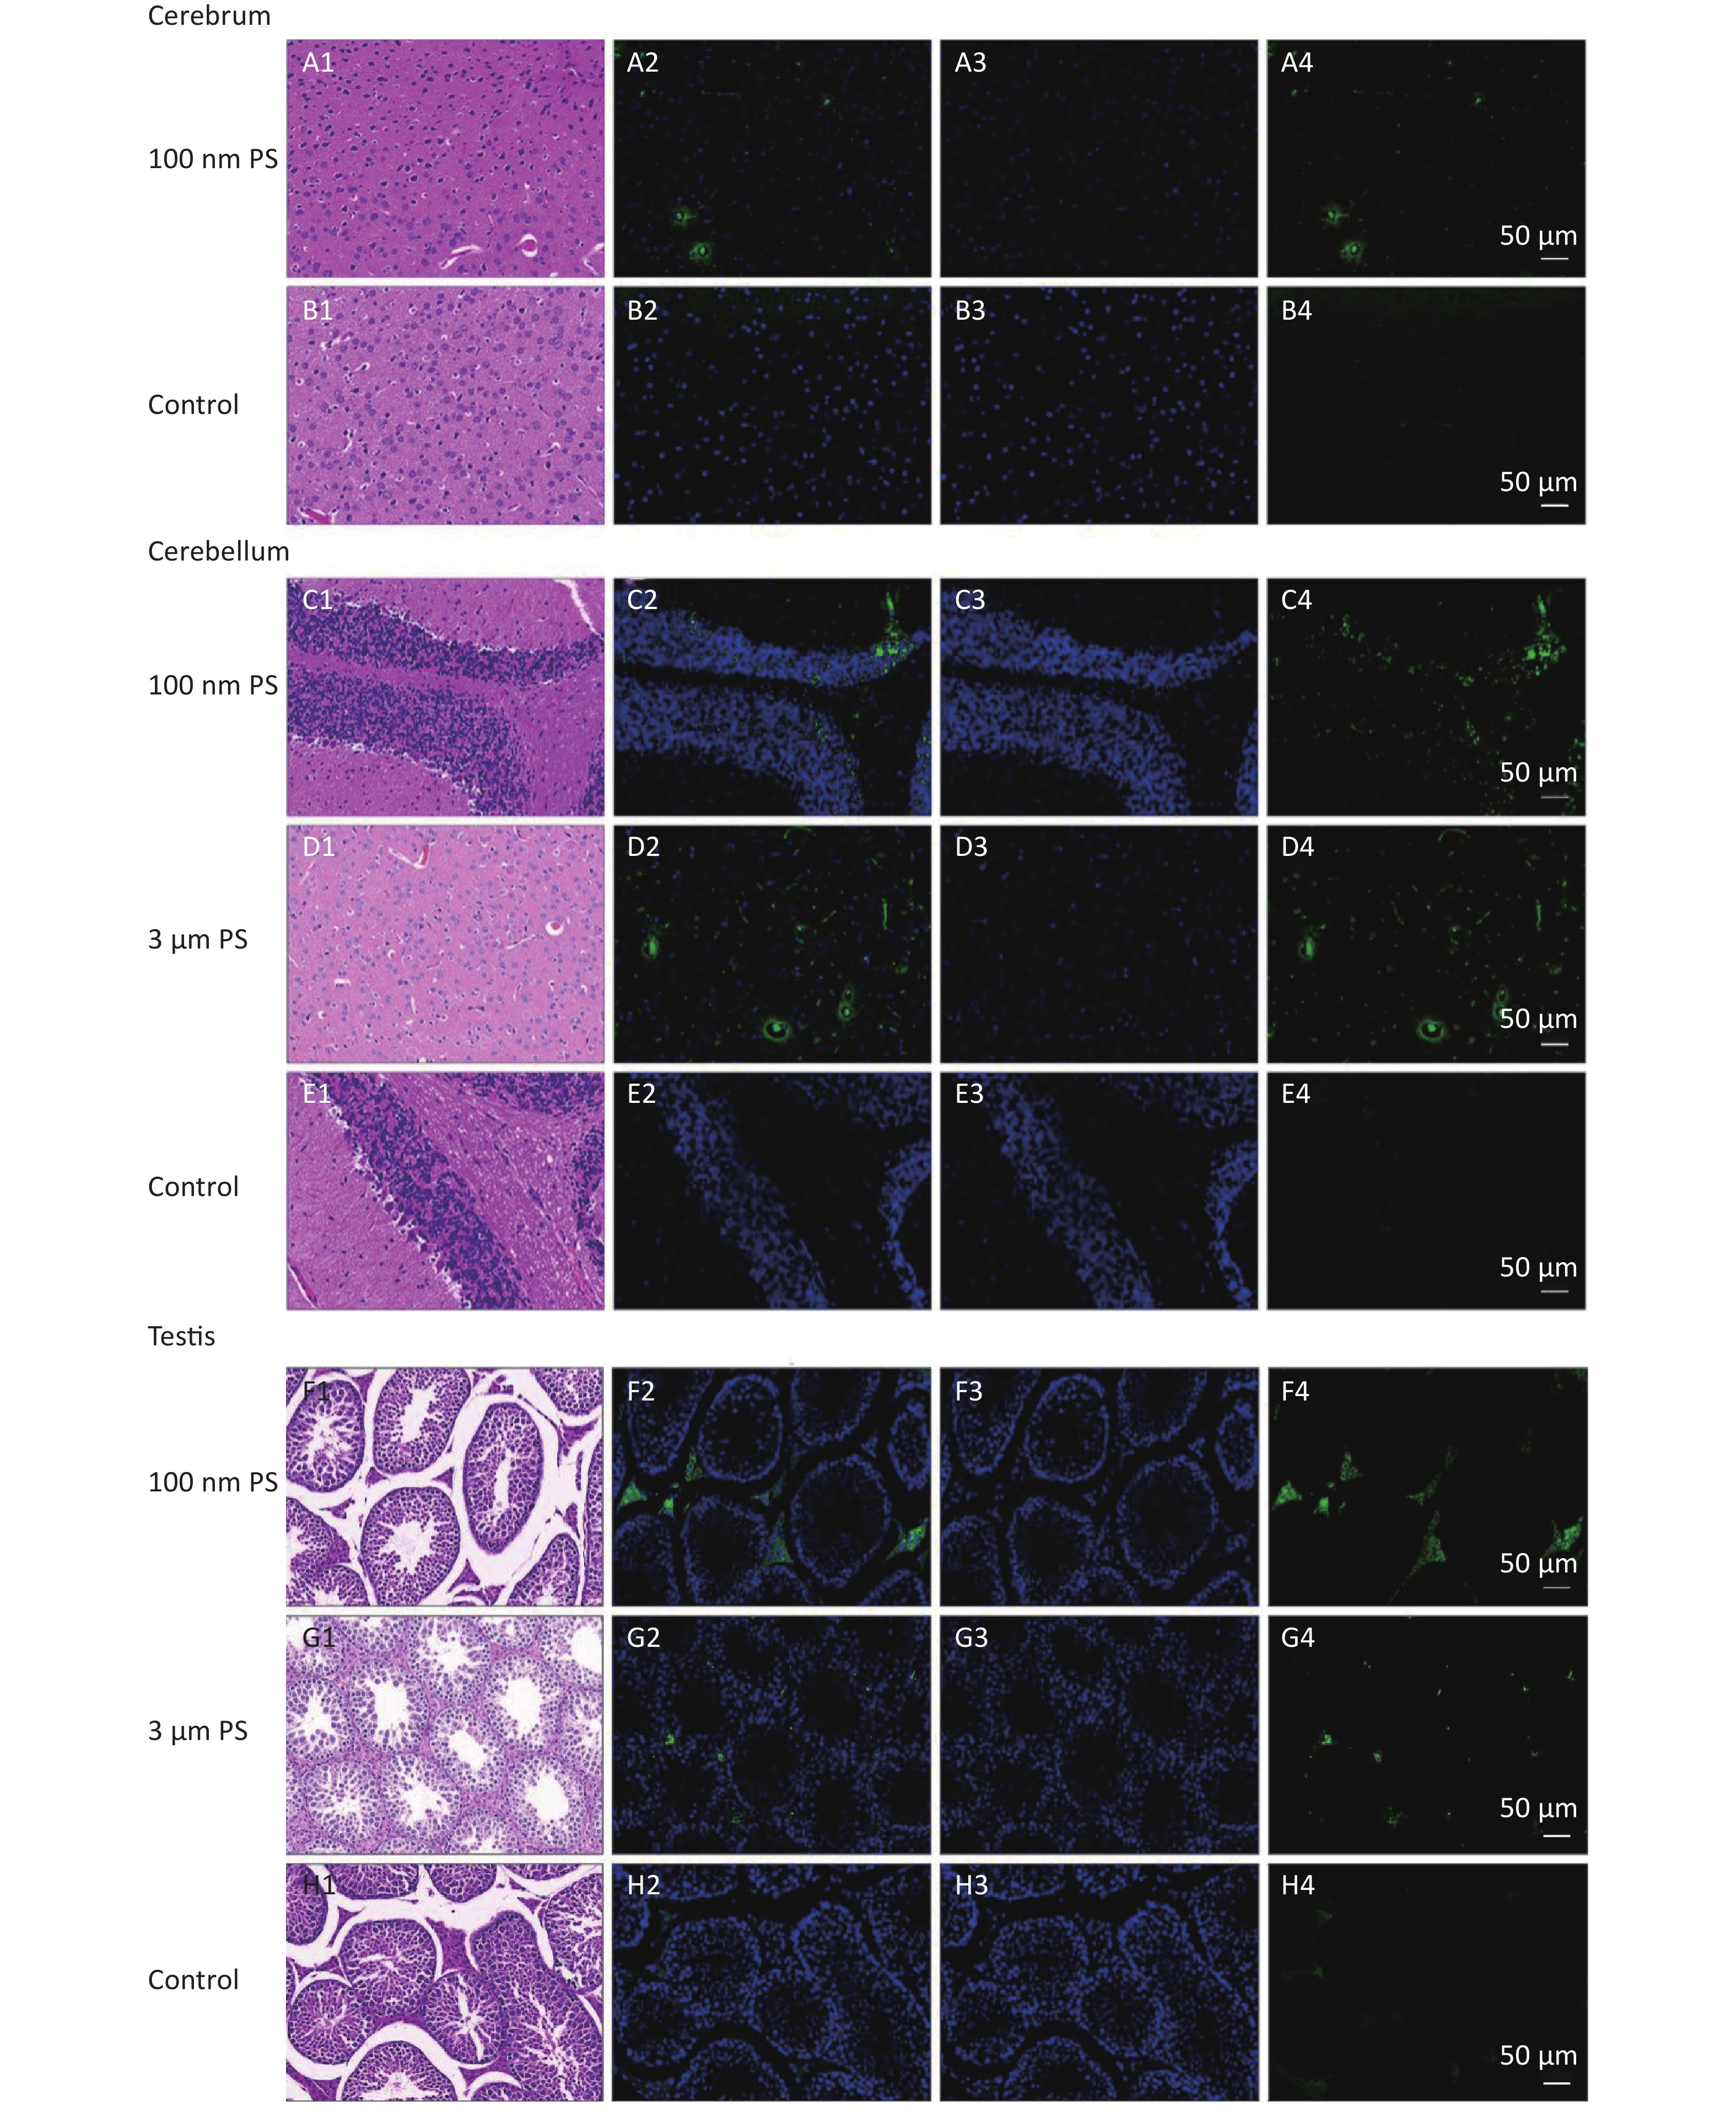
For solid samples, histopathology examination was conducted to confirm the significant findings revealed by IVIS spectrum. Thus, samples of subcutaneous fat, perirenal fat, peritesticular fat, cerebrum, cerebellum, and testis at 4 h in 100 nm PS treated group and samples of cerebellum and testis at 4 h in 3 μm PS-treated group were examined. Among all adipose tissues in 100 nm PS-treated group, fluorescence signals were brighter in adipose cells except lipid droplet (Figure 3). In the cerebrum, brighter fluorescence signals were found in blood vessels, perivascular space and nerve cells in cortex in 100 nm PS-treated group (Figure 4A2−A4). Furthermore, nerve cells tended to be hyperchromatic nuclei, pyknotic and irregular. Histological results of the cerebellum are shown in Figure 4C1−E4. The fluorescence signals were observed through the whole granular layer in 100 nm PS-treated group. The stronger signals in medulla were also found in 3 μm PS-treated group. Histological results of testis are shown in Figure 4F1−H4). The brighter fluorescence signals were found in the connective tissues and leydig cells, not the seminiferous tubule, in both 100 nm and 3 μm PS-treated groups. However, the thinner seminiferous tubule with reduced spermatogenic cell layers was observed in comparison to control group and the histopathological changes tended to be serious in 3 μm PS-treated group.
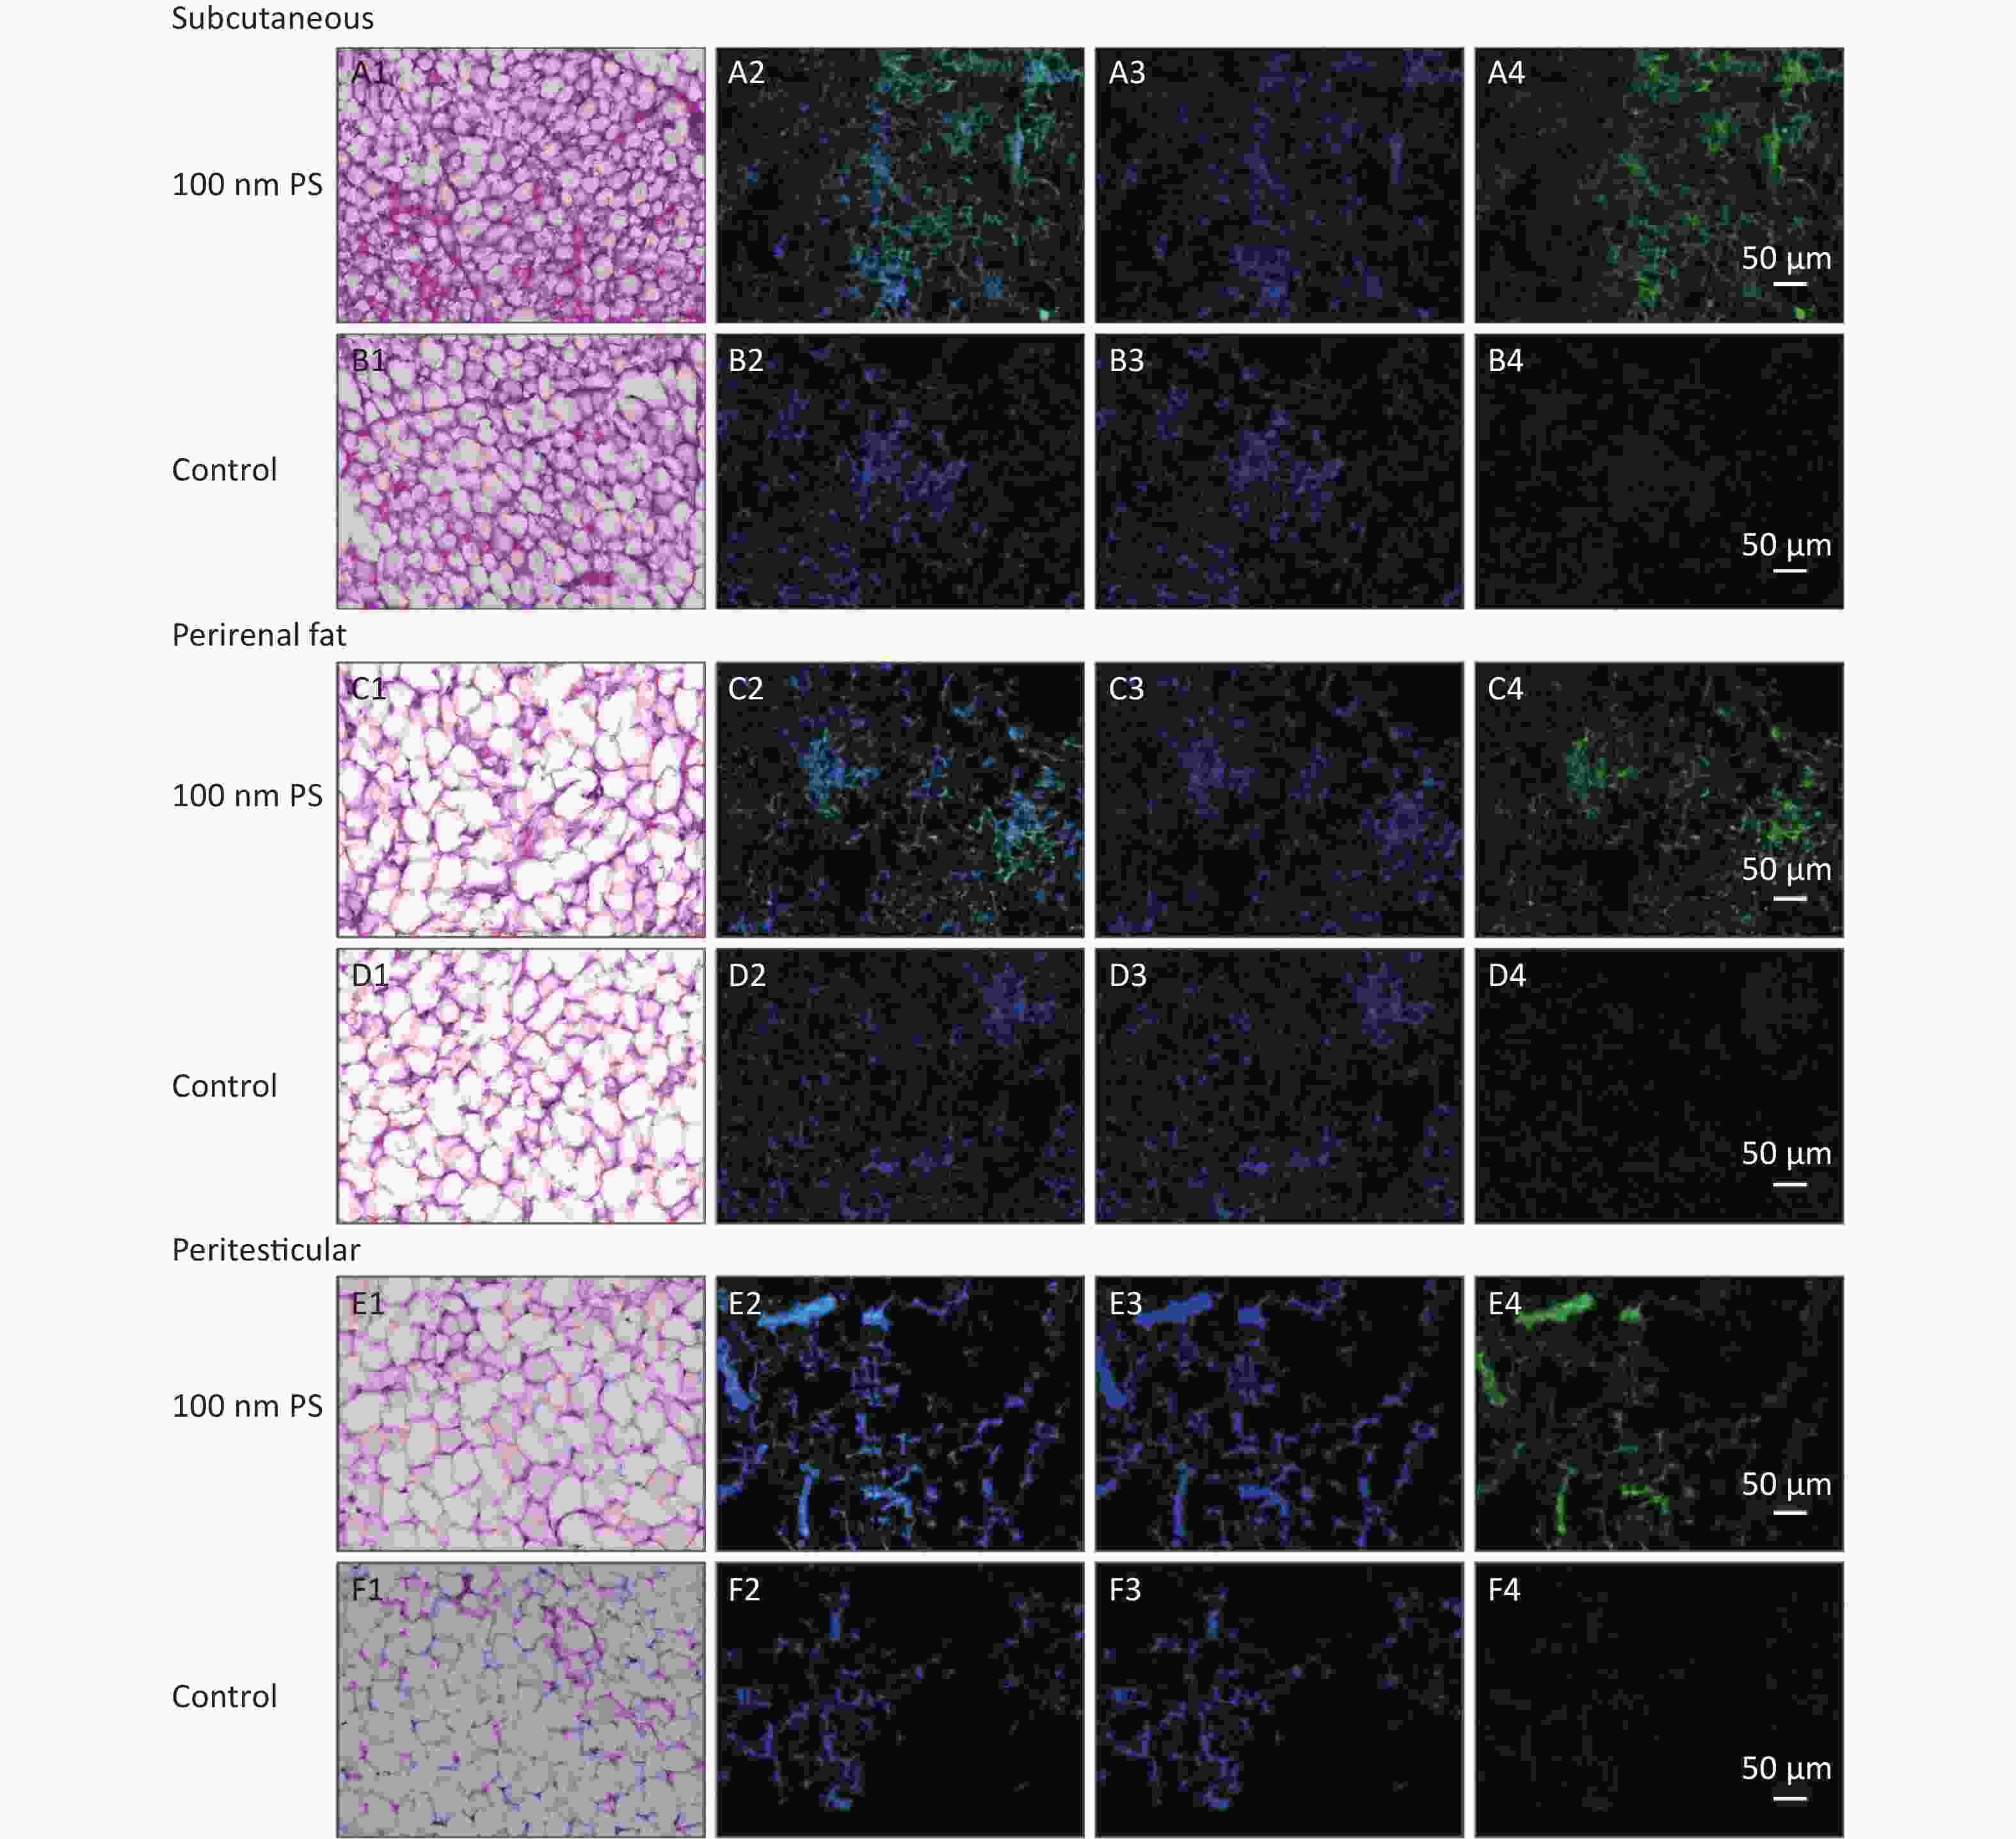
Figure 3. Histological examination of adipose tissues (200×). The first column is the image of HE staining. The second is the merge of both PS fluorescence and DAPI dye. The third is the fluorescence image of DAPI dye. The fourth is the fluorescence image of PS beads (green). PS, polystyrene. DAPI, 4',6-diaminidine-2-phenylindole.
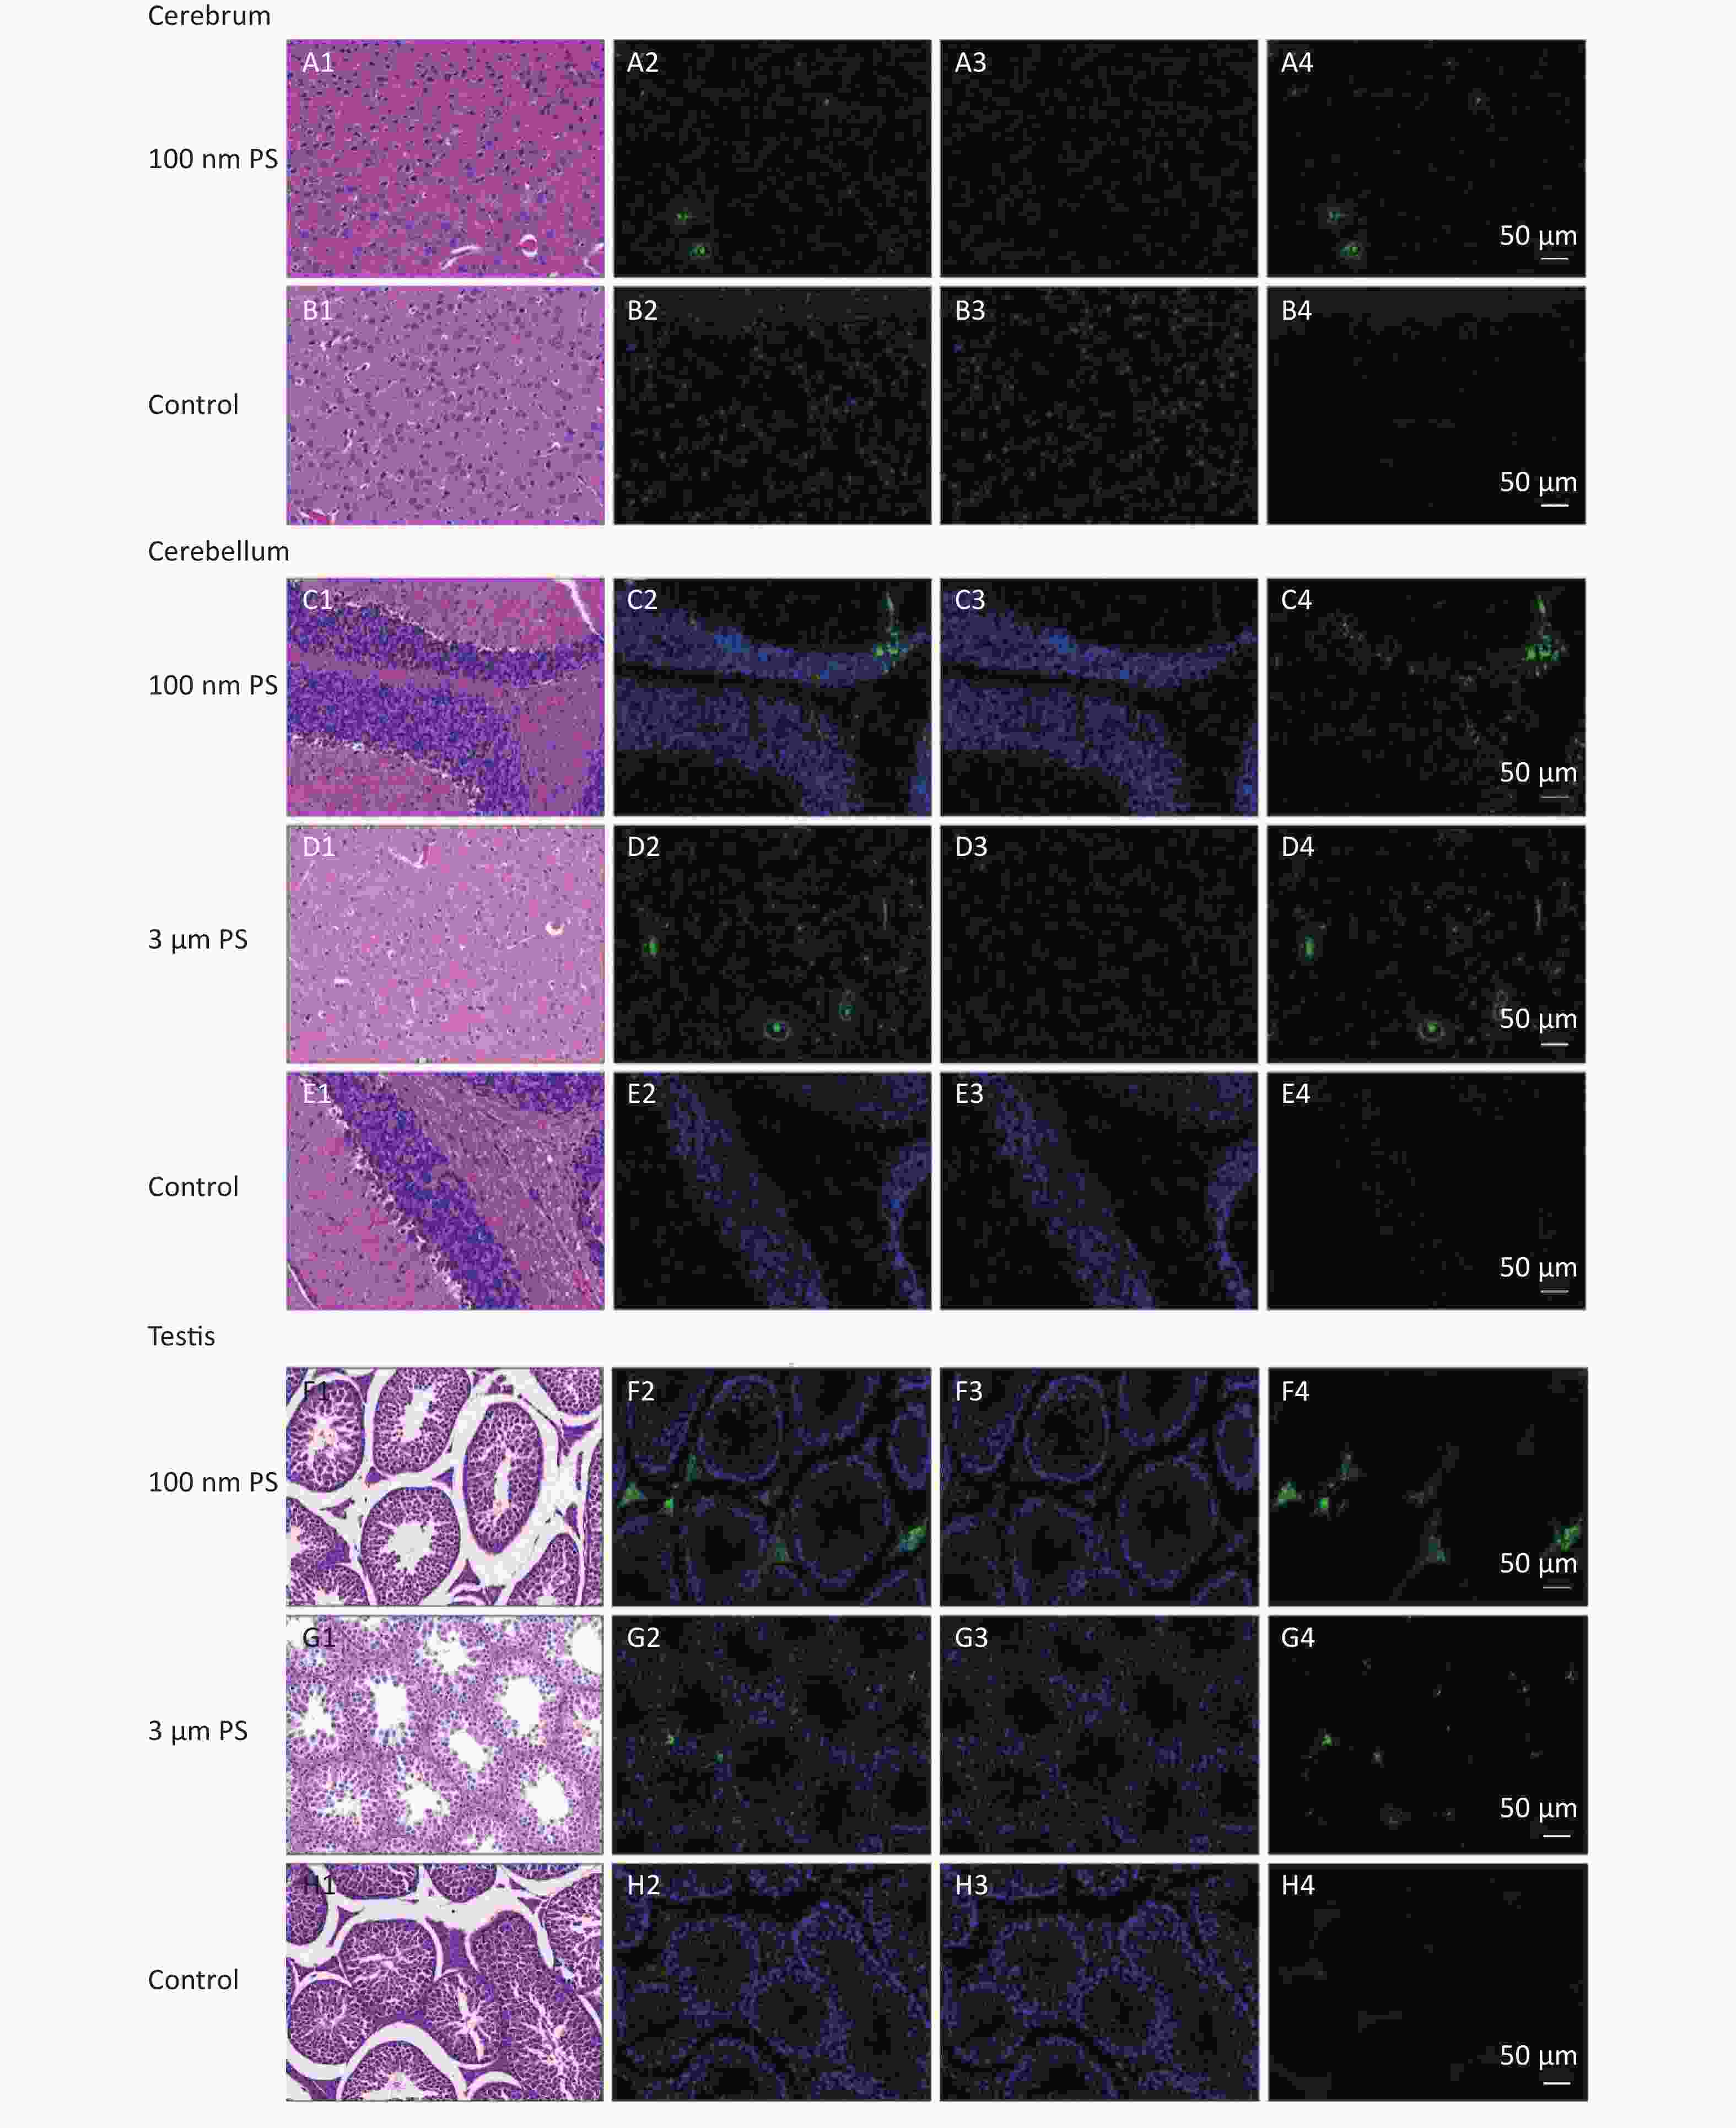
Figure 4. Histological results of the cerebrum tissues, cerebellum tissues and testis tissues (200×). The first column is the image of HE staining. The second is the merge of both PS fluorescence and DAPI dye. The third is the fluorescence image of DAPI dye. The fourth is the fluorescence image of PS beads (green). PS, polystyrene. DAPI, 4',6-diaminidine-2-phenylindole.
-
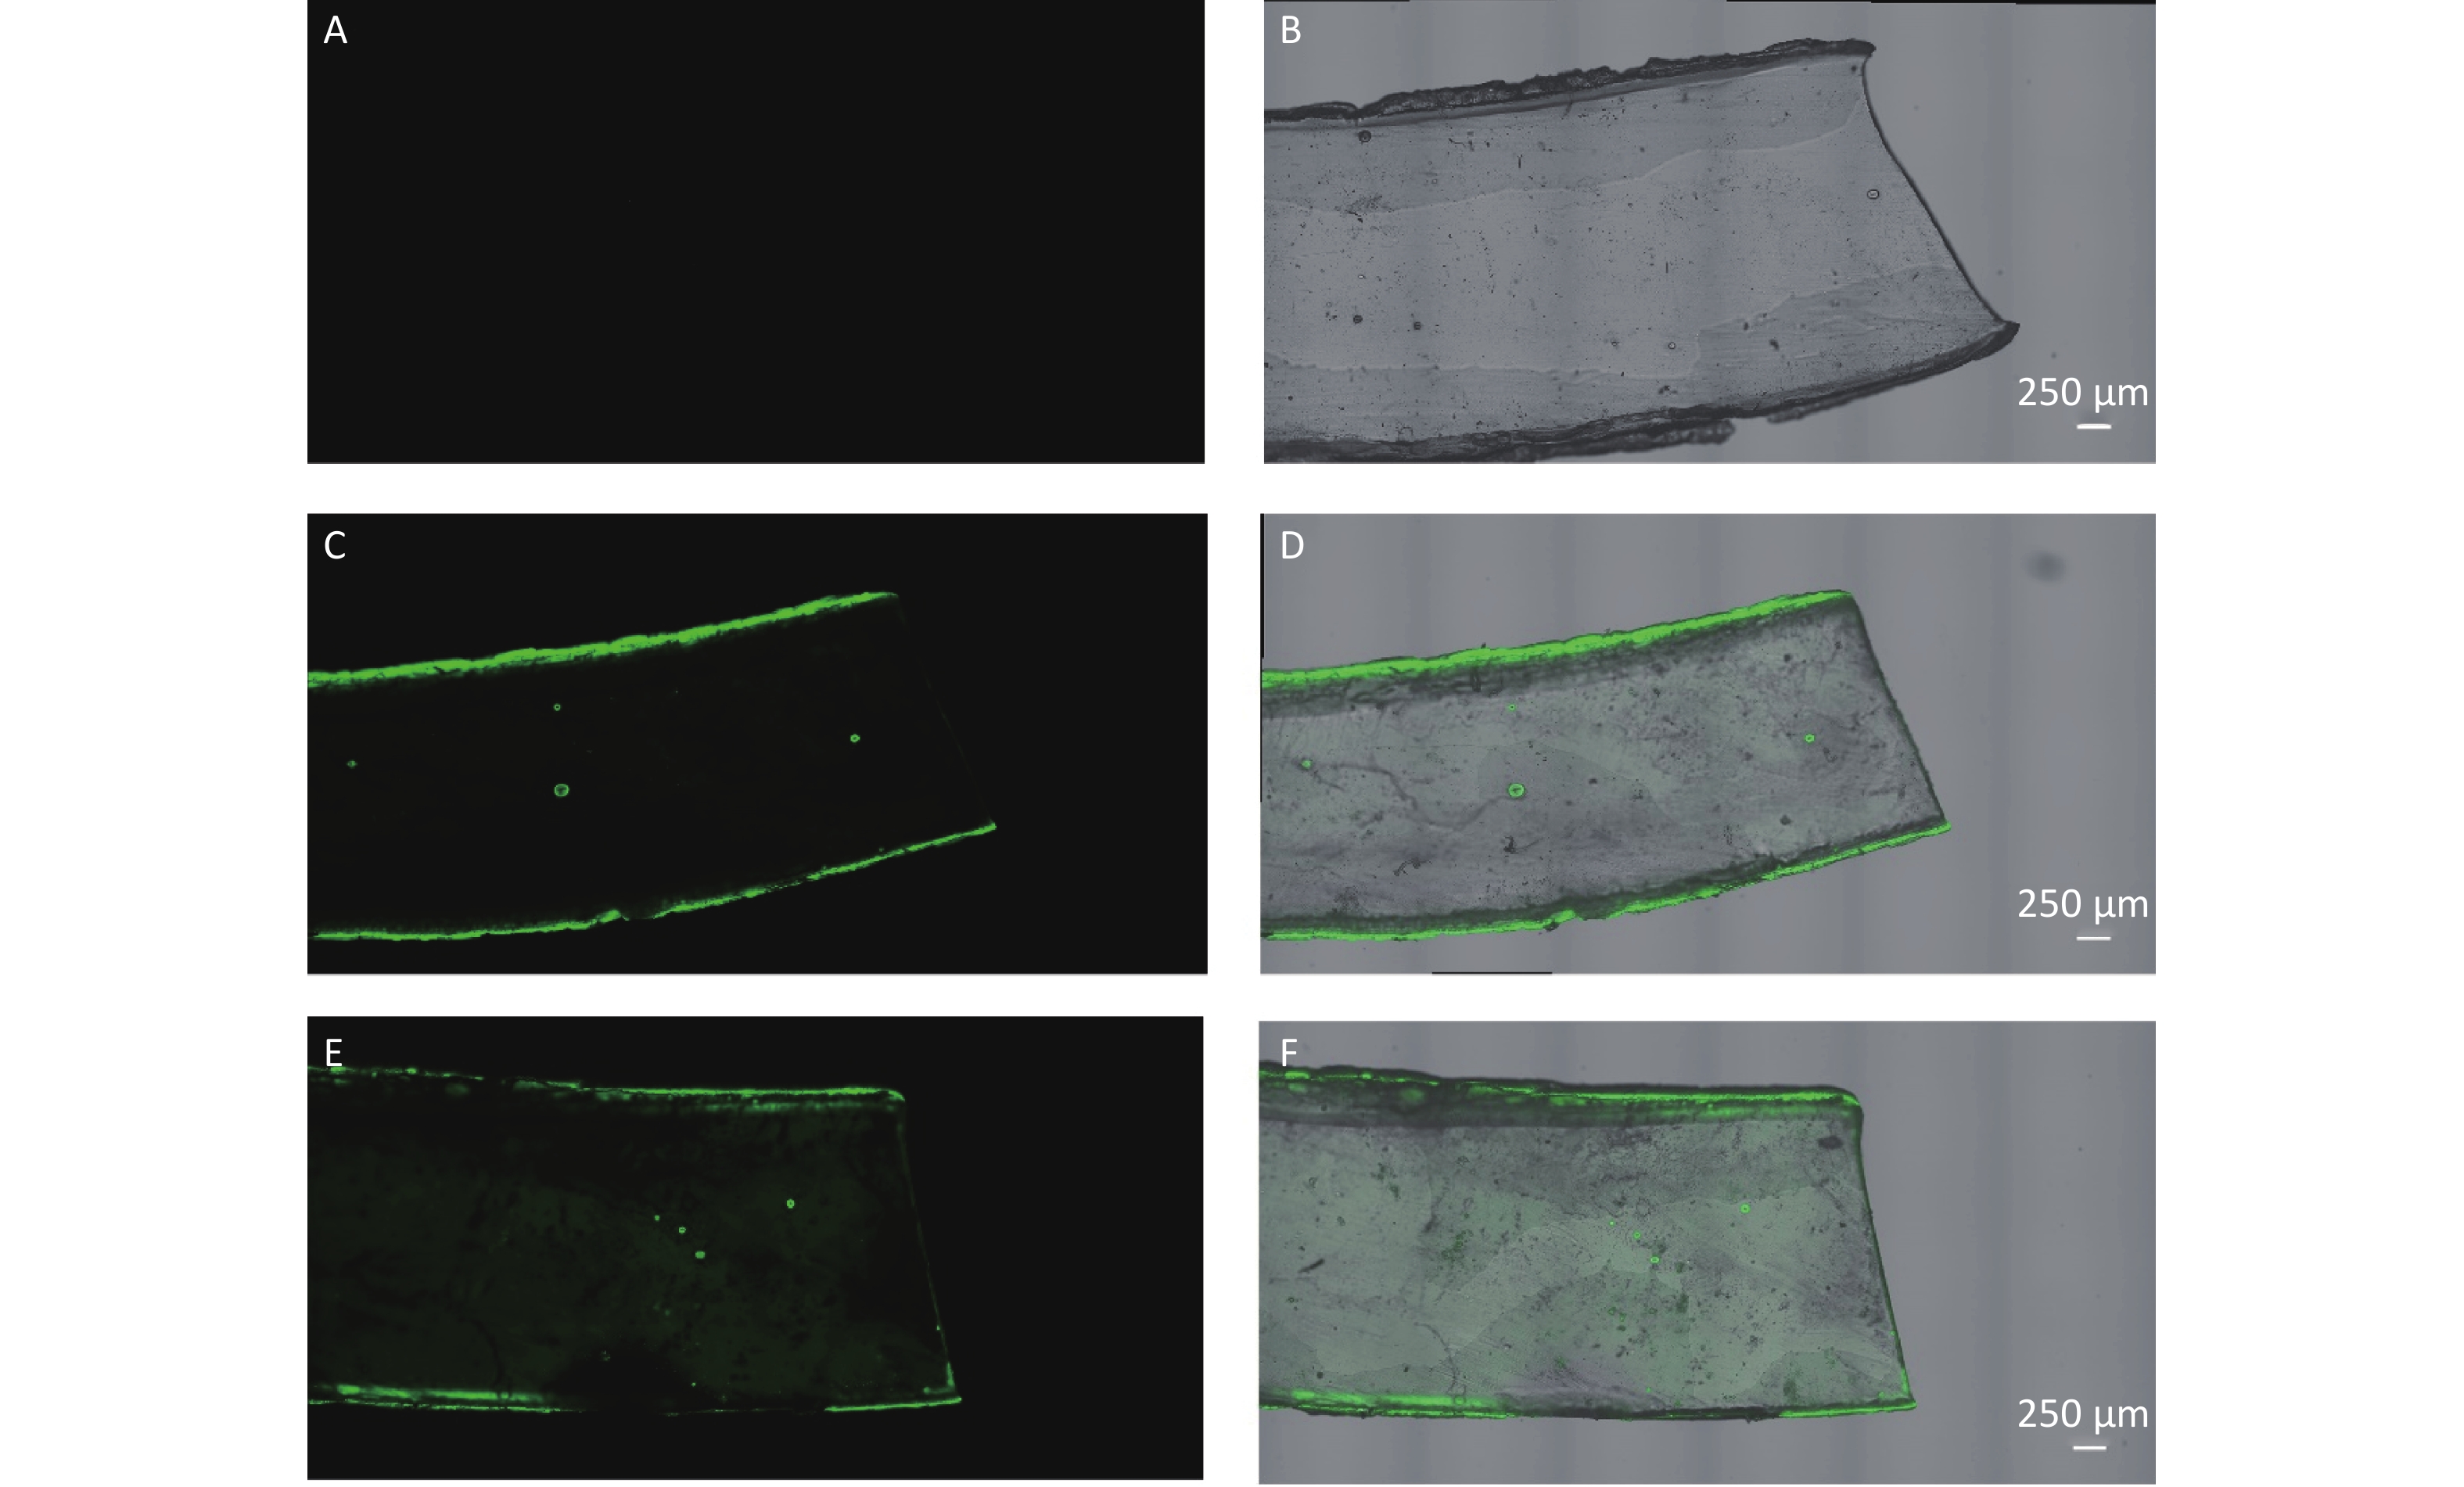
The results of leaching experiment examined by CLSM are shown in Figure 5. Different dispersing condition before exposure were revealed to directly affect the leaching. After dispersing PS suspensions by sonicating for 30 min as reported by Schür C et al. [28], the strong fluorescent signal pertaining to leaching was also observed (Figure 5E–F). In contrast, after dispersing PS suspensions by reversing gently as conducted in this study, the leaching was not observed except the residual particles that was not washed off and adhered to the silicone rubber strip, especially the edges (Figure 5C−D).
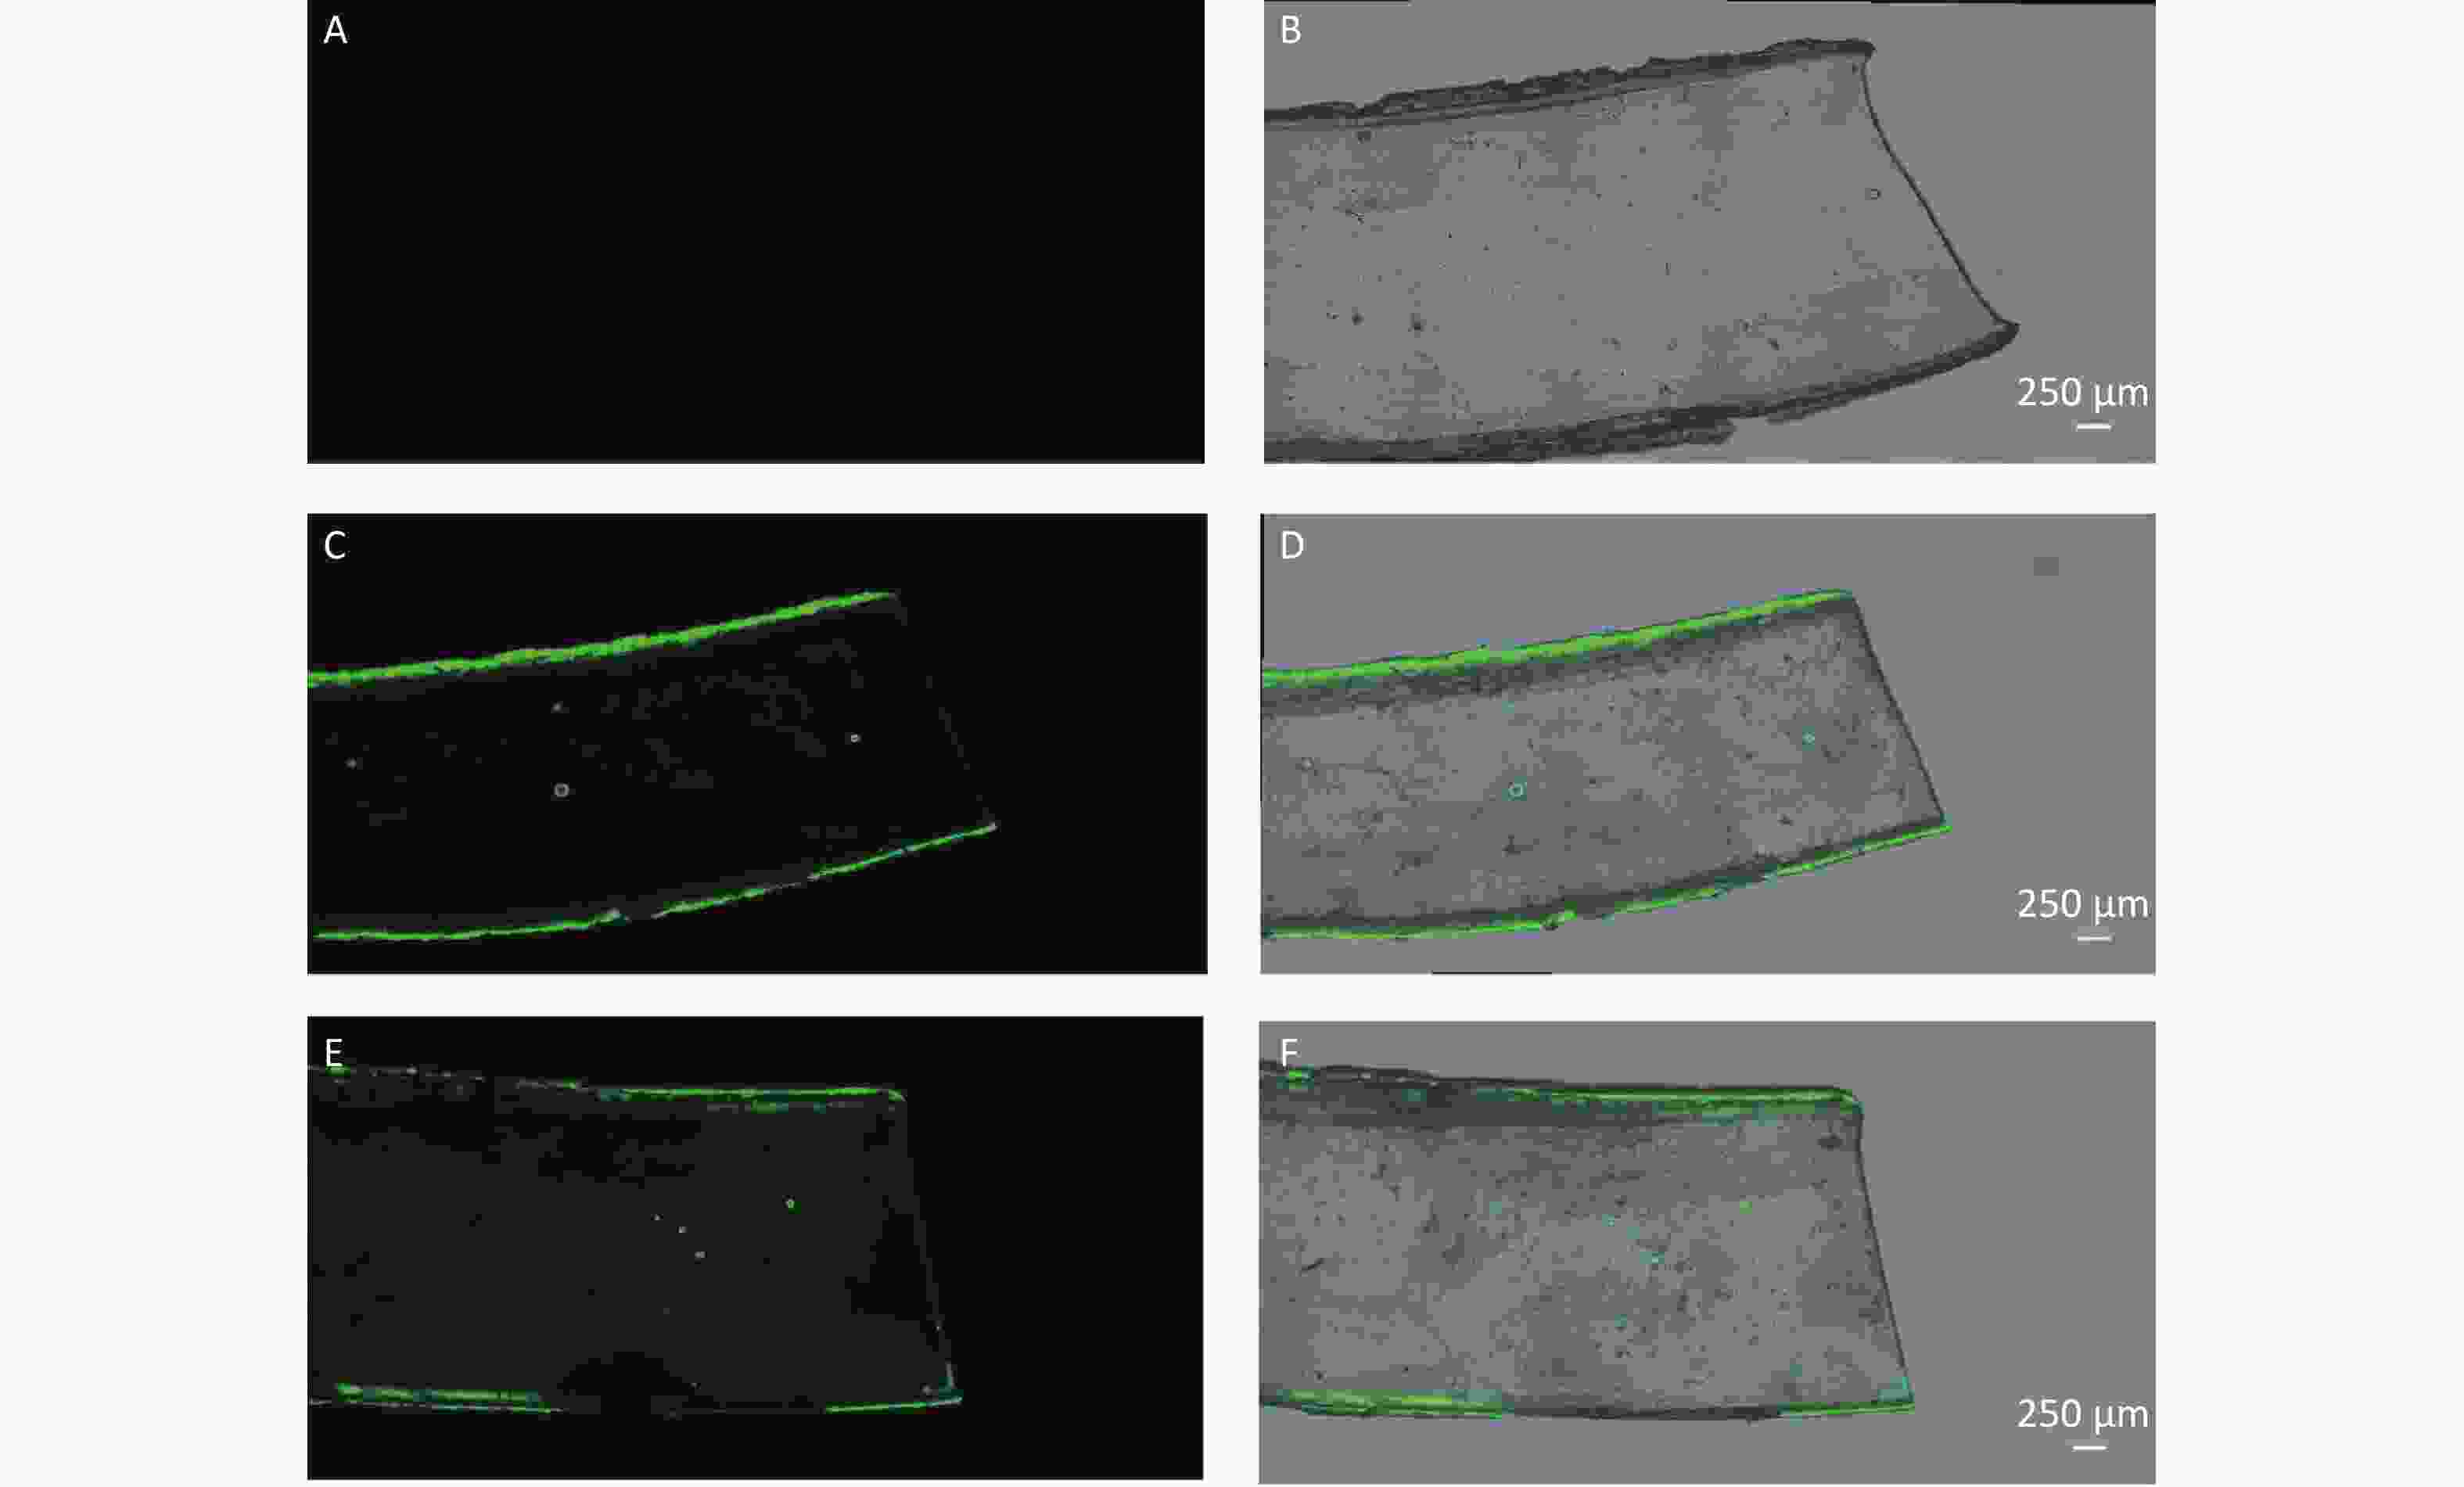
Figure 5. The leaching examination by confocal laser scanning microscope (100×). (A–B) are the fluorescence image and merged image (fluorescence and bright-field) of silicone rubber strip in 0.9% normal saline control group. (C–D) are the images in dispersing condition of reversing gently group. (E–F) are the images in dispersing condition of sonicating for 30 min group.
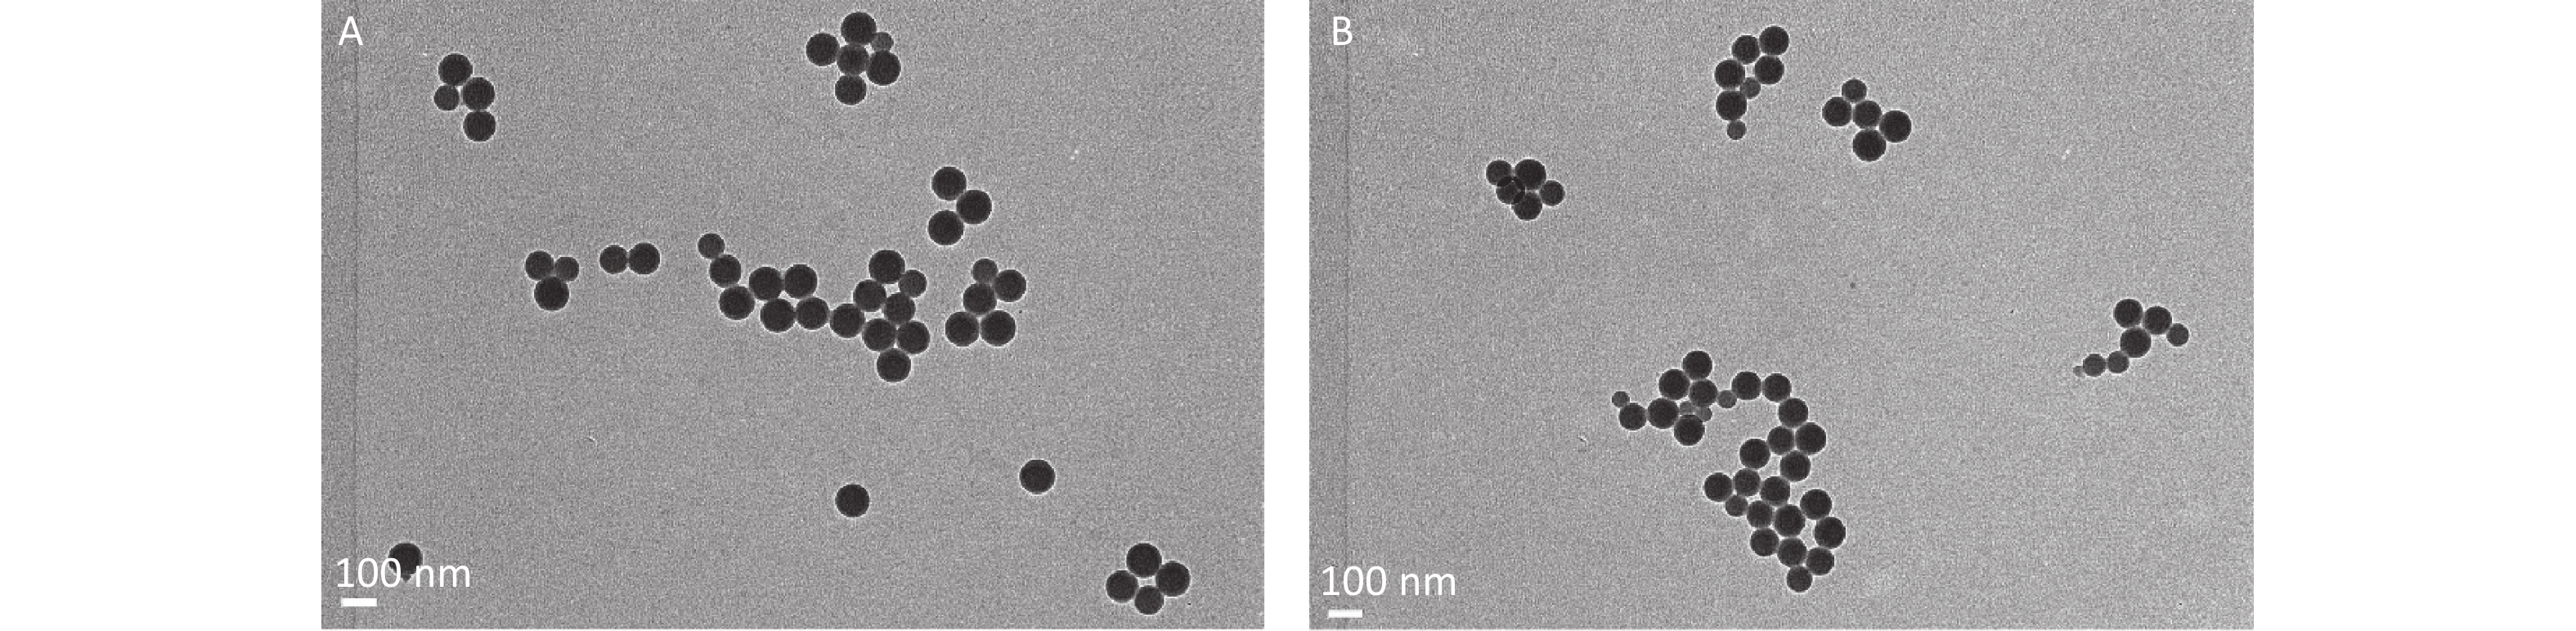
The confirmation was further conducted through TEM. Comparing between different dispersing conditions, the number of particles with smaller size observed frequently in group of sonicating for 30 min (Supplementary Figure S3B available in www.besjournal.com). Furthermore, the numbers of particles with diameter of > 80 nm, 50–80 nm and < 50 nm were counted for 3 view-fields in each group. The percentages of size > 80 nm in reversing gently group and sonicating for 30 min group were 92.3% and 65.6%; whereas the rates of size < 50 nm were 0 and 8.6% respectively.

Figure S3. The leaching examination by transmission electron microscope (10,000×). (A) is the image in dispersing condition of reversing gently group. (B) is the image of in dispersing condition of sonicating for 30 min group.
-
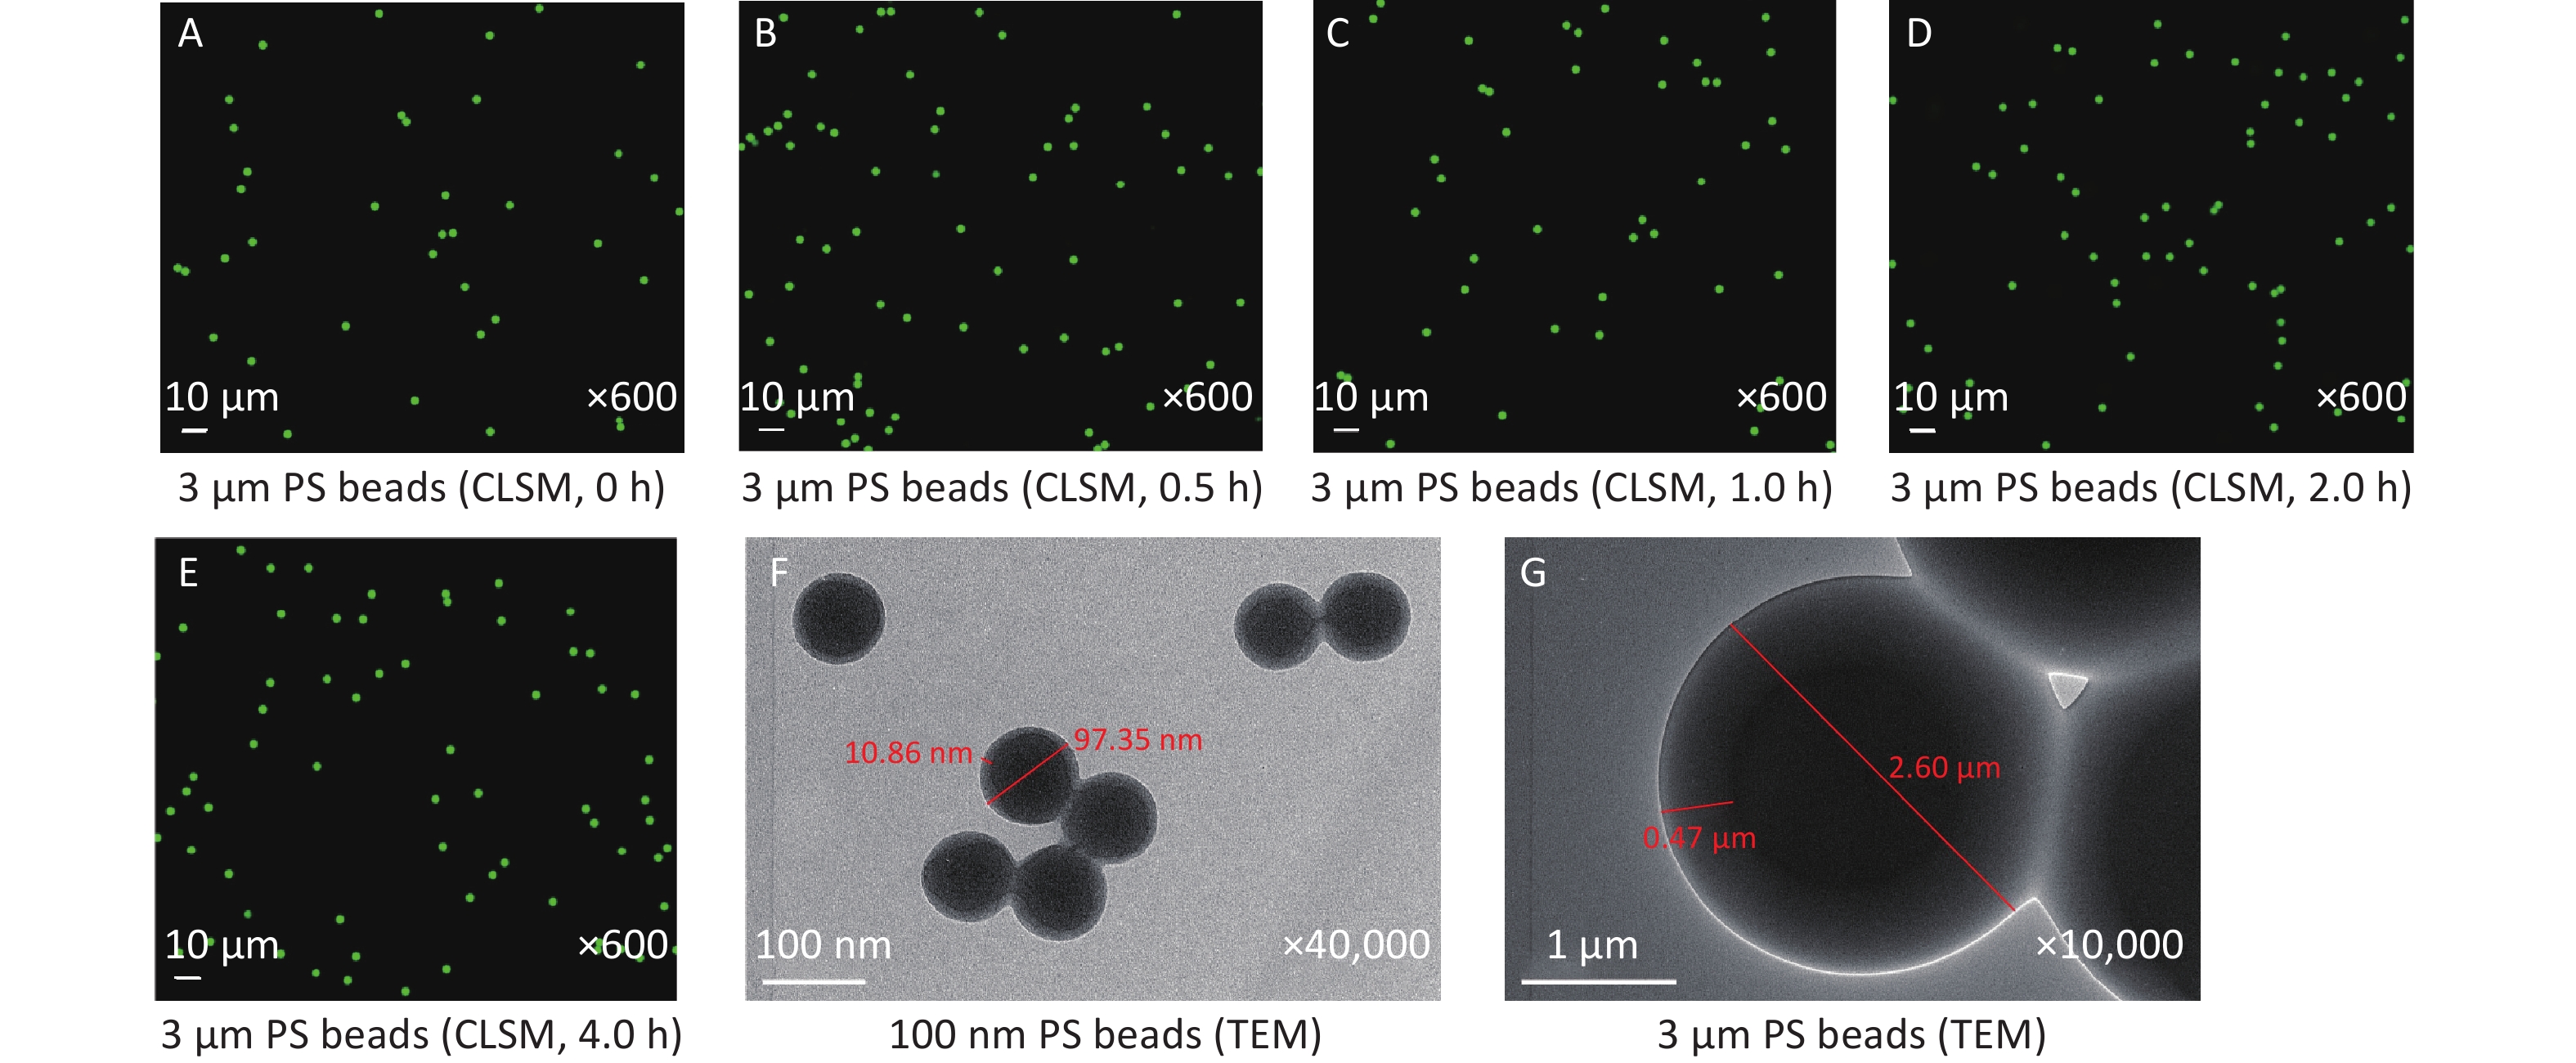
The results pertaining to the impact of pH on the properties of 3 μm PS beads are shown in Figure 6. CLSM examination revealed that there were no changes occurred to 3 μm PS beads before and after adding to the solution with a pH of 2.61, even for 4 h (Figure 6E), which indicated that low pH level was unable to affect MPs. The structures of 100 nm and 3 μm PS beads were observed by TEM (Figure 6F–G). For the 100 nm PS beads (95.37 nm), the thickness of dye-free surface was around 10 nm. In contrast, the thickness of dye-free surface was about 400 nm for 3 μm PS beads (2.60 μm).
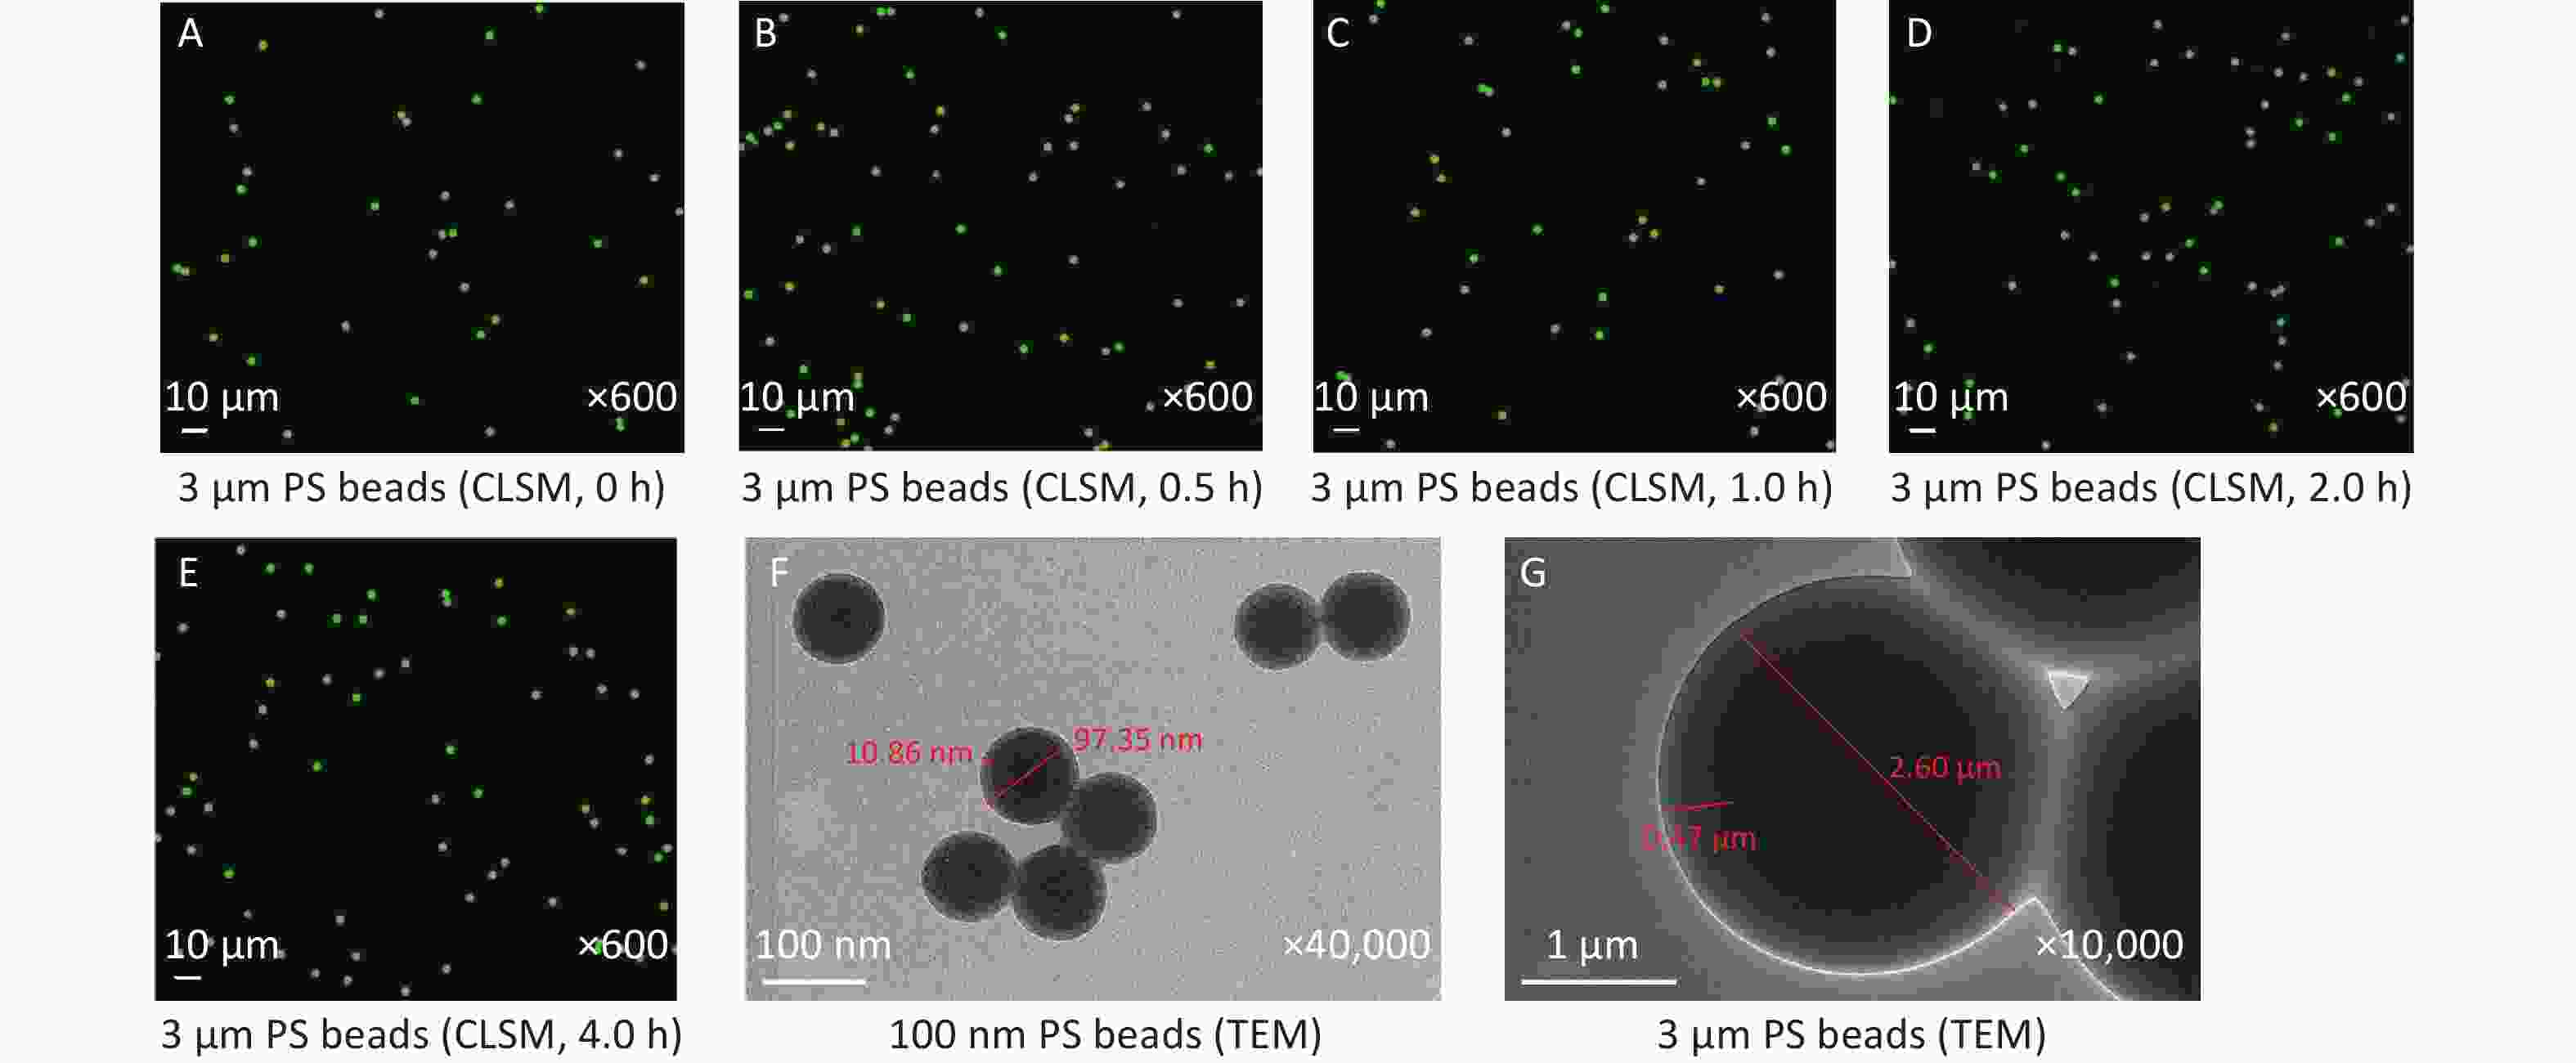
Figure 6. CLSM examination for the impact of pH on 3 μm PS beads and TEM observation on 100 nm and 3 μm PS beads. (A) is the image before adding acid solution (600×). (B–E) are the images of 3 μm PS beads at 0.5, 1, 2, and 4 h after adding the equal volume of solution with a pH of 2.61 (600×). (F–G) are the TEM images of 100 nm (40,000×) and 3 μm (10,000×) PS beads. PS, polystyrene.
-
The present study was conducted using a single oral exposure to micro- and nano- PS beads. Firstly, we examined the leaching of fluorescence before exposing PS beads to mice. Our results confirmed that dispersing condition could be the cause of leaching. Sonicating for 30 min did lead to the leaching of fluorescent dye, same as reported by Schür C et al. [28]. In contrast, the dispersing method used in this study did not make the leaching happen.
With respect to the impact of low pH (2.98–4.04) in stomach of mice [33], our findings indicated that pH value as low as 2.61 could not affect MPs. It might be due to the stable properties of PS or the thick surface of PS beads to resist the destruction of acid. Even if we were unable to exclude the impact of low pH on NPs that had 40 times thinner surface than MPs, the presences of 100 nm PS beads in the blood were found by TEM. After controlling for contamination the fluorescence leaching, our findings revealed that NPs were rapidly absorbed in blood and accumulated in adipose tissue after acute and high dose oral exposure. Moreover, NPs, even the largest size of 100 nm, had the ability to penetrate the blood-brain and blood-testis barriers. Thus, the toxicity of NPs should be the focus of attention to prevent the potential risk to human health. In contrast, the 3 μm MPs could enter the blood and penetrate both barriers, but was unable to be absorbed into adipose tissues. No absorption evidence was shown for 10 μm MPs.
With respect to the uptake of NPs and MPs in blood, the results in this study indicated that a single oral exposure to NPs could lead to rapid uptake. Among the time points observed, the fluorescence intensity was the highest at 30 min, then decreased, which indicated that NPs were absorbed rapidly. This finding was corroborated by CLSM and TEM even if the numbers of PS beads was found to be particularly few. Together these facts indicated that NPs could be absorbed into blood and rapidly disappeared for tissue distribution, which is the same as sliver nanoparticles [34]. Interestingly, we did not find any absorption evidence in blood for both 3 μm and 10 μm by IVIS Spectrum. This result seemed to be in agreement with the conclusion drawn from chronic oral exposure [24], i.e., PS particles > 300 nm were not absorbed into blood. However, the presences of 3 μm PS beads in blood were found by both CLSM and TEM. The absence of MPs in blood by IVIS Spectrum might be due to the detection limits. In this study, the number of 3 μm PS particles was 24,000 times lower than that of 100 nm PS particles; whereas its size was much bigger. Thus, the absorption of 3 μm MPs was expected to be fewer and slower than the NPs. Since the fluorescent intensity of 100 nm PS in blood sample was already in a particularly low level in IVIS Spectrum examination, the fluorescent intensity 3 μm PS tended to be much lower, even lower than the detection limits. As for the assessment of hematological toxicity, we initially focused on the time-dependent characteristics of toxicokinetics and only the presence of PS beads in blood was proved. We did not count the numbers of white blood cells or red blood cells as the report on pesticide [35]. Further studies focusing on toxicity of MPs and NPs should be conducted to achieve this aim.
With respect to accumulation in adipose tissues, our study revealed this change in all adipose tissues examined, but only for NPs and not for any size of MPs. Histological examination further corroborated those findings. Interestingly, even if their autofluorescence intensities were in a higher level, especially subcutaneous fat, among tissues measured in this study, the fold increases were also the highest. Thus, the absolute doses of nano-PS distributed in those adipose tissues were expected to be the highest after gavage. This fact suggested that the adipose tissues could be a target organ accumulating most NPs after a single oral exposure. It might due to the high lipophilicity of plastic particles [36]. Since the accumulation in peritesticular fat was still continual up to the end of observation period (4 h), the time course of accumulation characteristics should be studied with a longer observation period. By contrast, the decreasing of fluorescence intensities in subcutaneous fat and perirenal fat were found 4 h after exposure. The migration to other tissues might be the reason because of the observations of NPs in other tissues after oral exposure [26]. The NPs might accumulate firstly in adipose tissues due to the lipophilicity and then migrate. In addition, the presence of NPs in kidney [26] increased the likelihood that NPs could be eliminated through urine. However, the evidence has not yet been found up to now. Because a disturbance of plastic particles on lipid metabolism has been reported [17], whether adipose tissue is the storage organ only or the target organ also needs to be clarified.
In the terms of penetrating ability, NPs have been shown to penetrate the blood-brain barrier in fish [22]. Recently, the presence of NPs in mice brain was also found for 28 days exposure [26]. Our findings indicated that NPs can penetrate the blood-brain barrier in mice, even after a single oral exposure to the largest size of NPs. Both the cerebrum and cerebellum were confirmed by histological examination that NPs were able to enter nerve cells. Especially in the cerebrum, the significance was observed during the entire observation period and the histopathological changes were found. In addition to the blood-brain barrier, NPs can also penetrate the blood-testis barrier due to the significant increase in testis. In the epididymis, although the increase did not reach significance, it was still considerable because the autofluorescence intensity of the epididymis was the highest among all measured tissues. Under the same fold-increase, the absolute increase in fluorescence intensity of the epididymis was nearly 2 times and over 5 times the amount in the testis and nervous system, respectively. Besides, the penetrating abilities were also found for 3 μm PS beads 4 h after exposure. The evidences of both IVIS Spectrum and histology were obtained from the cerebellum and the testis. From the view point of histopathological changes, effects of 3 μm PS beads on testis tended to be more obvious than 100 nm PS beads. Although the sperm quality [37] was not examined in this toxicokinetics design, the changes of seminiferous tubule did be found. This finding could be another evidence confirming the penetrating ability. As for 10 μm MPs, we did not find any evidence in relation to penetrating ability. However, the conclusion should be drawn cautiously because the observation period was limited to 4 h. Our findings indicated that, by 4 h, MPs up to 3 μm have the ability to penetrate the two barriers in vivo, albeit weakly. Our results provide the proof for mammals that NPs and MPs have the ability to penetrate the blood-brain and blood-testis barriers, which suggested that plastic pollution might be an important risk for human health.
There were three limitations to the present study. First, the observation period was short and the number of animals in each group was only three as a pilot study of toxicokinetics. We are planning to conduct a further study with a longer time course and a greater number of mice to confirm the conclusions drawn in this study. Second, MPs and NPs fibers are the most commonly form in environmental components; however, only PS beads were used in this study because of the lack of fibrous standards. It needs to be developed in the future for risk assessment of MPs and NPs pollution on human health. Third, only toxicokinetics for a single oral exposure were focused and the pathological mechanism of MPs and NPs had not been explored. More accurate evidences and their toxic effects even for a single exposure should be study further.
-
In a conclusion, gavage of 100 nm, 3 μm, and 10 μm fluorescent PS beads in the present study provide the evidences on toxicokinetics of MPs and NPs in mammals in vivo. Our findings revealed that NPs can be rapidly absorbed into blood after a single oral exposure and accumulate in adipose tissues. NPs have the ability to penetrate the blood-brain and blood-testis barriers. The absorption and distribution of MPs were size-dependent. In comparison to NPs, MPs with diameter < 3 μm could be slowly absorbed into the blood and has the ability to invade the nervous system and reproductive system by 4 h after exposure.
-
YANG Zuo Sen: Conceptualization, Methodology, Wring-original draft preparation, Funding Acquisition. BAI Ying Long and JIN Cui Hong: Methodology, Investigation, Wring-Review & Editing. NA Jun, ZHANG Rui, and GAO Yuan: Methodology, Investigation, Data curation. PAN Guo Wei: Conceptualization, Methodology, Wring-Review & Editing, Supervision. YAN Ling Jun: Conceptualization, Methodology, Wring-Review & Editing, Supervision, Funding Acquisition. SUN Wei: Conceptualization, Methodology, Investigation, Wring-Review & Editing, Project Administration.
-
We thank for the support from the Key Laboratory of Ministry of Education for TCM Viscera-State Theory and Applications, Liaoning University of Traditional Chinese Medicine and Dr. ZHANG Ze, SUI Guo Yuan and CHEN Li Juan for their technological guidance.
-
This study was conducted in accordance with the Declaration of Helsinki on ethical principles for medical research involving human subjects. The experimental protocol was approved by the Ethical Requirements of Experimental Animals of China Medical University (Number: CMU2019216).
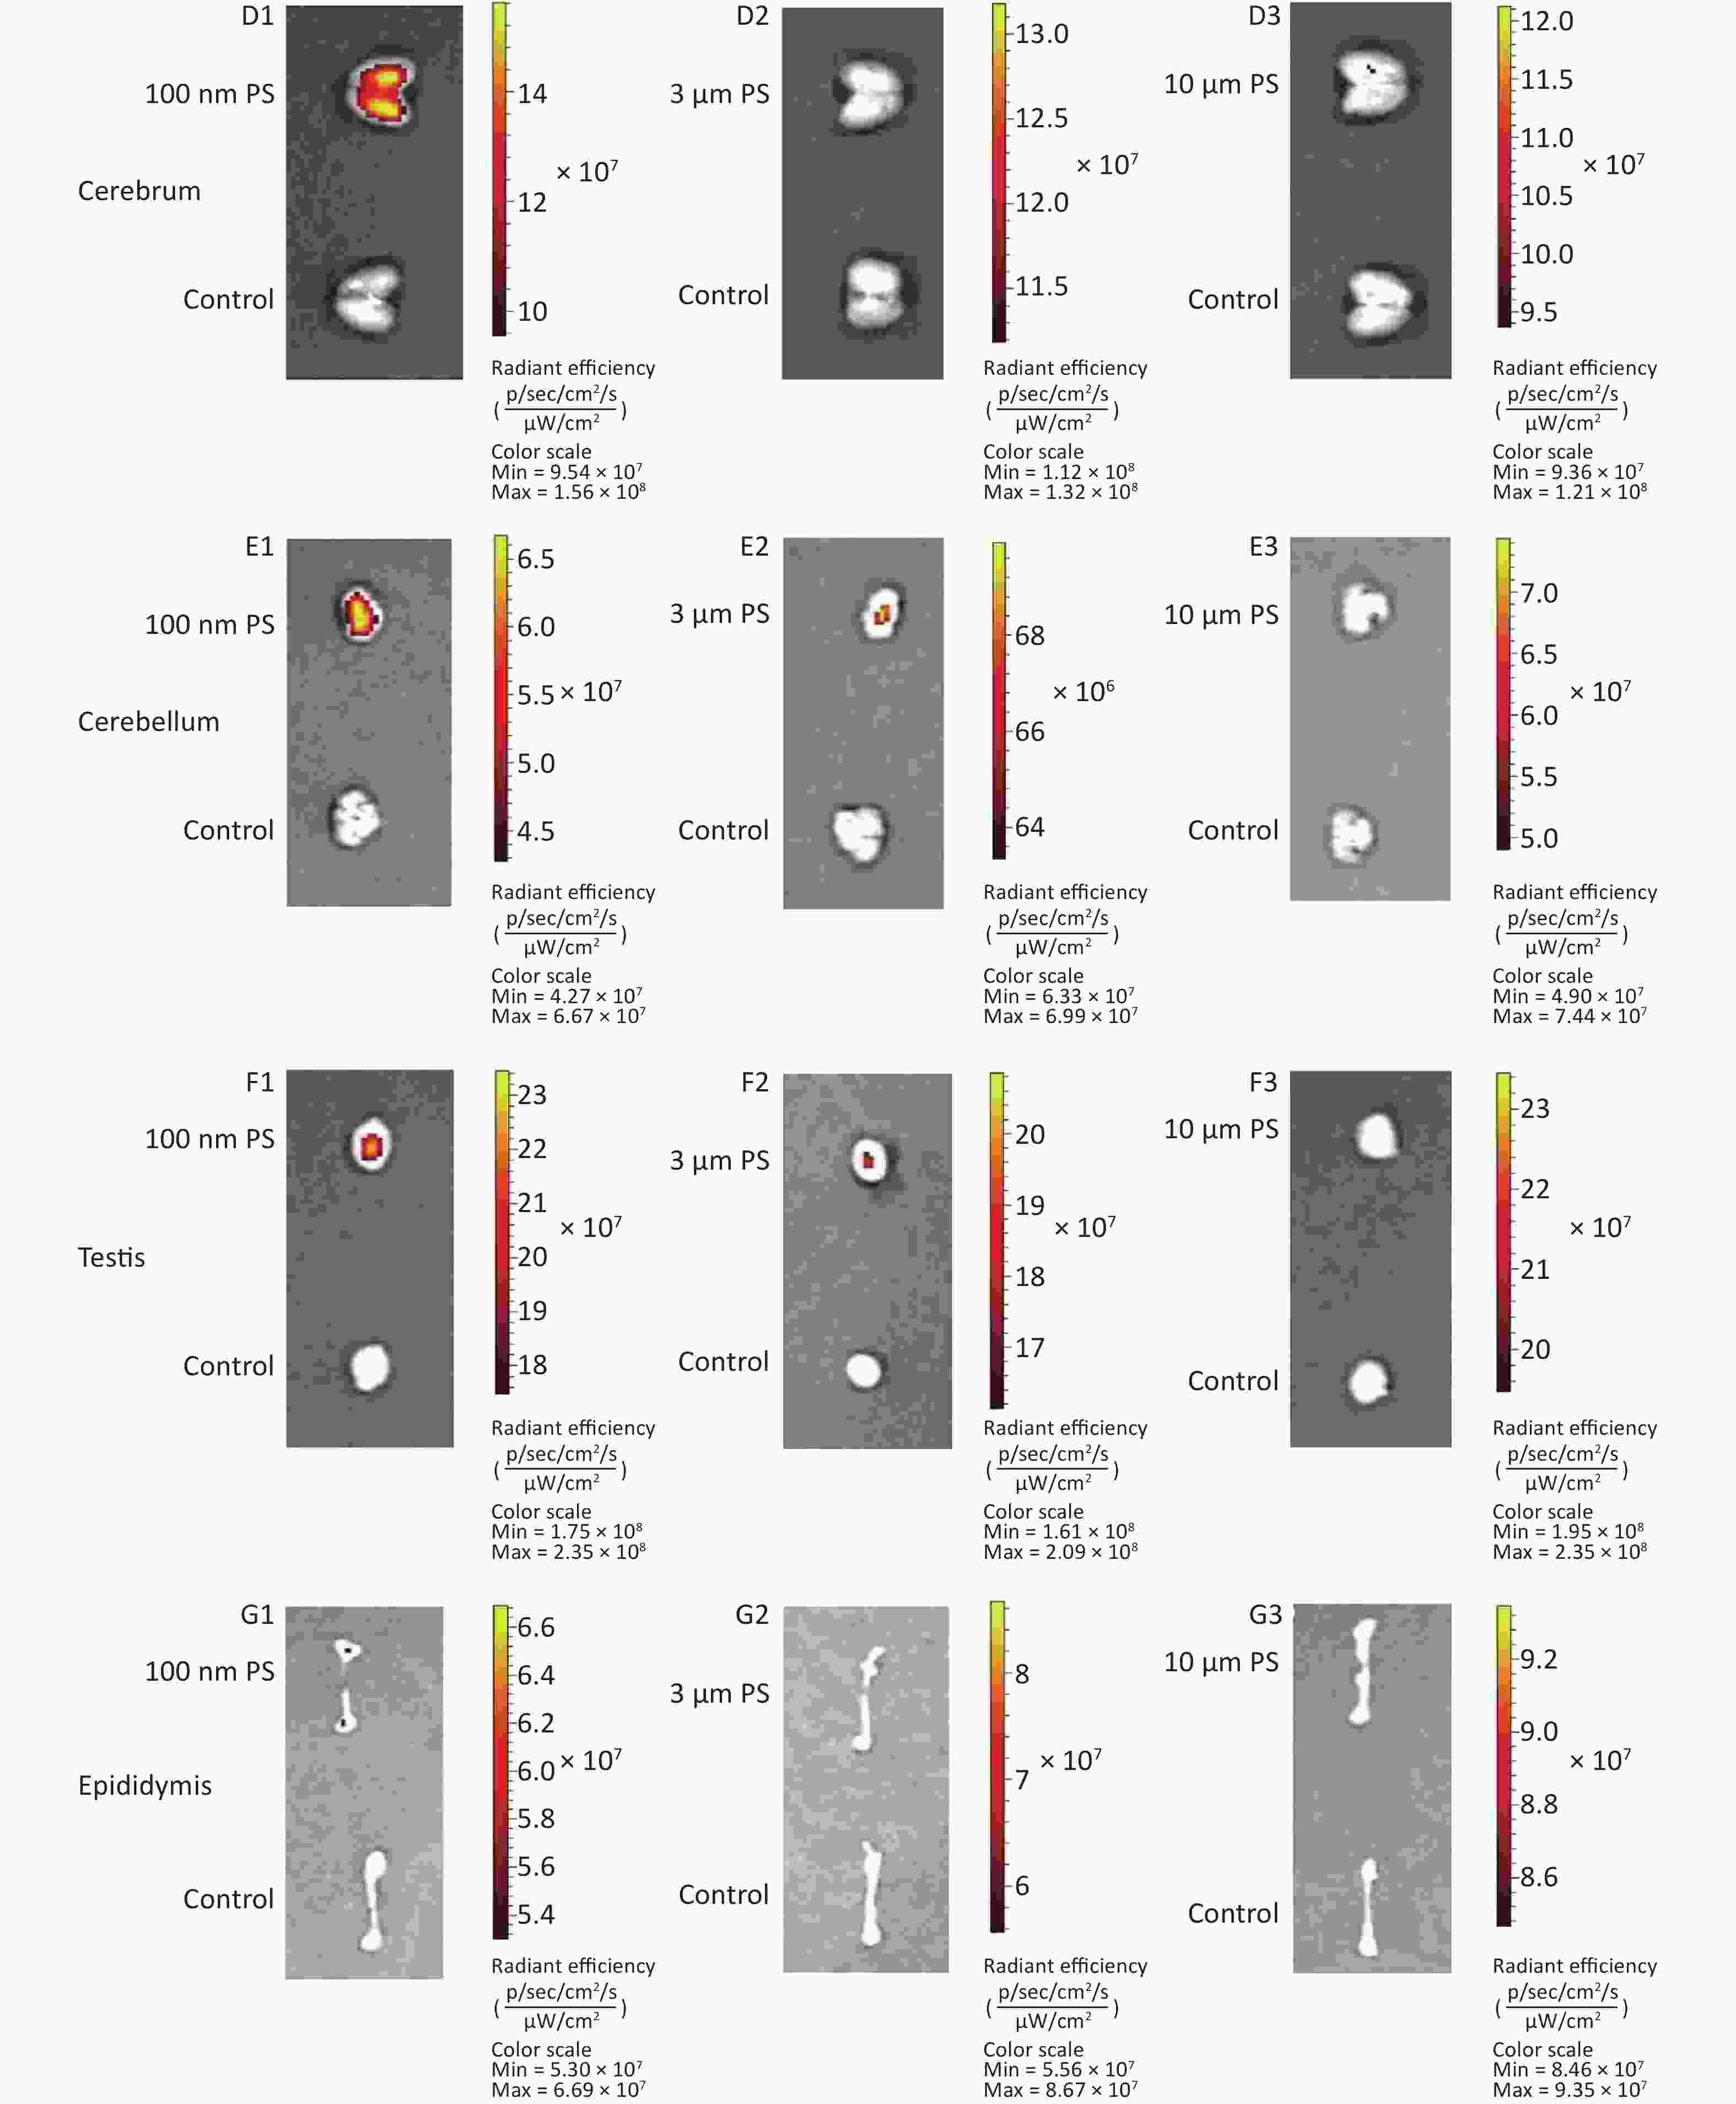
Figure S2-2. The IVIS Spectrum small-animal imaging system images for the tissues examined.
HTML
Micro- and nano-PS Beads
Animals
Experimental Design
Fluorescence Imaging
Histological Examination
Confocal Laser Scanning Microscope
Transmission Electron Microscope
Confirmation on the Leaching of Fluorescent Dye
Impact of pH Value on MPs
Quality Control
Statistical Analysis
Autofluorescence Intensity of Various Tissues at different Time Points by IVIS Spectrum
The Absorption of 100 nm, 3 μm, and 10 μm PS Beads in Blood by IVIS Spectrum
Distribution of 100 nm, 3 μm, and 10 μm PS Beads in Adipose Tissue by IVIS Spectrum
Distribution of 100 nm, 3 μm, and 10 μm PS Beads in the Nervous System by IVIS Spectrum
Distribution of 100 nm, 3 μm, and 10 μm PS beads in the reproductive system by IVIS Spectrum
CLSM and TEM Corroborations for the Presence of PS Beads in Blood
Histological Corroboration
Fluorescent Dye Leaching Experiment
Impact of pH value on MPs
 22006Supplementary Materials.pdf
|

|

 Quick Links
 DownLoad: