


-
Cadmium (Cd), a nonessential heavy metal, poses a serious threat to human health[1,2]. Although Cd enters the environment naturally, mining, smelting and industrial processes can cause metal contamination of water and agricultural soils, thus resulting in Cd entry into the food chain[3]. Oral Cd intake is the primary route of exposure in the nonsmoking population[4]. After oral administration, Cd enters the gastrointestinal tract and is transported via the blood to other organs, where it can cause liver dysfunction[5]; renal failure[6]; osteal[7], pulmonary[8], neurological[9] and reproductive[10] disorders; and dysregulation of immune responses[11]. Cd is also classified as a group I human carcinogen[12], because it can trigger carcinogenesis in various organs[10,13]. The long-term deleterious effects of Cd on numerous organs are a consequence of its long half-life (9–28 years[14,15]) and the absence of active excretion mechanisms[3].
Oxidative stress has been shown to be the major mechanism of Cd toxicity in many animal models, considering all routes of exposure[16–19]. Cd exerts its toxicity directly (through increasing reactive oxygen species production), as well as indirectly (affecting cellular signaling cascades)[20]. Consequently, this metal induces the up-regulation of inflammatory mediators [21–23]. Cd exerts its effects on both innate (mainly neutrophils, monocytes and macrophages) and adaptive (B and T cells, through modulation of their activation and modulation) immune cells[24], thereby affecting inflammatory pathways and ultimately leading to tissue damage.
The skin has not received substantial attention as a target for Cd toxicity, because absorption of this metal through the skin is negligible, at only 0.5%[3]. However, topical application of Cd induces acanthosis and hyperkeratosis in the skin, with occasional ulcerative changes[25]. In rats, it decelerates wound healing and disables complete tissue re-epithelization, through constant infiltration of inflammatory cells, edema and aberrant epidermal cell growth[26]. Cd can reach the skin via oral consumption, where it accumulates over time and might exert adverse effects. Cd has been found to delay wound healing in mice by decreasing neutrophil infiltration and the expression of chemokines and pro-inflammatory cytokines in the early tissue healing phase[27]. Our recent studies have shown that orally acquired Cd affects homeostatic mechanisms in the skin, by increasing oxidative and pro-inflammatory activity by skin cells[28,29]. Such activity may affect cutaneous immune-mediated homeostasis, thus leading to changes in skin reactivity and possibly disease development. In this regard, a potential link between Cd and psoriasis has been proposed, because blood Cd concentrations are higher in patients, particularly those with severe psoriasis. However, the underlying mechanisms remain unknown[30].
In line with the above findings, and in light of the recently presented opinion that Cd immunomodulatory potential contributes to inflammatory disease development/aggravation[31], the aim of this study was to examine the potential of oral Cd to influence contact skin allergies, by using an experimental contact hypersensitivity reaction (CHS) to hapten dinitrochlorobenzene (DNCB). CHS is a T cell-mediated skin inflammatory reaction to cutaneous exposure to small sensitizing chemicals (haptens) and is used as an animal model for allergic contact dermatitis, a complex skin inflammatory disease[32]. In the first phase of a CHS reaction (called the afferent/induction/sensitization phase), after the initial skin contact with the hapten, the development of antigen (hapten)-specific effector (IFN-γ and IL-17) cytokine-producing T cells occurs in the lymph nodes that drain hapten-treated skin[33]. In the second phase (called the efferent/elicitation/challenge phase), when the same hapten is applied to a different skin region several days later, a nonspecific pro-inflammatory innate immune cell activity rapidly occurs with TNF as a critical mediator[34,35], and this is followed by recruitment of hapten-specific T cells in the epidermis and dermis, thereby causing inflammation manifesting as ear swelling 1 day later[36].
To explore the effect of orally acquired Cd on the CHS reaction, we used prolonged (30 day) oral exposure of rats to an environmentally relevant Cd concentration (5 ppm) previously used for examination of Cd dermatotoxicity[28]. The ear swelling response to DNCB challenge as well as the draining lymph node (DLN) cell response to skin sensitization was analyzed in Dark Agouti (DA) rats, which are relatively prone to Cd-induced inflammation in a variety of organs[37,38] including the skin[28,29]. To assess whether the influence of Cd on CHS might be a general effect, we also used Albino Oxford (AO) rats, a strain previously shown to be less susceptible to Cd dermatotoxicity[29]. The results provide the first reported evidence that orally acquired Cd increases the skin inflammatory reaction to sensitizing chemicals, such as hapten DNCB. These novel data suggest that Cd, in some settings, e.g., skin inflammatory disorders, might worsen skin condition.
-
Cd chloride (CdCl2) was purchased from Serva (Serva, Feinbiochemica, Heidelberg, Germany); 3-(4,5-dimethyl-thiazol-2-yl)-2,5 diphenyl-tetrazolium bromide (MTT) was purchased from SigmaAldrich (St. Louis, MO, USA); 1-chloro-2,4 dinitrochlorobenzene (DNCB) was obtained from BDH Chemicals Ltd.; 2,4-dinitrobenzenesulfonic acid (DNBS) was purchased from Aldrich Chemical Company (Milwaukee, WI, USA); and N,N,N,N-ethylenediaminetetraacetic acid (EDTA) disodium salt dihydrate was obtained from USB Corporation (Cleveland, OH, USA). Sucrose was obtained from Lachner (Neratovice, Czech Republic). Dispase II was obtained from Boehringer (Manheim, Germany), and collagenase IV and DNase I were obtained from Sigma (Sigma Chemical Co, St. Louis, MO, USA). RPMI-1640 culture medium (Biowest, Nuaillé, France) supplemented with 2 mmol/L glutamine, 20 μg/mL gentamicine (Galenika a.d., Zemun, Serbia) and 5% (v/v) heat-inactivated fetal calf serum (Biowest, Nuaillé, France) were used. Phosphate buffered saline, pH 7.4, contained NaCl (137 mmol/L), KCl (2.7 mmol/L), Na2HPO4x2H2O (8.1 mmol/L) and KH2PO4 (1.76 mmol/L; purchased from LachNer, Neratovice, Czech). For use in experiments, Dispase II was dissolved in RPMI-1640 medium. All solutions for cell culture experiments were prepared under sterile conditions and were sterile filtered (Minisart, pore size 0.20 µm, Sartorius Stedim Biotech, Goettingen, Germany) before use. Commercially available enzyme-linked immunosorbent assay (ELISA) kits for rat IFN-γ and IL-10 were purchased from R&D (Minneapolis, USA), whereas kits for mouse IL-17 (cross-reactive with rat IL-17) and rat TNF were obtained from eBioscience (San Diego, CA, USA). Mouse anti-rat anti-CD4 and anti-CD8 antibodies for flow cytometry analysis were purchased from eBioscience (San Diego, CA, USA).
-
Animal treatments and experimental procedures were performed in compliance with Directive 2010/63/EU on the protection of animals used for experimental and other scientific purposes, and were approved by the Ethical Committee of the Institute for Biological Research “Sinisa Stankovic” (IBISS), University of Belgrade, Serbia. Male DA and AO rats (ethical clearance number 01-05/18) 8–10 weeks of age, used in experiments, were conventionally housed at IBISS under a controlled environment (21–24 °C temperature, a 60% relative humidity and 12 h light/dark cycle). Four animals were assigned to each treatment group per experiment, and at least two independent experiments were performed. Both strains of rats were exposed to 5 ppm (5 mg/L) of Cd (II) ion prepared in distilled water over a period of 30 days, whereas control rats were given only distilled water. In experiments examining both the sensitization phase and the challenge phase, we also had an AO group of rats exposed to a higher dose of Cd (50 ppm), in addition to a group exposed to a lower dose (5 ppm), because higher doses induce more pronounced dermatotoxicity in this strain, as previously demonstrated[29]. Doses used in this study are relevant to human exposure: 5 ppm is considered to correspond to the environmental pollution exposure of women in Japan with itai itai disease[39], and 50 ppm is equivalent to the concentration of Cd in highly polluted areas or environments in which humans are professionally exposed to this metal[40]. Twice per week, the Cd solution and water were replaced with freshly prepared solution/water. All rats were given ad libitum access to standard rodent pellets and water/Cd solution throughout the study.
-
After Cd or water treatment (at day 30) CHS reaction was performed by application of a low DNCB dose sensitization/challenge regime, as described previously[41]. Animals whose fur was previously clipped were sensitized by application of 100 μL of 0.4% DNCB dissolved in a solution containing acetone and olive oil, to the upper part of the dorsum (approximately 16 cm2) for 2 consecutive days. Five days after sensitization, the animals were challenged by application of 50 μL of 0.13% DNCB (also dissolved in a solution of acetone and olive oil) to the ventral and dorsal surfaces of the right ear. The left ear was treated with vehicle (acetone and olive oil solution). All functional measurements were performed 24 h and 72 h after the second DNCB application on dorsal skin (for the sensitization phase) or 24 h after DNCB application on right ears (for the challenge phase; Figure 1). Experimental groups are explained in Table 1. Animals were anesthetized by i.p. injection of 40 mg/kg bw of thiopental sodium (Rotexmedica, Tritau, Germany).

Figure 1. Experimental flow chart. DLN, draining lymph nodes; CHS, contact hypersensitivity reaction.
Parameters DA rats AO rats Cd (0 ppm) Cd (5 ppm) Cd (0 ppm) Cd (5 ppm) Cell number (× 106) 1.23 ± 0.11 1.83 ± 0.05* 1.46 ± 0.08 1.68 ± 0.07 CD8+ cell number, % 1.56 ± 0.04 2.11 ± 0.11*** 1.37 ± 0.16 1.43 ± 0.08 CD8+ cell number (× 104) 1.92 ± 0.05 3.86 ± 0.19** 2.00 ± 0.22 2.53 ± 0.13 CD4+ cell number, % 3.11 ± 0.04 5.67 ± 0.14*** 1.26 ± 0.01 2.04 ± 0.14** CD4+ cell number (× 104) 3.83 ± 0.04 10.36 ± 0.24** 1.87 ± 0.01 3.43 ± 0.23* Note. Results are presented as mean ± SEM. Significance at: *P < 0.05, **P < 0.01, and ***P < 0.001 vs. control (Cd 0 ppm) (Mann-Whitney U test corrected with the Bonferroni adjustment). Table 1. Experimental animal groups
-
Ear swelling (an in vivo measure of contact hypersensitivity response) was assessed in a blinded fashion by measurement of the pinnal thickness before and 24 h after ear challenge, with a hand-held engineer’s micrometer (six measurements per ear). An increase in ear swelling, defined as a difference in ear thickness 24 h after vs. before the challenge, is expressed as a relative value compared with the respective control (i.e., Cd nonexposed animals), which was normalized to 1.
-
Ear skin samples were collected 24 h after challenge, fixed in 4% buffered formalin (pH 6.9), treated with an ethanol series (concentration 30%–100%), then washed in xylene and embedded in paraffin. Five micrometer thick tissue sections were mounted on glass slides and stained with hematoxylin and eosin. Pathohistological analysis was performed by a certified specialist using a Coolscope digital light microscope (Nikon, Tokyo, Japan).
-
Suprascapular and axillary lymph nodes (that drain sensitized skin) were harvested 24 h and 72 h after sensitization. Cell suspensions were prepared by mechanical teasing of DLNs over nylon mesh (70 μm nylon, BD Bioscience, Bedford, USA). After washing and resuspension in medium, cells were counted with an improved Neubauer hemocytometer. The number of viable cells, determined with a trypan blue exclusion assay, always exceeded 95%. DLN cell viability was measured with MTT reduction assays[42]. Cells (0.1 × 10⁶) were incubated with 500 µg/mL of MTT (added immediately in culture) in a 96-well plate, for 3 h at 37 °C under a humidified atmosphere of 5% CO2. Formed formazan was dissolved by overnight incubation with 10% sodium dodecyl sulfate and 0.01 N HCl, and the absorbance of extracted chromogen was read spectrophotometrically at 540 nm (with correction at 670 nm).
DLN cells (1.2 × 10⁶/well) were cultured in 96-well plates (Sarstedt Inc., Newton, NC, USA) for 48 h (at 37 °C under a humidified 5% CO2 atmosphere) in the presence of 10 μg/mL of DNBS (hapten-specific production). Cytokine production was determined in medium conditioned by DLN cells with commercially available ELISA kits. Cytokine titers were calculated through reference to a standard curve constructed with known amounts of kit-provided recombinant cytokines.
-
A mixed population of epidermal and dermal cells from right ears (treated with DNCB) was isolated for analysis of the skin response to the challenge, as described in other studies[43]. Ears were split into dorsal and ventral halves with forceps and digested with Dispase II (2.5 mg/mL) for 90 min at 37 °C, to separate the epidermis and dermis. The separated epidermal and dermal sheets were cut into small pieces and digested with collagenase type IV (1 mg/mL) and DNase I (1 mg/mL) for 45 min at 37 °C to release cells. To obtain single-cell suspensions, we filtered the tissues through a nylon mesh (70 μm nylon, BD Bioscience, Bedford, USA), then washed and resuspended the cells in medium. Cells were counted with an improved Neubauer hemocytometer, whereas metabolic viability was measured with MTT reduction assays, as previously described.
Ear cells (0.1 × 10⁶/well) were cultured for 48 h (at 37 °C in a humidified atmosphere of 5% CO2) in 96-well plates (Sarstedt Inc., Newton, NC, USA) in medium alone (spontaneous production for TNF) or in medium with 10 μg/mL of DNBS (hapten-specific production for IFN-γ and IL-17). Cytokine production was determined with commercially available ELISA kits in medium conditioned by ear cells. Cytokine titers were calculated by reference to a standard curve constructed with known amounts of kit-provided recombinant cytokines.
-
The isolated right (treated with DNCB) ear cells (1 × 10⁶) were incubated on ice with mouse anti-rat anti-CD4 (fluorescein isothiocyanate conjugated) and anti-CD8 (phycoerythrin conjugated) antibodies, for 30 minutes. After washing with phosphate buffered saline, the cells were fixed with 1% paraformaldehyde and assayed for fluorescence intensity on a CyFlow Space flow cytometer (Partec, Munster, Germany).
-
Results are expressed as means ± standard error. Statistical analysis was performed in STATISTICA 7.0 (StatSoft Inc., Tulsa, OK), and statistical significance between groups was defined by a Mann-Whitney U test with Bonferroni correction for multiple comparisons. Corrected P-values less than 0.05 were considered significant.
-
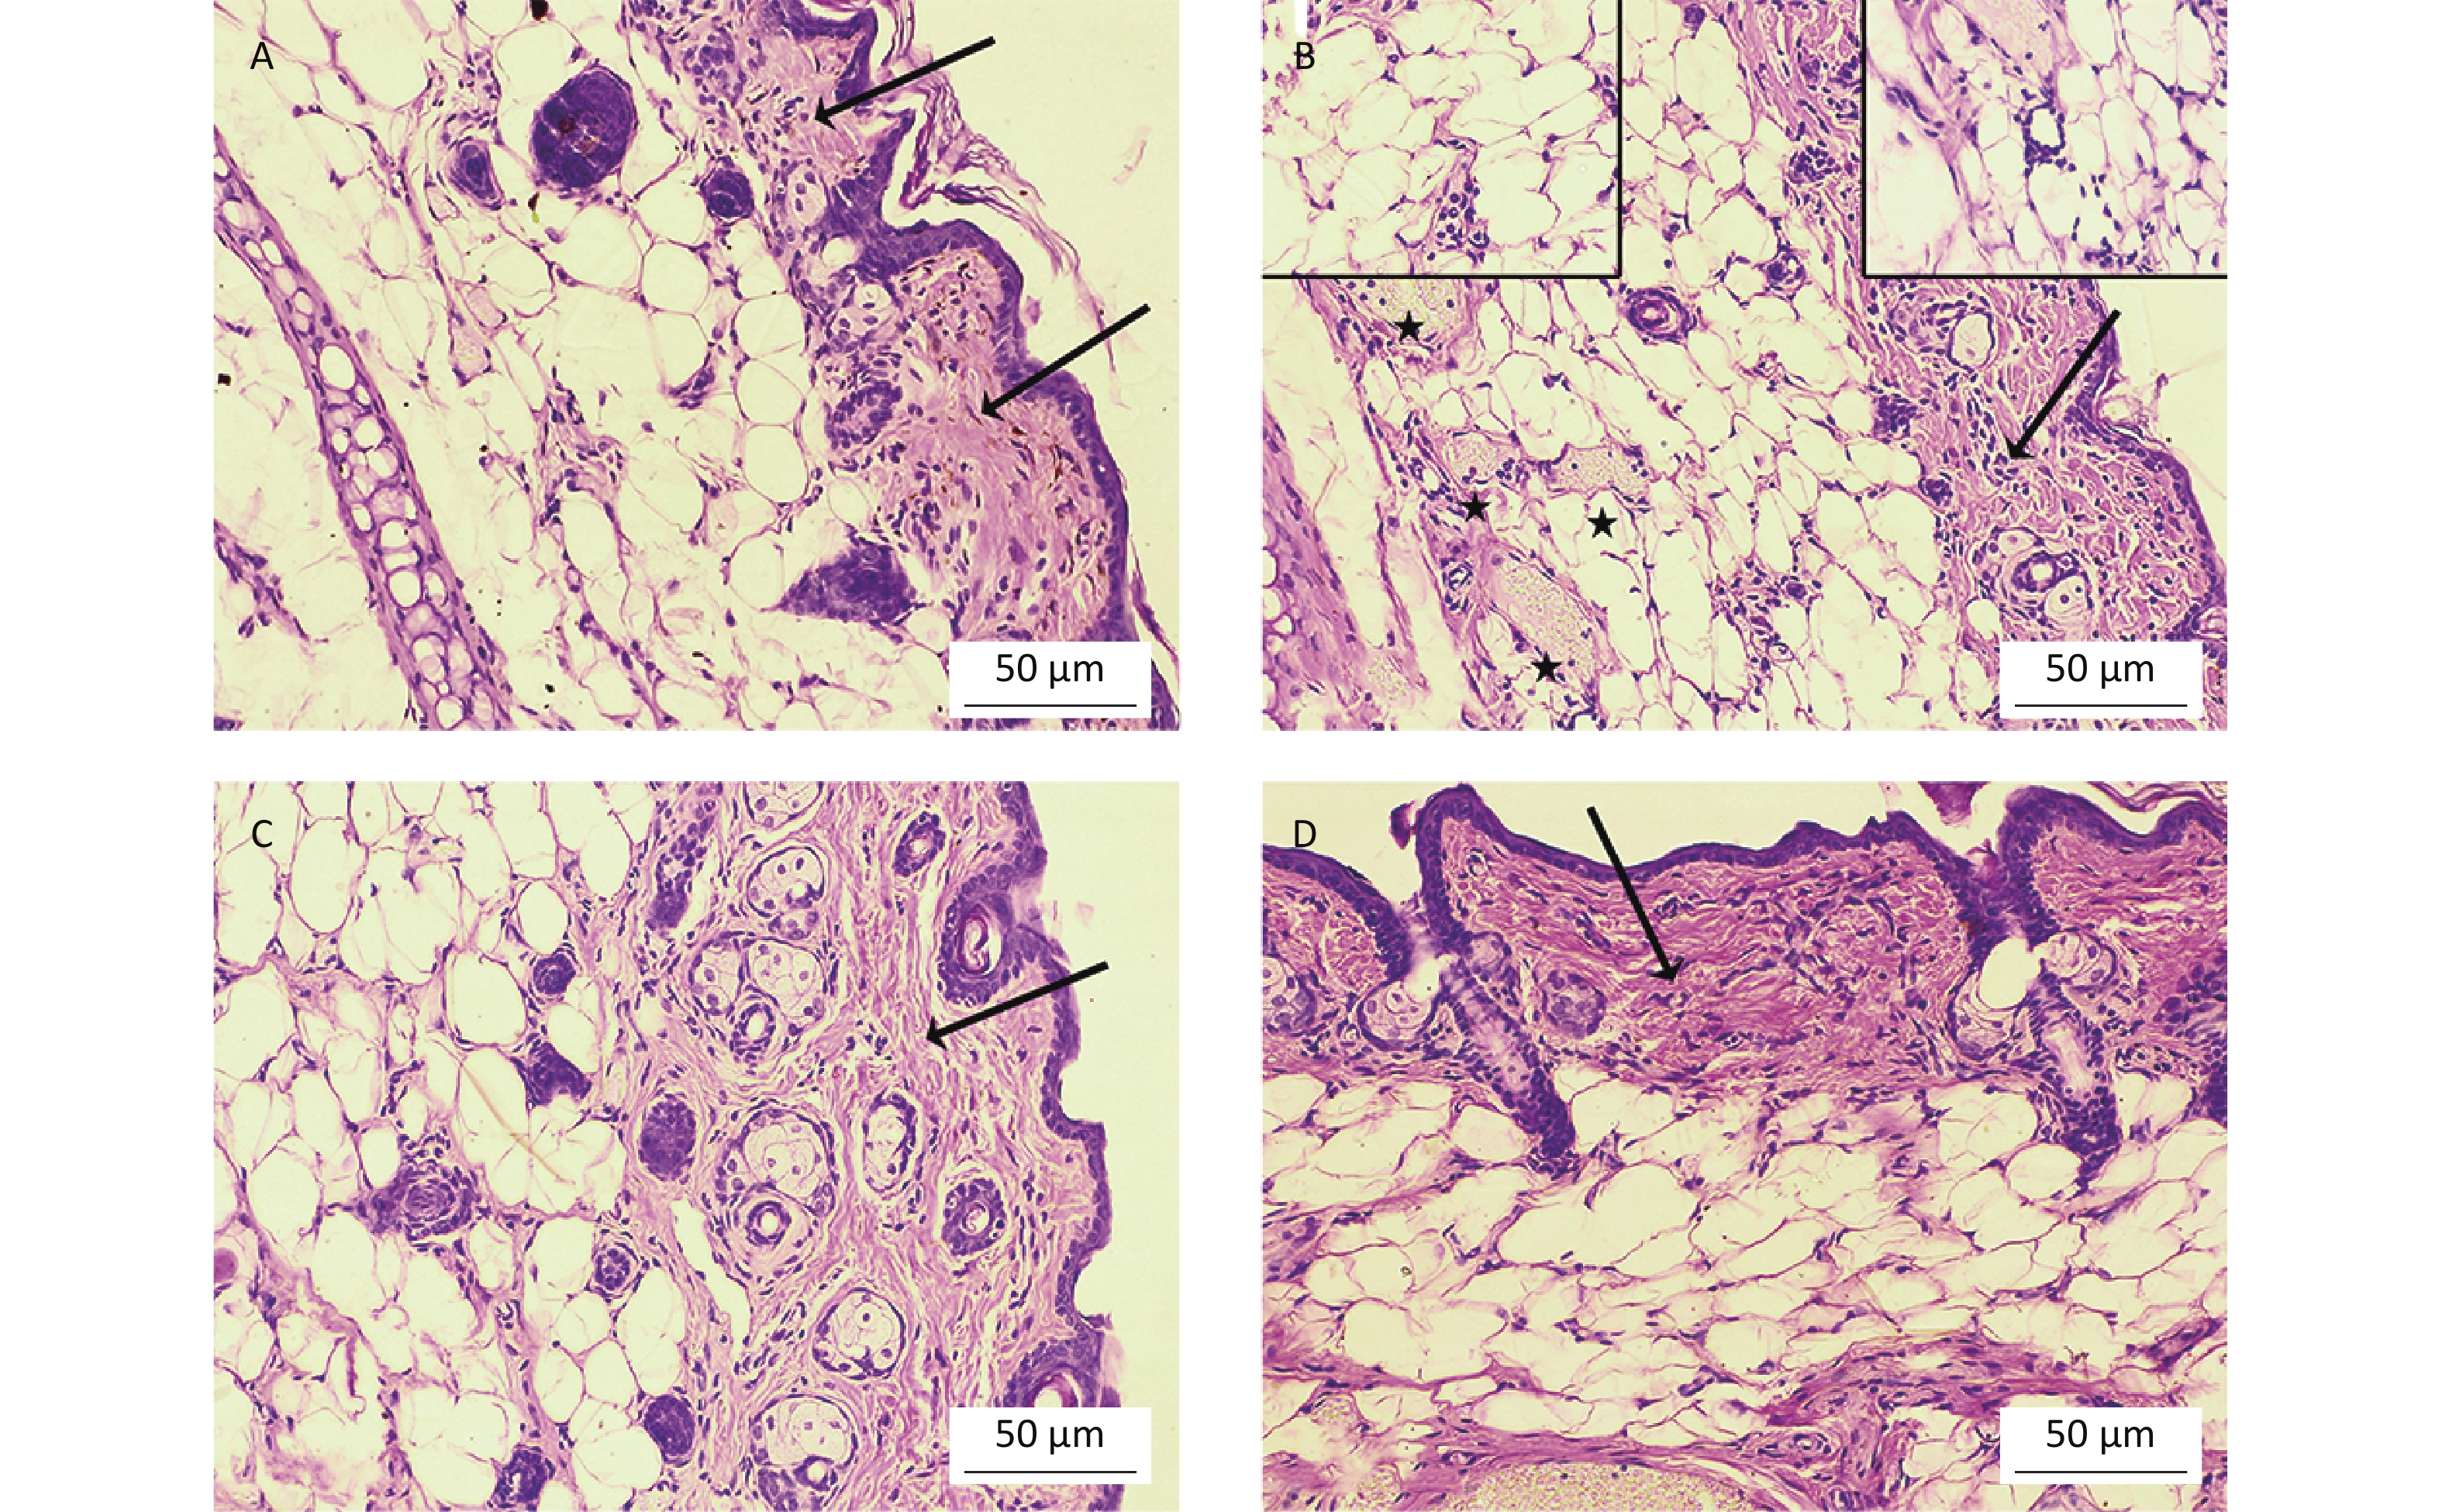
To determine whether oral Cd consumption might affect the CHS reaction to DNCB, we first analyzed the ear swelling response after challenge (Figure 1). Greater ear swelling was observed in Cd-exposed DA rats than Cd-nonexposed (treated only with DNCB) controls, and no changes were observed in AO rats (Figure 2). No differences were seen in the thickness of ears treated with vehicle (olive oil and acetone) between rats receiving only water or water with Cd (1.00 ± 0.06 and 0.88 ± 0.11 in Cd-nonexposed and Cd-exposed DA rats, and 1.00 ± 0.11 and 0.93 ± 0.04 in Cd-nonexposed and Cd-exposed AO rats, respectively). Histological examination of the challenged ears in DA rats showed edema and dilatation of subcutaneous vascular spaces with congestion (Figure 3A–B), which were more pronounced in Cd-exposed animals (compared with controls), in which infiltration of inflammatory cells was detected (Figure 3B). In sensitized AO rats, after challenge, edema was present, but differences were not observed between Cd-nonexposed (Figure 3C) and Cd-exposed animals (Figure 3D). Cutaneous ear skin response to the challenge was much more pronounced in Cd-exposed DA than Cd-exposed AO rats.
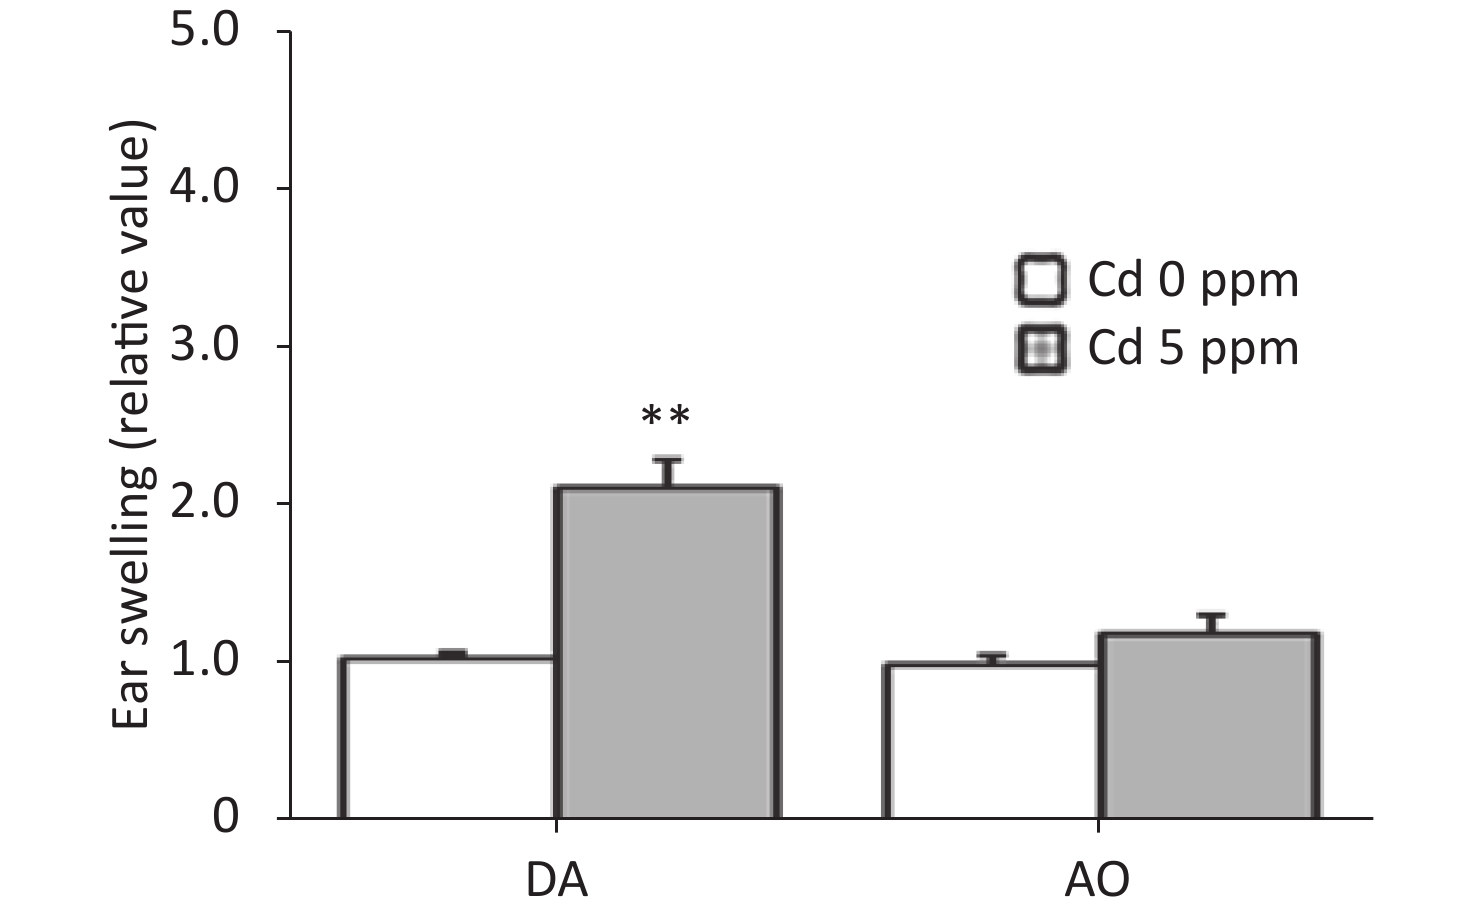
Figure 2. Effects of oral Cd on the ear swelling response during the challenge phase of the CHS reaction in DA (n = 12) and AO (n = 8) rats. Ear swelling was defined as a difference in ear thickness 24 hours after the challenge vs. before the challenge. Results are presented as mean ± SEM. **P < 0.01 vs. control (Cd 0 ppm; Mann-Whitney U test with Bonferroni correction).
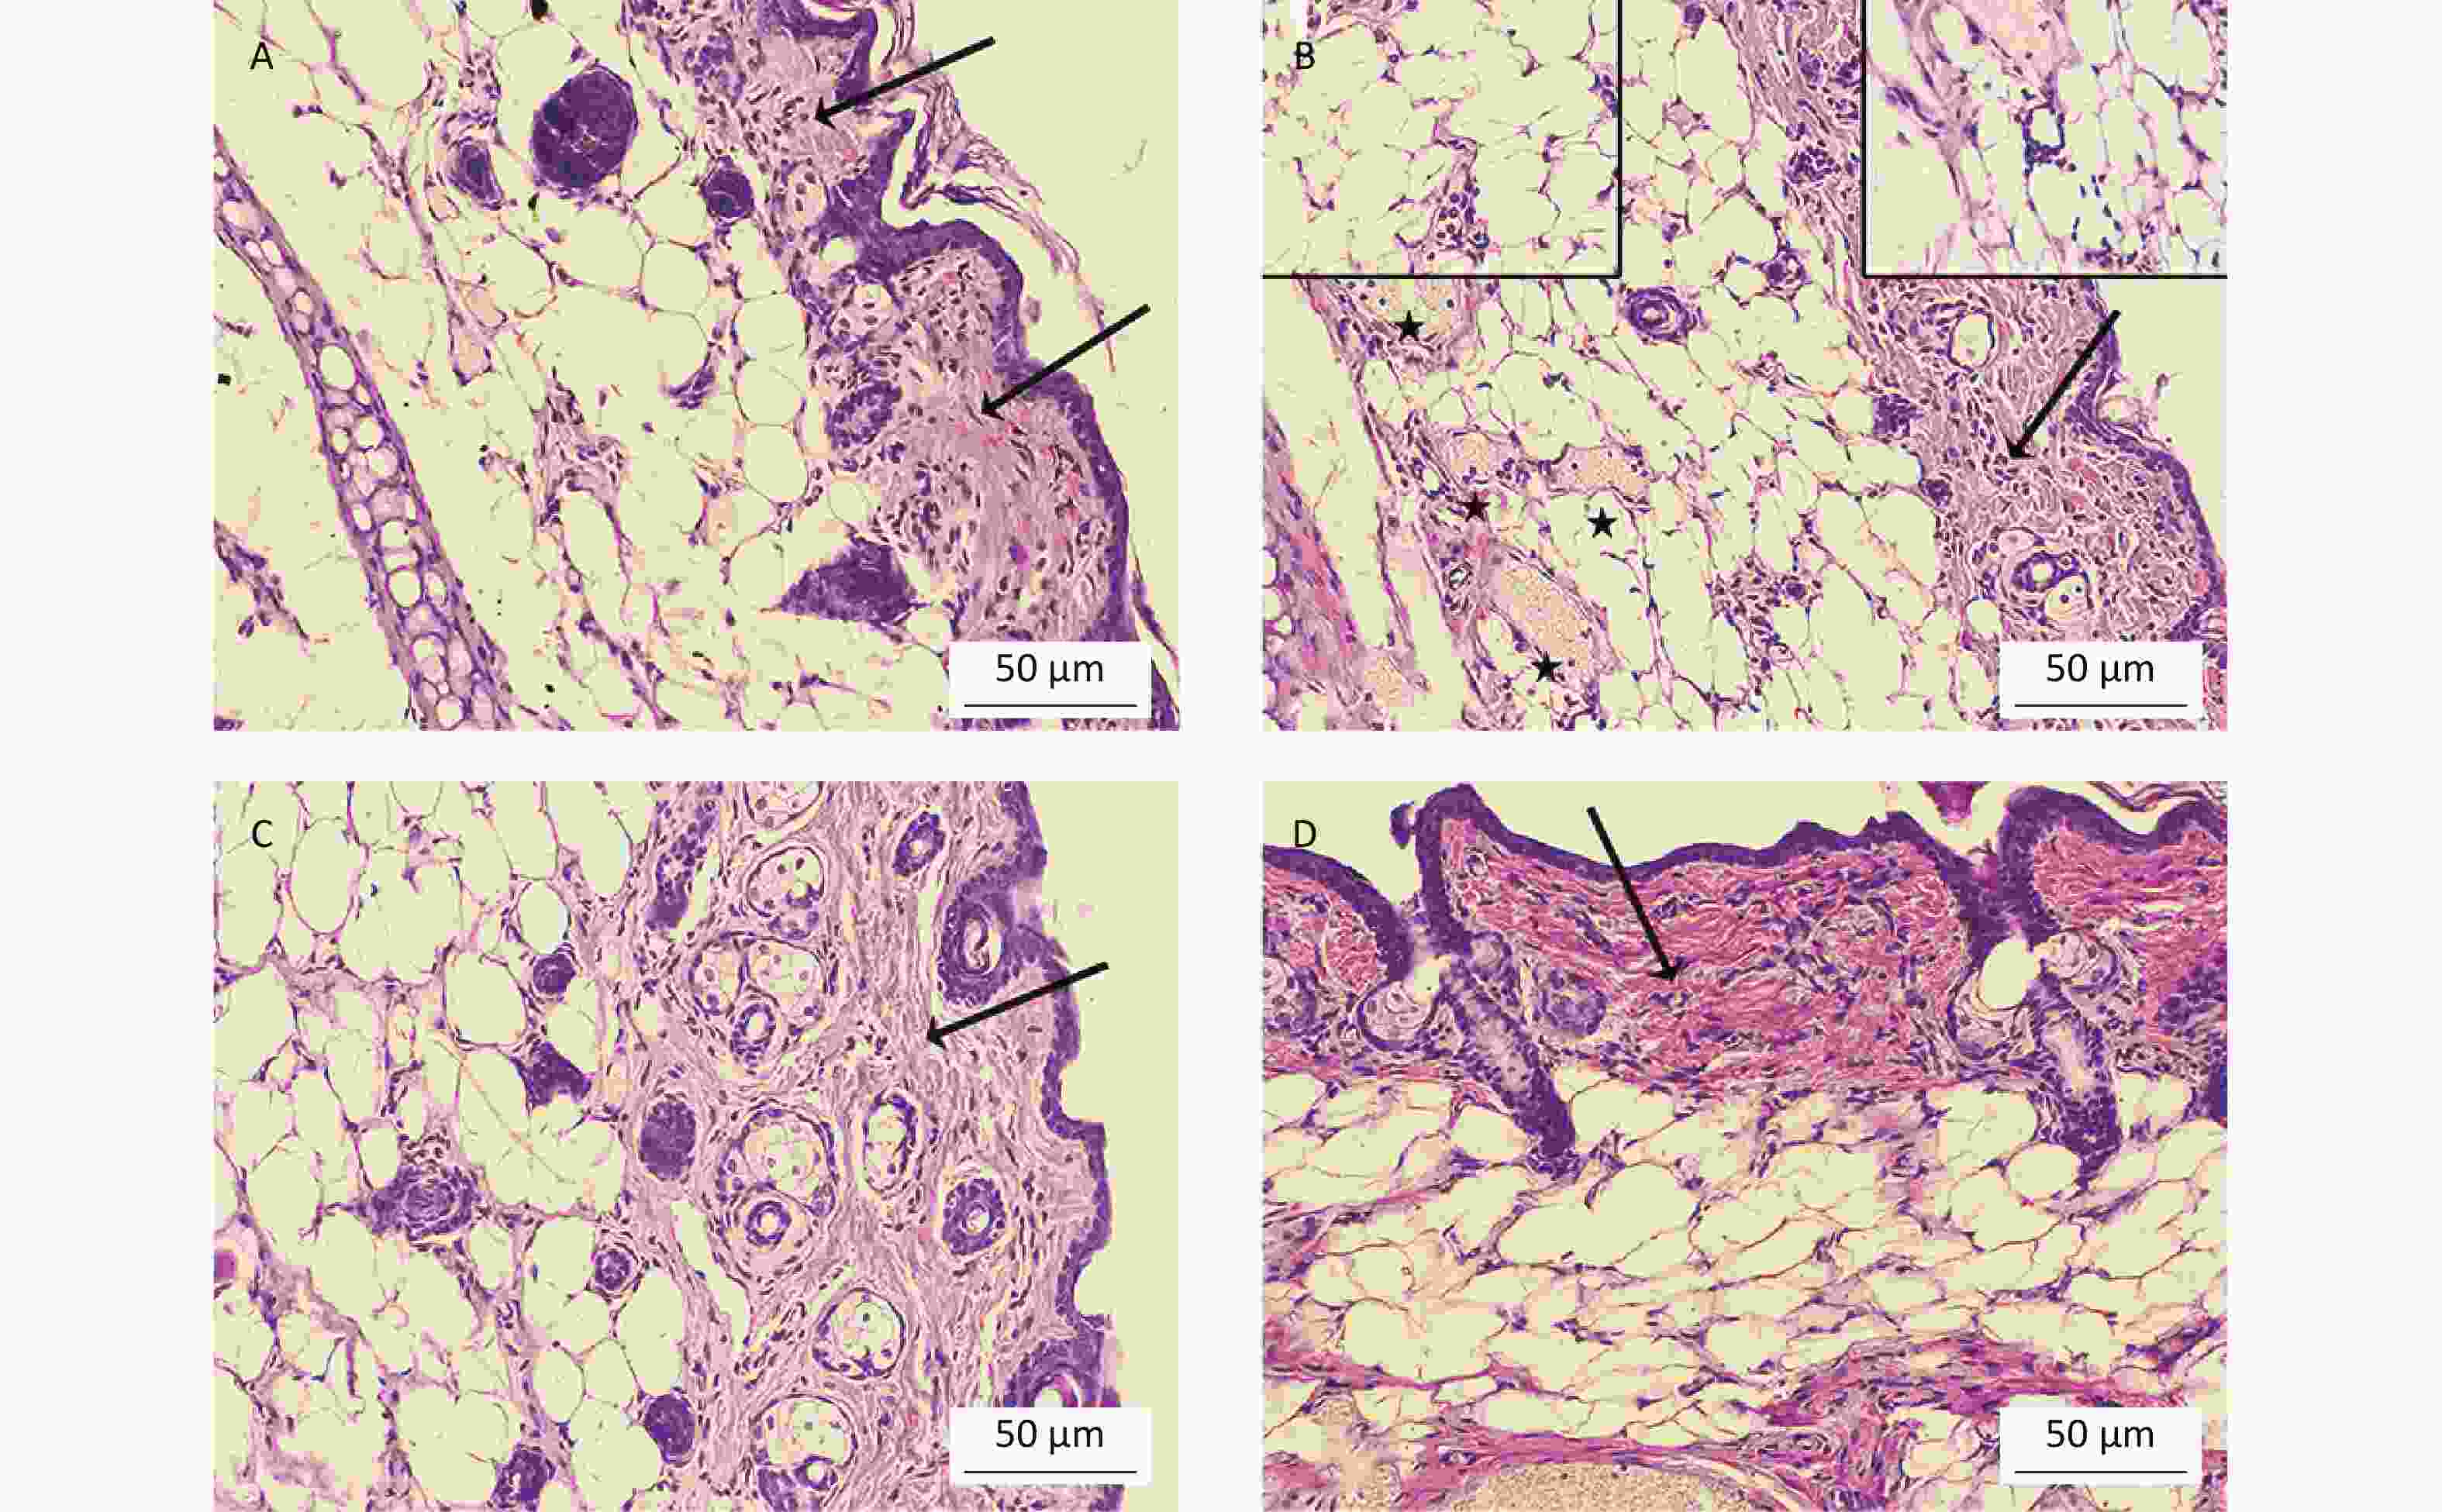
Figure 3. Histological analysis of challenged ears (n = 8). Collagen homogenization (edema; arrows) in (A) control (Cd-nonexposed) rats and (B) Cd-exposed DA rats. (B) Pronounced subcutaneous vascular congestion (asterisk), intravascular aggregation of neutrophils (inset, left) and perivascular infiltration of mononuclear cells (inset, right) in Cd-exposed DA rats. Edema (arrow) in (C) control and (D) Cd-exposed AO rats (original magnification × 200).
-
Total number of ear cells obtained from DA rats, including the absolute and relative number of both CD4+ and CD8+ cells, were greater compare to the cell number obtained from control animals (Table 2). In contrast, no change was observed between control and Cd-exposed AO rats, in either the total number of ear skin cells or CD8+ cell number. However, an increase in number (absolute and relative) of CD4+ cells was observed in Cd-exposed AO rats compared to control animals. The viability of ear skin-derived cells was unchanged between Cd-exposed and Cd-nonexposed animals in either strain (0.190 ± 0.007 and 0.170 ± 0.006 in control and Cd-exposed DA rats, and 0.210 ± 0.007 and 0.230 ± 0.01 in control and Cd-exposed AO rats, respectively).
Phase DA rats AO rats Challenge
(24 h post challenge)0.4%/0.13%
DNCB (control)0.4%/0.13%
DNCB + 5 ppm Cd0.4%/0.13%
DNCB (control)0.4/%/0.13%
DNCB + 5 ppm Cd0.4/%/0.13%
DNCB + 50 ppm Cdn = 12 n = 12 n = 8 n = 8 n = 8 Sensitization
(24 h and 72 h post
sensitization)0.4%
DNCB (control)0.4%
DNCB + 5 ppm Cd0.4%
DNCB (control)0.4%
DNCB + 5 ppm Cd0.4%
DNCB + 50 ppm Cdn = 10/term n = 10/term n = 8/term n = 8/term n = 8/term Table 2. Oral Cd effect on ear CD4+ and CD8+ cells number following challenge of CHS
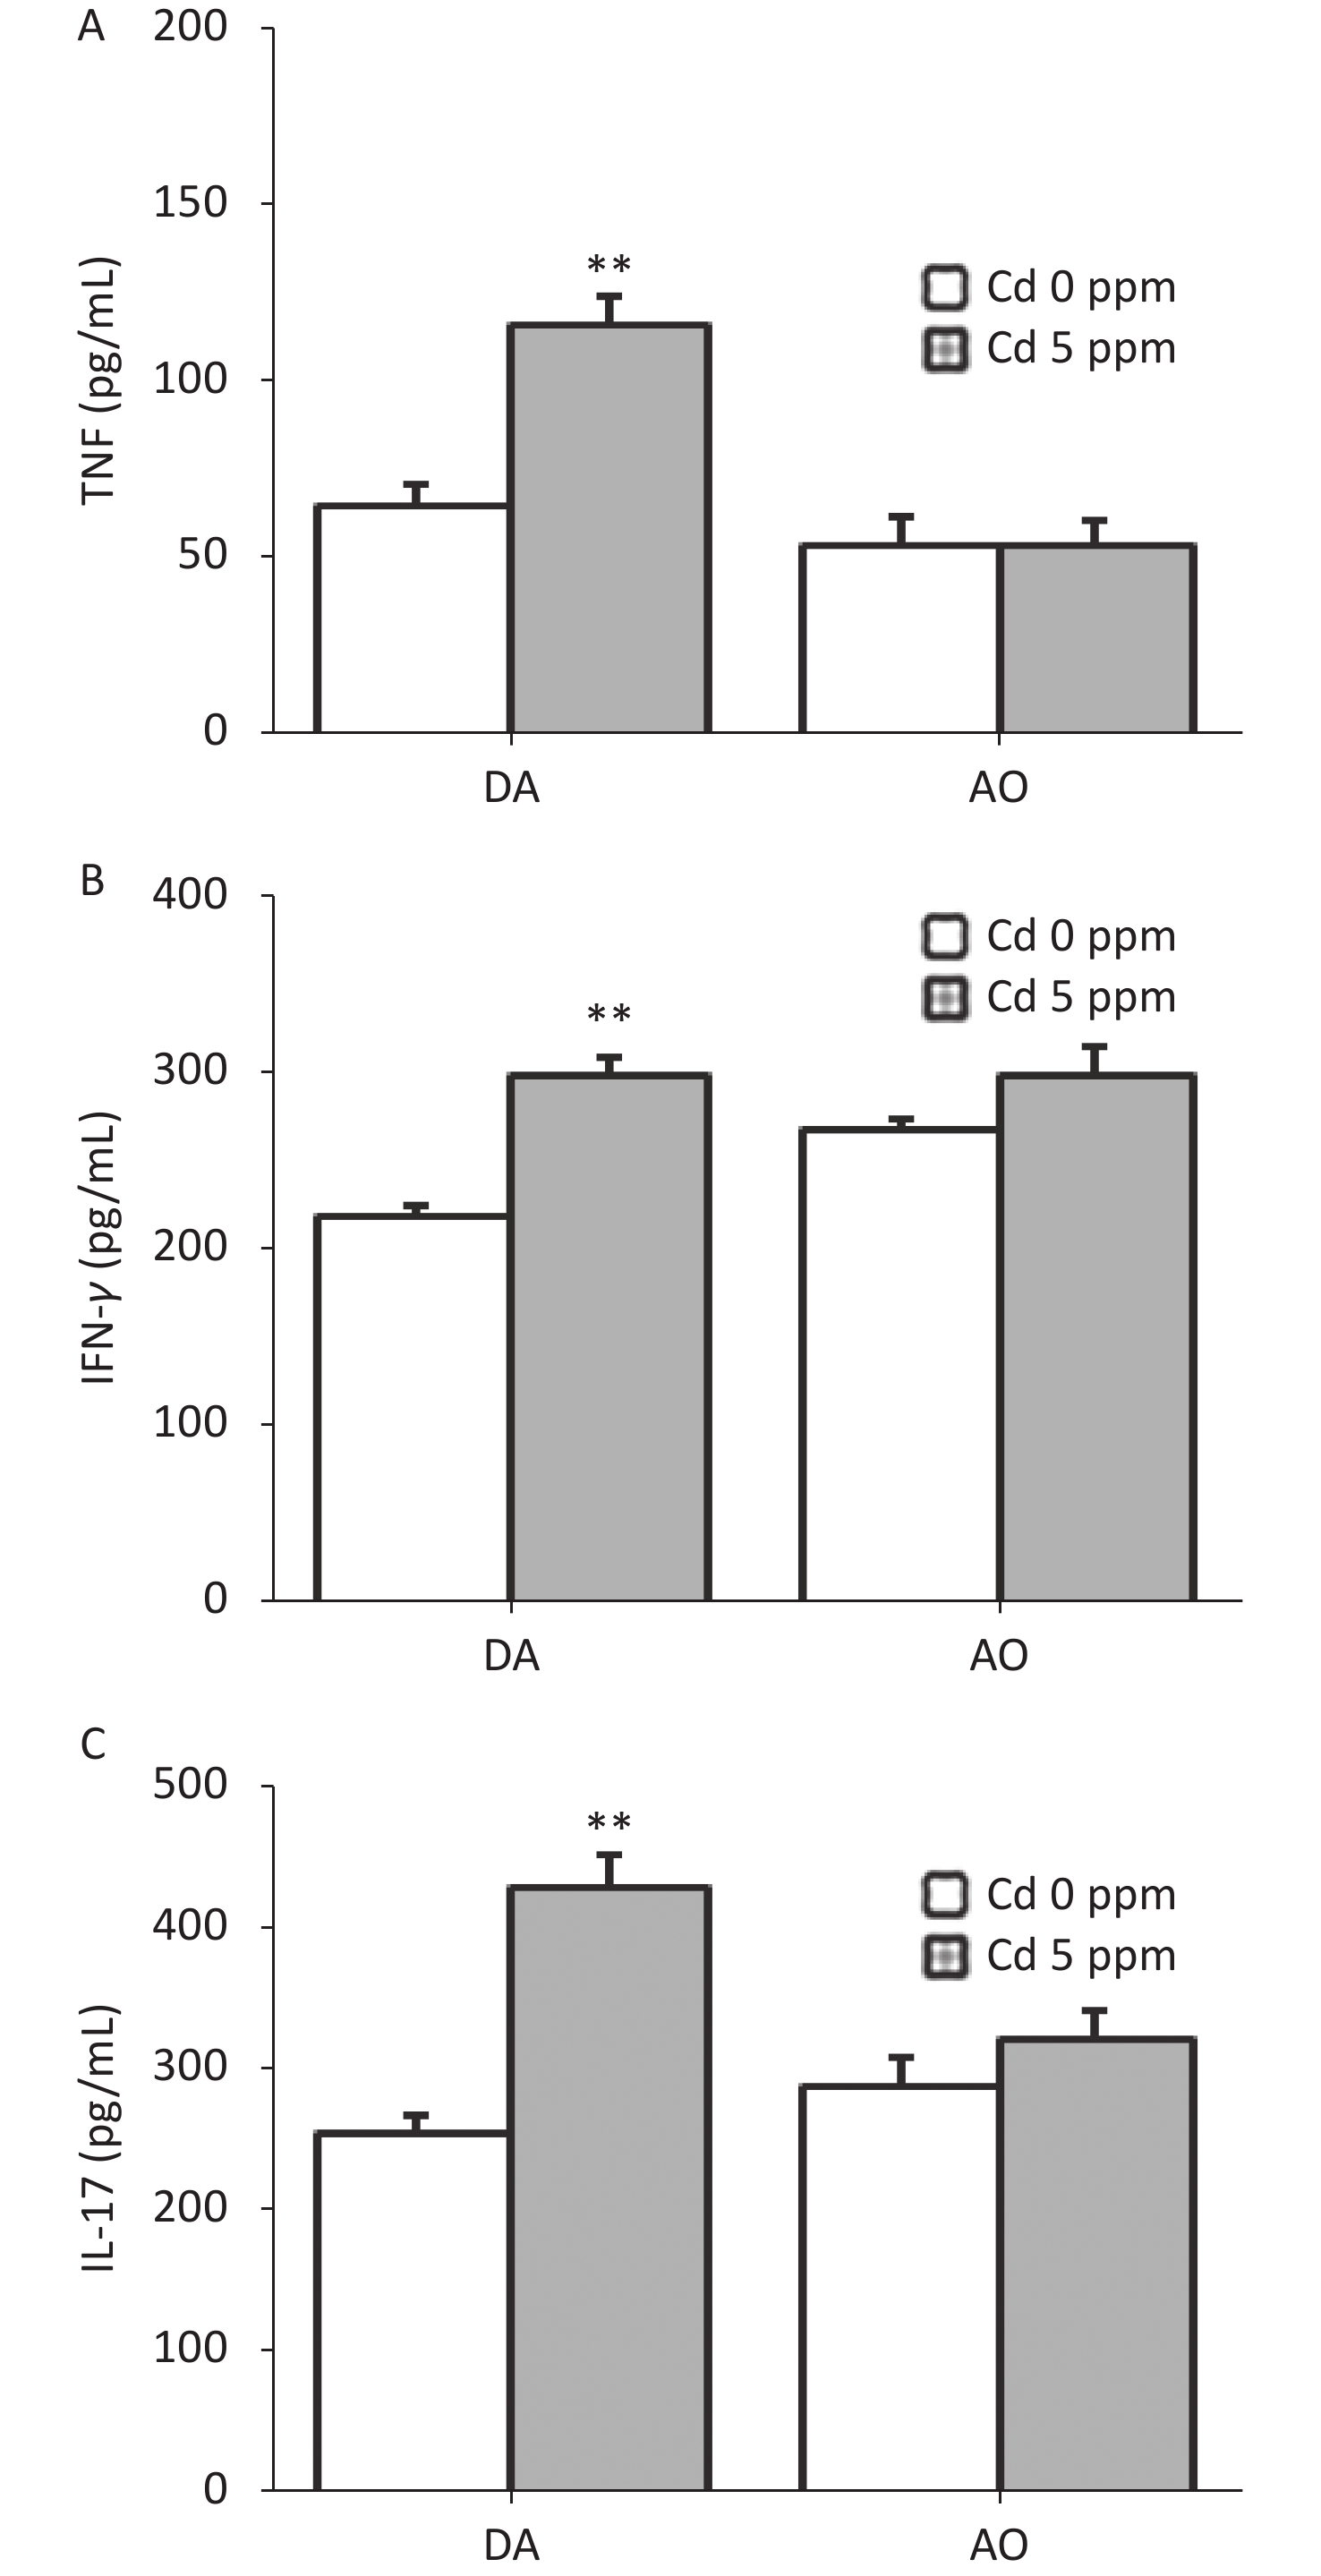
Since ear skin inflammation in CHS includes a pro-inflammatory cytokine response, we determined the level of TNF, IFN-γ and IL-17 in ear cell culture, the most relevant cytokines for CHS reaction (Figure 4). Significantly higher production of these cytokines was found in Cd-exposed DA rats than controls, whereas no differences were seen in AO rats (Figure 4A–C).
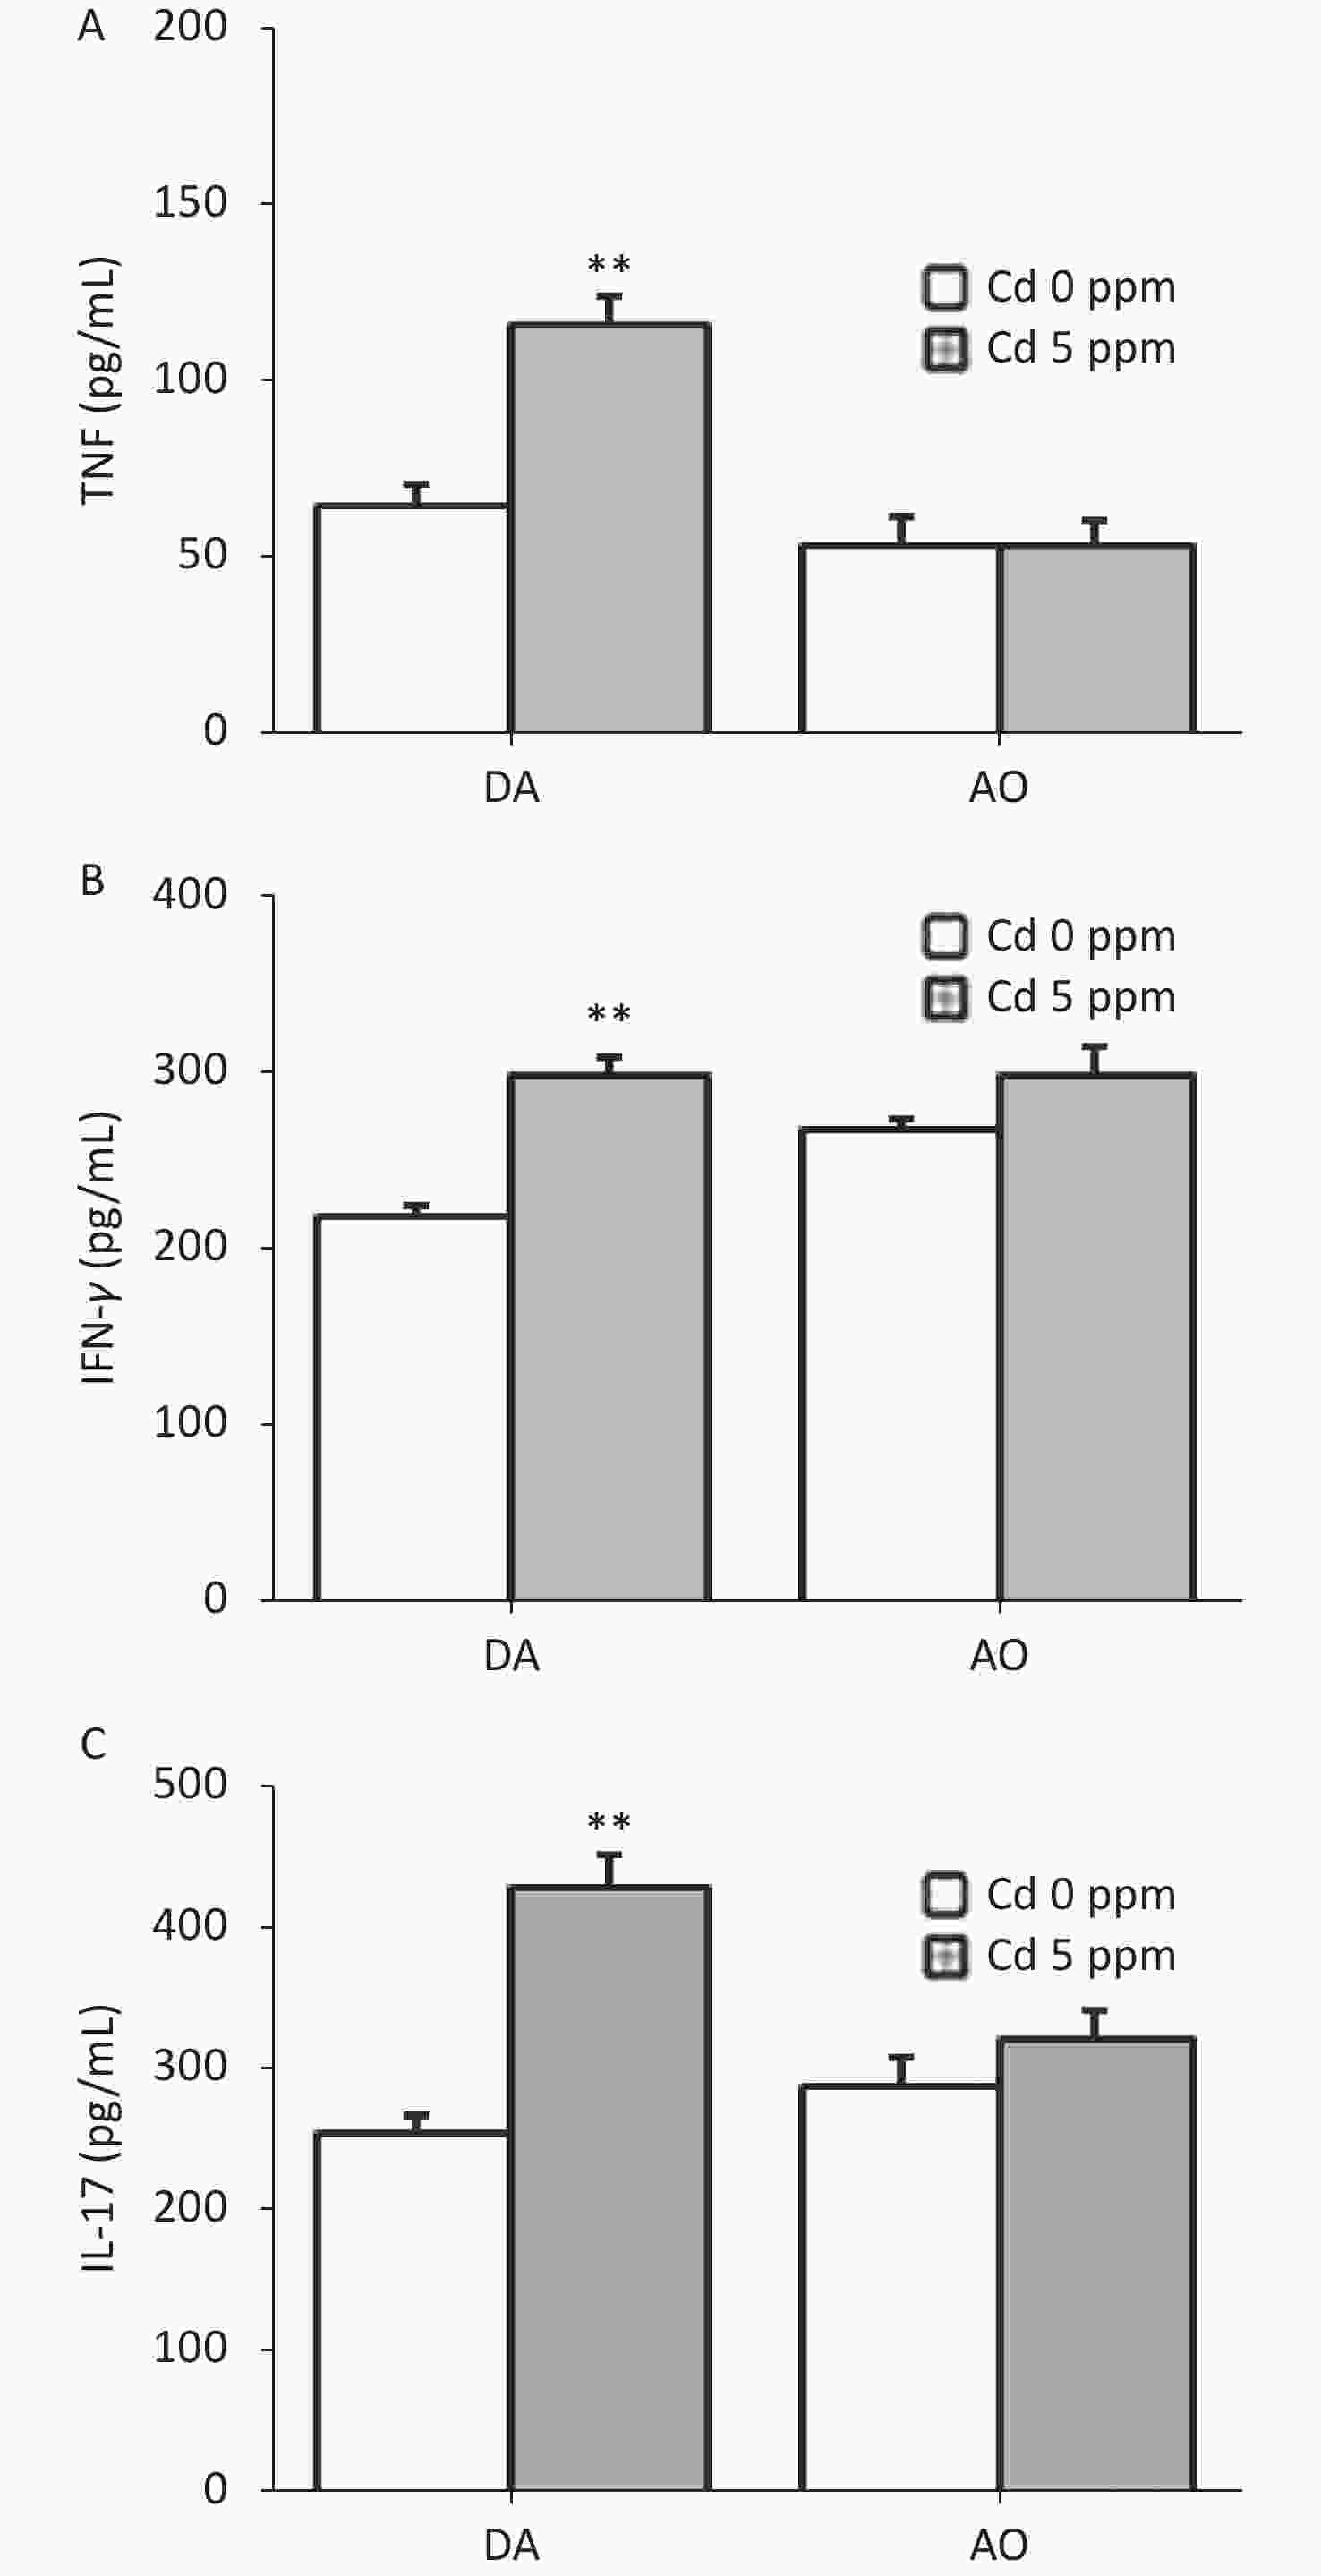
Figure 4. Effects of oral Cd on pro-inflammatory cytokine production by ear skin cells during the challenge phase of CHS. (A) TNF, (B) IFN-γ and (C) IL-17 production in DA (n = 8) and AO rats (n = 6). Results are presented as mean ± SEM. **P < 0.01 vs. control (Cd 0 ppm; Mann-Whitney U test with Bonferroni correction).
-
Development of a CHS reaction is determined by the sensitization phase, and the generation of effector cytokine (IFN-γ and IL-17)-producing cells occurs in skin DLNs. Thus, we next explored the effect of oral Cd intake on DLN cell activity during the sensitization phase (Figure 5). No differences were observed in the viability of DLN cells between Cd-exposed animals and Cd-nonexposed animals, at either time point after sensitization (0.15 ± 0.02 and 0.13 ± 0.01 in control and Cd-exposed DA rats, and 0.13 ± 0.03 and 0.15 ± 0.02 in control and Cd-exposed AO rats, respectively, at day 1 post sensitization; 0.62 ± 0.03 and 0.59 ± 0.03 in control and Cd-exposed DA rats, and 0.63 ± 0.05 and 0.65 ± 0.03 in control and Cd-exposed AO rats, respectively, at day 3 post sensitization).
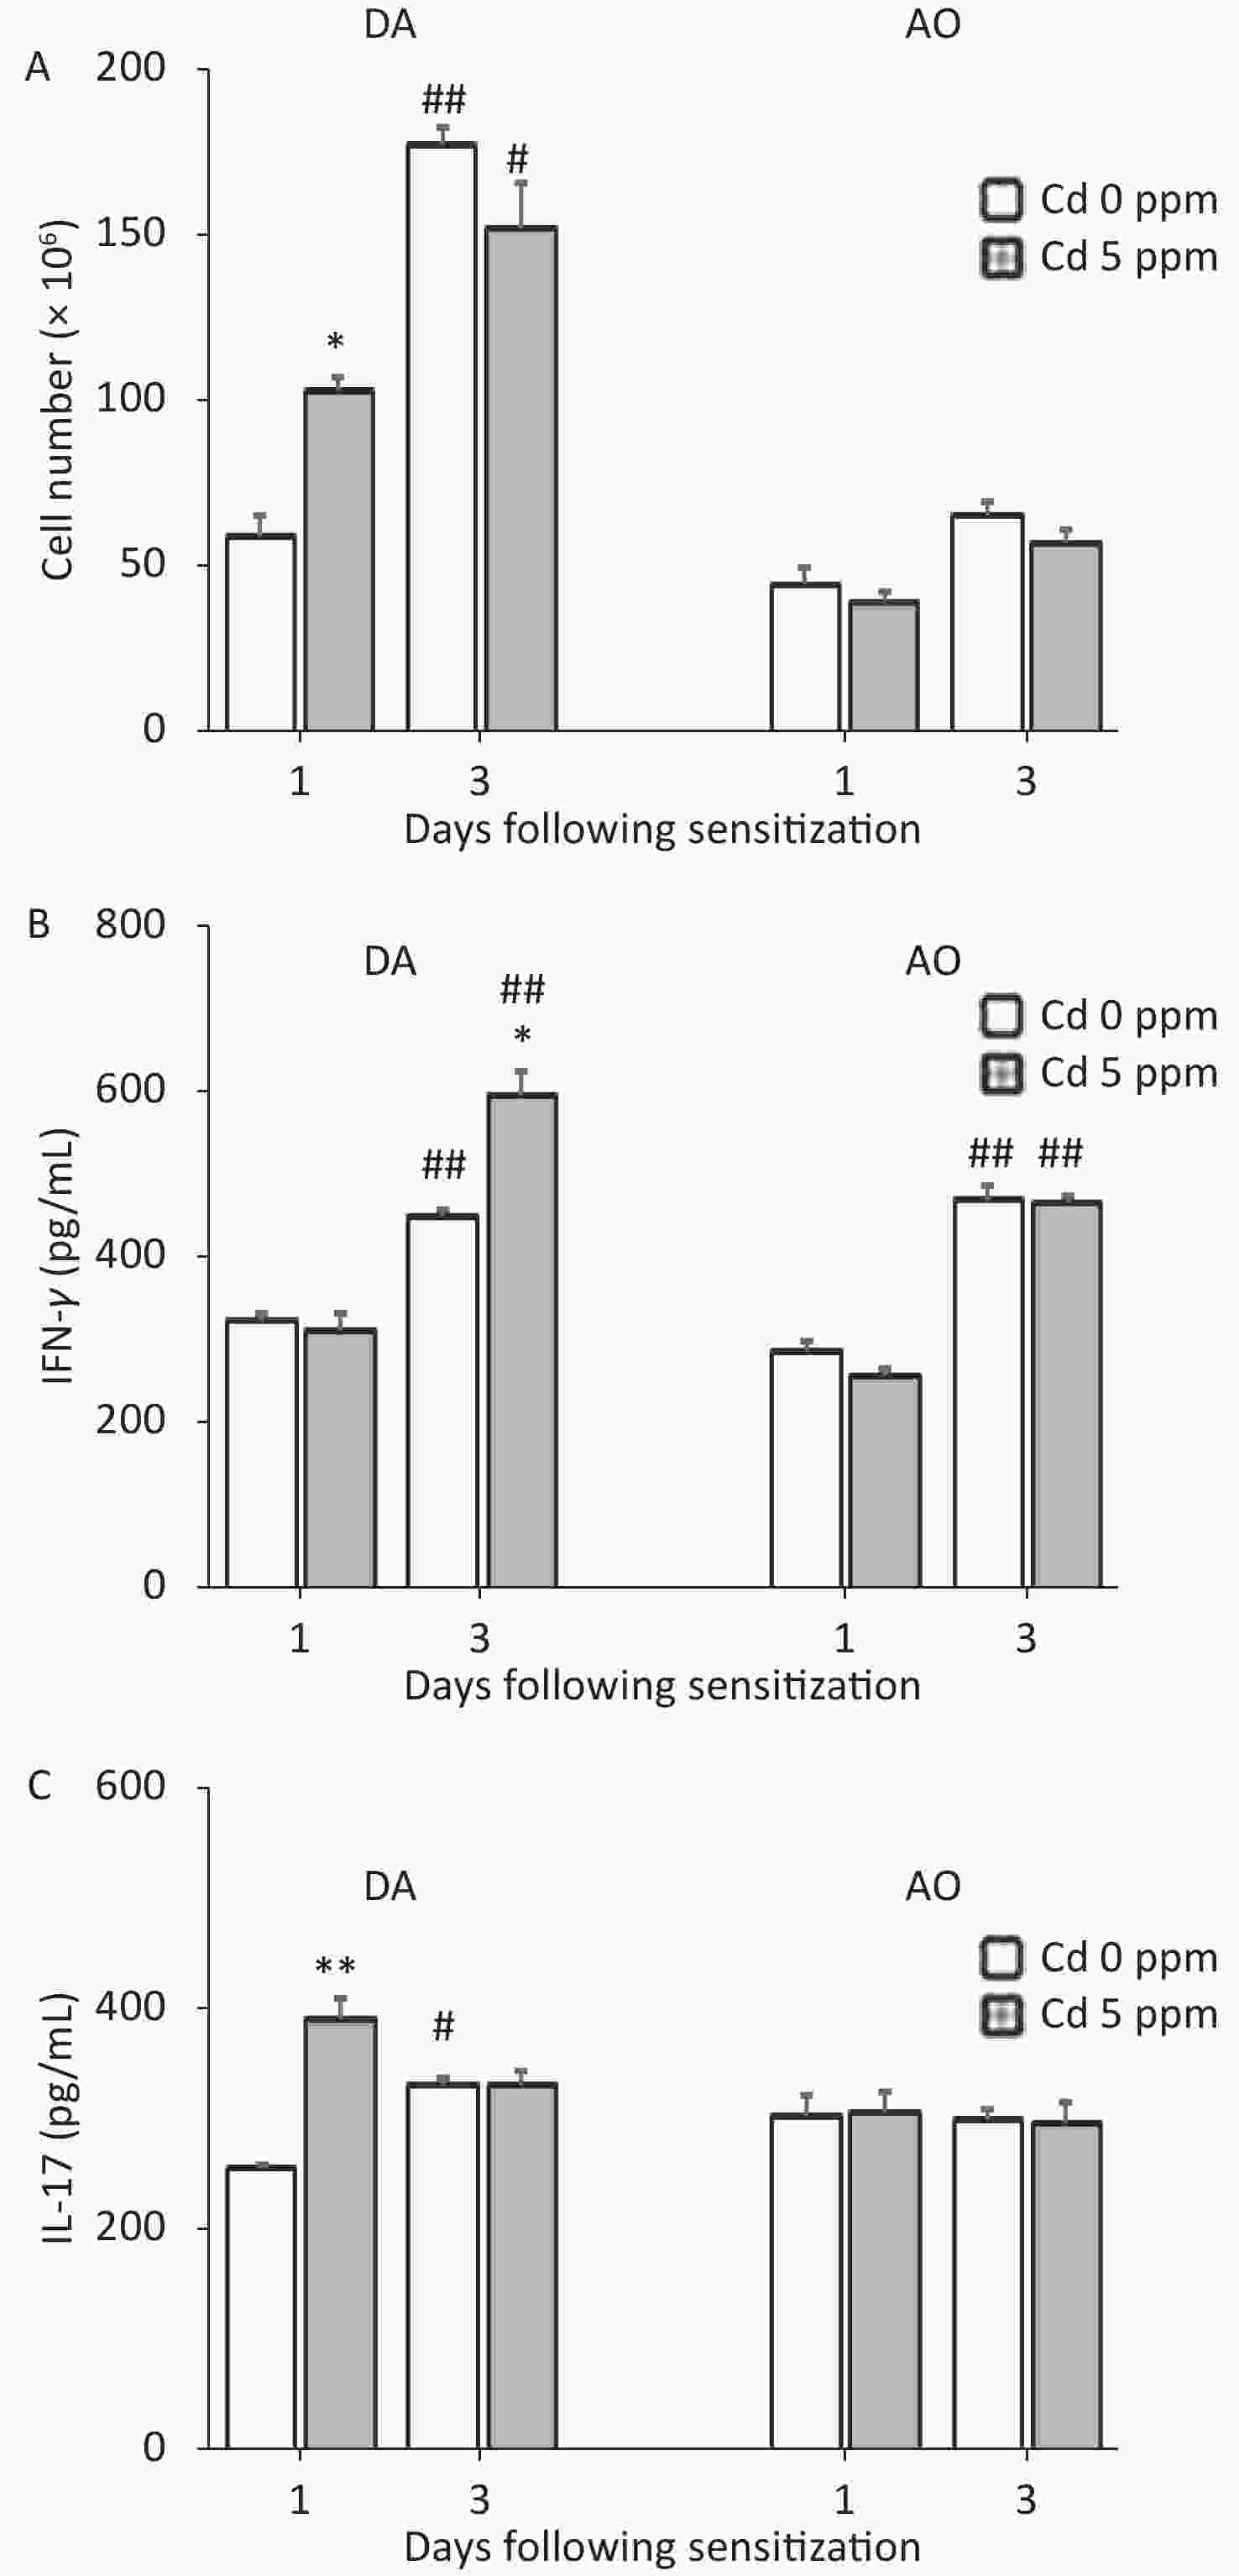
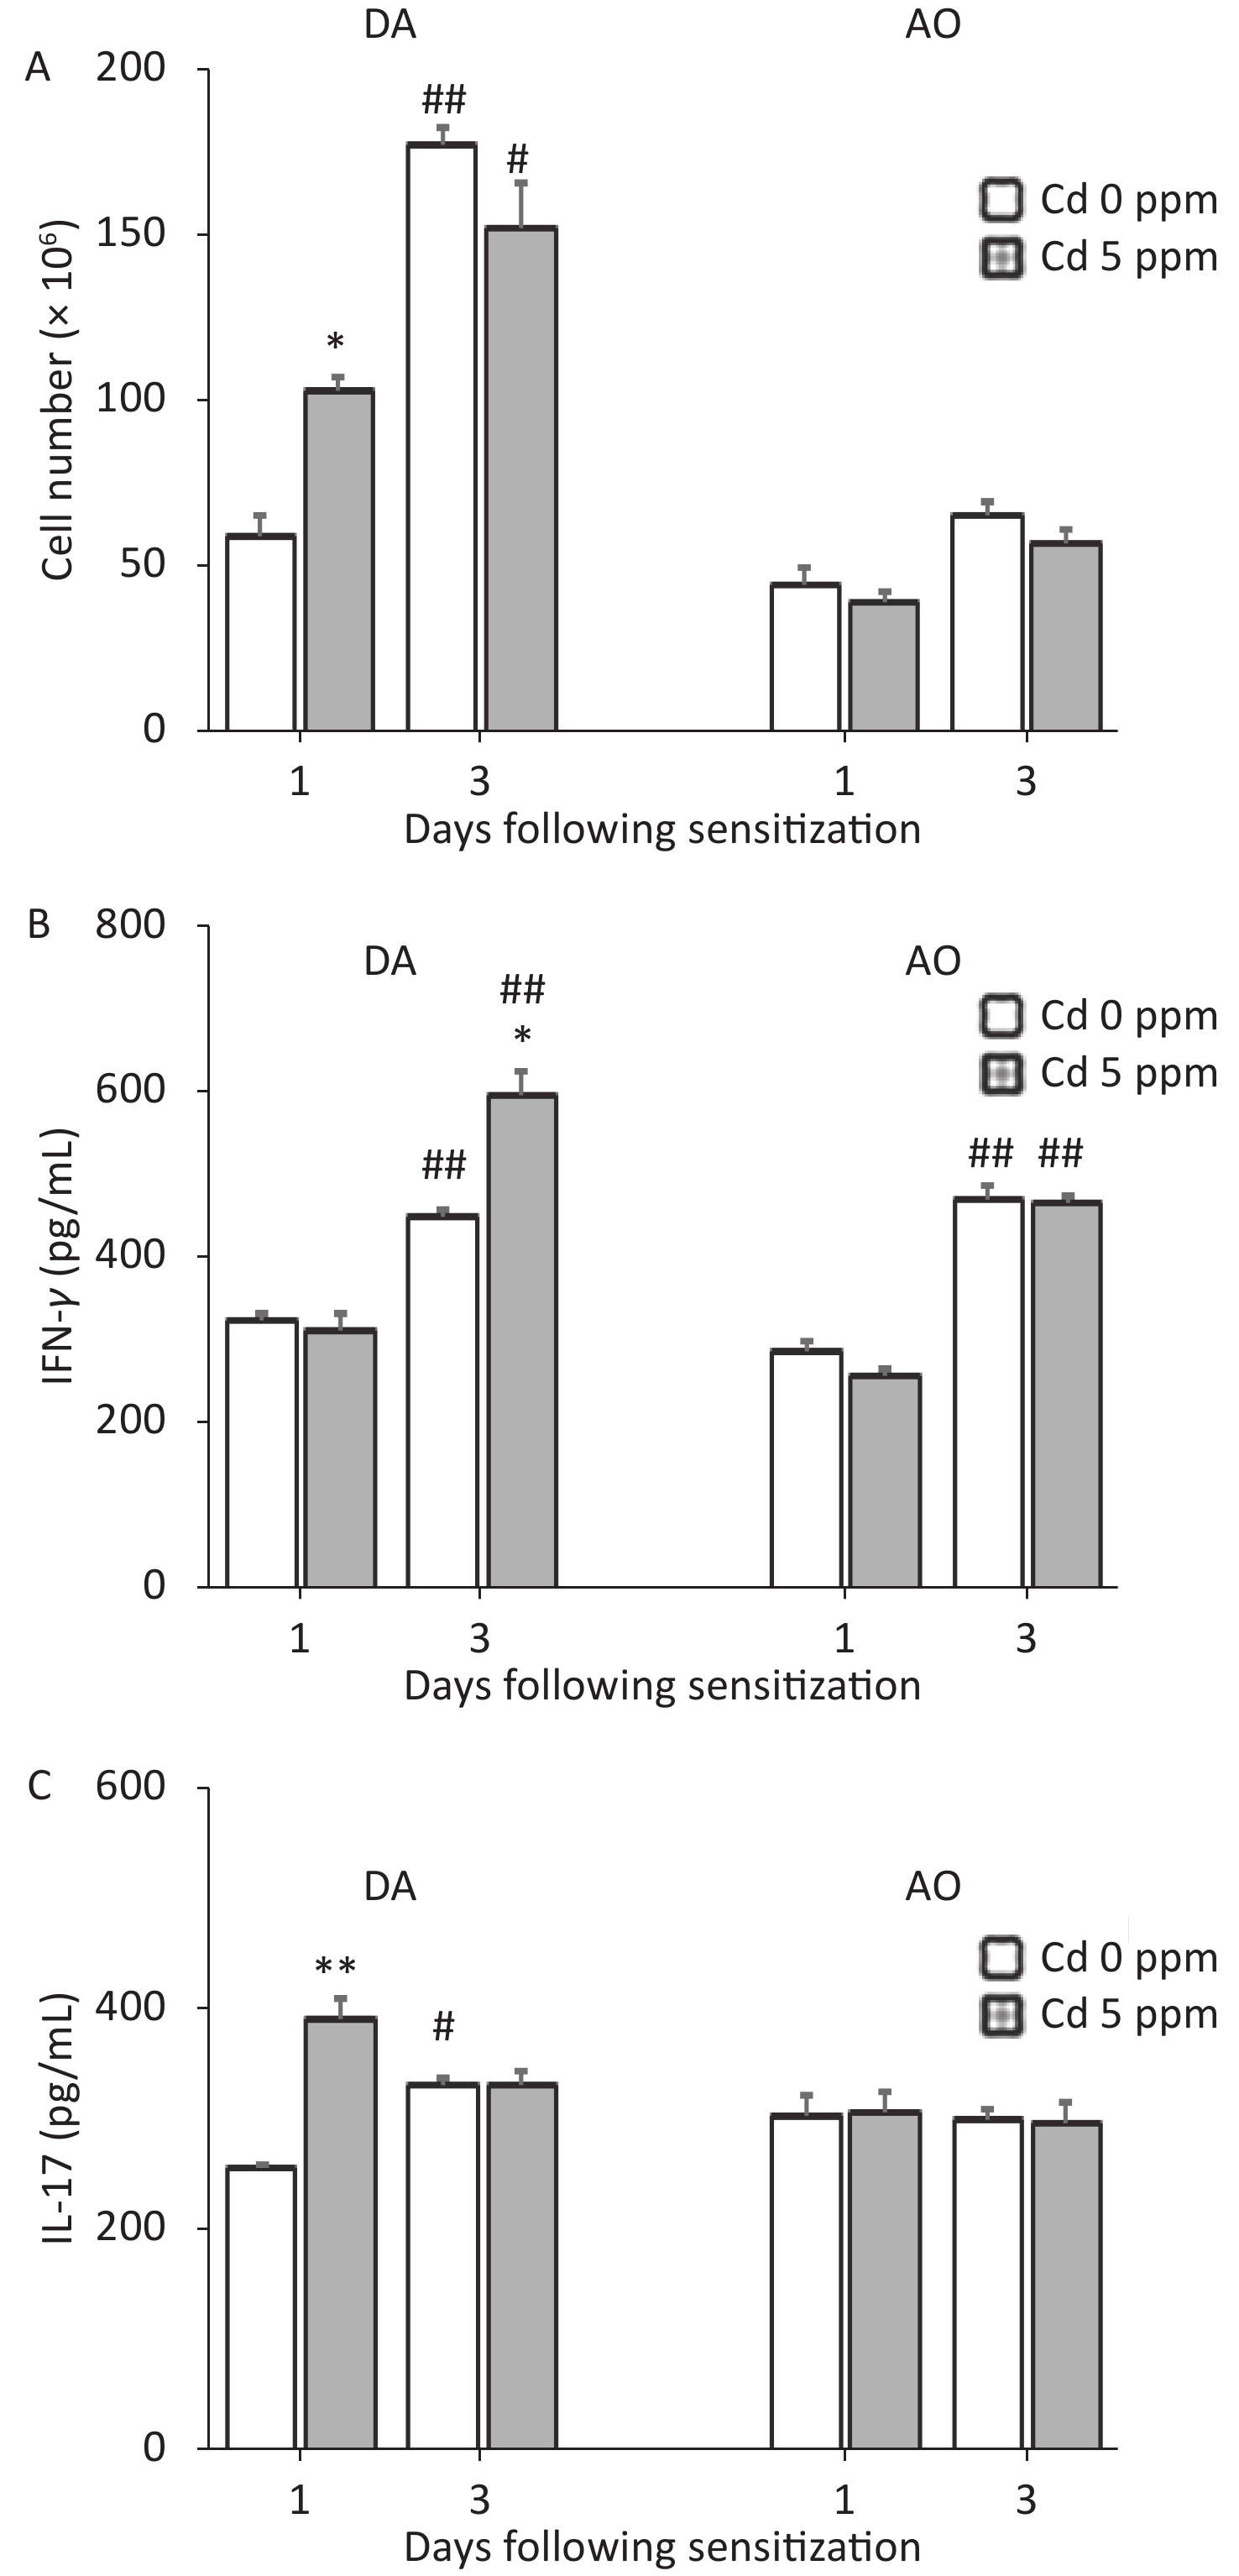
Figure 5. Effects of oral Cd on DLN cell activity during the sensitization phase of CHS. (A) Cell number, and (B) IFN-γ and (C) IL-17 production by DLN cells in DA (n = 10) and AO (n = 8) rats. Results are presented as mean ± SEM. *P < 0.05 and **P < 0.01 vs. control (Cd 0 ppm); #P < 0.05 and ##P < 0.01 vs. day 1 after sensitization (Mann-Whitney U test with Bonferroni correction).
At 1 day after sensitization, greater cellularity of DLNs was observed in DA rats exposed previously to Cd than in Cd-nonexposed animals. In DA rats, 3 days after sensitization, the DLN cellularity was generally higher than that on day 1 after sensitization; however, the number of DLN cells was similar between groups (Figure 5A). In contrast, no differences in DLN cellularity were observed between control and Cd-exposed rats at both time points after sensitization in AO rats (although the values were higher at day 3 than day 1 post sensitization in controls; Figure 5A).
No changes in IFN-γ production by DLN cells were seen on the first day, but the level of this cytokine were greater 3 days after sensitization in the Cd-exposed group than in controls in DA rats, and was generally higher than that on the first day post sensitization (Figure 5B). IL-17 production was higher in DA animals receiving Cd 1 day after sensitization, and were unchanged 3 days after sensitization (although the values were higher than those on day 1 in controls; Figure 5C). No changes in DLN cell production of pro-inflammatory cytokines at either time point after sensitization were observed in AO rats (Figure 5B–C). IFN-γ production was generally higher 3 days after sensitization than 1 day after sensitization in AO rats.
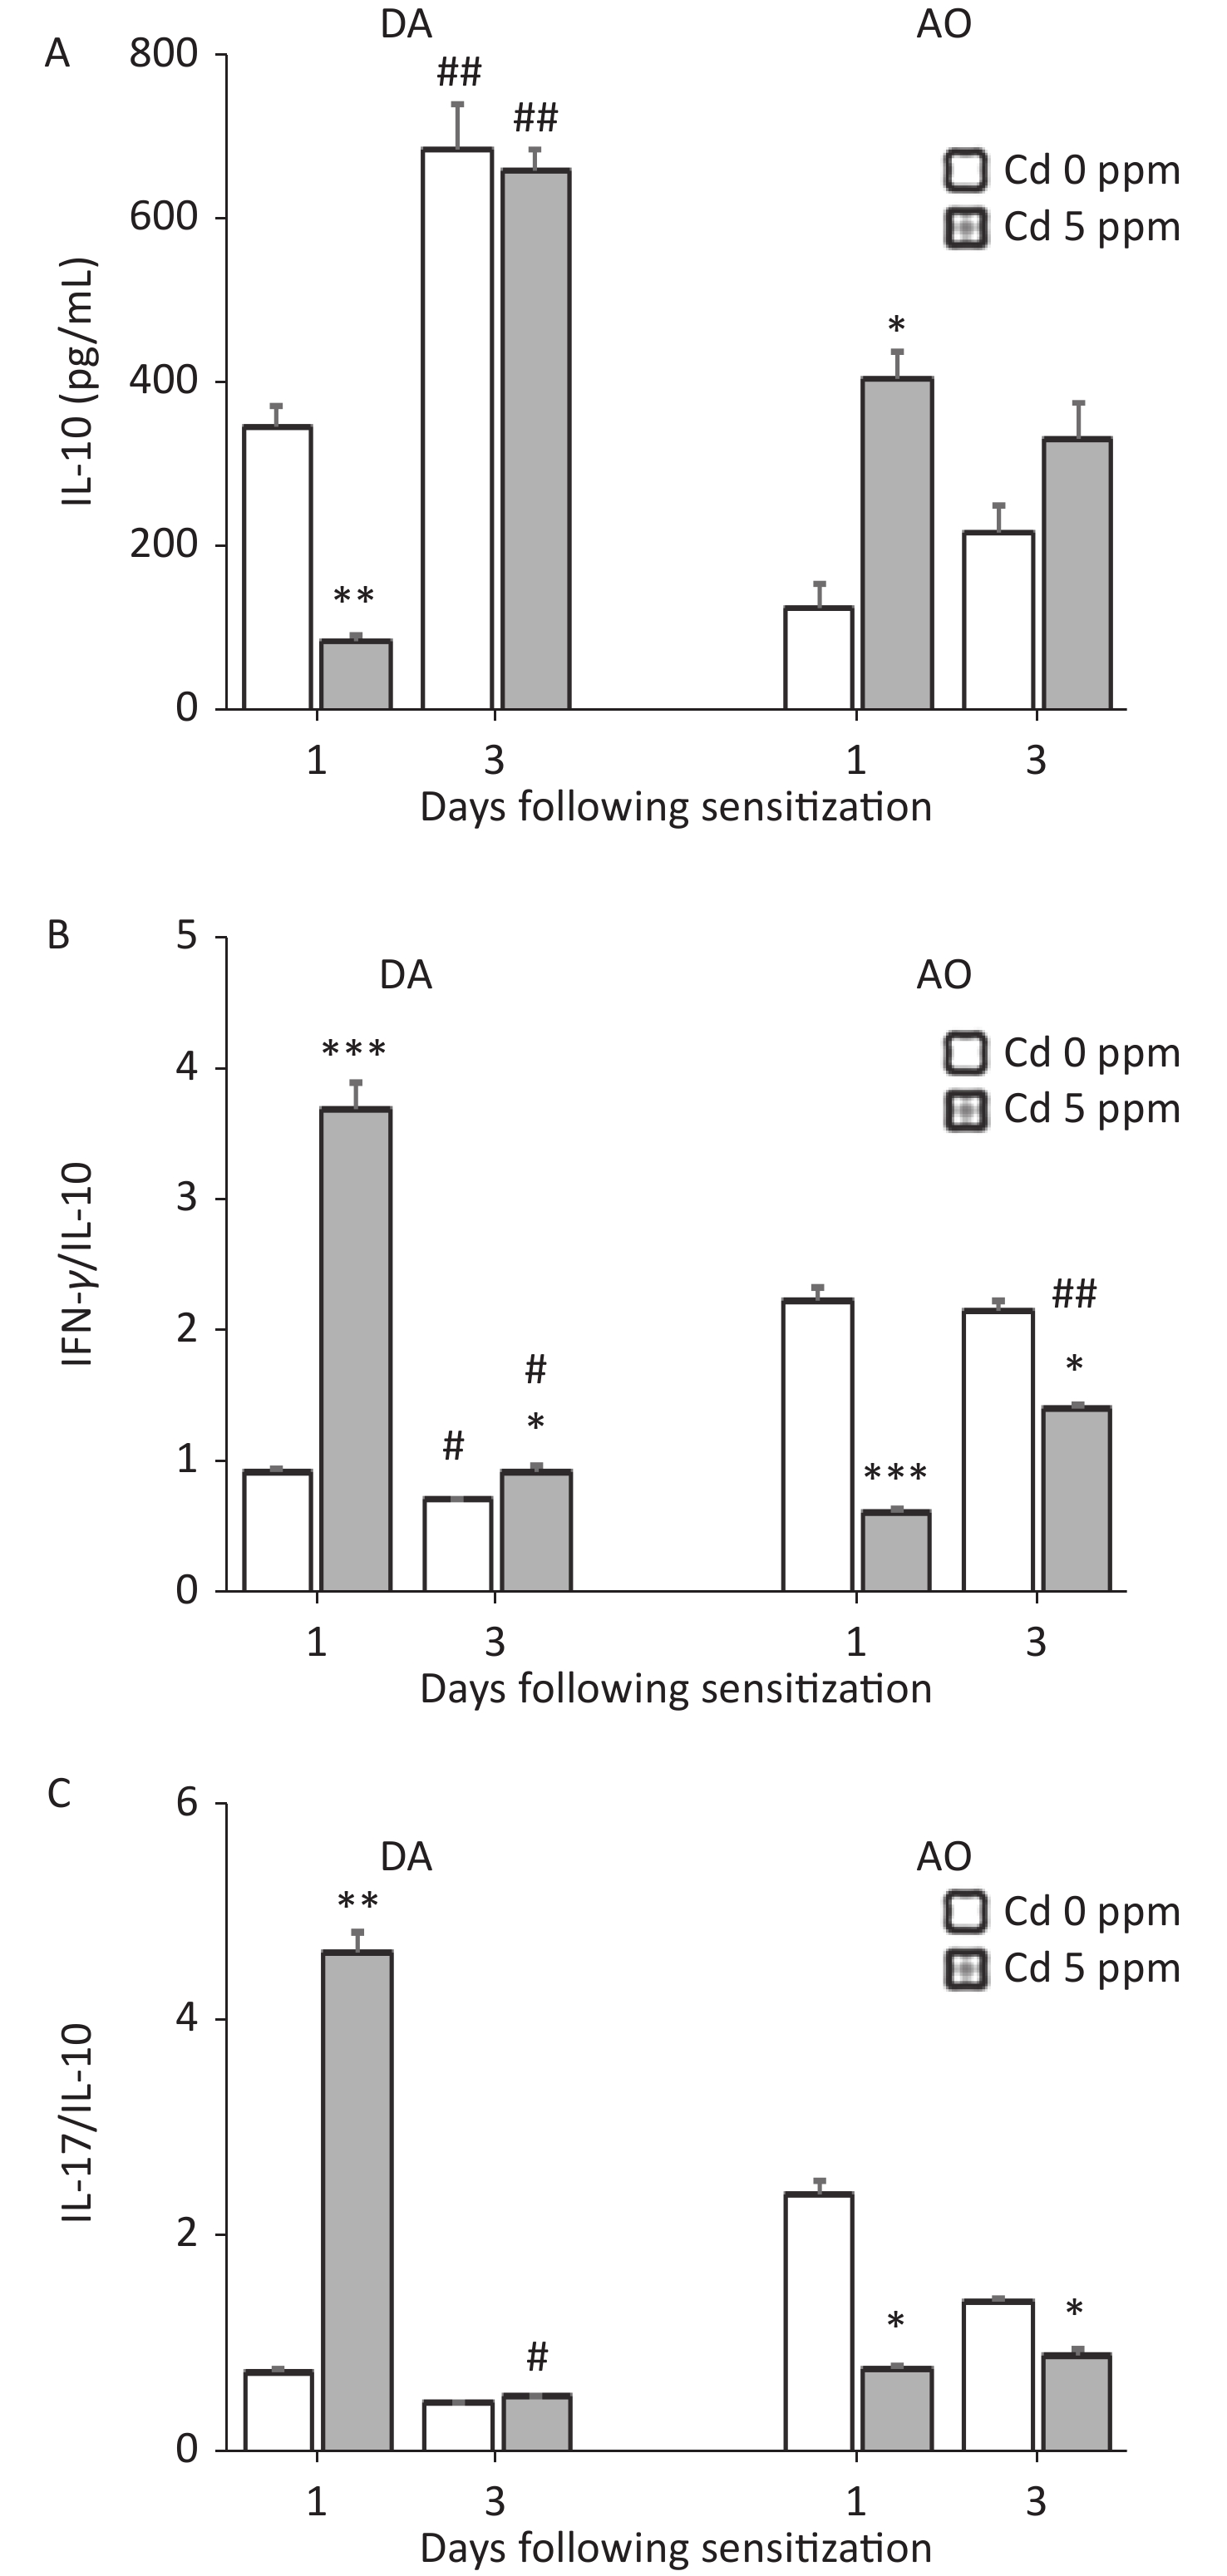
Measurements of the anti-inflammatory/immunoregulatory cytokine IL-10 revealed an inverse pattern of production by DLN cells in two strains 1 day after sensitization (lower in Cd-exposed DA rats and higher in Cd-exposed AO rats than in the respective controls), whereas no differences between groups were observed later in the sensitization phase. Significantly higher IL-10 production was observed on the third day than the first day post sensitization in DA rats (Figure 6A). Calculation of the ratio of pro-inflammatory cytokines to IL-10 indicated significantly higher values for IFN-γ/IL-10 (Figure 6B) and IL-17/IL-10 (Figure 6C) in Cd-exposed than control DA rats 1 day after sensitization, and for IFN-γ/IL-10 3 days after sensitization. The IFN-γ/IL-10 and IL-17/IL-10 ratios were lower in Cd-exposed AO rats than control rats throughout the sensitization phase (Figure 6B–C, respectively).
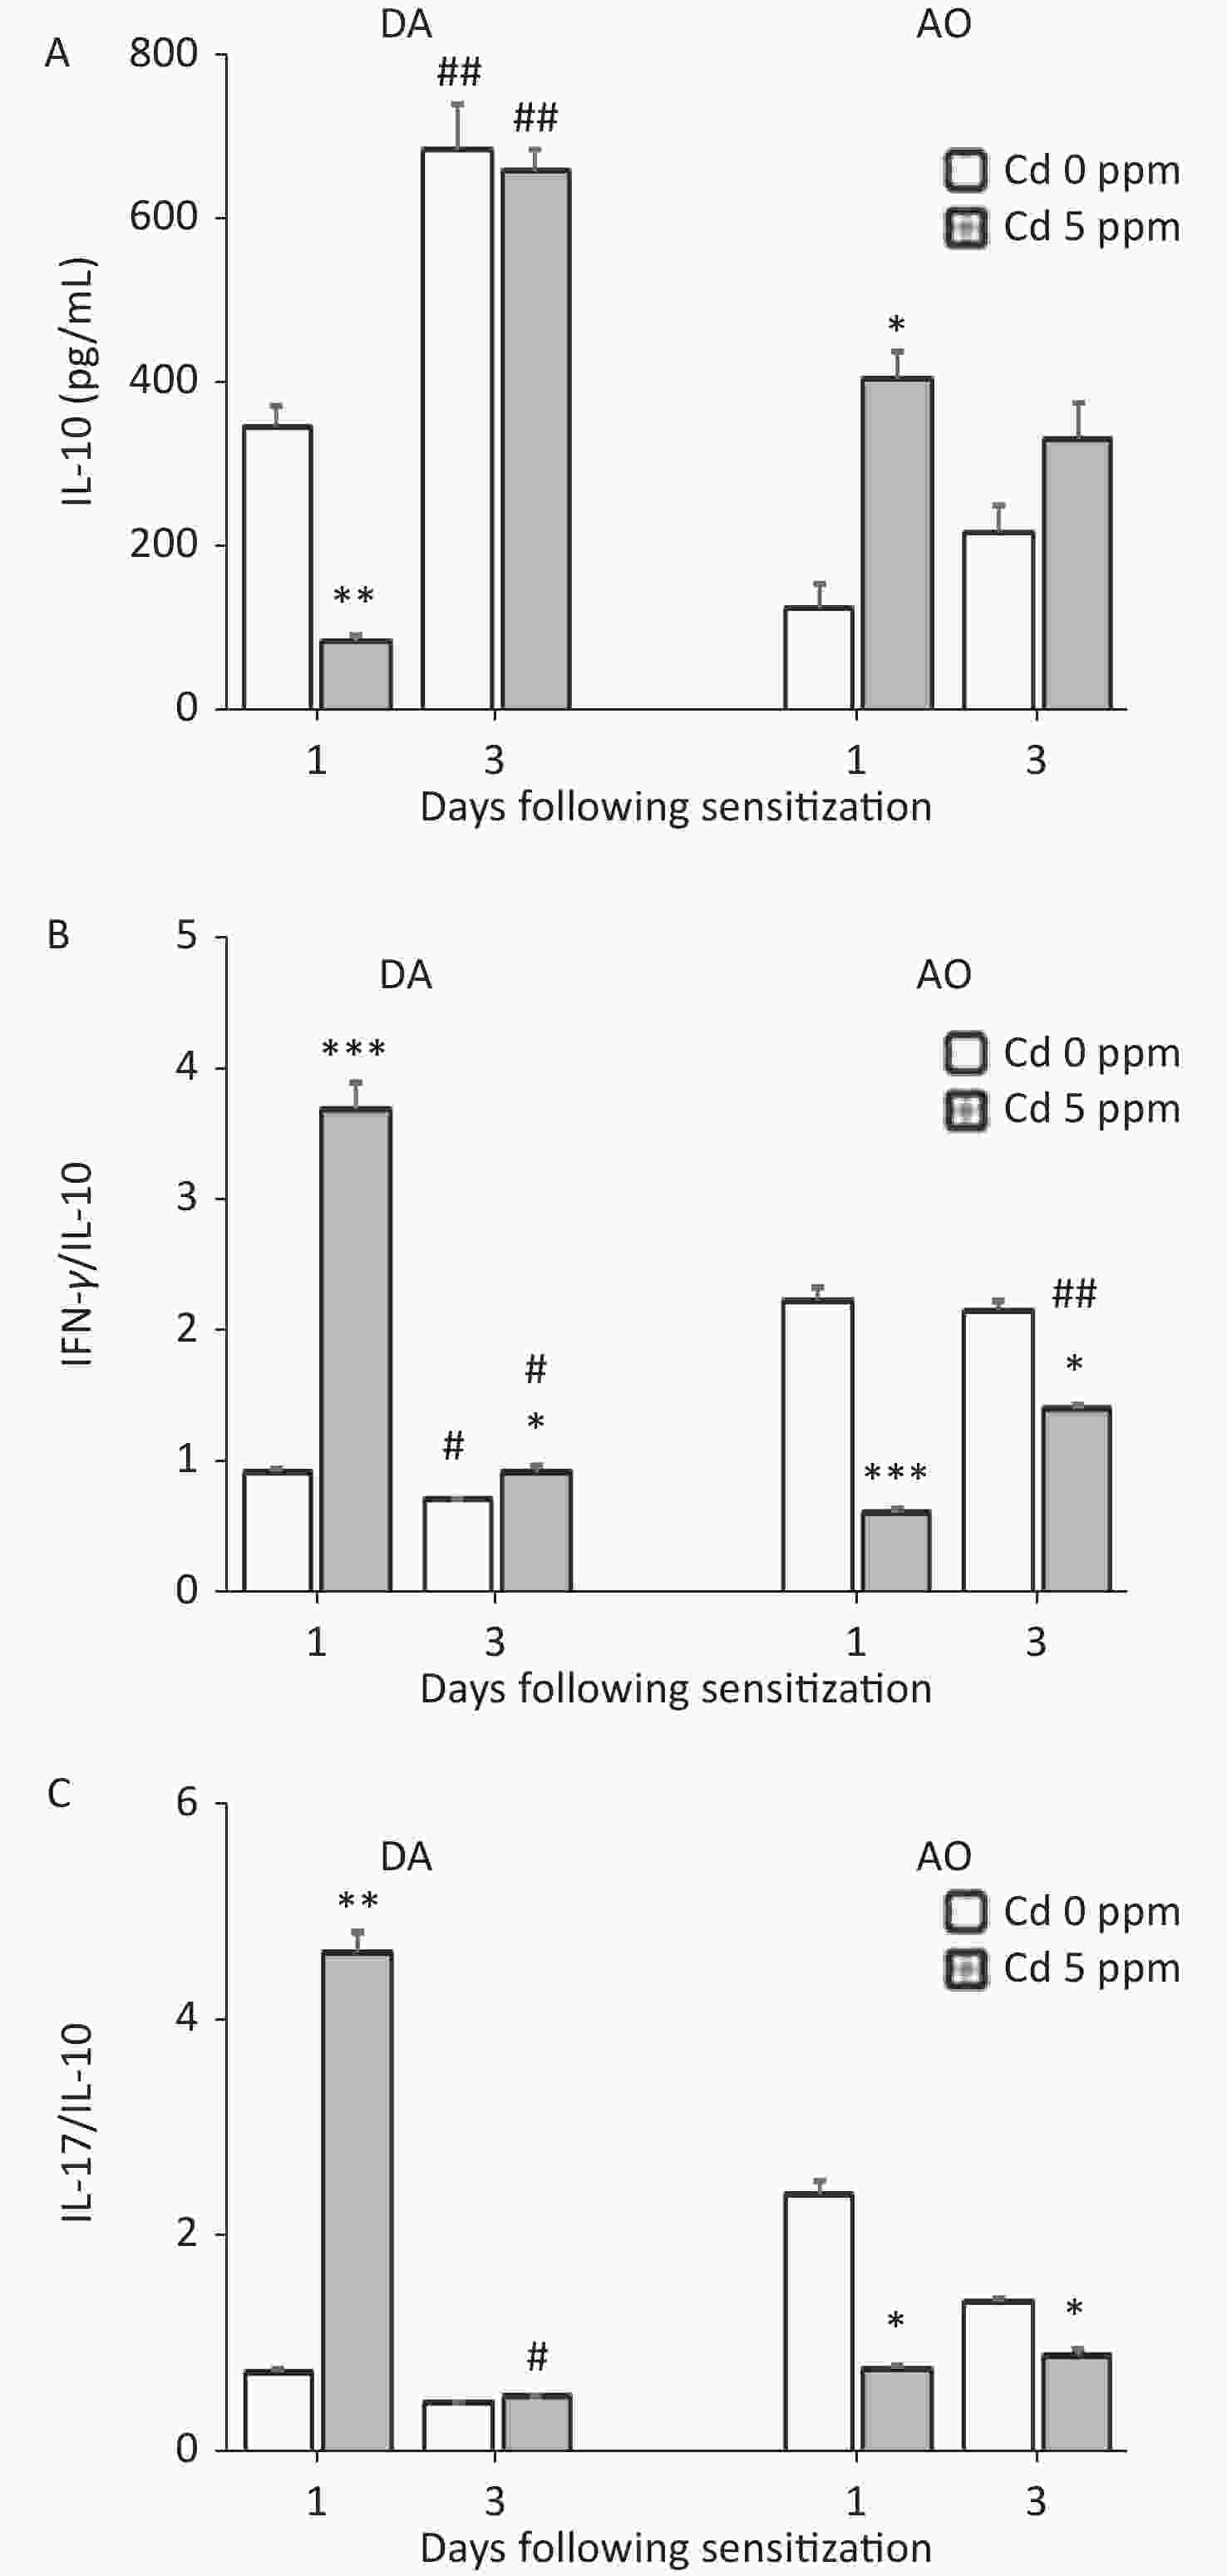
Figure 6. Effects of oral Cd on IL-10 production by DLN cells during the sensitization phase of CHS. (A) IL-10 production by DLN cells in DA (n = 10) and AO (n = 8) rats. The ratio of (B) IFN-γ and IL-10, and (C) IL-17 and IL-10 production by DLN cells. Results are presented as mean ± SEM. *P < 0.05, **P < 0.01 and ***P < 0.001 vs. control (Cd 0 ppm); #P < 0.05, ##P < 0.01 vs. day 1 after sensitization (Mann-Whitney U test with Bonferroni correction).
-
Given the lack of effect of 5 ppm of Cd on the CHS reaction in AO rats, we examined whether skin reactivity might be provoked by a higher Cd dose of 50 ppm (Table 3). Most parameters relevant to ear skin swelling had significantly higher values in the higher Cd dose-exposed group than the control group of the same strain, except for the number of CD8+ cells (although a tendency toward an increased absolute number was observed, P = 0.057) and the IFN-γ production by ear-derived cells. No effect of high Cd dose was observed during the sensitization phase in this strain regarding cell number and pro-inflammatory cytokine production. However, greater production of IL-10 by DLN cells was seen during this phase of CHS reaction in higher Cd dose-exposed AO rats than controls. Consequently, lower ratios of pro-inflammatory cytokines to IL-10 were observed in Cd-exposed AO rats than controls, at both time points during the sensitization phase (Table 4).
Parameters Cd dose (ppm) 0 50 Ear thickness (relative value) 1.00 ± 0.06 2.25 ± 0.31** Ear cells response Cells number (× 106) 1.46 ± 0.08 2.61 ± 0.16** CD8+ cells number, % 1.37 ± 0.16 1.28 ± 0.09 CD8+ cells number (× 104) 2.00 ± 0.22 3.20 ± 0.23 CD4+ cells number, % 1.26 ± 0.01 1.76 ± 0.09* CD4+ cells number (× 104) 1.83 ± 0.01 4.59 ± 0.24* TNF (pg/mL) 53.6 ± 7.80 91.91 ± 11.7* IFN-γ (pg/mL) 268.89 ± 5.70 375.00 ± 25.0 IL-17 (pg/mL) 285.67 ± 22.8 367.75 ± 16.03 Note. Results are presented as mean values ± S.E.M. Significance at: *P < 0.05 and **P < 0.01 vs. control (Cd 0 ppm) (Mann-Whitney U test corrected with the Bonferroni adjustment). Table 3. High Cd dose effect on challenge phase of CHS in AO rats
Parameters One day following sensitization Three days following sensitization Cd (0 ppm) Cd (50 ppm) Cd (0 ppm) Cd (50 ppm) Cell number (× 106) 43.12 ± 5.49 32.08 ± 2.95 63.35 ± 4.77 69.24 ± 3.50# IFN-γ (pg/mL) 284.07 ± 12.29 245.00 ± 6.20 476.67 ± 16.56# 460.67 ± 13.91 IL-17 (pg/mL) 301.95 ± 16.18 311.50 ± 9.82 299.17 ± 8.96 269.17 ± 23.56 IL-10 (pg/mL) 125.67 ± 19.37 435.00 ± 70.99* 218.60 ± 25.37 424.67 ± 9.51* IFN-γ/IL-10 2.24 ± 0.09 0.58 ± 0.02* 2.16 ± 0.08 1.15 ± 0.04*# IL-17/IL-10 2.37 ± 0.13 0.72 ± 0.02* 1.37 ± 0.04 0.70 ± 0.06* Note. Results are presented as mean ± SEM. Significance at: *P < 0.05 vs. control (Cd 0 ppm); #P < 0.05 vs. one day following sensitization (Mann-Whitney U test corrected with the Bonferroni adjustment). Table 4. High Cd dose effect on DLN cells activity during sensitization phase of CHS in AO rats
-
In this study, the effect of oral Cd administration on the skin response to hapten in the contact hypersensitivity reaction was examined. Orally acquired Cd (5 ppm) increased the CHS reaction in DA rats, by affecting cellular responses in both the sensitization and challenge phases. Increased CHS response was observed in AO rats administered a high dose of Cd (50 ppm), during the challenge phase.
An increased pro-inflammatory cytokine response to ear challenge with DNCB in Cd-exposed DA rats accounted for the increased ear swelling. Both cells of the skin and infiltrated leukocytes might have accounted for the TNF production. The pro-inflammatory potential of orally acquired Cd in epidermal cells has been demonstrated in DA rats[28,29] and in innate immune cells[24]. TNF has been identified as a critical mediator of the efferent phase of CHS, because it mediates antigen-nonspecific inflammation induced by hapten, which is necessary for subsequent antigen-specific inflammation[35,44]. TNF is required for the recruitment of leukocytes and neutrophils to the site of challenge[45], thus further attracting antigen-specific effector T cells that produce IFN-γ and IL-17. Greater IFN-γ and IL-17 production by ear cells in Cd-exposed DA animals than Cd-nonexposed animals is an important aspect of the effect of this metal on CHS reaction, because both cytokines are the main effector cytokines that amplify the ear skin inflammation characteristic of CHS response[33,46]. Both CD4+ and CD8+ cells, whose number was increased in the challenged ears of DA animals that consumed Cd, might have contributed to an increased inflammatory response in the ears of this strain, in accordance with studies considering CHS elicitation to be mediated by both CD4+ and CD8+ T cells[44].
Beyond more vigorous skin inflammation at the site of challenge in Cd-exposed DA rats than Cd-nonexposed animals, the increased CHS response might have been be a consequence of the effect of Cd on the sensitization phase in this strain. The importance of DLN cell-derived IFN-γ and IL-17 in the induction of CHS has been demonstrated elsewhere: these two cytokines increase the development of hapten-specific cells and subsequently the CHS reaction after challenge[33,47]. Our previous studies have indicated that skin sensitization with 0.4% DNCB increases the production of IFN-γ and IL-17 by DLN cells in DA rats[48], and the results in the present study showed that Cd further increased production of these inflammatory cytokines throughout the sensitization phase. This effect might have been a consequence of a direct Cd effect. We previously showed that after oral Cd intake (30 days), there is a significant accumulation of Cd in LNs draining the dorsal skin[29], and that these levels are close to those that, in the presence of additional stimuli, favor the differentiation of IFN-γ- and IL-17 producing cells[49,50]. Although Cd alone did not show immune-stimulating potential on DLN cells[29,51], its co-administration with antigen stimulated a DLN response, thus suggesting its costimulatory effect. Because effector T cell generation in DLNs depends on events during the afferent phase (starting from the skin, followed by subsequent skin cell migration to DLN), we speculated that Cd might exert effects on at least on some aspects of the sensitization process. The use of advanced approaches such as high-throughput mass cytometry method (CyTOF)—a comprehensive single-cell analysis that enables the simultaneous measurement of dozens of immune cell types[52–54], and is promising tool for the determination of the phenotypic and functional status of cells with intracellular heavy metals[55]—might aid in obtaining such information. This information is important, in the view of data indicating differential effects (inhibition or stimulation) of Cd on different activities within the same cell type[24,56].
Decreased IL-10 production by DLN cells induced by Cd 1 day after sensitization in DA rats suggested a suppressive effect of Cd on this cytokine’s production. Differential effects of Cd on pro-inflammatory and anti-inflammatory cytokines have been demonstrated[57]. Lower levels of IL-10 production in this strain elicited the inflammatory milieu required for the differentiation of cells that produce effector cytokines in DLNs. This suppression appeared to be overwhelmed 3 days after sensitization, when significantly higher production of IL-10 was detected in response to DNCB application than that on day 1, but was similar in both Cd-exposed and control groups. Both Cd[58] and the sensitization process[48,59] might have accounted for this result. Increased production of IL-10 by DLN cells at day 3, when IFN-γ increased as well, reflected simultaneous activation of both IL-10 and IFN-γ producer cells during sensitization, as shown in murine models of CHS to nitrohalogenated haptens[60], thus probably reflecting a host mechanism to avoid excessive T cell activation induced by haptens.
In AO rats, in contrast to DA rats, a lack of (or negligible) CHS reaction was detected after exposure to 5 ppm of Cd, in line with our previous data showing that AO rats are generally less susceptible to oral Cd toxicity in several tissues[38] including the skin[29]. Lower sensitivity of AO rats to Cd-induced oral dermatotoxicity, is a consequence of increased antioxidant defense in the skin accompanied by the absence of pro-inflammatory response[29], which might have protected the skin against additional insults, at least at lower Cd doses. However, considering that a previous study has shown that a higher Cd dose (50 ppm) induces more pronounced skin damage in AO rats (compared with a lower dose[29]), we next examined whether a higher Cd dose might affect CHS in the AO strain. The higher Cd dose increased the cutaneous pro-inflammatory response to challenge with DNCB even in the AO strain. In contrast to DA rats—in which previous exposure to Cd led to enhanced skin inflammation at the site of hapten challenge and to an increased pro-inflammatory milieu in DLN during the sensitization phase—in Cd-exposed AO rats, ear inflammation evoked by DNCB contributed to an increased CHS response. Our previous studies have shown that skin sensitization with 0.4% DNCB also increases the production of IFN-γ and IL-17 by DLN cells in AO rats[48]; however, in contrast to findings in DA rats, a lack of Cd’s effect on further DLN cell pro-inflammatory response during sensitization was detected in this study. The absence of this Cd effect might be associated with increased IL-10 production by DLN cells in Cd-exposed animals of this strain, because IL-10 is a strong inhibitor of the pro-inflammatory response[61] and CHS reaction[62]. Differential effects of Cd on IL-10 production have been demonstrated[63,64] and may depend on strain differences. In light of those findings, pronounced IL-10 production in the AO strain has been detected in response to Cd[29], and may protect this strain against heightened inflammation[65]. The lack of effects of Cd on DLN cells’ pro-inflammatory cytokine production in AO might be due to the suppression of upstream events during the sensitization phase, given the potential of this metal to inhibit dendritic cell maturation[49]. This possibility deserves future attention. Despite the lack of an effect of Cd on DLN cell sensitization, a higher Cd dose in AO strain primed pro-inflammatory ear cells to respond to DNCB challenge, thus resulting in increased ear swelling. This finding is in line with those from studies showing that the application of nonspecific pro-inflammatory signals before challenge with hapten intensifies the CHS response in sensitized animals[66]. In view of these data, the Cd-induced pro-inflammatory response in the skin might have an adjuvant effect in the skin response to hapten, thus subsequently affecting the response of rare hapten-specific T cells and finally the hypersensitivity reaction. Future studies are necessary to improve understanding of the interaction of Cd with effector and/or regulatory cells in the context of CHS pathology and strain differences. The use of recent advanced techniques for functional analysis of immune cells described above should provide new data.
In conclusion, the presented results show that orally acquired Cd, at doses relevant to human environmental exposure, increase the intensity of the CHS reaction to DNCB in rats. In a broader context, these novel data suggest that Cd, in some settings, e.g., skin inflammatory disease, might aggravate disease.
-
National and/or institutional guidelines for the care and use of animals were followed in this work, as indicated in the section ‘Animals and Cd treatment’ in the methods.
Oral Cadmium Intake Enhances Contact Allergen-induced Skin Reaction in Rats
doi: 10.3967/bes2022.132
Funds:
This study was supported by the Ministry of Education, Science and Technological Development of the Republic of Serbia [451-03-68/2020-14/200007]
- Received Date: 2022-01-18
- Accepted Date: 2022-06-14
Abstract:
| Citation: | Dina Tucovic, Jelena Kulas, Ivana Mirkov, Dusanka Popovic, Lidija Zolotarevski, Marta Despotovic, Milena Kataranovski, Aleksandra Popov Aleksandrov. Oral Cadmium Intake Enhances Contact Allergen-induced Skin Reaction in Rats[J]. Biomedical and Environmental Sciences, 2022, 35(11): 1038-1050. doi: 10.3967/bes2022.132

|

 Quick Links
 DownLoad: