


-
In recent years, the prevalence of type 2 diabetes (T2D) has increased at an alarming rate, and the epidemic of T2D mellitus and its complications poses a major global health threat. Globally, the International Diabetes Federation estimated that 10.5% of adults aged 20–79 years (536 million adults) had diabetes mellitus in 2021. If these trends continue, approximately 783 million people will have diabetes by 2045[1]. T2D is a complex metabolic disease caused by a complex interplay of genetic and environmental risk factors. Obesity, a sedentary lifestyle, and energy-dense diets are the best-known environmental factors associated with T2D. The prevalence of overweight and obesity is high in Chinese, and the number of people with obesity accounts for approximately 46% of the adult population.
Accumulating evidence has demonstrated that low circulating vitamin D levels are associated with an increased risk of developing T2D across diverse populations. The vitamin D receptor (VDR) is a member of nuclear receptor superfamily 1, and it is expressed in many cells and tissues, such as pancreatic β-cells, liver, and adipose tissue. VDR mediates the biological effects of vitamin D, and 1,25-dihydroxyvitamin D depends on VDR to exert its biological effects. Most studies on the association between VDR polymorphism and T2D have focused on six single nucleotide polymorphisms (SNPs): Fok1, Bsm1, Taq1, Apa1, Tru91, and 3’UTR [2]. However, the association of VDR (rs2189480 and rs739837) variants with T2D remains unclear, and the interaction between the loci and obesity on T2D susceptibility has not been explored. Therefore, this case–control study aimed to investigate the relationship between VDR SNPs and T2D and further explore the combined effects of obesity and VDR gene polymorphisms on T2D, which may help in predicting the risk of T2D and identifying individuals at high risk. Furthermore, the study may provide novel strategies for T2D prevention and individualized anti-diabetes treatment.
From July to August 2013 and from July to August 2015, we recruited 2,378 Han Chinese from Wuzhi, Xin’an, and Houzhai County in Henan Province. All participants completed a standard questionnaire (general characteristics, lifestyle, medical history, and family history of disease), body measurements, and fasting blood collection. T2D was defined as fasting serum glucose ≥ 7.0 mmol/L and/or taking hypoglycemic medication and/or having a self-reported T2D history [3]. Individuals with a self-reported history of gestational diabetes or other types of diabetes, coronary heart disease, chronic kidney diseases, cancer, or failed DNA extraction were excluded from the study. We performed a 1:2 ratio case–control match by sex and age (within 3 years); finally, a total of 397 T2D and 794 non-T2D cases were included in our study.
All participants provided informed consent before the examination, and the study was approved by the Medical Ethics Committee of Zhengzhou University.
For each participant, height, weight, waist circumference (WC), and hip circumference were measured twice to the nearest 0.5 kg and 0.1 cm, and the body mass index (BMI) was calculated in kg/m2. All participants were asked to assemble on time after an overnight fast (> 10 h) for blood sample collection. Oral antidiabetic drugs, insulin, and alcohol should have been avoided for at least 12 h before blood collection. Blood samples were used for the DNA isolation and measurements of glucose, lipid profile, and serum 25-hydroxyvitamin D [25(OH)D] concentrations. 25(OH)D levels were measured by human enzyme-linked immunosorbent assay kits (Sangon Biotech, Shanghai, China). The levels of fasting plasma glucose (FPG), triglyceride (TG), total cholesterol (TC), high-density lipoprotein cholesterol (HDL-C), low-density lipoprotein cholesterol (LDL-C), and fasting insulin (FINS) were measured by an automatic biochemical analyzer (KHB, Shanghai, China). The Homeostasis Model Assessment Insulin Resistance (HOMA-IR) was applied as a measure of the degree of insulin resistance [HOMA-IR = FPG (mmol/L) × FINS (mIU/L)/22.5]. Genomic DNA was isolated from the peripheral blood following the standard procedures of the DNA extraction kit (Bioteke, Beijing, China). The TaqMan probe method and real-time polymerase chain reaction technology were used to identify the rs2189480 and rs739837 genotypes.
Non-normally distributed variables were shown as median values with interquartile range, and categorical variables were described with frequencies and percentages. The distribution of participants’ characteristics between the case and control groups was compared using the nonparametric Wilcoxon rank-sum test or Chi-square test. Multivariate logistic regression was used to examine the relationship between VDR SNPs and T2D, and odds ratio (OR) and corresponding 95% confidence interval (CI) were calculated after adjustment for smoking, alcohol consumption, physical activity, 25(OH)D, and diabetes family history, assuming codominant, recessive, and dominant models of inheritance. Multivariable linear regression was performed to explore the association of BMI and WC with blood glucose-related parameters, including FPG, hemoglobin A1c, HOMA-IR, and HOMA-β. Multiple logistic regression analysis was used to examine the interaction between VDR SNPs and obesity on T2D risk according to the genotype of each SNP (under the recessive or dominant genotype model) and obesity exposure status. Multiplicative interactions were evaluated using a multiplicative model based on generalized linear regression, with FPG as the dependent variable. Covariance analysis was used to explore the influence of VDR variations on cardiovascular metabolic indicators. Unless otherwise stated, statistical analyses were performed using SAS v.9.1 (SAS Institute, Cary, NC, USA), and the significance level was set at P < 0.05.
Results of the comparisons of the basic characteristics of the two groups are presented in Supplementary Table S1 (available in www.besjournal.com). A total of 1,191 individuals (397 T2D cases/794 controls) were included in this case–control study, and male and female participants accounted for 39.3% and 61.6%, respectively. Compared with the control group, patients with T2D had higher levels of FPG, FINS, HOMA-IR, TC, TG, and LDL-C but lower levels of HOMA-β and HDL-C (P < 0.05). As expected, patients with T2D had significantly higher BMI and WC than controls, respectively (P < 0.05).
Characteristics T2D (n = 397) Control (n = 794) χ2/Z P Male 156 (39.3%) 312 (39.3%) 0 1.000 Age (years) 60 (52.5−67.5) 60.5 (51.00−67.00) −0.02 0.982 Smoking 295 (25.7%) 576 (27.5%) 0.42 0.518 Alcohol drinking 50 (12.6%) 98 (12.3%) 0.02 0.901 Physical activity 15.40 < 0.001 Low 193 (39.2%) 311(48.7%) Moderate 76 (17.0%) 135 (19.2%) High 127 (43.8%) 347 (32.1%) Family history of T2D 71 (17.9%) 56 (7.1%) 32.59 < 0.001 BMI (kg/m2) 26.33 (23.98−28.70) 24.80 (22.30−27.20) −6.28 < 0.001 WC (cm) 91.25 (84.13−97.50) 86.00 (78.00−93.50) −7.76 < 0.001 FPG (mmHg) 8.46 (6.84−10.94) 4.98 (4.52−5.42) −23.77 < 0.001 FINS (mIU/L) 13.25 (9.55−18.97) 11.04 (8.65−13.77) −6.68 < 0.001 HOMA-β 54.61 (29.81−96.93) 153.57 (110.26−217.01) −19.14 < 0.001 HOMA-IR 5.02 (3.29−7.80) 2.42 (1.80−3.23) −17.76 < 0.001 TC (mmol/L) 4.61 (4.06−5.29) 4.51 (3.94−5.16) −2.21 0.027 TG (mmol/L) 1.81 (1.19−2.80) 1.36 (0.90−2.04) −7.12 < 0.001 HDL-C (mmol/L) 1.13 (0.96−1.34) 1.18 (0.99−1.39) −2.66 0.008 LDL-C (mmol/L) 2.63 (2.19−3.17) 2.53 (2.02−3.09) −2.47 0.014 25(OH)D3 (ng/mL) 19.1 (15.02−27.21) 19.36 (15.5−24.5) −0.52 0.601 Note. Data are given as number (%) or median (interquartile range). Age refers to the age at which the participants were enrolled in the study. Physical activity was divided into three categories (low, moderate, and high) according to the International Physical Activity Questionnaire. BMI, body mass index; WC, waist circumference; FPG, fasting plasma glucose; FINS, fasting insulin; HOMA-β, Homeostasis Model Assessment-β [HOMA-β (%) = 20 × FINS (mIU/L) / (FPG (mmol/L) − 3.5)]; HOMA-IR, Homeostasis Model Assessment Insulin Resistance [HOMA-IR = FPG (mmol/L) × FINS (mIU/L) / 22.5]; TC, total cholesterol; TG, triglyceride; HDL-C, high-density lipoprotein cholesterol; LDL-C, low-density lipoprotein cholesterol. P-value > alpha (0.05) means not statistically significant. Table S1. Basic characteristics of study participants
At present, the results of studies on the association between VDR polymorphism and chronic diseases are still contradictory. Our study explored the association between two loci (rs2189480 and rs739837) and T2D risk through multiple logistic regression analysis (Table 1). The genotypic distributions of the two SNPs did not deviate from the Hardy–Weinberg equilibrium (P > 0.05). Multiple logistic regression analysis showed that participants with the “AA” genotype of rs2189480 were significantly less likely to develop T2D than those with the “GA+GG” genotype (P = 0.036, OR = 1.30, 95% CI 1.02–1.66). The rs2189480 locus is one of the VDR SNPs located in the intron and consists of a G-A change. Studies have shown that rs2189480 affects regulatory T cell function and T cells help regulate inflammatory activity [4]. Therefore, the rs2189480 mutation may have a protective effect on T2D by regulating the inflammatory response. Studies have reported the effect of rs739837 variants on diabetes, but no unanimous conclusions have been drawn, and the role of the rs739837 locus is still unclear. Our study results showed that carrying “CC+GC” of rs739837 rather than “GG” was significantly associated with an increased hazard of developing T2D (P = 0.028, OR = 1.32, 95% CI 1.03–1.70). The rs739837 is located in the 3’UTR of the VDR gene, which contains many regulatory elements that influence its post-transcriptional regulation. A study showed that variations in rs739837 may influence the stability of VDR mRNA and its gene transcription and further increase the risk of diabetes [5].
SNP T2D Control χ2 P OR (95% CI)a P HWE rs2189480 4.155 0.125 0.76 GG 182 (46.08%) 327 (42.69%) 1 GA 177 (44.26%) 339 (44.26%) 0.90 (0.69–1.18) 0.459 AA 36 (9.11%) 100 (13.05%) 0.60 (0.38–0.94) 0.026 AA/GA+GG 0.63 (0.41–0.97) 0.036 AA+GA/GG 0.84 (0.65–1.09) 0.180 rs739837 3.773 0.152 0.77 GG 202 (50.88%) 432 (56.18%) 1 GC 161 (40.56%) 288 (37.45%) 1.26 (0.96–1.66) 0.095 CC 34 (8.56%) 49 (6.37%) 1.42 (0.86–2.32) 0.170 CC/GC+GG 1.28 (0.79–2.08) 0.308 CC+GC/GG 1.32 (1.03–1.70) 0.028 Note. aAdjusted for age, smoking, alcohol drinking, exercise, level of 25(OH)D, and family history of T2D. CI, confidence interval; HWE, Hardy–Weinberg equilibrium; SNP, single nucleotide polymorphism; OR, odds ratio; T2D, type 2 diabetes; VDR, vitamin D receptor. P-value > alpha (0.05) means not significant. Table 1. Genotypic distribution of VDR polymorphisms and the association of VDR polymorphisms with T2D risk
Obesity is believed to be a promoter of T2D. Obesity is strongly associated with the development of insulin resistance, which in turn plays a key role in the pathogenesis of obesity-associated cardiometabolic complications, including metabolic syndrome components, T2D, and cardiovascular diseases. Our study investigated the association between BMI/WC and T2D in the rural Chinese population (Supplementary Table S2, available in www.besjournal.com) and the influence of BMI/WC and blood glucose-related parameters (Supplementary Table S3, available in www.besjournal.com). The results showed that higher BMI or WC was significantly associated with an increased risk of T2D in Chinese rural populations. Moreover, after multivariable adjustment, we found that for each increase in BMI of 1 kg/m2, the level of FINS and HOMA-IR increased by 0.49 mIU/L and 0.19 (P < 0.05), respectively. For each increase in WC of 1 cm, the level of FPG, FINS, and HOMA-IR increased by 0.017 mmHg, 0.49 mIU/L, and 0.19 (P < 0.05), respectively.
Continuous Model 1 Model 2 BMI Continuous T1 (< 23.7 kg/m2) 1 1 T2 (23.7−26.8 kg/m2) 1.68 (1.22−2.31) * 1.35 (0.97−1.89) T3 (≥ 26.8 kg/m2) 2.52 (1.84−3.43) * 1.88 (1.35−2.63) * P-trend < 0.001 0.003 WC Continuous T1 (< 82.5 cm) 1 1 T2 (82.5−92.5 cm) 2.15 (1.56−2.97) * 1.87 (1.34−2.61) * T3 (≥ 92.5 cm) 2.94 (2.13−4.04) * 2.22 (1.58−3.14) * P-trend < 0.001 < 0.001 Note. Model 1: Adjusted for age, sex, smoking, alcohol drinking, exercise, family history of T2D; Model 2: Adjusted for age, sex, smoking, alcohol drinking, exercise, family history of T2D, SBP, DBP, TC, TG, HDL-C, LDL-C. BMI, body mass index; WC, waist circumference *P < 0.05. P-value > alpha (0.05) means not statistically significant. Table S2. Association of BMI and WC levels with the risk of T2D
Outcomes BMI WC Model 1 Model 2 Model 1 Model 2 FPG 0.076 (0.032−0.119)* 0.010 (−0.035−0.055) 0.040 (0.025−0.054)* 0.017 (0.002−0.032)* FINS 0.592 (0.479−0.706)* 0.493 (0.367−0.619)* 0.233 (0.194−0.271)* 0.202 (0.159−0.245)* HOMA-IR 0.249 (0.198−0.299)* 0.186 (0.132−0.241)* 0.100 (0.084−0.117)* 0.080 (0.062−0.098)* HOMA-β 3.183 (−11.166−17.531) 2.837 (−13.628−19.301) 0.671 (−4.246−5.587) 0.690 (−4.946−6.326) Note. Model 1: Adjusted for age, sex, smoking, alcohol drinking, exercise, family history of T2D; Model 2: Adjusted for age, sex, smoking, alcohol drinking, exercise, family history of T2D, SBP, DBP, TC, TG, HDL-C, LDL-C. BMI, body mass index; WC, waist circumference; FPG, fasting plasma glucose; FINS, fasting insulin; HOMA-IR, Homeostasis Model Assessment Insulin Resistance [HOMA-IR = FPG (mmol/L) × FINS (mIU/L) / 22.5]; HOMA-β, Homeostasis Model Assessment-β [HOMA-β (%) = 20 × FINS (mIU/L) / (FPG (mmol/L) − 3.5)]; *P < 0.05. P-value > alpha (0.05) means not statistically significant. Table S3. Associations (β, 95% CI) of BMI and WC with blood glucose related parameters
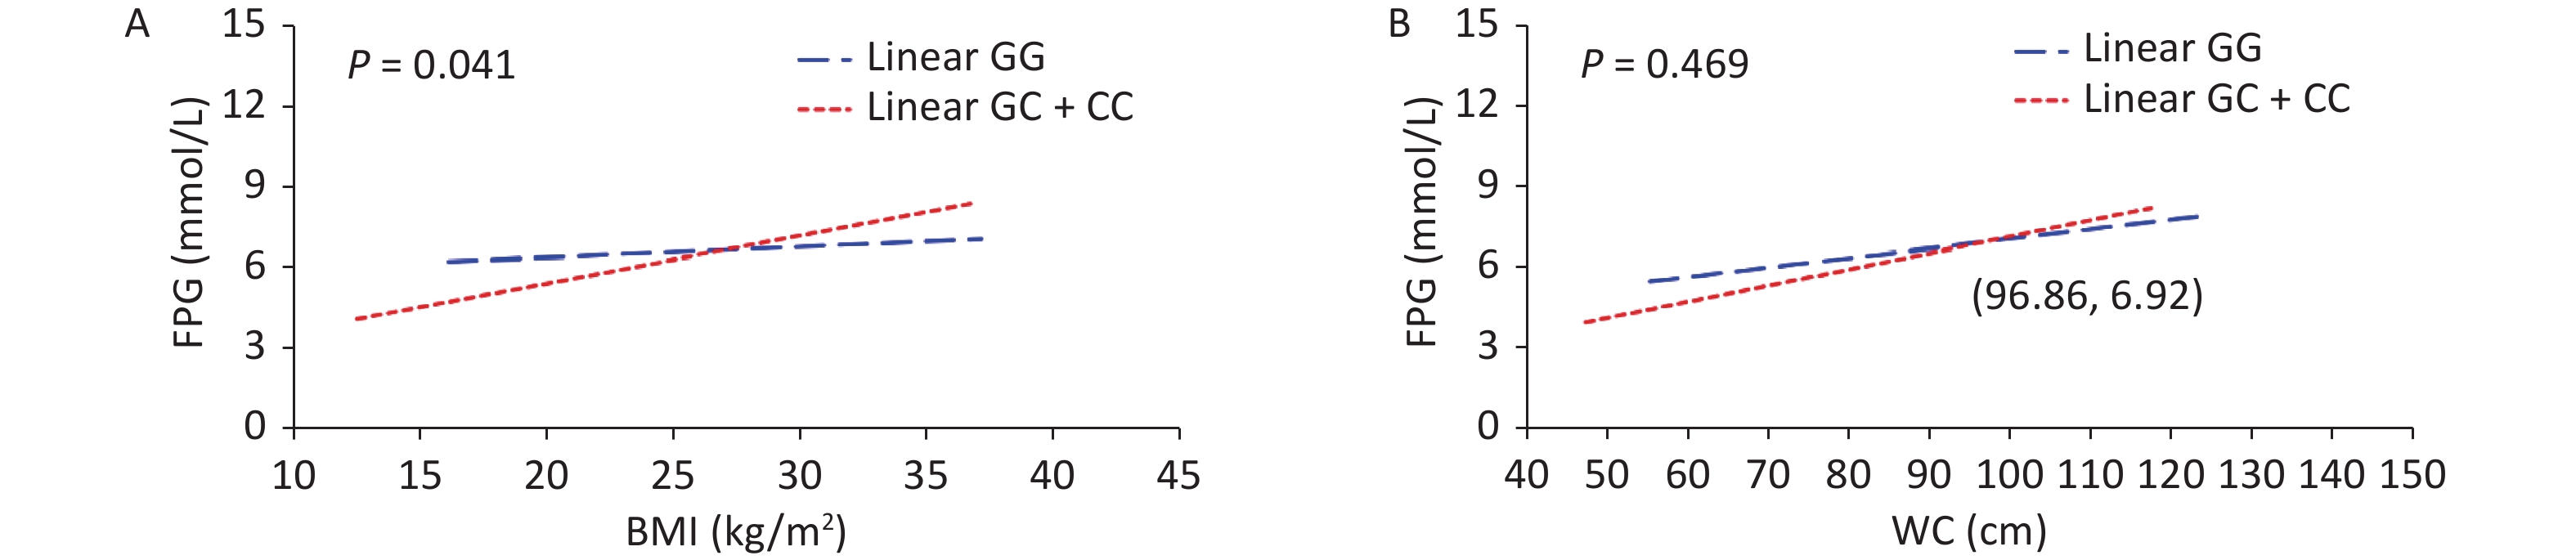
To assess the interaction between obesity status and SNPs of the VDR gene on T2D, the participants were divided into four subgroups by genetic models of SNPs and obesity status (Table 2). An interaction between VDR variants and obesity on T2D risk has been found (Pinteraction = 0.029). Compared with non-obese individuals carrying rs739837 “GG” genotype, those with overweight/obesity carrying the “CC” or “GC” genotype had a higher risk of developing T2D (OR = 3.06, 95% CI 2.04–4.61). Further, the results of the generalized linear model showed a significant interaction between rs739837 and BMI (P = 0.041). At higher BMI (> 26.96 kg/m2), rs739837 “C” allele carriers had higher FPG levels and showed a stronger effect than individuals with the “GG” genotype (Figure 1). VDR is expressed in pancreatic β cells, and alleles of VDR regulate β-cell function. Human and animal studies have shown that disruption of the VDR signaling pathway can affect insulin secretion and decrease insulin mRNA levels [6, 7]. The ability of fat cells to store fat is gradually reduced with obesity, and fat is stored in places such as visceral tissue, which adversely affects insulin signaling. The VDR gene mutation and obesity may have an interactive effect on T2D risk by affecting insulin secretion. Meanwhile, our results found that subjects carrying "GC" or "CC "of rs739837 had higher fasting insulin levels than "GG" carriers, suggesting that mutations in the VDR gene may affect the insulin signaling pathway and lead to insulin resistance in the subjects (Supplementary Table S4, available in www.besjournal.com). On the contrary, studies have reported that VDR is expressed in adipose tissue and dynamically upregulated during adipocyte differentiation [8]. The T allele of TaqI loci was associated with a higher risk of obesity in Greek individuals (contributing to an elevated BMI of 3 kg/m2 per risk allele) [9]. VDR plays a key role in fat formation by affecting vitamin D levels. Meanwhile, the expression of VDR mRNA also changes during adipocyte differentiation [10]. Therefore, we speculate that the interaction between VDR gene variation and adipocyte differentiation and metabolism may contribute to the risk of T2D. However, the specific mechanism of interaction needs further study.
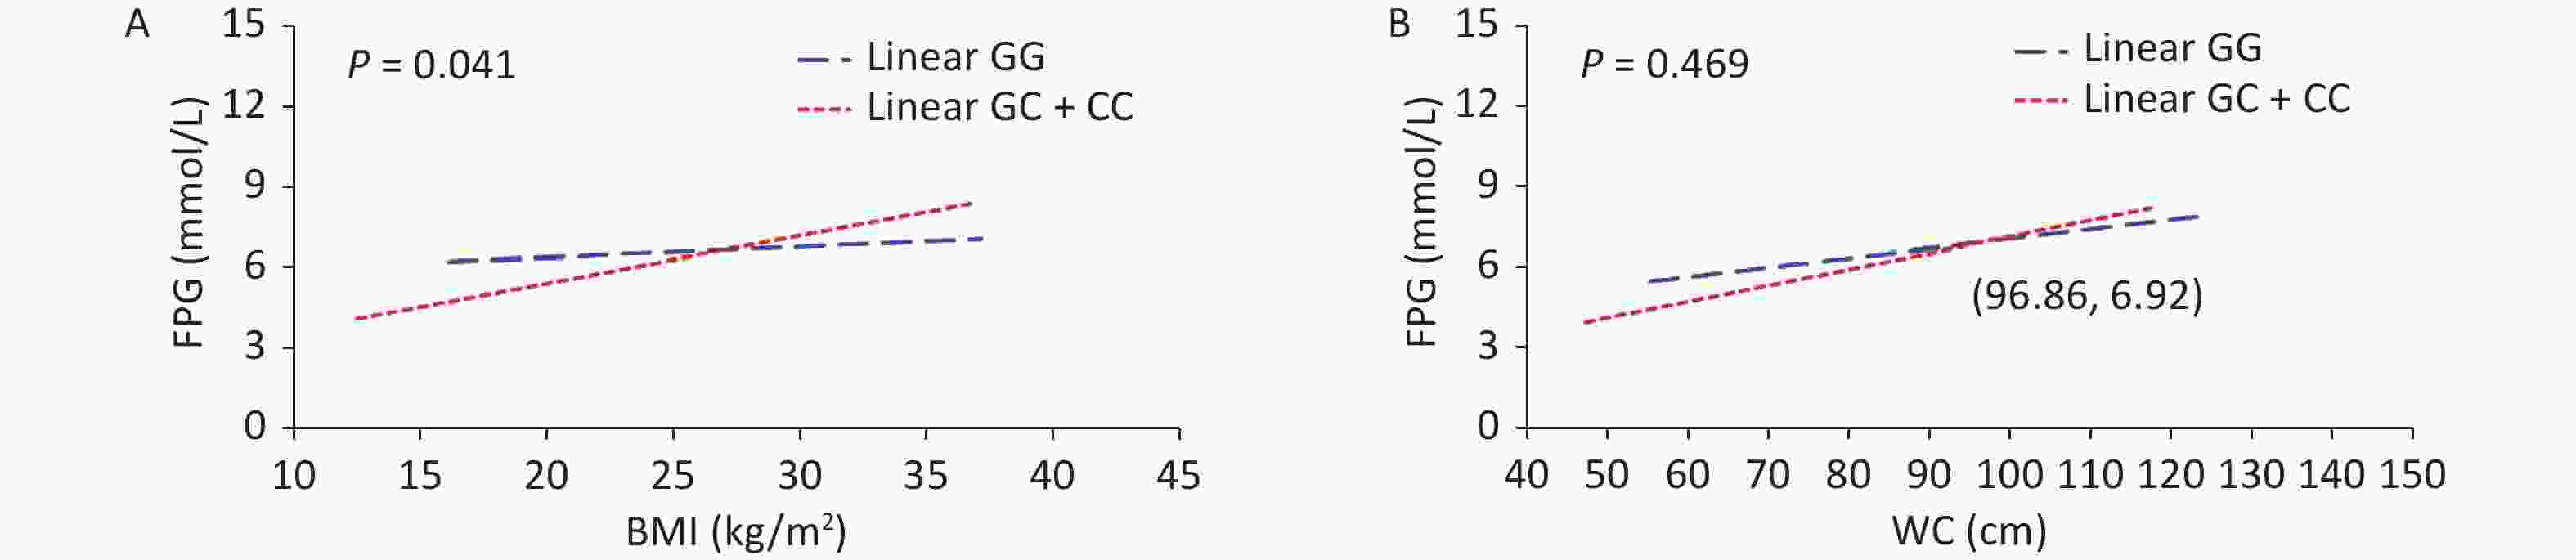
Figure 1. Multiplicative interactions between rs739837 (G > C) and BMI (A) or WC (B) and the associations of these interactions with FPG. The blue trend line represents the correlations between BMI or WC and FPG levels in individuals with risk alleles. The red trend line represents the correlation between BMI or WC and FPG levels in individuals without risk alleles. The point where the two lines cross indicates that for individuals whose BMI or WC is higher than the level value at this point, risk allele carriers have a greater effect on systolic or diastolic blood pressure than non-risk allele carriers. BMI, body mass index; FPG, fasting plasma glucose; WC, waist circumference.
SNP Overweight/obesity Pinteraction Abdominal obesity Pinteraction No Yes No Yes rs2189480 0.422 0.626 AA 1 1.51 (0.67–3.41) 1 3.99 (1.24–7.24) GA+GG 1.14 (0.56–2.31) 2.47 (1.23–4.91) 1.79 (0.81–3.95) 4.07 (1.88–8.83) rs739837 0.029 0.826 GG 1 2.86 (1.93–4.26) 1 1.26 (0.80–1.98) CC+GC 1.96 (1.24–3.10) 3.06 (2.04–4.61) 2.27 (1.54–3.33) 3.00 (2.02–4.46) Note. SNP, single nucleotide polymorphism; T2D, type 2 diabetes; VDR , vitamin D receptor. P-value > alpha (0.05) means not significant. Table 2. Interaction analysis of VDR polymorphisms and obesity on T2D
This study explores the interaction between VDR gene (rs2189480 and rs739837) variation and obesity on T2D susceptibility in the Chinese rural population. Multiplicative interactions between rs739837 variants and BMI or WC were evaluated using a multiplicative model based on generalized linear regression, with FPG as the dependent variable. This study also employed a 1:2 case–control design, including serum samples from 1191 subjects covering a wide age span, which may be suitable for the exploration of T2D etiology. However, this study has several limitations. First, this was a single study limited to Chinese Han populations, which may limit the generalizability of the findings to other ethnic groups. Second, only one gene was discussed in the study; other regulatory genes may contribute to the pathogenesis of T2D. Furthermore, the study was limited by the lack of data on more informative measures of adiposity in addition to BMI and WC, such as visceral fat index or percentage of body fat. Therefore, further studies are needed to verify the observed interactions in other populations and further investigate the mechanisms.
In conclusion, our study found that the “CC+GC” genotypes of rs739837 in the VDR gene were associated with an increased risk for T2D development. Interactions between VDR and obesity were associated with the susceptibility for T2D. The observations from this study constitute evidence that people who carry particular variants of the VDR-rs739837, which improved BMI level control, may be beneficial in inhibiting T2D progression.
-
Cardiovascular metabolic indexes rs2189480 rs739837 GA+GG AA P* GG GC+CC P* TG (mmol/L) 1.65 ± 1.04 1.67 ± 1.26 0.957 1.70 ± 1.15 1.60 ± 1.18 0.215 TC (mmol/L) 4.62 ± 0.95 4.57 ± 0.98 0.277 4.63 ± 0.98 4.54 ± 0.96 0.325 HDL-C (mmol/L) 1.17 ± 0.31 1.17 ± 0.31 0.962 1.19 ± 0.31 1.15 ± 0.30 0.189 LDL-C (mmol/L) 2.73 ± 0.77 2.68 ± 0.80 0.333 2.70 ± 0.80 2.69 ± 0.76 0.936 SBP (mmHg) 128.14 ± 20.19 128.80 ± 19.23 0.818 127.45 ± 18.94 130.00 ± 20.37 0.030 DBP (mmHg) 78.17 ± 10.48 78.98 ± 10.95 0.406 78.10 ± 10.85 79.47 ± 10.63 0.084 FPG (mmol/L) 4.96 ± 0.76 4.99 ± 0.71 0.552 4.98 ± 0.73 4.97 ± 0.73 0.825 FINS (mIU/L) 11.98 ± 5.70 12.17 ± 6.19 0.795 11.28 ± 4.32 12.60 ± 6.51 0.001 HOMA-IR 2.67 ± 1.37 2.73 ± 1.51 0.761 2.23 ± 0.32 2.21 ± 0.26 0.238 HOMA-β 2.22 ± 0.28 2.22 ± 0.31 0.989 2.72 ± 1.50 2.70 ± 1.37 0.757 Note. *Adjusted for age, smoking, alcohol drinking, exercise. TC, total cholesterol; TG, triglyceride; HDL-C, high-density lipoprotein cholesterol; LDL-C, low-density lipoprotein cholesterol; SBP, systolic blood pressure; DBP, diastolic blood pressure; FPG, fasting plasma glucose; FINS, Fasting insulin; HOMA-β, Homeostasis Model Assessment-β [HOMA-β (%) = 20 × FINS (mIU/L) / (FPG (mmol/L) − 3.5)]; HOMA-IR, Homeostasis Model Assessment Insulin Resistance [HOMA-IR = FPG (mmol/L) × FINS (mIU/L) / 22.5]; P-value > alpha (0.05) means not statistically significant. Table S4. Associations of VDR variants (rs2189480 and rs739837) genotypes with cardiovascular metabolic indexes
HTML
 22051Supplementary Materials.pdf
|

|

 Quick Links
 DownLoad: