


-
Previous studies have explored the association of muscle-related factors with health outcomes [1]. For most people, grip strength peaks in early adulthood and begins to declines people’s fifties [2]. Notably, grip strength has been found to be inversely associated with cardiovascular disease morbidity [3-5], cancer mortality [6-8], and other mortality hazard [9-11]. The latest data on chronic diseases worldwide predict that the number of new chronic diseases among the elderly (ECD) all over the world will increase from 12.7 million in 2008 to 21.4 million in 2030 [12], and the growing prevalence of chronic diseases is also associated with decreased normalized grip strength [13]. Deteriorating physical functions may reduce the quality of life and increase death risks [14].
Muscular strength has been shown to predict chronic diseases [15], morbidity, and mortality [16]. Grip strength in particular can be measured by applying scientifically reliable tools that are simple, noninvasive, and cost-effective for nationwide surveys [17, 18]. Moreover, the tools may be used to diagnose sarcopenia and frailty across a person’s lifespan [19]. The criteria for categorizing grip strength differ among males and females, and are associated with social relationships [20] and physical functions [21, 22]. Thus, we stratified our analysis by gender.
To date, there is a gap in research into predicting incidence of death by grip strength among middle-aged and older Chinese adults with chronic diseases, but the prospect of convenient prediction provides the impetus to explore the correlations between grip strength and mortality hazard. The purpose of this study is therefore to determine the association between grip strength and death from all causes by analyzing participants with chronic diseases from a nationally representative survey from China.
-
This study was approved by an ethical review committee at Peking University (approval number IRB 00001052–11014).
-
The China Health and Retirement Longitudinal Study (CHARLS) selected 24,805 participants in 10,257 households from 150 counties/districts and 450 villages within 28 provinces via multistage stratified probability-proportional-to-size (PPS) sampling. A baseline survey was conducted in 2011 with follow-ups in 2013, 2015, and 2018. All respondents completed a structured questionnaire on sociodemographic features, lifestyles, and health-related behaviors/conditions. The response rate of the baseline survey (2011) was 73.1%. CHARLS was approved by the Institutional Review Board at Peking University Health Science Center, and written informed consent was signed before every interview. Of the total 24,805 participants, 1,597 were excluded for being aged below 45 years old, 9,351 for having no chronic diseases, and 3,577 for not responding to grip strength examination. Therefore, 10,280 participants aged 45 to 96 years old remained for our analysis (Figure 1).
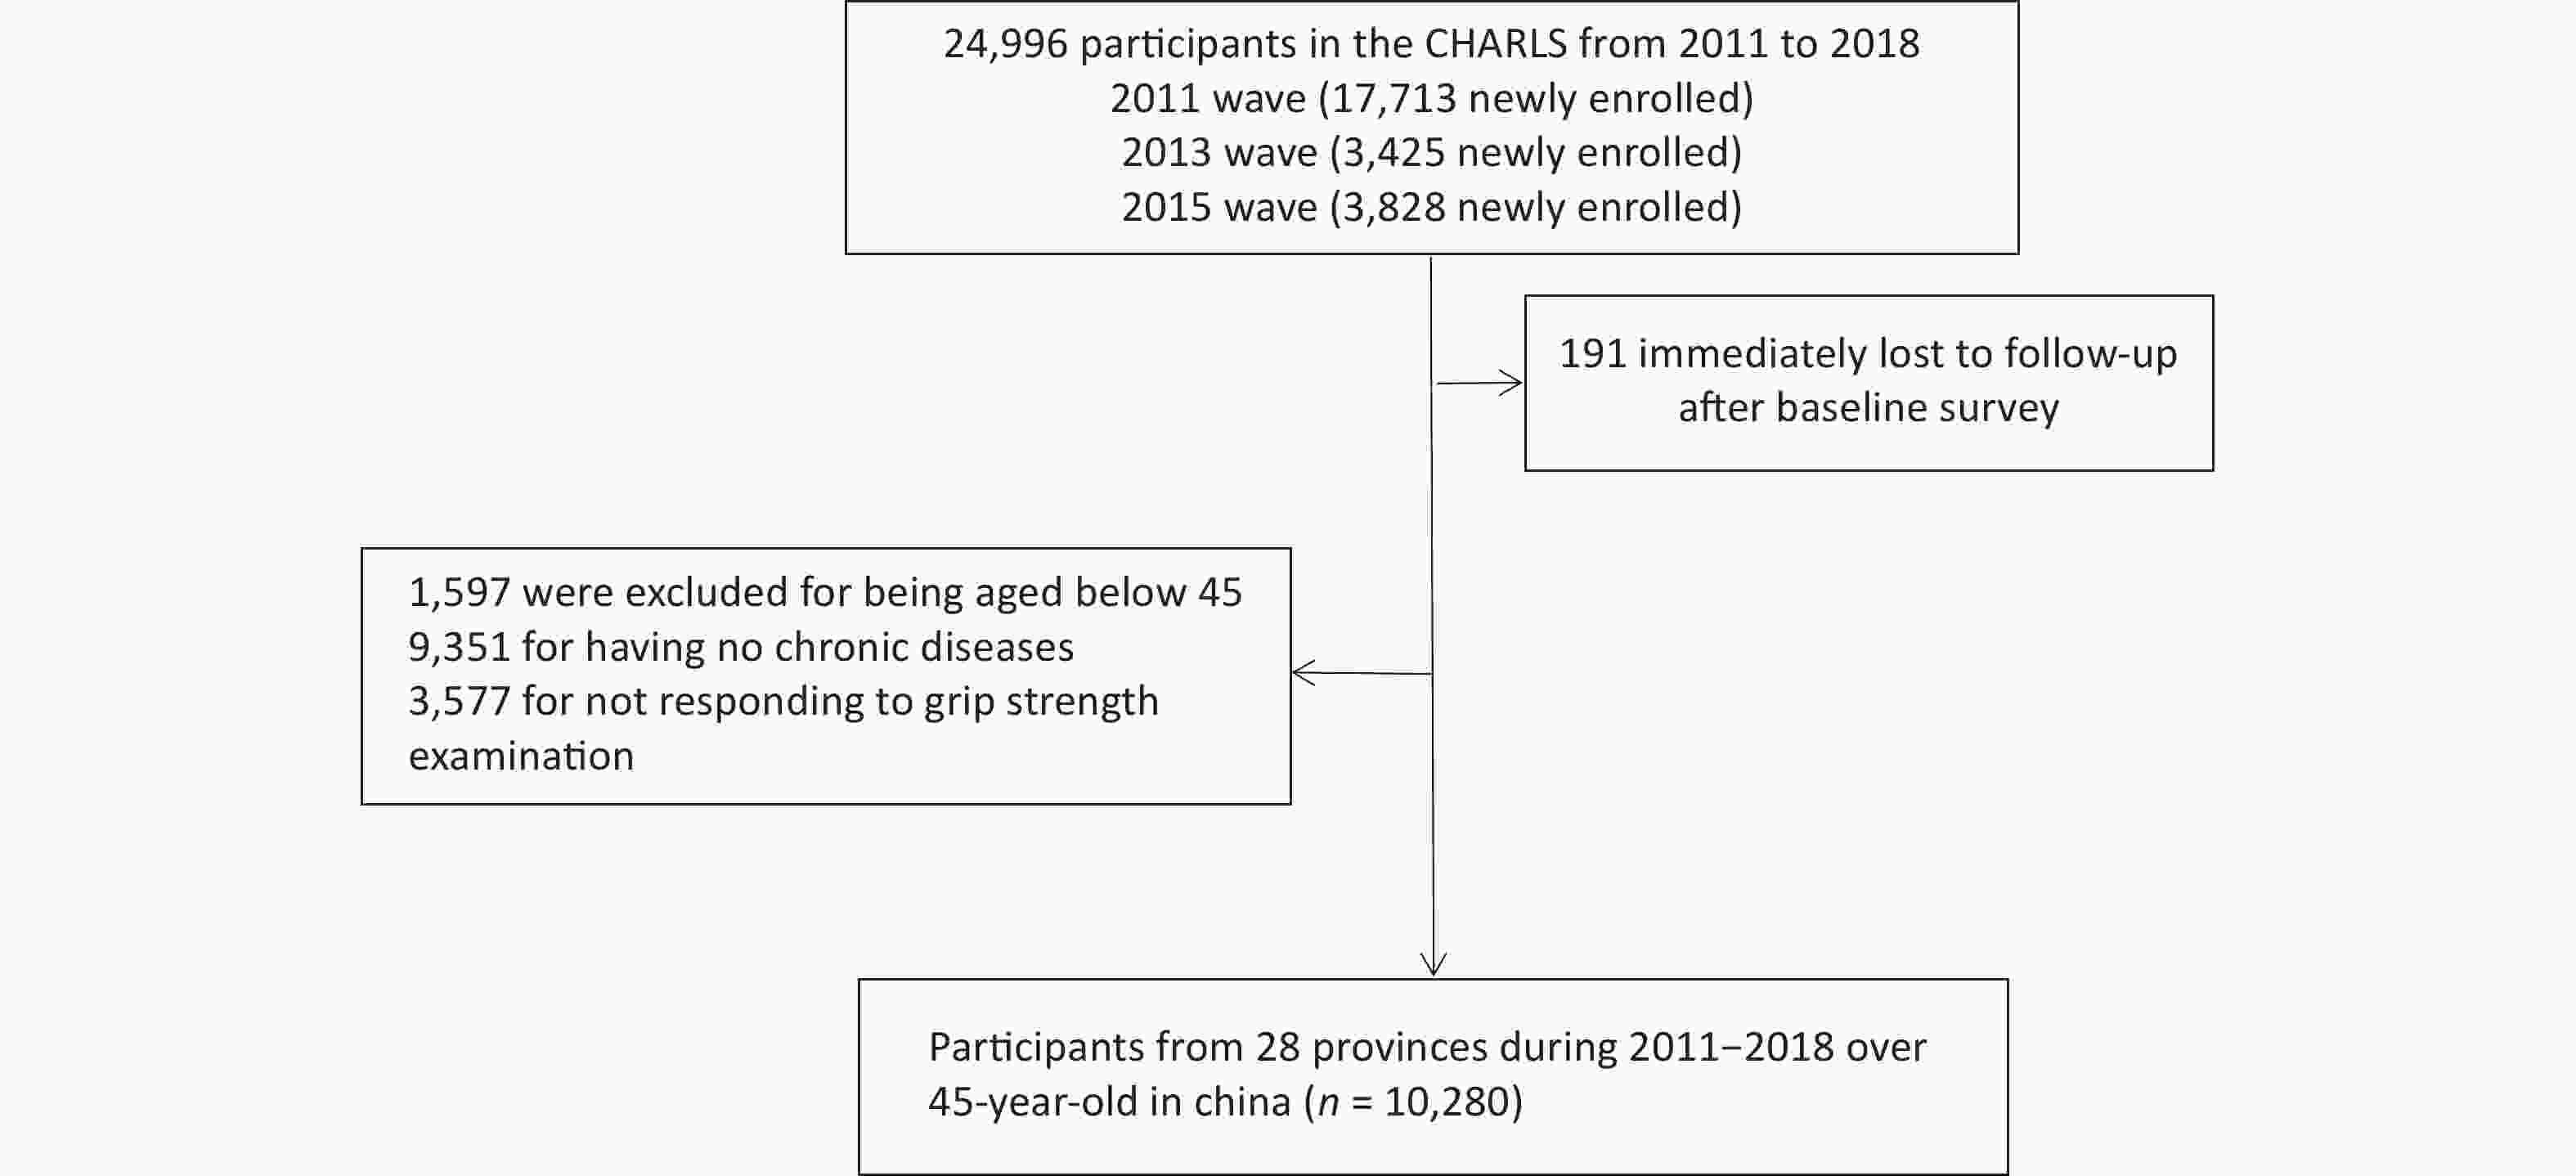
Figure 1. Flow chart of sample selection.
-
Before physical examinations, trained interviewers made sure that it would cause no harm to the participants and that participants had not reported surgery, swelling, inflammation, severe pain, injury with one or both hands, or other past contrary medical history within the last six months. Grip strength was collected by asking participants to keep squeezing the handle of a JAMAR dynamometer with an accuracy of 0.1 kg as hard as they could for several seconds before letting go. Interviewers measured grip strength of participants’ right and left hands separately in two alternative turns. The maximum grip strength of four measurements was recorded for the study [22]. Values of grip strength were categorized into four subgroups by quartiles.
-
CHARLS obtained death information from registrations and certifications by asking the deceased’s relatives or local communities in 2013, 2015, and 2018, or at the end of follow-up (March 31, 2019). Mortality hazard were identified as ‘1’, survival and censorship ‘0’. For censored participants, survival time was defined as years of follow-up.
-
Covariates encompassed demographic features, health behaviors, and physical conditions [23]. Demographic features included age, hukou (household register in China), marital status, and education. Participants were classified as either married (no need for certificates) or not-married (denial of marriage experience, not living together anymore, divorce). Education was grouped by whether or not participants had finished primary school, middle or senior high school, or undergraduate training. Health-related behaviors included smoking and drinking, encoded as no such history, past lifestyle, or current engagement. Finally, physical conditions were characterized by physician-diagnosed chronic diseases (diabetes, hypertension, chronic lung disease, stroke, heart disease, and cancer), activities of daily living (ADLs), nighttime sleep or afternoon napping duration, falling down, hip fracture, physical functions, body mass index (BMI), and A body shape index (ABSI), which was calculated as ABSI = waist circumference/(BMI2/3 × height1/2) [24].
-
For summary statistics, we employed means and standard deviations (SDs) to describe continuous variables. Categorical variables were described by frequency and percentage. We used the χ2 test, analysis of variance, and Mann-Whitney U test to determine significance of inter-group differences. Missing values were imputed with multivariable imputation of classification or regression trees. A total of 10 imputed data sets were created and pooled into R software to perform our analysis.
To examine the association between grip strength and mortality hazard by gender, we used Cox proportional hazard models to calculate hazard ratios (HRs) with 95% confidence intervals (CIs). Proportional hazards assumption were justified for males (P = 0.878) and females (P = 0.514). We calculated the incidence of all-cause death with the class interval set as quartiles in grip strength by gender and estimated four models. In Model 1, age was adjusted; in Model 2, BMI, marital status, educational level, hukou, and ABSI were adjusted; in Model 3, smoking and drinking were added; and all 20 covariates were included in Model 4. Following the literature, we controlled for significant confounders (P < 0.1) and some were chosen for clinical significance (fall down, hip fraction, and cancer) [10, 25-26].
To examine the association between grip strength and all-cause death further, we included grip strength in quartiles in Cox proportional hazards models with category 1 as the reference group, and potential nonlinear relationships were explored with 4-knot restricted spline regression. Restricted cubic splines with four knots at the 5th, 35th, 65th, and 95th percentiles were employed in an effort to model the association of grip strength and mortality hazard as flexibly as possible. Further, in subgroup analysis grip strength as a continuous variable was used to investigate the moderating role of the following covariates: marital status, hukou, smoking, drinking, falling down, diabetes, hypertension, chronic lung disease, stroke, and heart disease (physician-diagnosed). We assessed the P-values of interaction terms and probability proportion tests. In sensitivity analysis, we repeated all analyses on the original data without imputations.
-
Of the original CHARLS participants, 4,802 males (46.7%) and 5,478 females (53.3%) accepted follow-up interviews. The age of participants at baseline ranged from 45 to 96 years old, and the median number of years of follow-up was seven years. Baseline characteristics are summarized in Table 1. The quartiles of grip strength at baseline were 30, 37, and 44 kg for males and 20, 25, and 30 kg for females. The majority of participants (male, 3,618, 75.3%; female, 4,348, 79.4%) were of agricultural hukou. Before the follow-up, 1,106 death events had occurred, and these comprised 1,787 heart disease cases, 317 for stroke, and 1,591 for chronic lung diseases. For behavioral risk factors, 1,210 (25.2%) males and 4,796 (87.6%) females reported current tobacco use, and 2,243 (46.7%) males and 4,796 (87.6%) females reported currently drinking alcohol. For metabolic risk factors, 3,667 (21.4%) participants reported hypertension and 903 (5.3%) reported diabetes.
Baseline
characteristics
(N = 10,280)Male (n = 4,802) Female (n = 5,478) P SMD < 30 kg
(n = 1,201)30– kg
(n = 1,200)37– kg
(n = 1,219)> 44 kg
(n = 1,182)< 20 kg
(n = 1,455)20– kg
(1,401)25– kg
(n = 1,448)> 30 kg
(n = 1,174)Age, mean (SD) 66.84
(9.45)61.87
(8.83)58.24
(8.23)54.59
(7.28)65.08
(10.44)60.43
(9.04)57.47
(8.50)54.87
(7.79)< 0.001 1.006 Education level, n (%) < 0.001 0.322 No formal education 579
(48.2)442
(36.8)338
(27.8)227
(19.2)1,079
(74.2)884
(63.1)804
(55.5)548
(46.7)Primary school 342
(28.5)336
(28.0)372
(30.5)283
(23.9)200
(13.8)253
(18.1)269
(18.6)239
(20.4)Middle or high school 256
(21.3)391
(32.6)476
(39.1)612
(51.8)167
(11.5)254
(18.1)356
(24.6)370
(31.5)College or above 23
(1.9)31
(2.6)32
(2.6)60
(5.1)8
(0.6)10
(0.7)19
(1.3)17
(1.4)Married, n (%) < 0.001 0.408 Yes 1,010
(84.1)1,065
(88.8)1,135
(93.1)1,124
(95.1)1,039
(71.4)1,164
(83.1)1,277
(88.2)1,047
(89.2)No 191
(15.9)135
(11.2)84
(6.9)58
(4.9)416
(28.6)237
(16.9)171
(11.8)127
(10.8)Hukou, n (%) < 0.001 0.105 Agricultural 962
(81.7)918
(77.4)907
(75.4)831
(72.3)1,206
(84.0)1,097
(79.9)1,119
(78.9)926
(79.9)Non-agricultural 216
(18.3)268
(22.6)296
(24.6)319
(27.7)230
(16.0)276
(20.1)299
(21.1)233
(20.1)Smoking, n (%) < 0.001 0.367 Never 632
(52.7)665
(55.4)707
(58.0)691
(58.5)112
(7.7)107
(7.6)81
(5.6)59
(5.0)Formal 246
(20.5)226
(18.8)216
(17.7)207
(17.5)47
(3.2)32
(2.3)38
(2.6)31
(2.6)Current 322
(26.8)309
(25.8)295
(24.2)284
(24.0)1,295
(89.1)1,262
(90.1)1,328
(91.8)1,084
(92.3)Drinking, n (%) 0.068 0.078 Never 373
(31.1)504
(42.0)586
(48.1)596
(50.4)96
(6.6)102
(7.3)96
(6.6)95
(8.1)Formal 122
(10.2)115
(9.6)122
(10.0)140
(11.8)60
(4.1)84
(6.0)69
(4.8)79
(6.7)Current 705
(58.8)581
(48.4)511
(41.9)446
(37.7)1,298
(89.3)1,215
(86.7)1,283
(88.6)1,000
(85.2)ADL, mean (SD) 13.1
(6.3)10.5
(4.6)9.6
(4.0)8.6
(3.8)13.5
(5.6)11.5
(4.3)10.9
(3.8)10.1
(3.6)< 0.001 0.627 Physical function,
mean (SD)13.7
(5.7)11.12
(4.5)10.0
(3.6)9.1
(3.0)14.9
(5.6)12.8
(4.8)11.7
(4.2)10.9
(4.0)< 0.001 0.673 Sleep, mean (SD) 6.3
(2.1)6.3
(1.8)6.4
(1.8)6.6
(1.6)5.8
(2.2)6.0
(2.0)6.1
(1.8)6.4
(1.8)0.031 0.066 Nap, mean (SD) 40.8
(47.3)40.1
(43.9)37.8
(44.9)39.0
(41.9)27.9
(40.1)28.3
(41.1)27.4
(40.1)30.4
(42.1)< 0.001 0.114 ABSI, mean (SD) 8.4
(3.2)8.2
(2.5)8.3
(3.5)8.2
(3.4)8.6
(3.4)8.5
(3.7)8.2
(1.1)8.1
(0.8)0.004 0.095 BMI, mean (SD) 22.1
(3.8)22.8
(3.6)23.6
(3.4)24.8
(3.5)23.4
(4.1)24.0
(4.0)24.7
(4.0)25.4
(3.6)< 0.001 0.438 Fall down, n (%) 0.263 0.627 Yes 238
(20.2)220
(18.5)196
(16.2)144
(12.2)383
(27.0)314
(22.6)261
(18.2)188
(16.1)No 938
(79.8)970
(81.5)1,012
(83.8)1,034
(87.8)1,037
(73.0)1,073
(77.4)1,176
(81.8)982 (83.9) Hip fraction, n (%) 0.327 0.034 Yes 31
(2.6)18
(1.5)23
(1.9)15
(1.3)32
(2.3)28
(2.0)25
(1.7)17
(1.5)No 1,145
(97.4)1,172
(98.5)1,184
(98.1)1,164
(98.7)1,389
(97.7)1,357
(98.0)1,413
(98.3)1,153
(98.5)History of comorbidities, n (%) Hypertension 439
(36.6)394
(32.8)385
(31.6)407
(34.4)607
(41.7)494
(35.3)518
(35.8)423
(36.0)< 0.001 0.187 Cancer 7
(1.0)9
(1.3)10
(1.4)3
(0.4)6
(0.7)9
(1.1)17
(2.0)6
(0.9)0.463 0.041 Chronic lung diseases 293
(24.4)238
(19.8)211
(17.3)157
(13.3)236
(16.2)178
(12.7)171
(11.8)107
(9.1)< 0.001 0.278 Heart disease 215
(17.9)189
(15.8)170
(13.9)151
(12.8)301
(20.7)276
(19.7)252
(17.4)233
(19.8)0.018 0.075 Diabetes 109
(9.1)88
(7.3)98
(8.0)85
(7.2)147
(10.1)135
(9.6)134
(9.3)107
(9.1)< 0.001 0.098 Stroke 77
(6.4)41
(3.4)31
(2.5)28
(2.4)61
(4.2)42
(3.0)37
(2.6)19
(1.6)< 0.001 0.075 Note. P-values are based on χ2 or analysis of variance or Mann-Whitney U test. Calculated as weight in kilograms divided by height in meters squared. Measured in the sub-population of 10,280 participants. Grip strength grouped by quartiles. SMD, SD mean difference. Missing data instances: four for age, three for educational level, four for smoking, two for drinking, 177 for hukou, 114 for fall down, 114 for hip fraction, 260 for sleep hour, and 185 for nap. SD, standard deviation. Table 1. Baseline characteristics of 10,280 participants according to gender
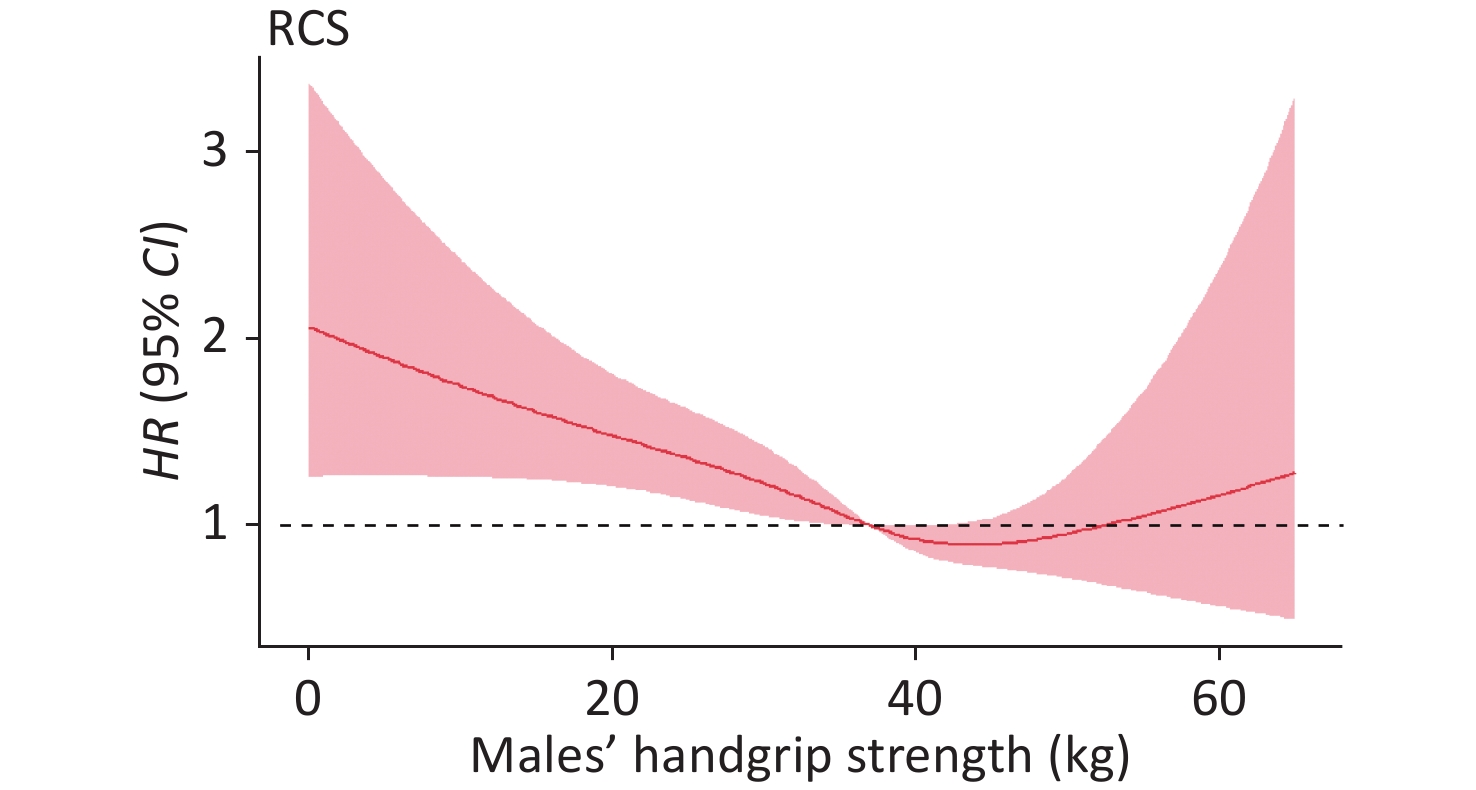
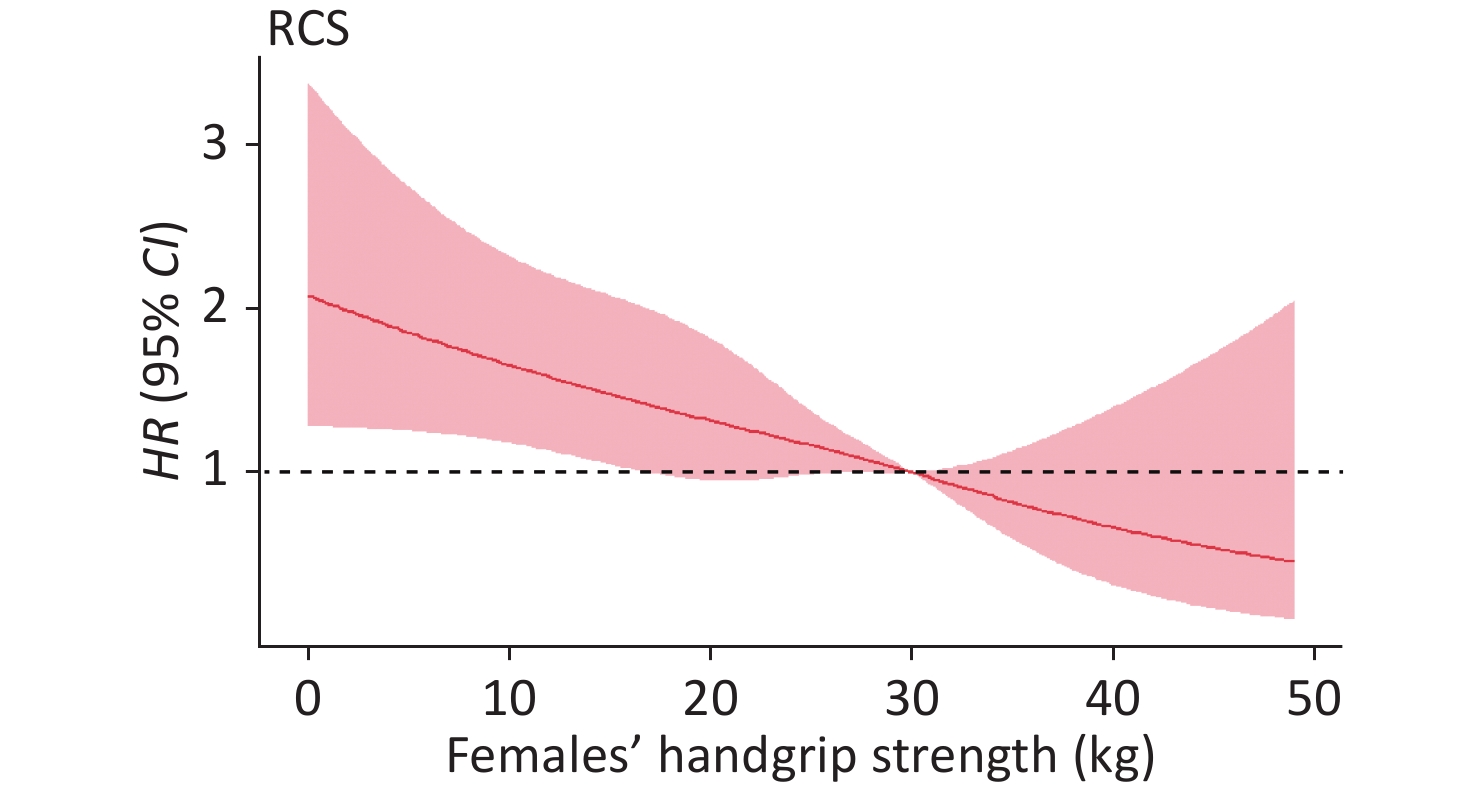
Table 2 shows the association between grip strength and mortality hazard. After adjusting for confounders, with category 1 as the reference group, the adjusted HRs were 0.58 (0.42–0.79) in males and 0.70 (0.48–1.00) in females (category 4). A linear association was also found between the grip strength values and all-cause death risk (males, P = 274; females, P = 0.883) by using restricted spline regression. Here, we selected the median grip strength as the reference point, for males with a grip strength < 37 kg and female with a grip strength < 30 kg, grip strength and death were negatively associated (Figures 2–3). Similar patterns were found in models of quantile values of grip strength (Table 2).
Sex Outcomes death of all causes HR (95% CI) Grip strength
values (kg)Cases,
NoIncidence rate,
per 1,000
person-yearsModel 1 Model 2 Model 3 Model 4 Male (n = 4,802) < 30 335 12.3 1 [Reference] 1 [Reference] 1 [Reference] 1 [Reference] 30– 160 5.9 0.60 (0.50–0.73)* 0.64 (0.52–0.77)* 0.64 (0.52–0.77)* 0.75 (0.61–0.91)* 37– 118 4.3 0.51 (0.40–0.64)* 0.55 (0.44–0.70)* 0.55 (0.44–0.70)* 0.68 (0.54–0.87)* > 44 62 2.3 0.38(0.28–0.51)* 0.44(0.30–0.60)* 0.45 (0.33–0.60)* 0.58 (0.42–0.79)* Female (n = 5,478) < 20 240 7.4 1 [Reference] 1 [Reference] 1 [Reference] 1 [Reference] 20– 93 2.9 0.60 (0.47–0.77)* 0.61 (0.48–0.78)* 0.62 (0.48–0.79)* 0.71 (0.55–0.91)* 25– 58 1.8 0.48 (0.35–0.64)* 0.51 (0.38–0.69)* 0.52 (0.38–0.70)* 0.62 (0.45–0.84)* > 30 40 1.2 0.53 (0.37–0.76)* 0.57 (0.39–0.81)* 0.58 (0.40–0.83)* 0.70 (0.48–0.99) Note. Model 1 was adjusted for age. Model 2 was adjusted as model 1 plus BMI, ABSI, educational level, marriage, and hukou. Model 3 was adjusted as model 2 plus smoking, and drinking. All 20 items were entered simultaneously in model 4. HR, hazard ratio. Table 2. Incidence of mortality hazard according to grip strength
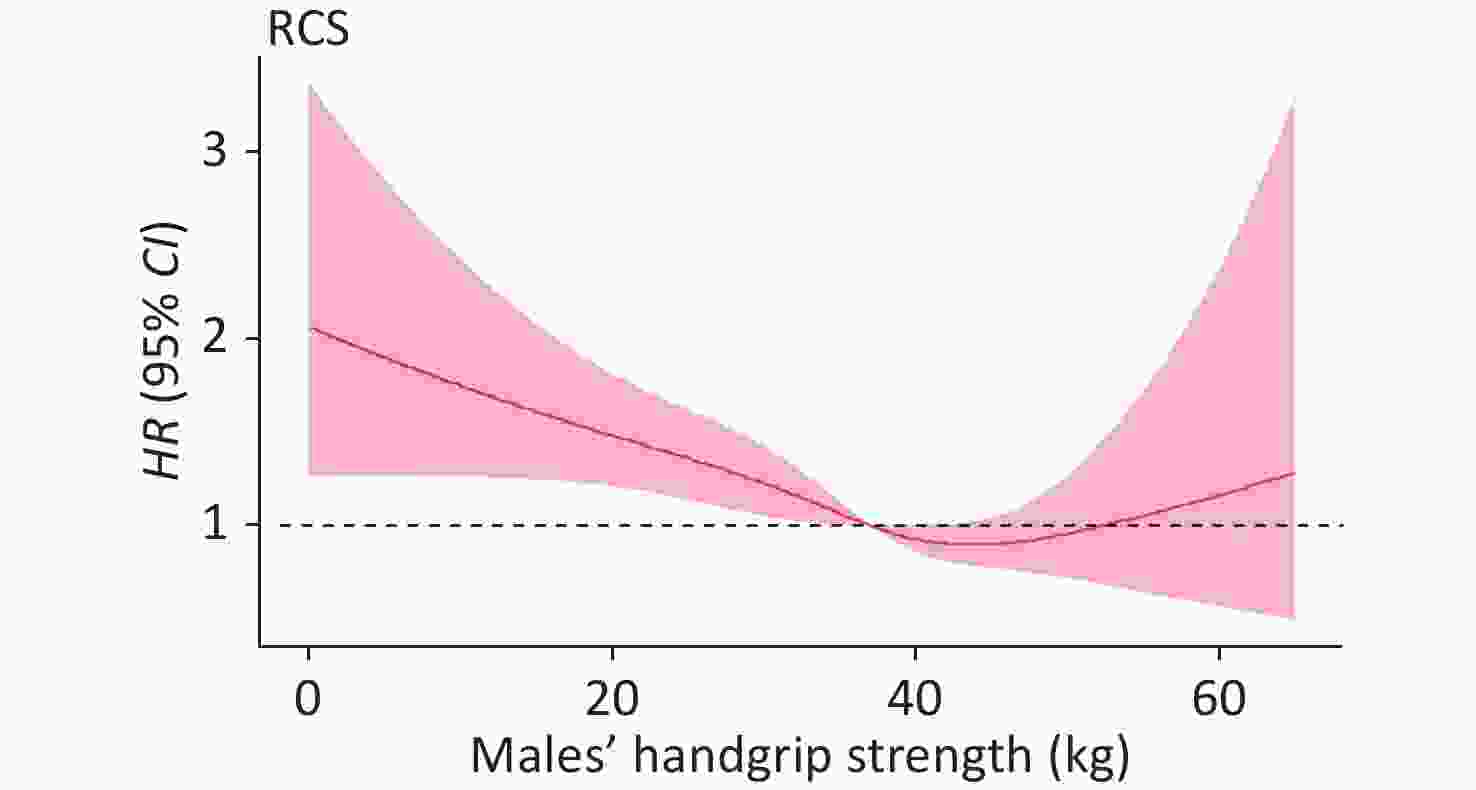
Figure 2. Adjusted hazard ratios (HRs) for mortality hazard according to grip strength in males. RCS, restricted cubic spline.
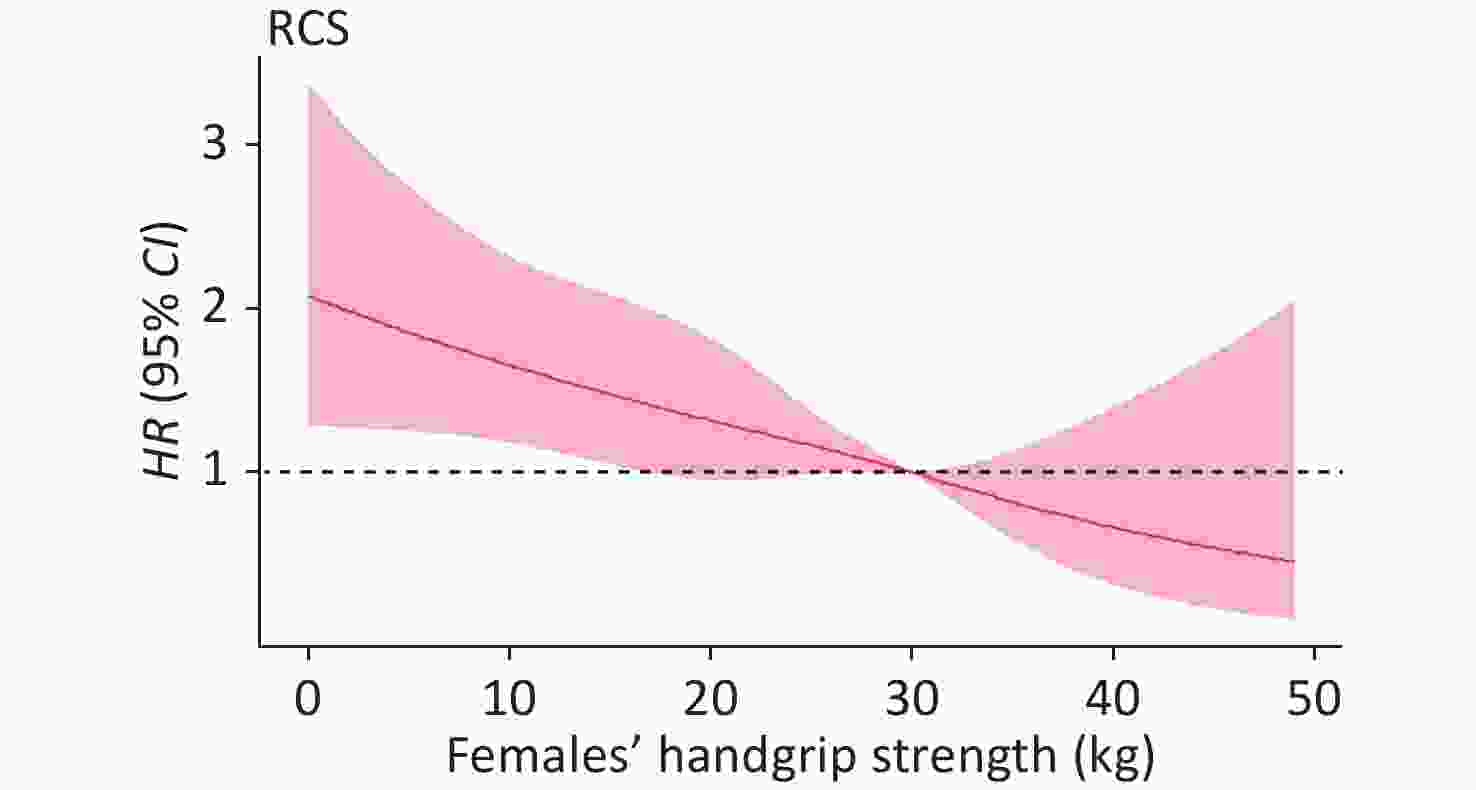
Figure 3. Adjusted hazard ratios (HRs) for mortality hazard according to grip strength in females. RCS, restricted cubic spline.
We compare the socioeconomic factors of participants before and after deleting those without chronic diseases. According to Table 3, the deleted 3,577 participants not responding to grip strength were significantly younger (P < 0.001), more likely not to be married (P < 0.001), had a non-agricultural hukou (P < 0.001), and had a higher educational level (P < 0.001) than those performing grip strength examination.
Variables Level No response, n (%)
n = 3,577Response, n (%)
n = 10,280P* Gender, n (%) Males 1,693 (47.4) 4,795 (46.7) 0.469 Females 1,879 (52.6) 5,478 (53.3) Age [mean (SD)] 58.16 (11.57) 60.02 (9.72) < 0.001 hukou, n (%) Agriculture 2,290 (67.5) 7,966 (79.4) < 0.001 Non-agriculture 1,104 (32.5) 2,073 (20.6) Education, n (%) No formal education 1,422 (39.9) 4,901 (47.7) < 0.001 Primary school 717 (20.1) 2,294 (22.3) Middle or high school 1,244 (34.9) 2,882 (28.0) College or above 185 (5.2) 200 (1.9) Marriage, n (%) Yes 2,700 (86.0) 8,402 (94.8) < 0.001 No 438 (14.0) 459 (5.2) Note. *P is used for comparison of dichotomous variables. Table 3. Socioeconomic factor comparison between the population that responded to and did not respond to grip strength examination
The figures show HRs for death of all causes adjusted for age, hukou, marital status, education, smoking, drinking, history of diabetes, hypertension, heart disease, stroke, chronic lung disease, cancer, history of falls, hip fraction, ADL, physical function, BMI, ABSI, and sleep/nap duration. Data were fitted by a restricted spline Cox proportional hazard regression model. The reference values were the medians: 37 kg for males (P < 0.001) and 30 kg for females (P = 0.008).
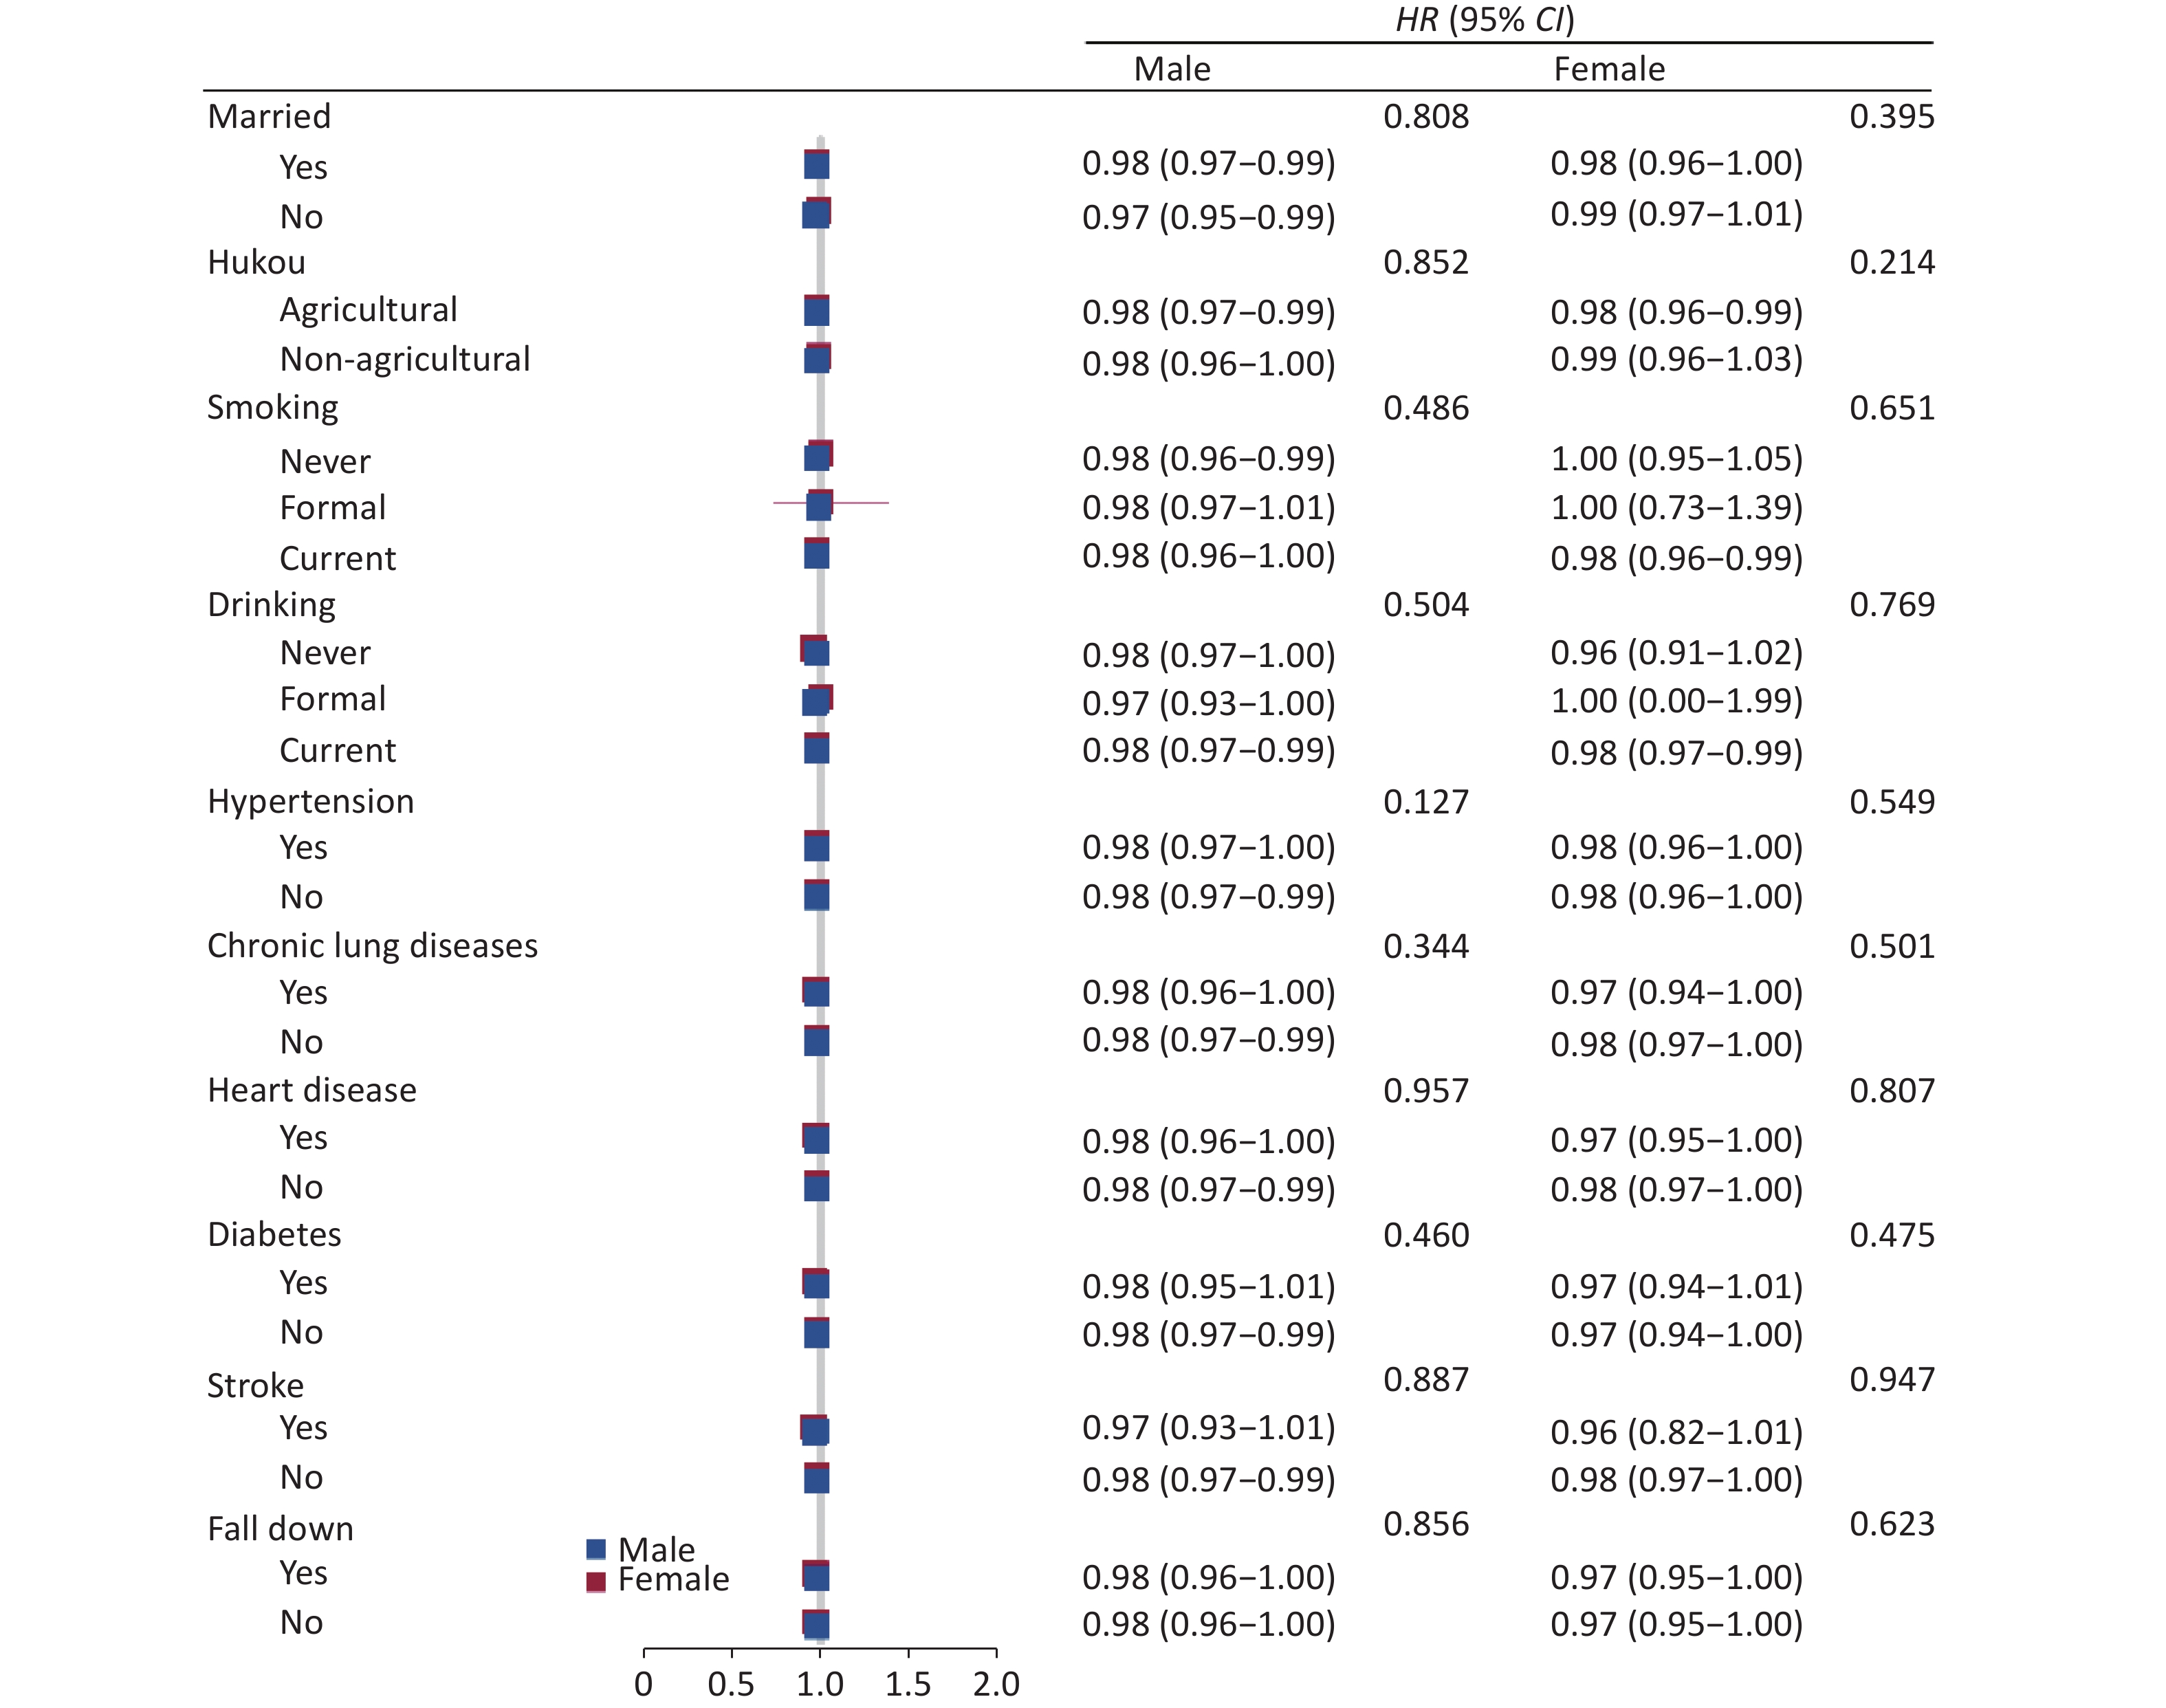
Figure 4 shows the association between grip strength and mortality hazard stratified by gender. There was no interaction effect between handgrip strength and mortality hazard (P > 0.05) for either gender. Specifically, between-group differences were statistically insignificant for any covariate. The HRs were insignificant or close to 1 in all subgroups. Additionally, the sensitivity analysis results did not significantly change in category 4 [males, 0.62 (0.44–0.86), P = 0.004; females, 0.53 (0.35–0.80), P = 0.002].
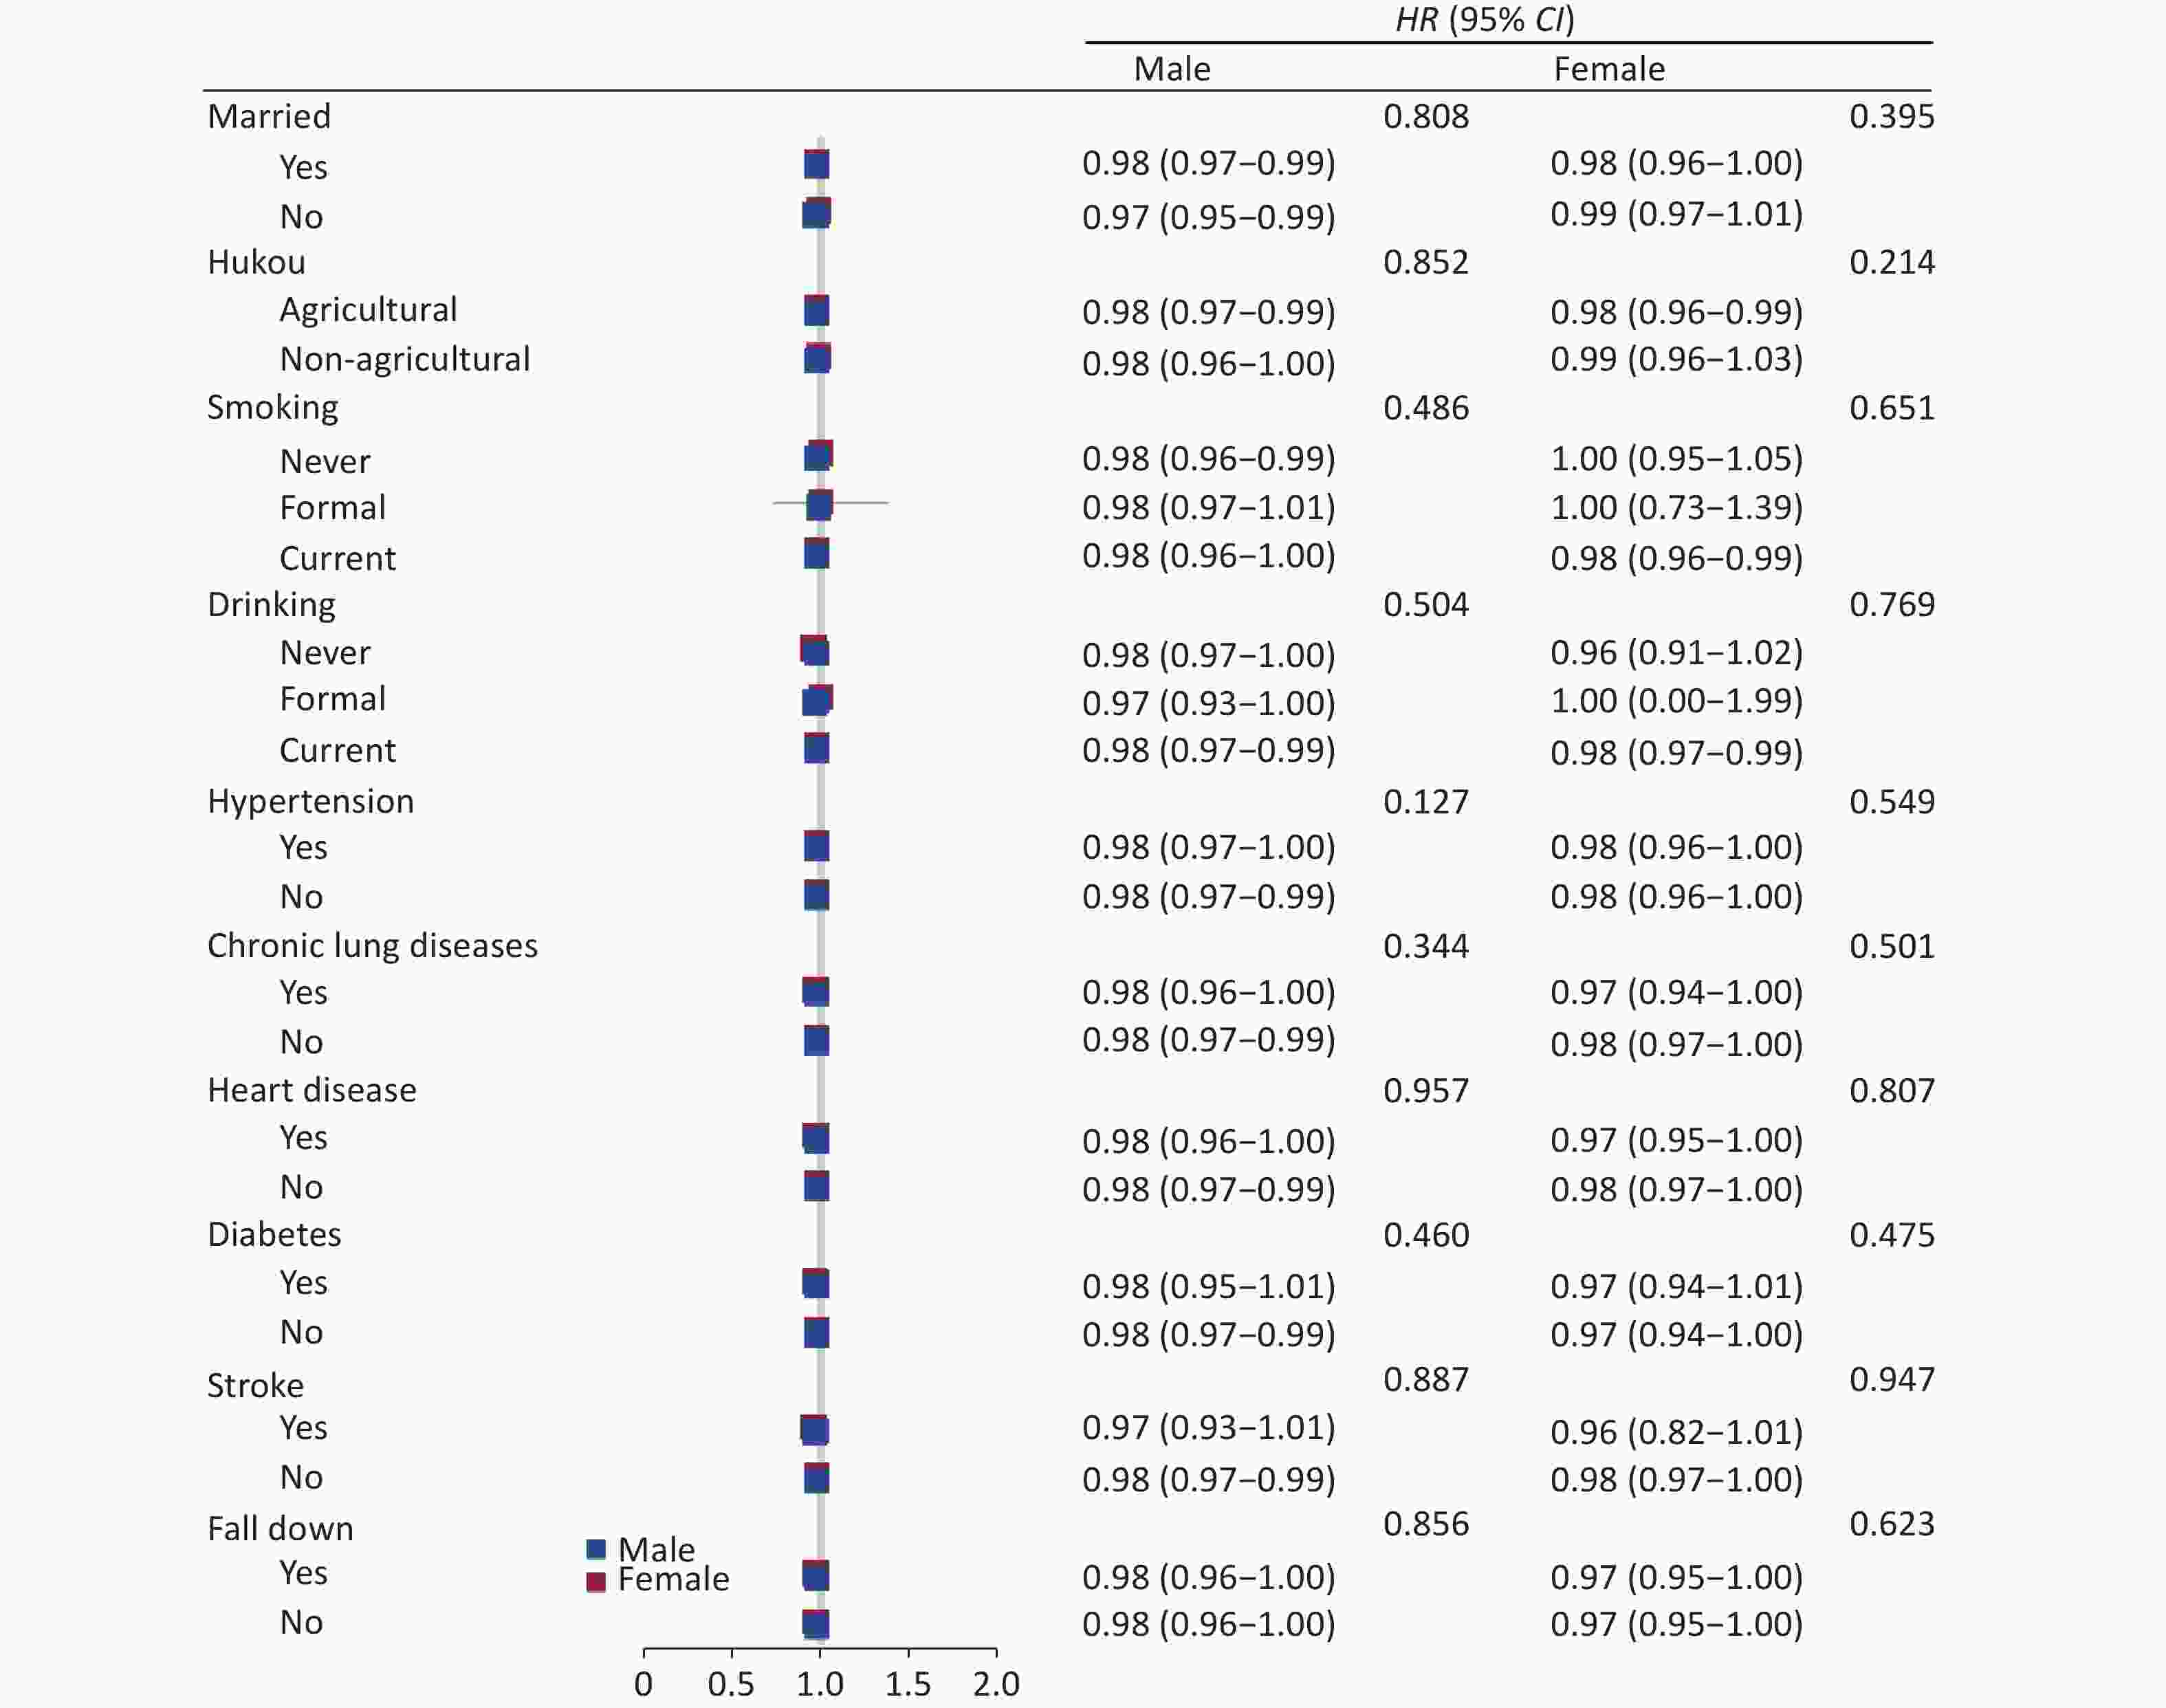
Figure 4. Gender-specific association between grip strength values and mortality hazard stratified by different factors
The figure show hazard ratios (HRs) and 95% CIs for mortality hazard adjusted for age, hukou, marital status, education, smoking, drinking, history of diabetes, hypertension, chronic lung disease, heart disease, stroke, cancer, history of falls, hip fraction, ADL, physical function, BMI, ABSI, and sleep/nap duration.
-
Using a nationally representative cohort survey of 10,280 middle-aged and older Chinese adults with chronic diseases we found that elevated grip strength was linearly associated lower mortality hazard.
We found that grip strength is a predictor of death in the whole population in males and females. Our findings are consistent with previous studies on population aged 35 and above in Asia[27, 28], healthy middle-aged and older adults in Europe[29-32], older adults in Russia[33], participants aged over 20 in the US[4], and the Prospective Urban-Rural Epidemiology (PURE) study using cohorts of varying incomes and sociocultural settings in 17 countries [34]. Some studies have found muscle strength not to be predictive of mortality in women [35, 36]. However short follow-up times in these studies may have resulted in the findings of no significant statistical differences.
We found a statistically significant association among both males and females: negative correlation between death risk and grip strength in males with a grip strength < 37 kg and in females with a grip strength < 30 kg. We also found that death risk varies more with grip strength in men than in women. This finding is consistent with a meta-analysis of 42 prospective cohort studies [5] where the observed decline in grip strength was a linear independent predictor of all-cause mortality. However, muscle strength was not found to be predictive of death among women in some previous studies [37, 38]. The threshold of significant association between grip strength and death risk were larger among males (37 kg > 30 kg), and the range of grip strength predicting death risk was also wider, which may be responsible for different patterns among genders. One possible explanation for gender differences might be endocrine system modulation. Growth differentiation factor (GDF15) [39] is essential for optimal physical performance, and GDF15 concentrations increase with age, higher in men than women. Elevated GDF15 is negatively associated with muscle mass among older males, while among women, there is no significant difference between those with elevated GDP15 and others. Myostatin has received recognition as a potent inhibitor of skeletal muscle growth, although it may only have adverse effects in elderly men [40]. More efforts are needed to identify the specific mechanisms.
We explored all-cause death in middle-aged and older Chinese patients with chronic diseases using a nationally representative and dynamic long-term follow-up cohort study, CHARLS, which used an objective and standardized test for the assessment of grip strength. Furthermore, its nationally representative population-based PPS sampling likely further improved the reliability of the study. However, our exclusion of participants without chronic diseases may have increased the likelihood of reverse causality and reduce the statistical power of our tests. All-cause death captures all deaths and therefore may include death caused by external forces not directly related to health, such as car accidents.
-
In conclusion, low grip strength among Chinese adults was linearly associated with higher mortality hazard, though the specific mechanisms for this were unclear.
-
The authors declare that all methods were performed in accordance with the relevant guidelines and regulations.
-
Not applicable.
-
Publicly available datasets were analyzed in this study. This data can be found here: https://charls.pku.edu.cn/en/.
-
The authors declare that they have no competing interests.
-
XIE Kai Hong planned the study, supervised the data analysis, and wrote the paper. HAN Xiao performed all statistical analyses and contributed to revising the paper. ZHUANG Su Fang and ZHENG Wei Jun helped find the source and analysis method. All authors have read and approved the manuscript and we have no conflicts of interest.
-
The authors thank the participants of CHARLS project and AiMi Academic Services (www.aimieditor.com) for the English language editing and review services.
Low Grip Strength and Increased Mortality Hazard among Middle-Aged and Older Chinese Adults with Chronic Diseases
doi: 10.3967/bes2023.013
Funds:
This study was supported by the Ministry of Education of Humanities and Social Science Project [Grant No. Y202145935]
- Received Date: 2022-06-29
- Accepted Date: 2022-09-20
-
Key words:
- Grip strength /
- Death /
- Chronic disease
Abstract:
| Citation: | XIE Kai Hong, HAN Xiao, ZHENG Wei Jun, ZHUANG Su Fang. Low Grip Strength and Increased Mortality Hazard among Middle-Aged and Older Chinese Adults with Chronic Diseases[J]. Biomedical and Environmental Sciences, 2023, 36(3): 213-221. doi: 10.3967/bes2023.013

|

 Quick Links
 DownLoad: