


-
Numerous instances of poisoning caused by the ingestion of mushrooms are reported annually worldwide, with most mushroom poisoning deaths caused by the ingestion of toxic amanita fungi. Amatoxin is the main toxic component of amanita, and α-amanitin is one of the most potent toxins present in amatoxin[1]. α-Amanitin causes damage to both the liver and kidney, and its main biological target is thought to be RNA polymerase II in liver cells[2]. However, other studies have reported that inhibition of RNA polymerase II by α-amanitin is not the only mechanism by which liver injury can occur[3,4]; therefore, further studies are required to establish the mechanism of liver injury by α-amanitin.
Metabolomic studies have shown great potential for identifying biomarkers that can be used for toxicological diagnosis, and these biomarkers are also useful for monitoring responses of organisms to environmental stimuli. However, the metabolic profiles induced by α-amanitin exposure in the serum of mice are unknown. Consequently, a ultra-performance liquid chromatography quadrupole time-of-flight tandem mass spectrometry (UPLC/Q-TOF-MS) -based metabolomic method was developed in this study for analyzing characteristic changes in serum metabolites that are caused by exposure to α-amanitin toxin. The availability of this new diagnostic method is potentially valuable as it allows a simple blood test to be used to monitor the progress of α-amanitin poisoning, as well as provides an important tool to enable α-amanitin-induced liver injury to be investigated at the molecular level.
Acetonitrile (LC/MS grade) and methanol (LC/MS grade) were purchased from Fisher Scientific (Waltham, MA). Formic acid was purchased from Aladdin (Shanghai, China) and α-amanitin was purchased from Med Chem Express (Shanghai, China). Male Kunming (KM) mice (18–22 g) were supplied by the Animal Center of the Guizhou Medical University (Guizhou, China). After one week of acclimatization, the mice were divided randomly into four groups containing 20 animals each. The groups included a control group, low-dose α-amanitin group (0.1 mg/kg bw), medium-dose α-amanitin group (0.2 mg/kg bw), and high-dose α-amanitin group (0.3 mg/kg bw). The low-, medium-, and high-dose groups were intraperitoneally injected with 10 μg/mL, 20 μg/mL, and 30 μg/mL saline solutions of α-amanitin once, and the control group was injected once with saline solution containing no α-amanitin. The injection volume was 0.01 mL/g bw.
The retrobulbar venous plexus penetration method was used to extract blood samples after 48 h. Equal volumes of individual blood samples within each group were combined to prepare quality control (Qc) samples. All samples were centrifuged at 2,500 ×g for 15 min for serum separation. Biochemical analysis was performed on 10 serum samples from each group, and the remaining serum samples were stored at −80 °C before performing high-resolution mass spectrometric analysis. Liver and kidney samples from each mouse were fixed with 10% neutral formalin, embedded in paraffin. Five micrometer-thick tissue sections were cut and mounted on slides. Slide sections were stained with hematoxylin and eosin and examined for histopathological changes under a microscope.
Before metabolomic analyses, the samples were thawed to room temperature (21−25 ℃). Then, 400 μL of methanol-acetonitrile (1:1, v/v) was added to 100 μL of the sample in a 1.5 mL tube, and the resultant mixture was vortexed for 4 min followed by centrifugation at 12,000 rpm for 10 min at 4 °C. The resultant supernatant (300 μL) was then transferred into another 1.5 mL tube and evaporated to dryness under nitrogen at room temperature. The resultant residue was then re-dissolved in 100 μL methanol, and the resultant solution was vortexed for 4 min and then centrifuged at 12,000 rpm for 10 min at 4 °C. Each sample was then transferred to a microvial to enable UPLC/Q-TOF-MS analysis.
Chromatographic separations were performed using an Agilent1290 UHPLC (Yishun Ave 7, Singapore) system with an Agilent Zorbax Eclipse Plus C18 column (100 mm × 2.1 mm, 1.8 μm), with elution carried out at a flow rate of 0.3 mL/min at 35 °C. Two mobile phases, A and B, were used for column elution. Mobile phase A consisted of 0.1% formic acid-water and mobile phase B consisted of 0.1% formic acid-acetonitrile for use in the positive ion mode. Mobile phase A consisted of 5 mmol/L ammonium acetate-water and mobile phase B consisted of 5 mmol/L ammonium acetate-acetonitrile for use in the negative ion mode. Mass spectrometry analysis was performed using an Agilent 6545 Q-TOF mass spectrometer (Yishun Ave 7, Singapore) using electrospray ionization and a full scan mode from m/z 50–1000.
The software Profinder (version 10.0, Agilent, Santa Clara, CA, USA) was used to convert the raw data into tables containing pairs of mass and retention time data with associated intensities for all detected peaks. Parameters used in the processing method used a RT window of 0.2 min and a mass tolerance level of 10 ppm ± 10 mDa. Peaks that were not present in 80% of the samples of a group were filtered out, with peak significance subsequently measured using one-way ANOVA, fold change analyses, and partial least squares-discriminant analysis. Metabolites were considered significant when P < 0.05, fold change (FC) ≥ 2.0, and variable importance in projection (VIP) > 1.0. The metabolic pathways responsible for production were analyzed using MetaboAnalyst 5.0 (
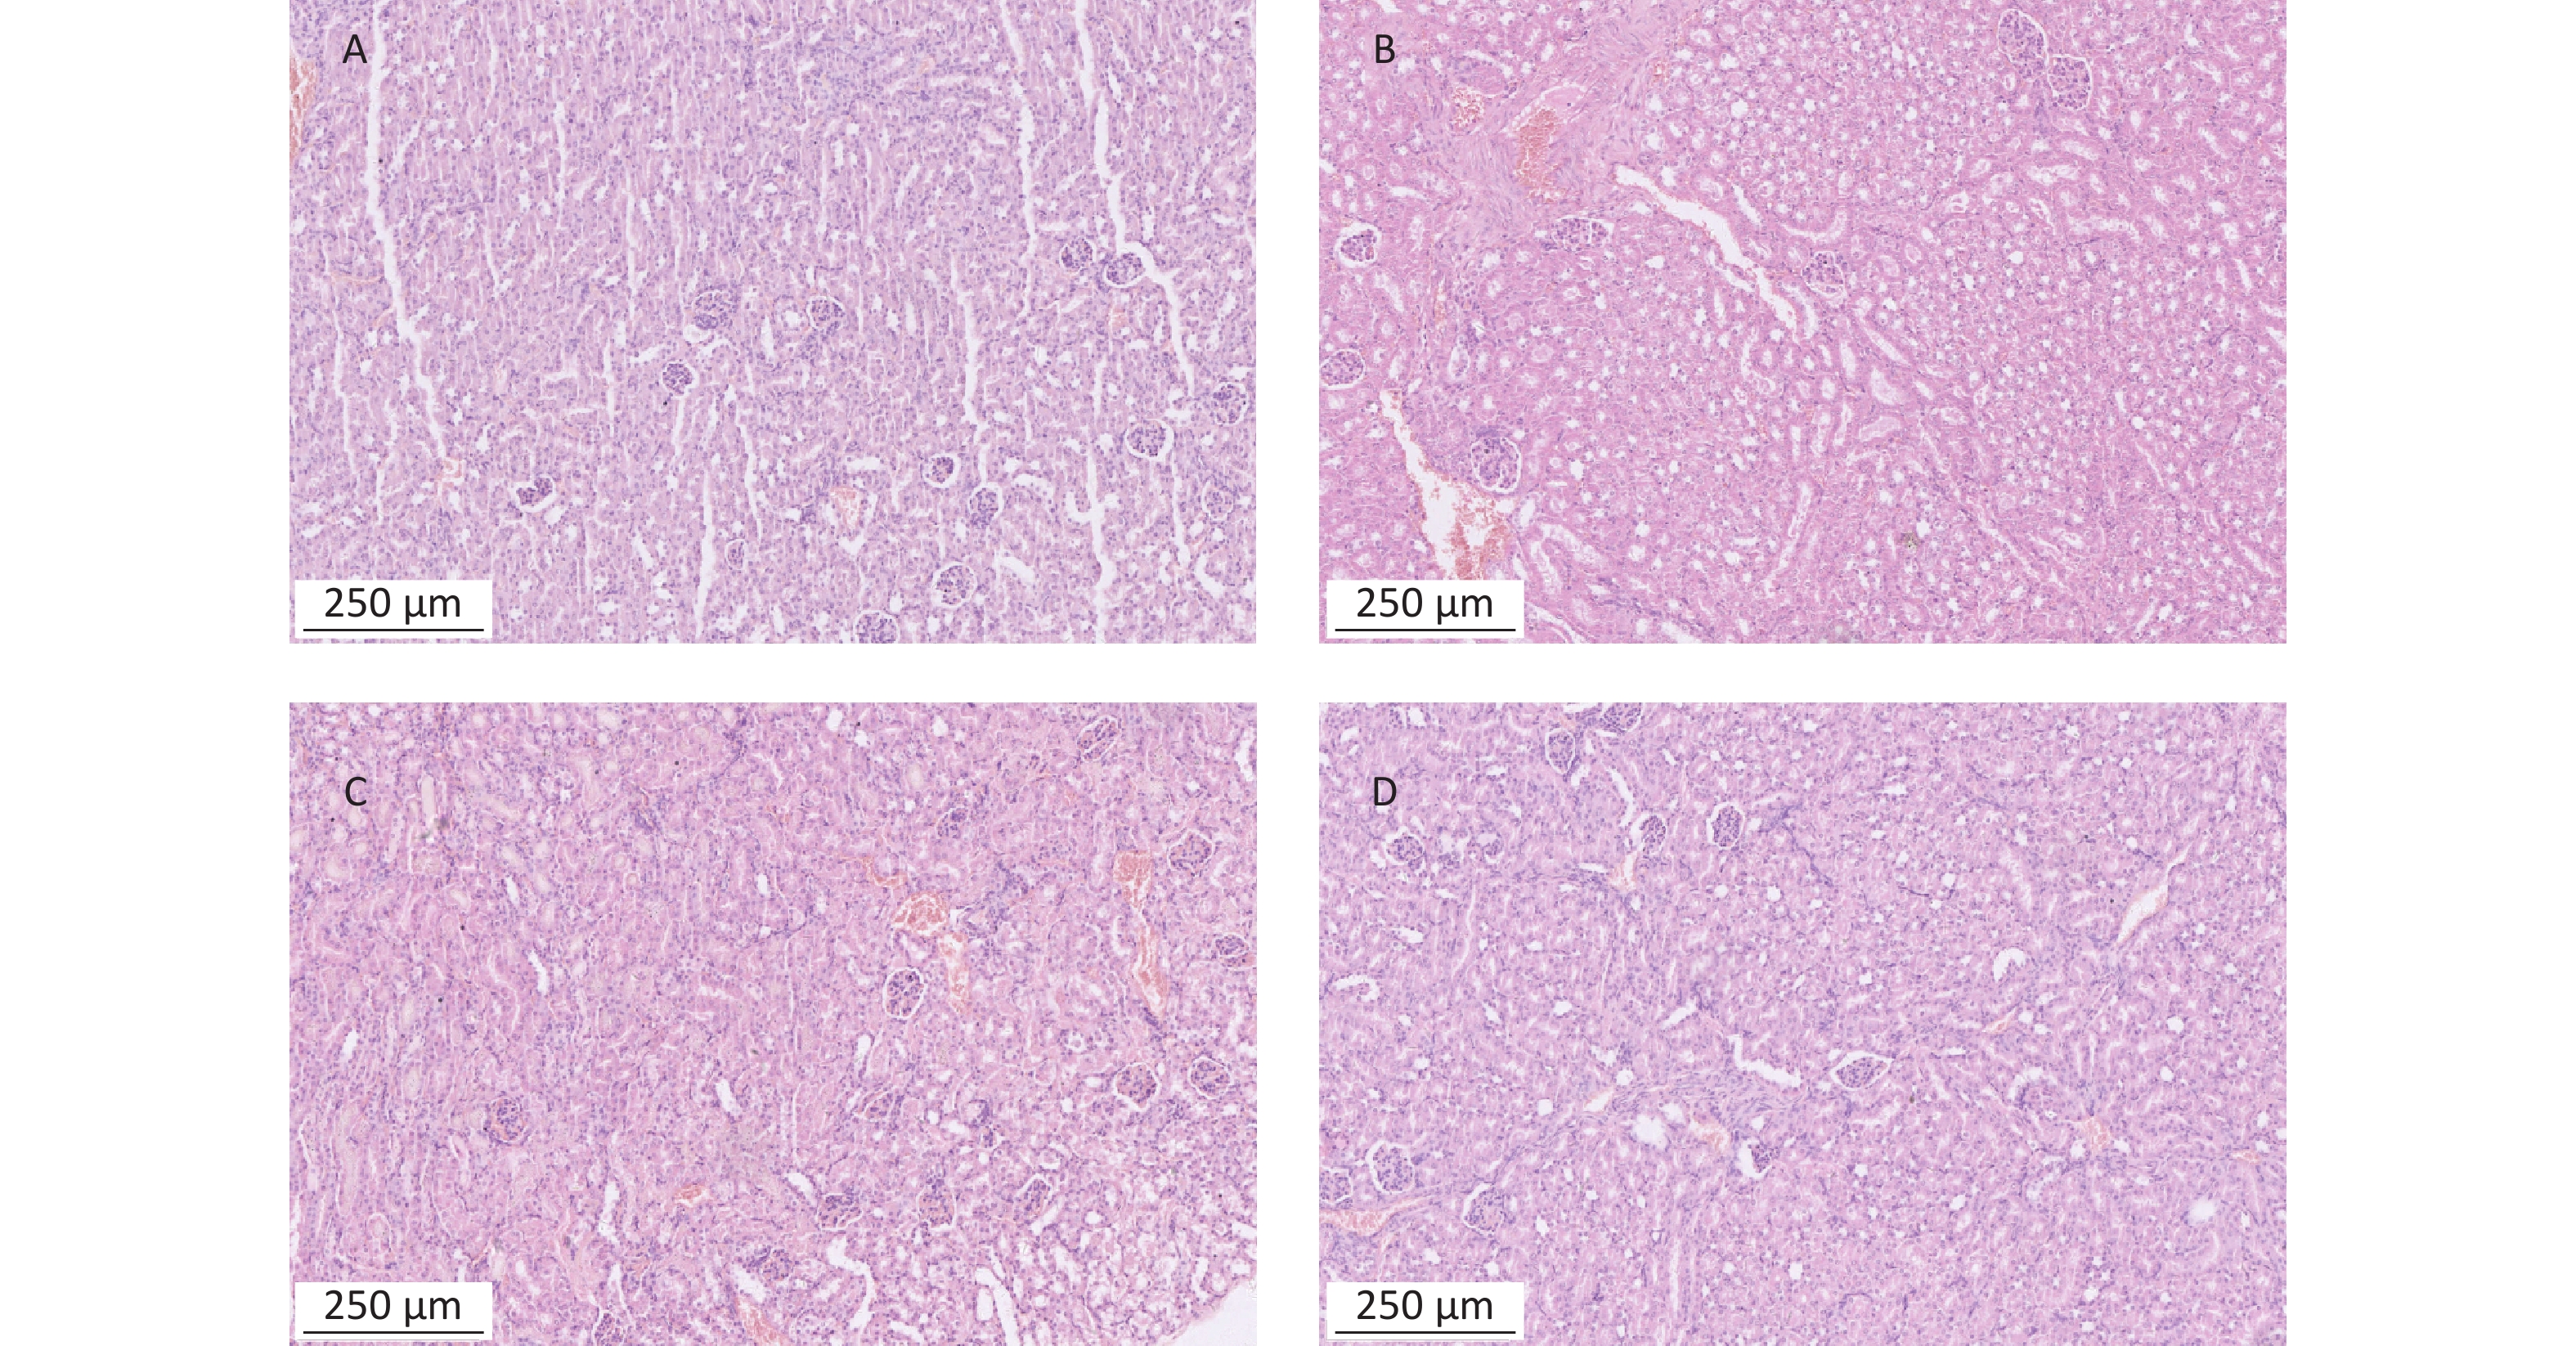
https://www.metaboanalyst.ca ).To detect the liver and kidney function of mice treated with α-amanitin, we measured biochemical parameters. Alanine aminotransferase, aspartate aminotransferase, alkaline phosphatase, γ-glutamyl transpeptidase, blood urea nitrogen, and serum creatinine levels were significantly increased (Supplementary Table S1 available in www.besjournal.com). Histological images of liver tissue samples from α-amanitin-treated mice revealed disordered hepatic lobule structures, focal necrosis, and hepatocyte edema. Greater tissue damage was observed at higher α-amanitin dosing levels, with the most damage observed at the highest dose of 0.3 mg/kg bw, revealing the occurrence of inflammatory cell infiltration (Supplementary Figure S1 available in www.besjournal.com). These changes suggest that α-amanitin impairs liver function. However, no noticeable pathological changes were observed in the kidney tissue images of α-amanitin-treated mice from each group (Supplementary Figure S2 available in www.besjournal.com). This indicates that any gross pathological damage to kidney tissues caused by α-amanitin may be relatively minor compared to its effect on serum blood urea nitrogen and serum creatinine levels.
Group ALT (U/L) AST (U/L) ALP (U/L) GGT (U/L) BUN (mmol/L) Cr (μmol/L)) C 37.10 ± 2.75 53.80 ± 8.18 88.02 ± 7.30 4.41 ± 1.34 8.01 ± 0.94 32.65 ± 1.79 L 143.43 ± 33.75a 126.61 ± 26.90a 170.52 ± 36.47a 17.85 ± 5.72a 41.69 ± 11.32a 69.54 ± 14.58a M 272.29 ± 47.75ab 322.30 ± 49.09ab 334.45 ± 51.26ab 58.01 ± 11.19ab 97.47 ± 10.81ab 132.72 ± 3.40ab H 406.64 ± 34.61abc 516.27 ± 118.70abc 472.43 ± 45.13abc 87.34 ± 6.62abc 122.43 ± 10.55abc 156.41 ± 15.39abc Note. aP < 0.05 compared to group C. bP< 0.05 compared to group L. cP < 0.05 compared to group M. ALT, alanine aminotransferase; AST, aspartate minotransferase; ALP, alkaline phosphatase; GGT, γ-glutamyl transpeptidase; BUN, blood urea nitrogen; Cr, serum creatinine. C: Control group, 0 μg/kg bw; L: low-dose group, 0.1 mg/kg bw; M: medium-dose group, 0.2 mg/kg bw; H: high-dose group, 0.3 mg/kg bw. Table S1. Serum analytes in α-amanitin-treated mice (mean ± SD, n = 10)
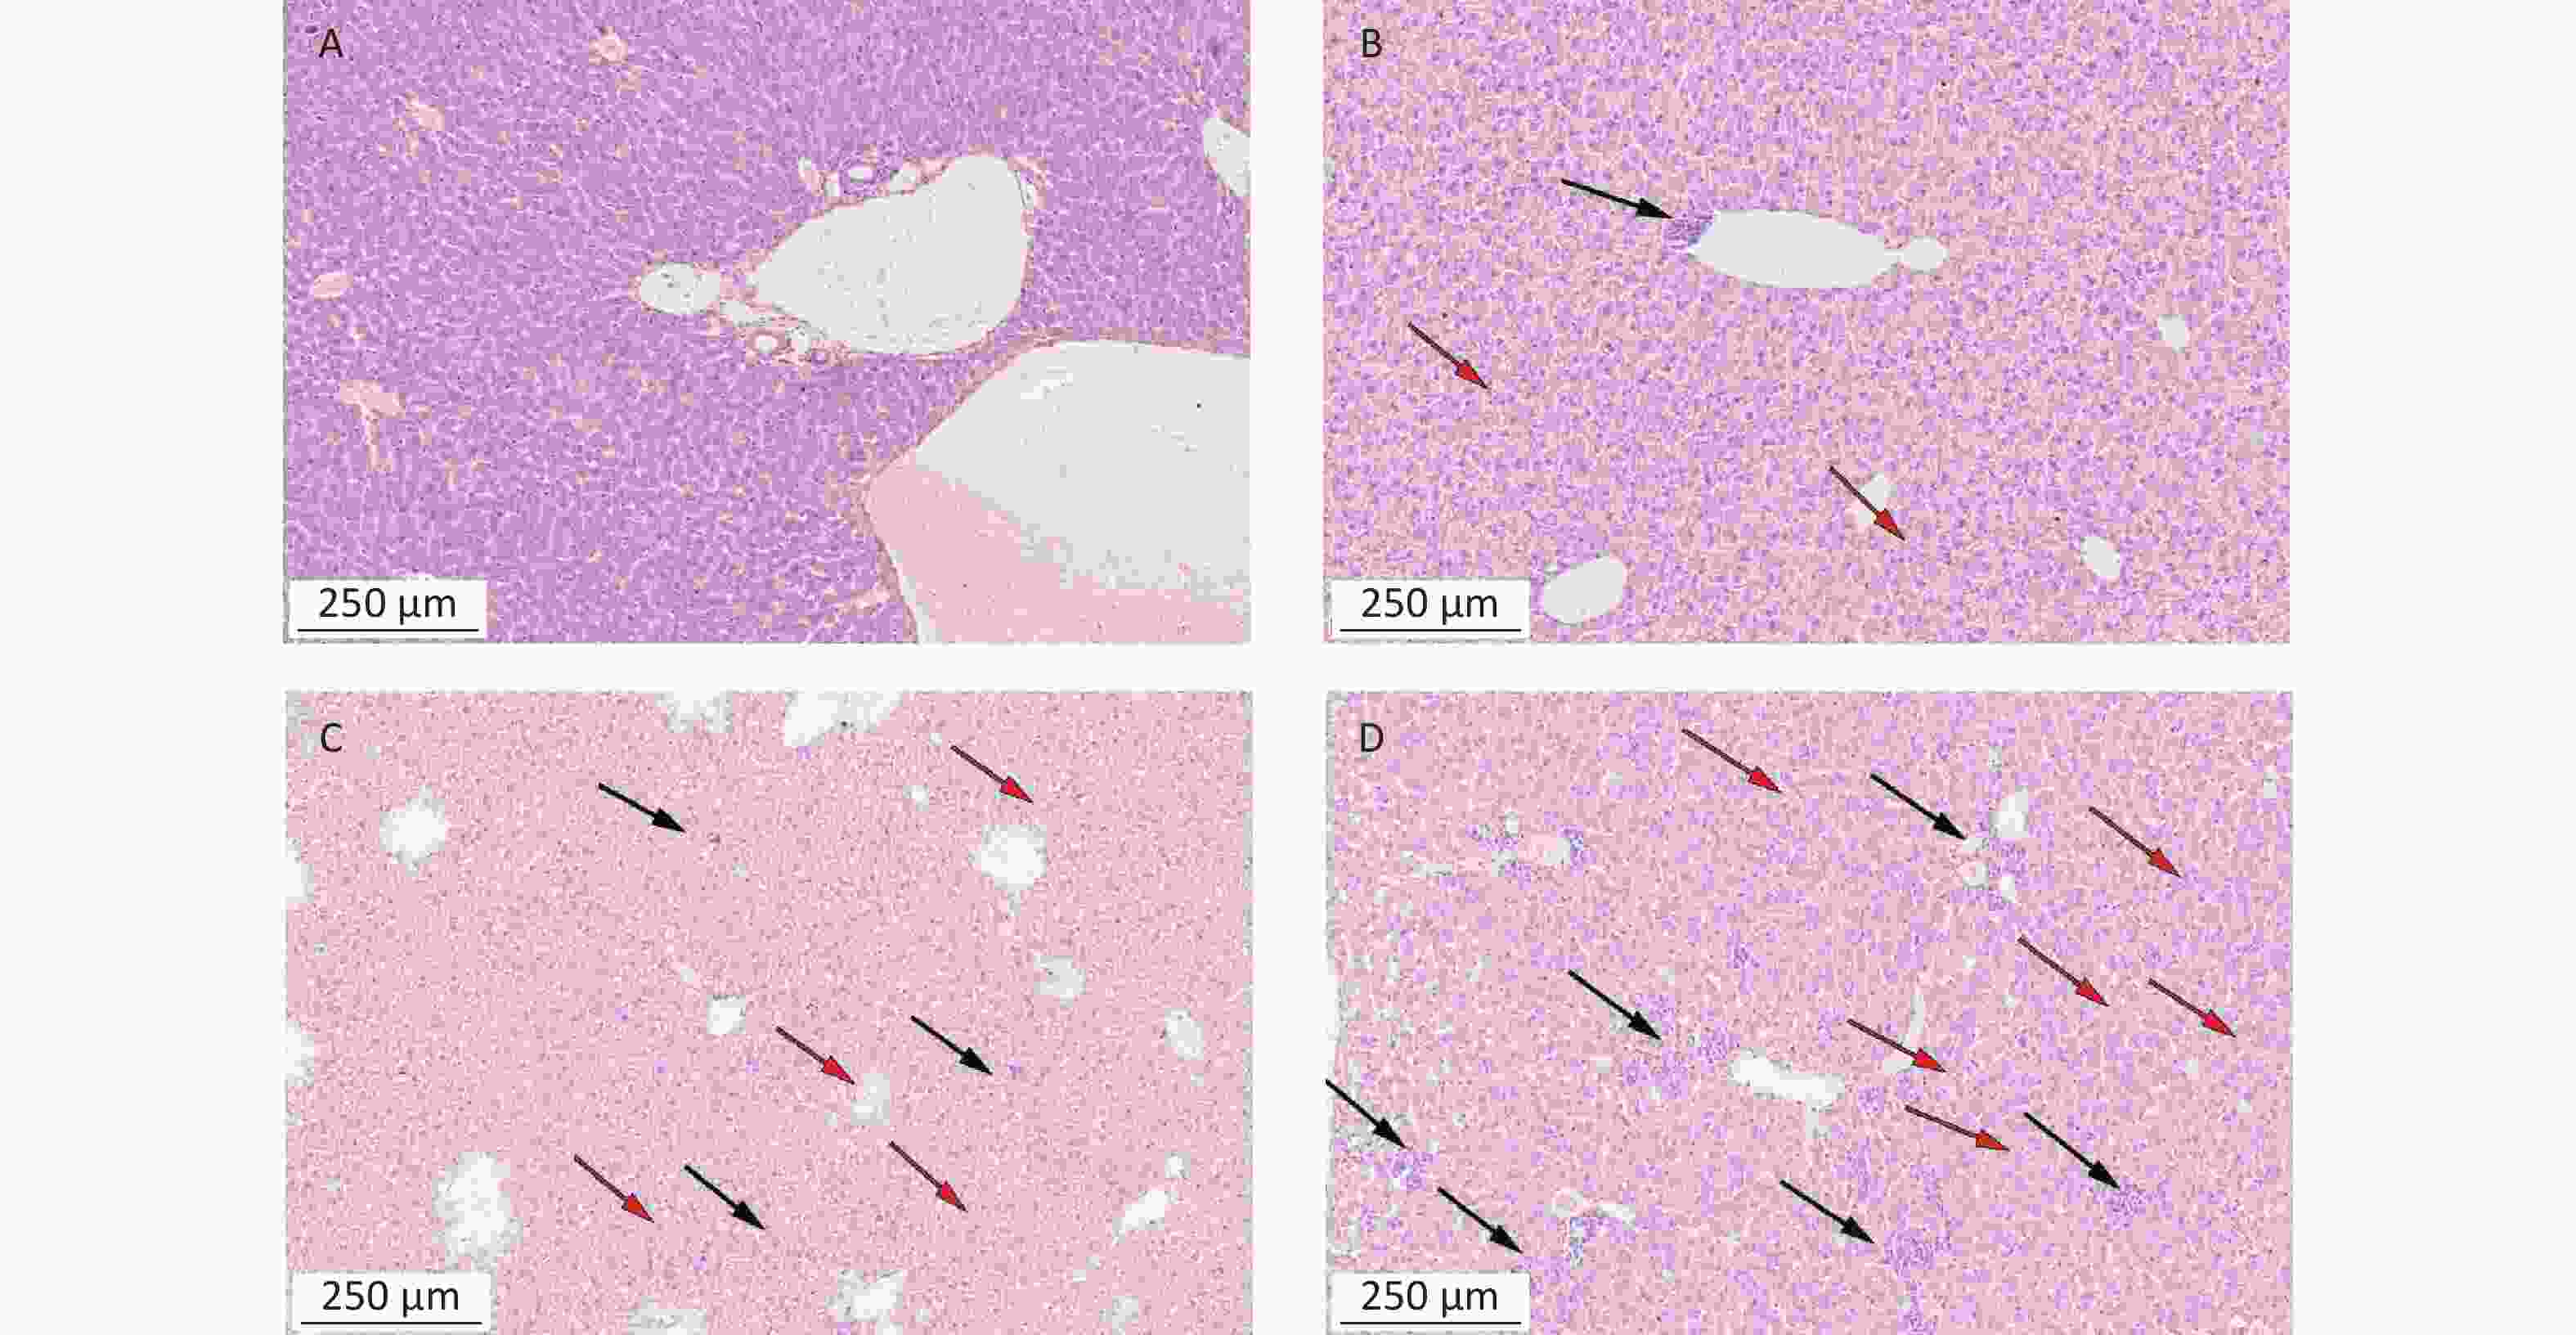
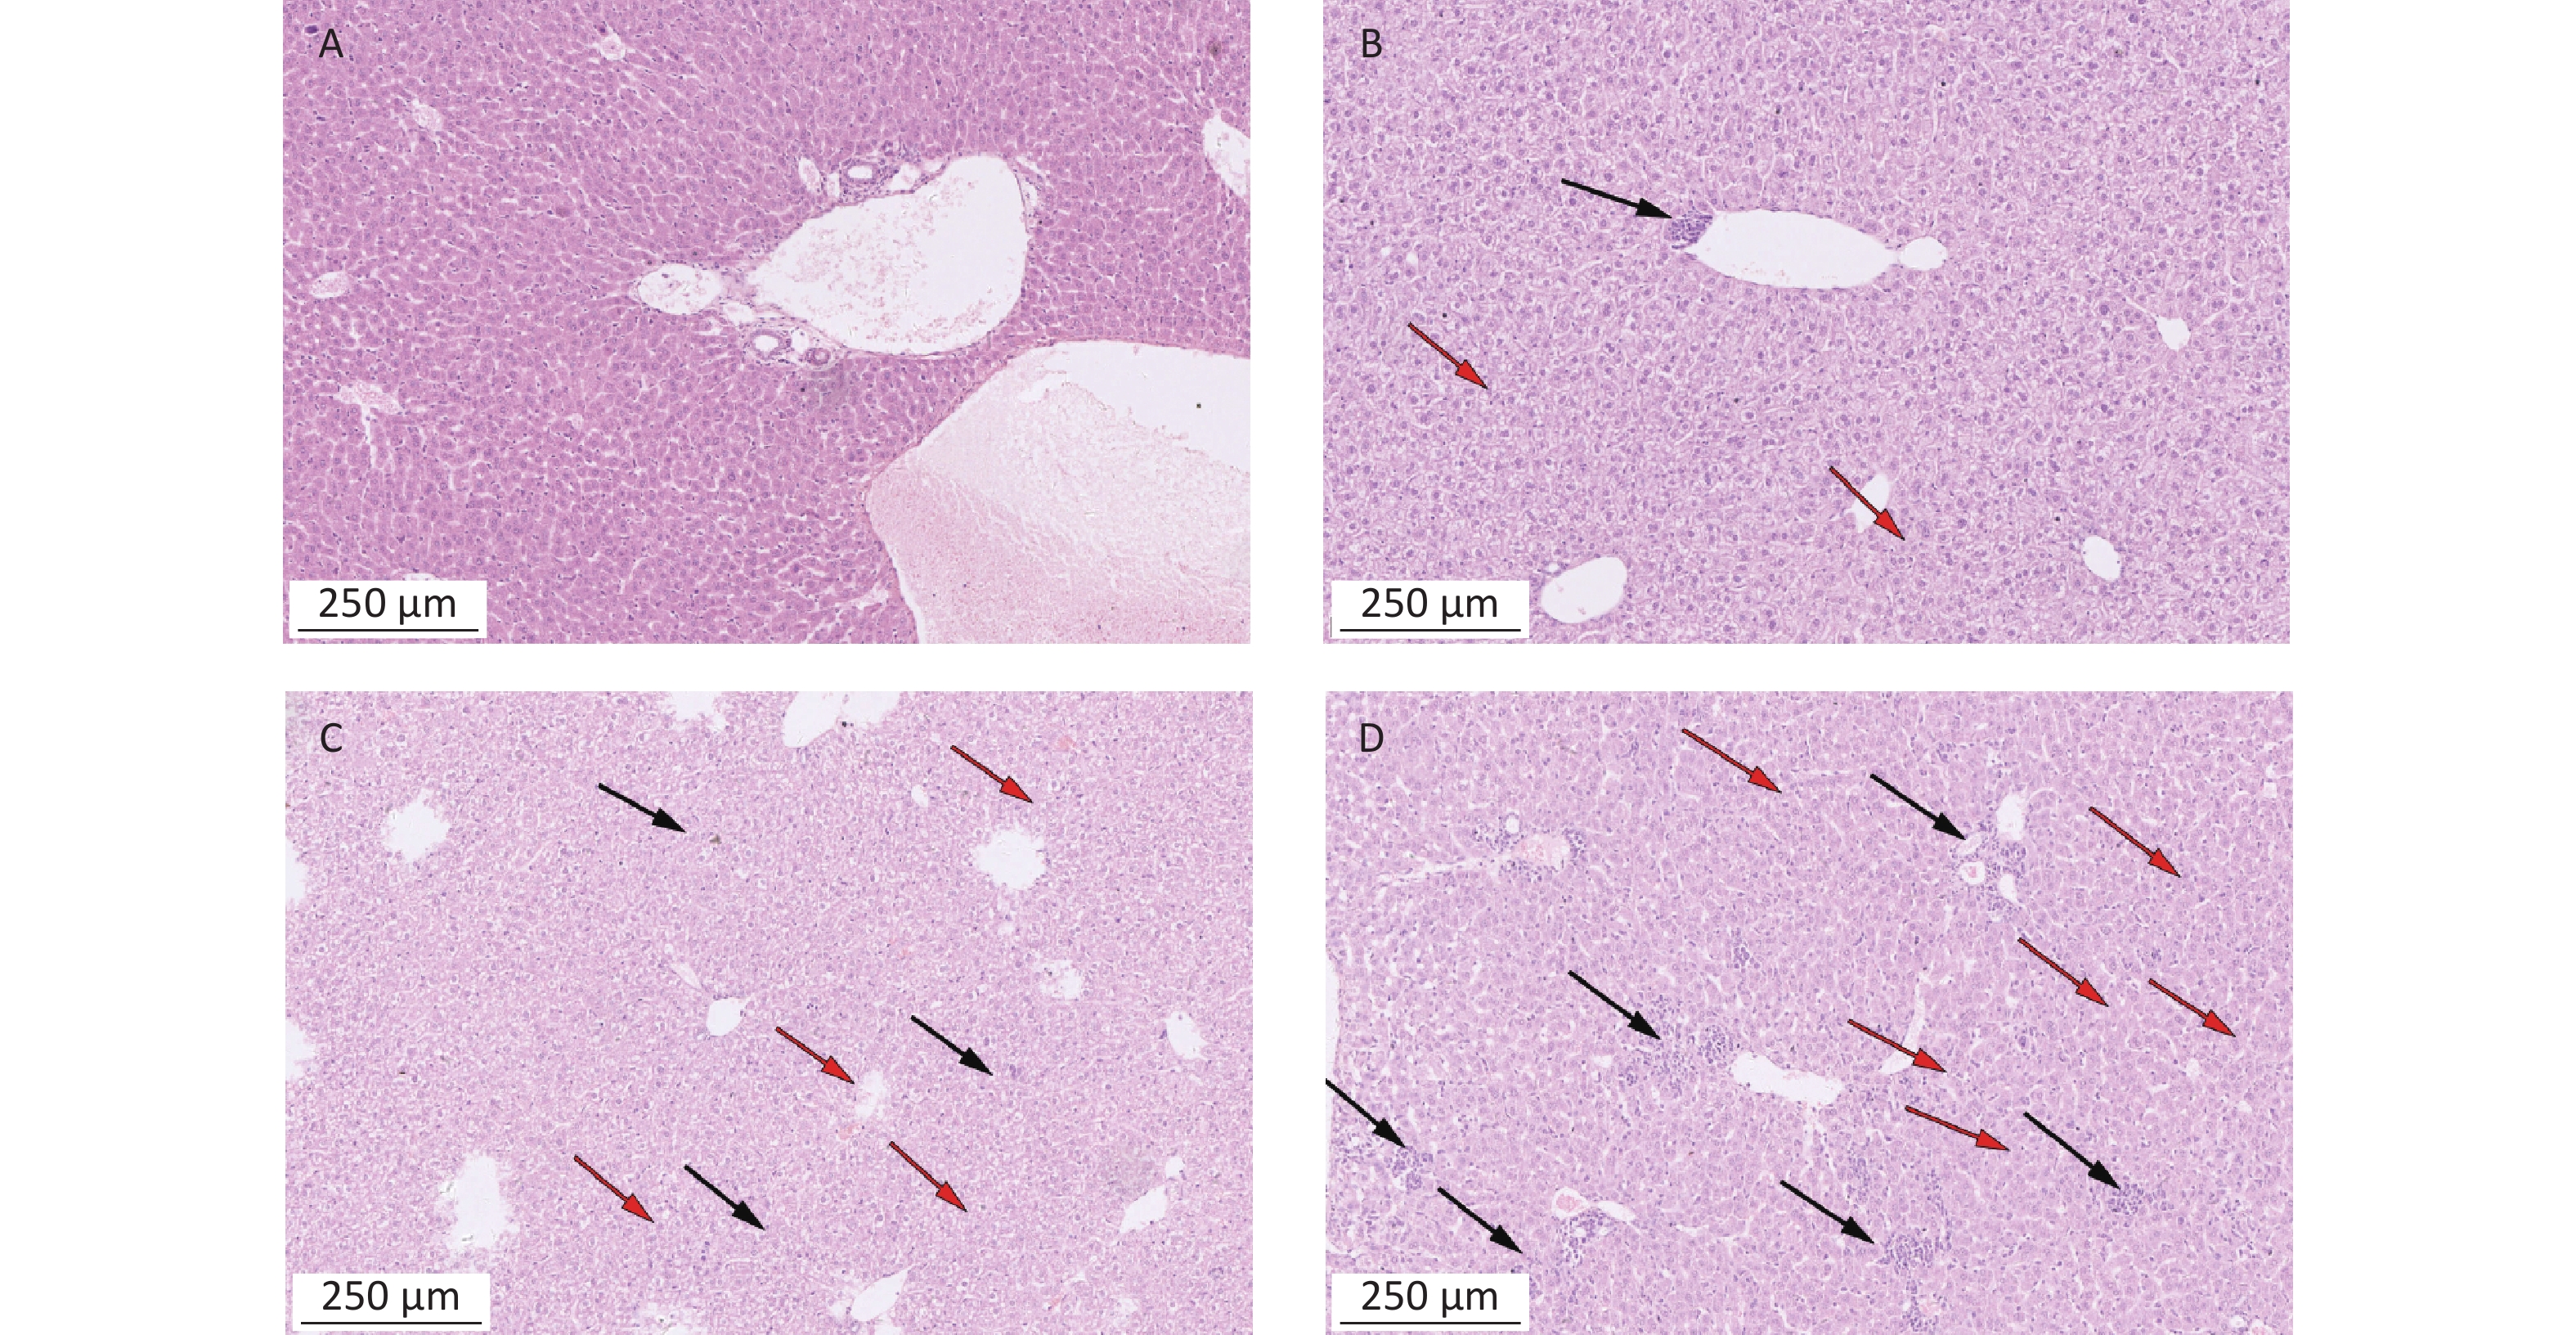
Figure S1. Histopathological images of liver tissues from mice exposed to α-amanitin. Tissues excised 48 h after administration of a single dose (μg/kg bw) of α-amanitin. (A) Control group (no α-amanitin), (B) low-dose group (0.1 μg/kg bw), (C) medium-dose group (0.2 μg/kg bw), and (D) high-dose group (0.3 μg/kg bw). Each image was visualized using a 100 × magnification factor. Black arrow, inflammatory infiltration; red arrow, necrosis and edema.
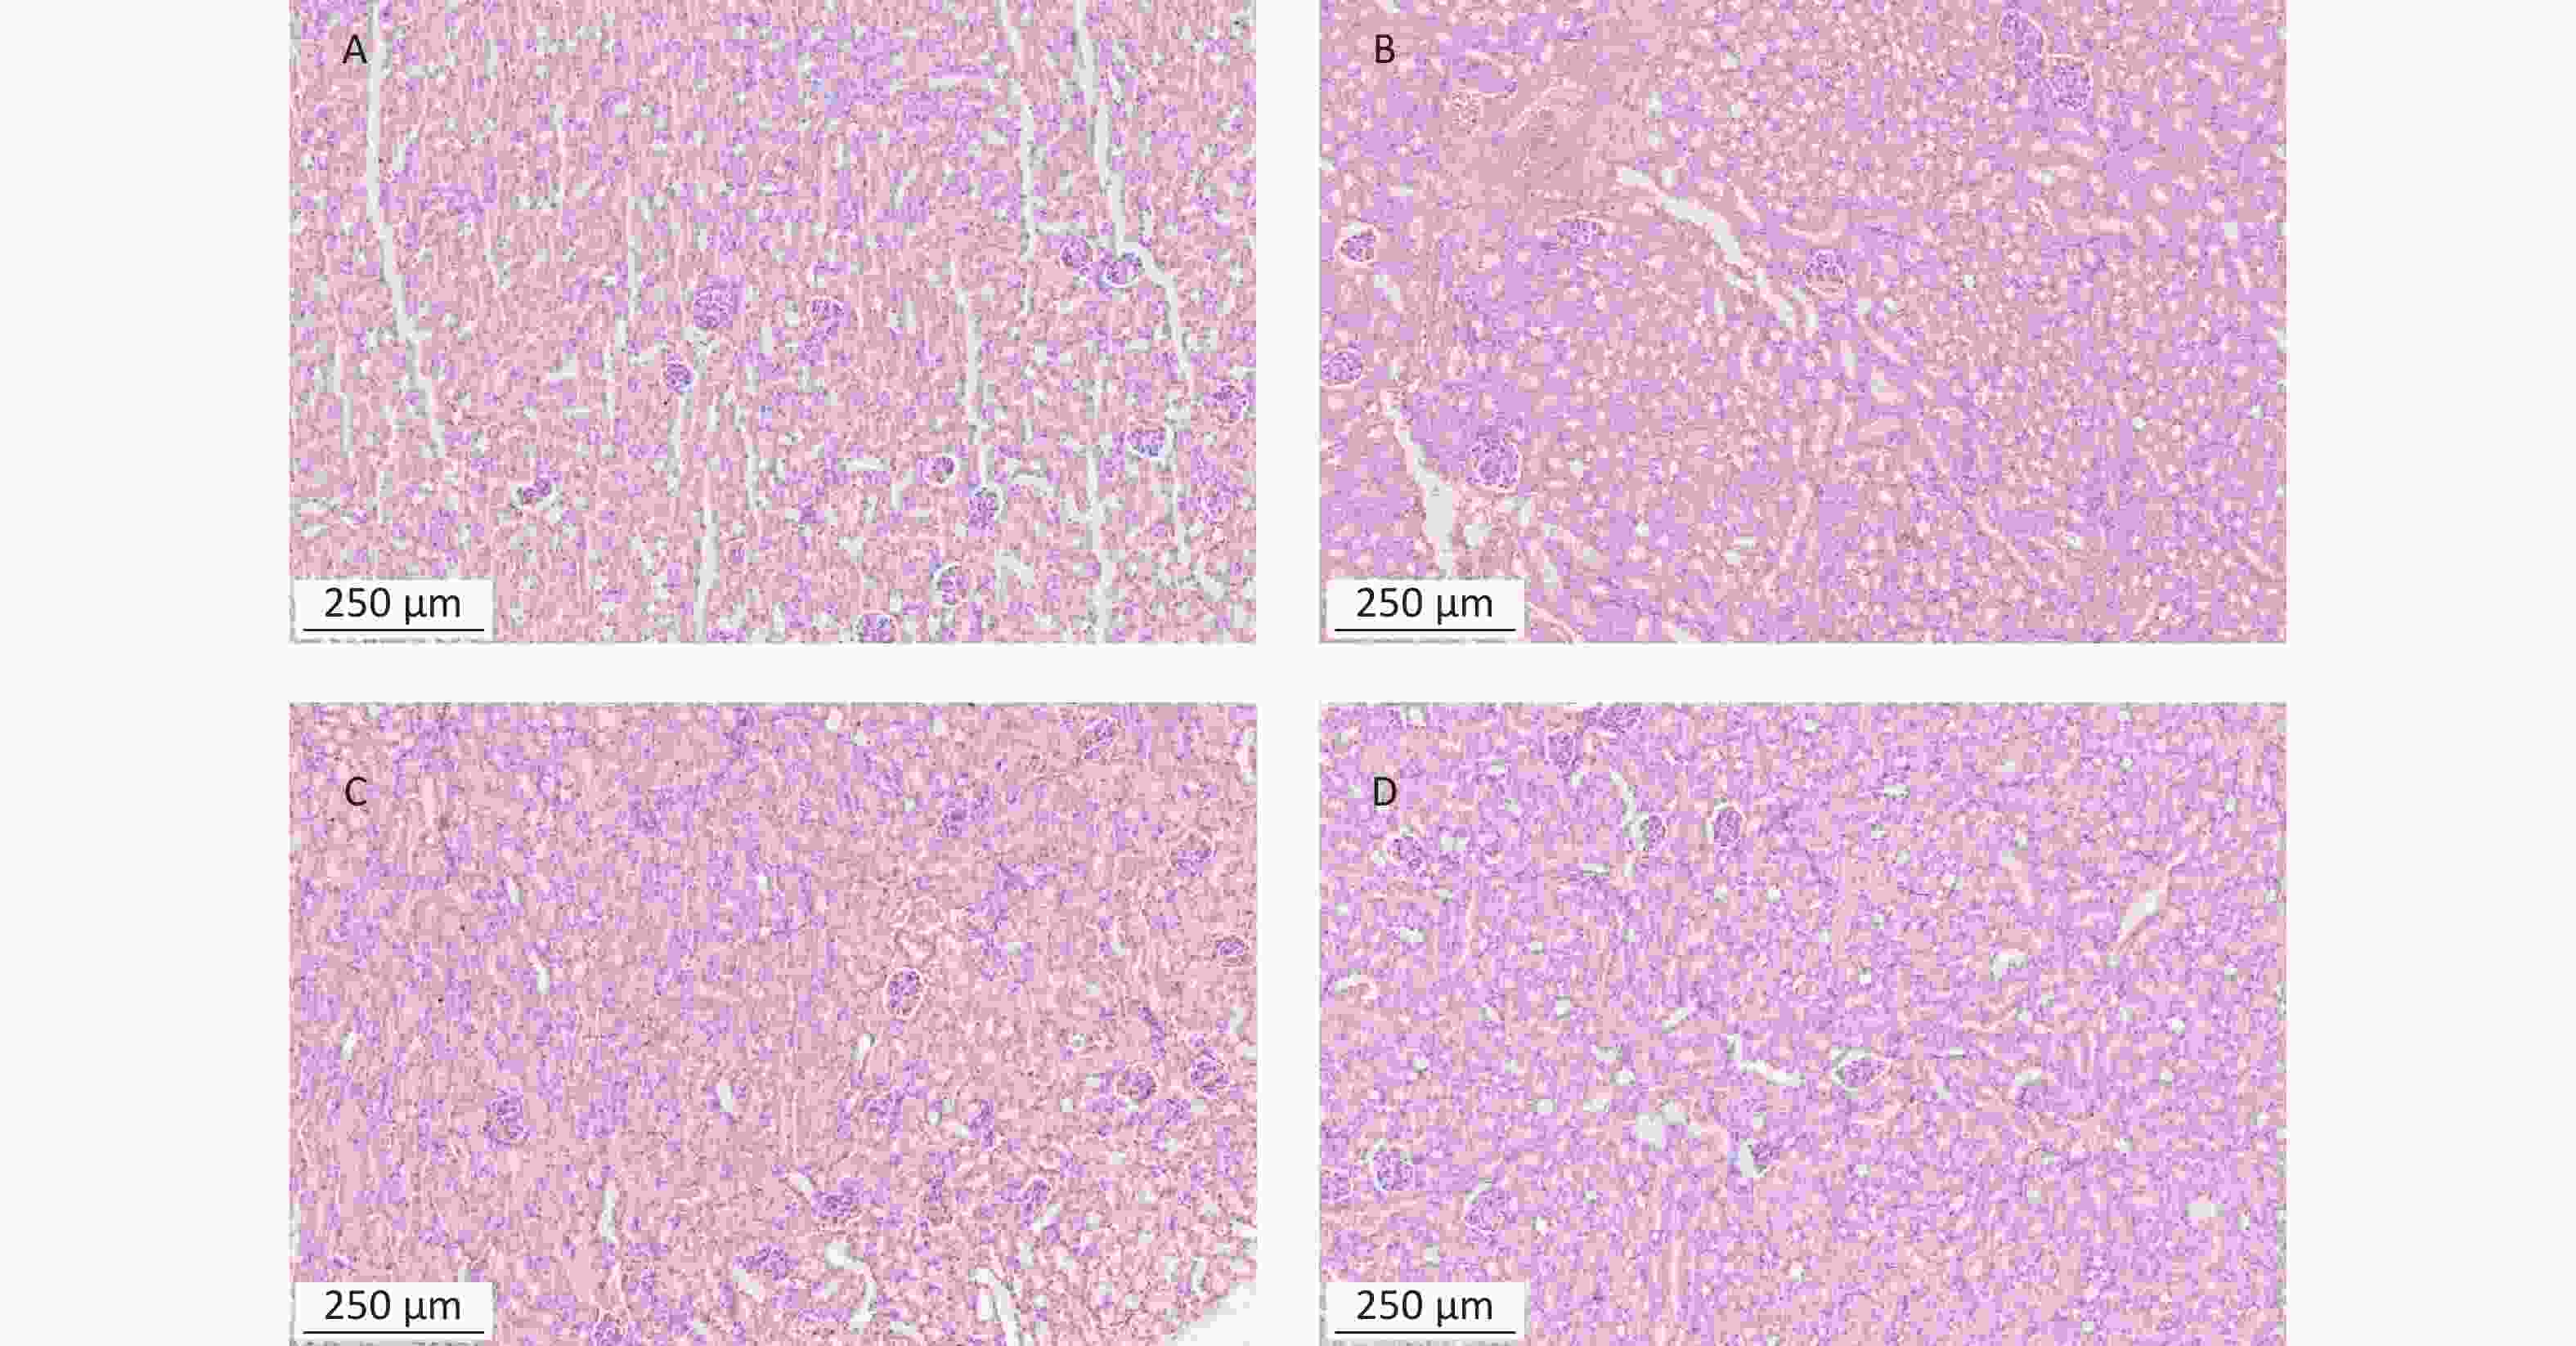
Figure S2. Histopathological images of kidney tissues from mice exposed to α-amanitin. Tissues were excised 48 h after administration of a single dose (μg/kg bw) of α-amanitin. (A) Control group (no α-amanitin), (B) low-dose group (0.1 μg/kg bw), (C) medium-dose group (0.2 μg/kg bw), and (D) high-dose group (0.3 μg/kg bw). Each image was visualized using a 100 × magnification factor.
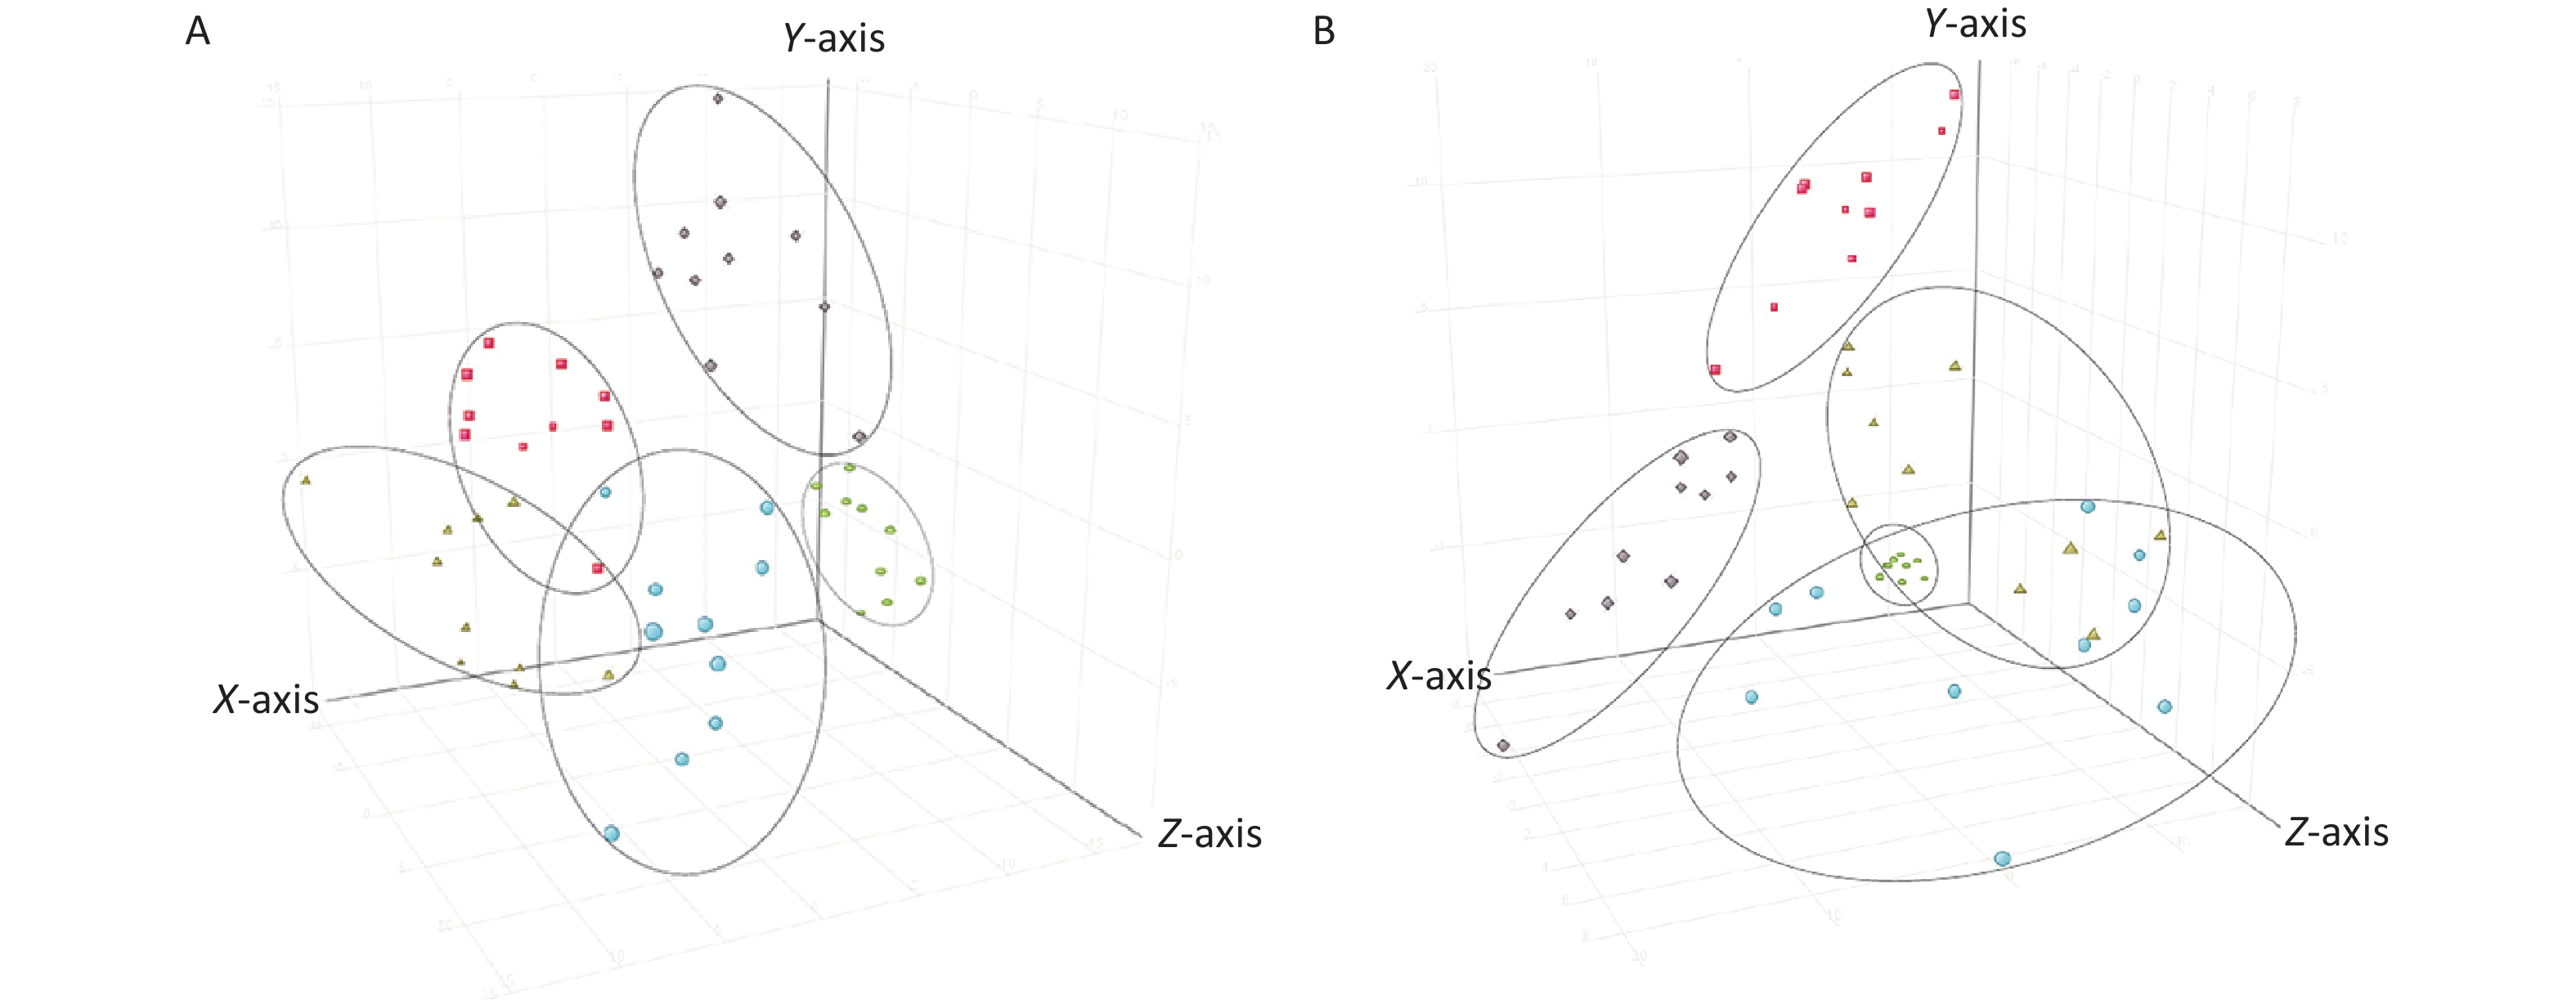
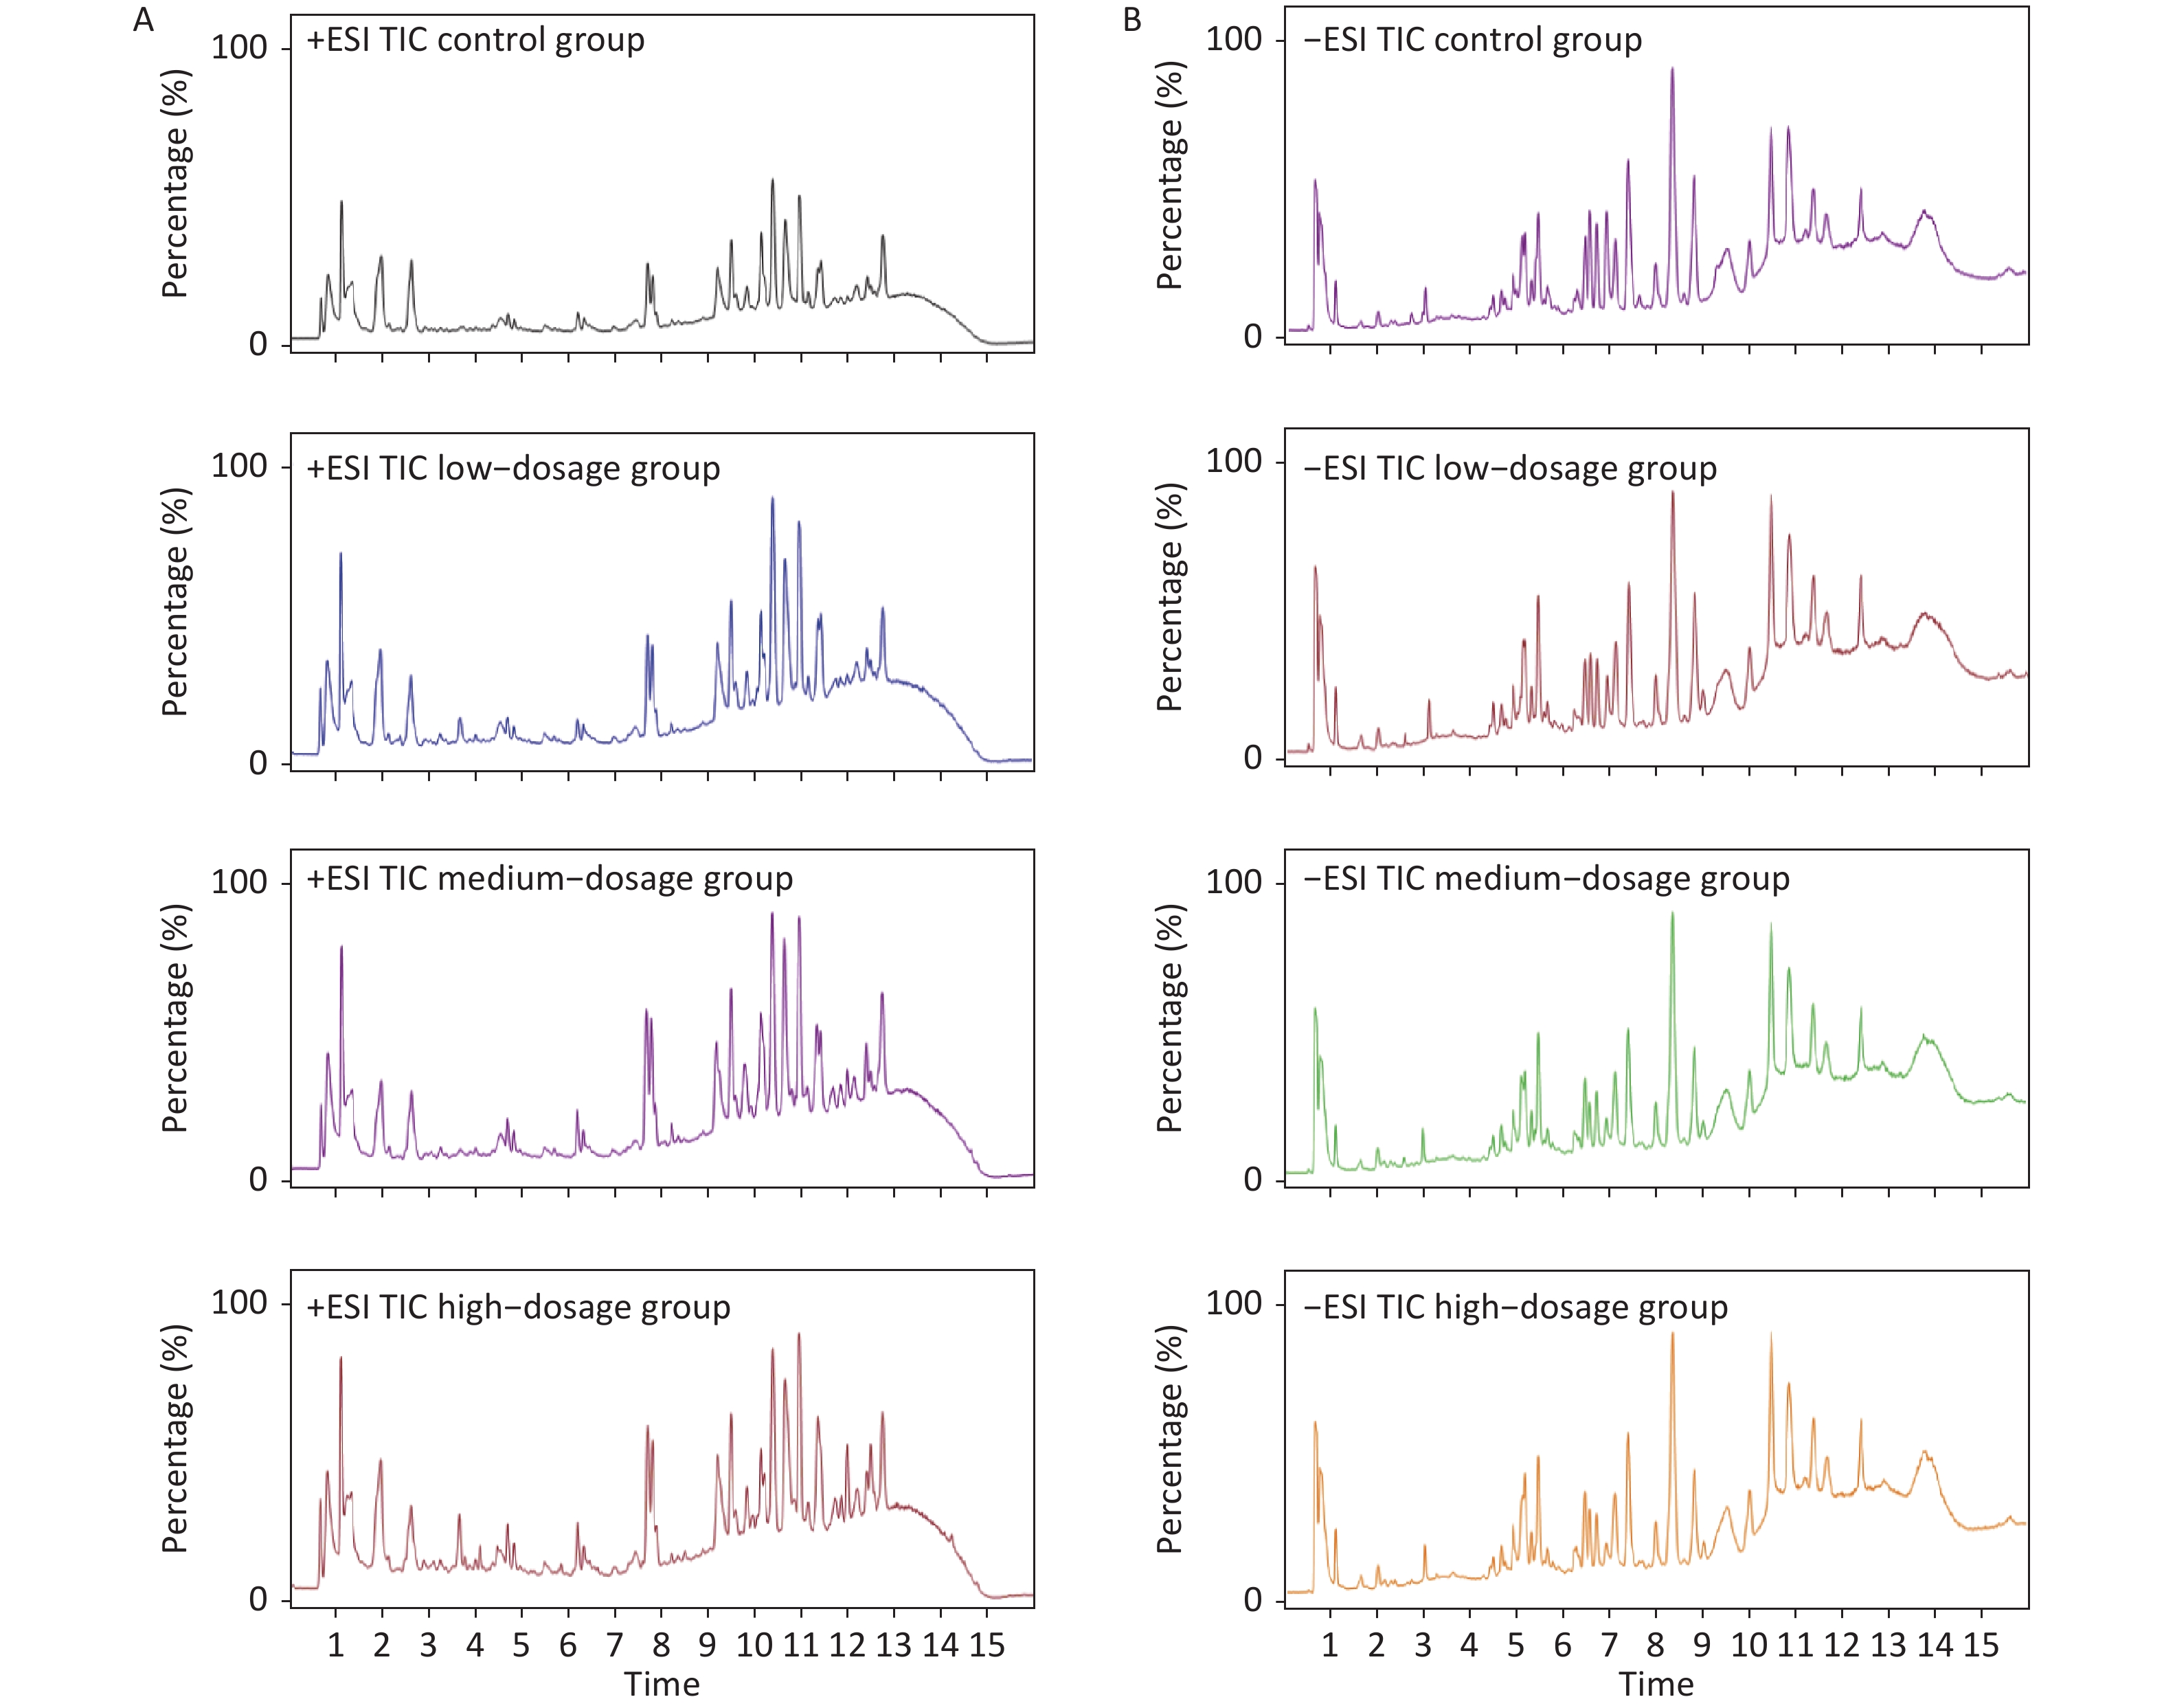
Metabolic profiling of samples was performed using the Mass Hunter Workstation Software (version B.08.00, Agilent, Santa Clara, CA, USA), with representative total ion chromatograms of samples in both the positive and negative modes from each group (Supplementary Figure S3 available in www.besjournal.com). Differences in sample metabolite levels were then analyzed using Mass Profiler Professional (version 15.1, Agilent, Santa Clara, CA, USA) to generate a 3-dimensional Principal Component Analysis (PCA) plot of metabolomic data, which enabled sample variance and distribution to be determined both within and between each group. The PCA score plots were used to divide the positive and negative ion mode data for all groups analyzed (Figure 1). These analyses revealed a distinct grouping trend, with the positive ion mode producing three principal components [PC 1 (32.8%), PC 2 (17.8%) and PC 3 (9.9%), Figure 1A; the negative ion mode also producing three principal components [PC 1 (25.4%), PC 2 (12.0%) and PC 3 (11.2%), Figure 1B. The Qc group showed similar clustering in both the positive and negative ion modes, which complemented the datasets generated by the individual samples (Supplementary Table S1 available in www.besjournal.com). The data for the control group and α-amanitin groups were well separated, with data for the groups treated with different doses of α-amanitin also distinctly separated, suggesting that α-amanitin has a significant effect on the metabolism of certain endogenous metabolites.
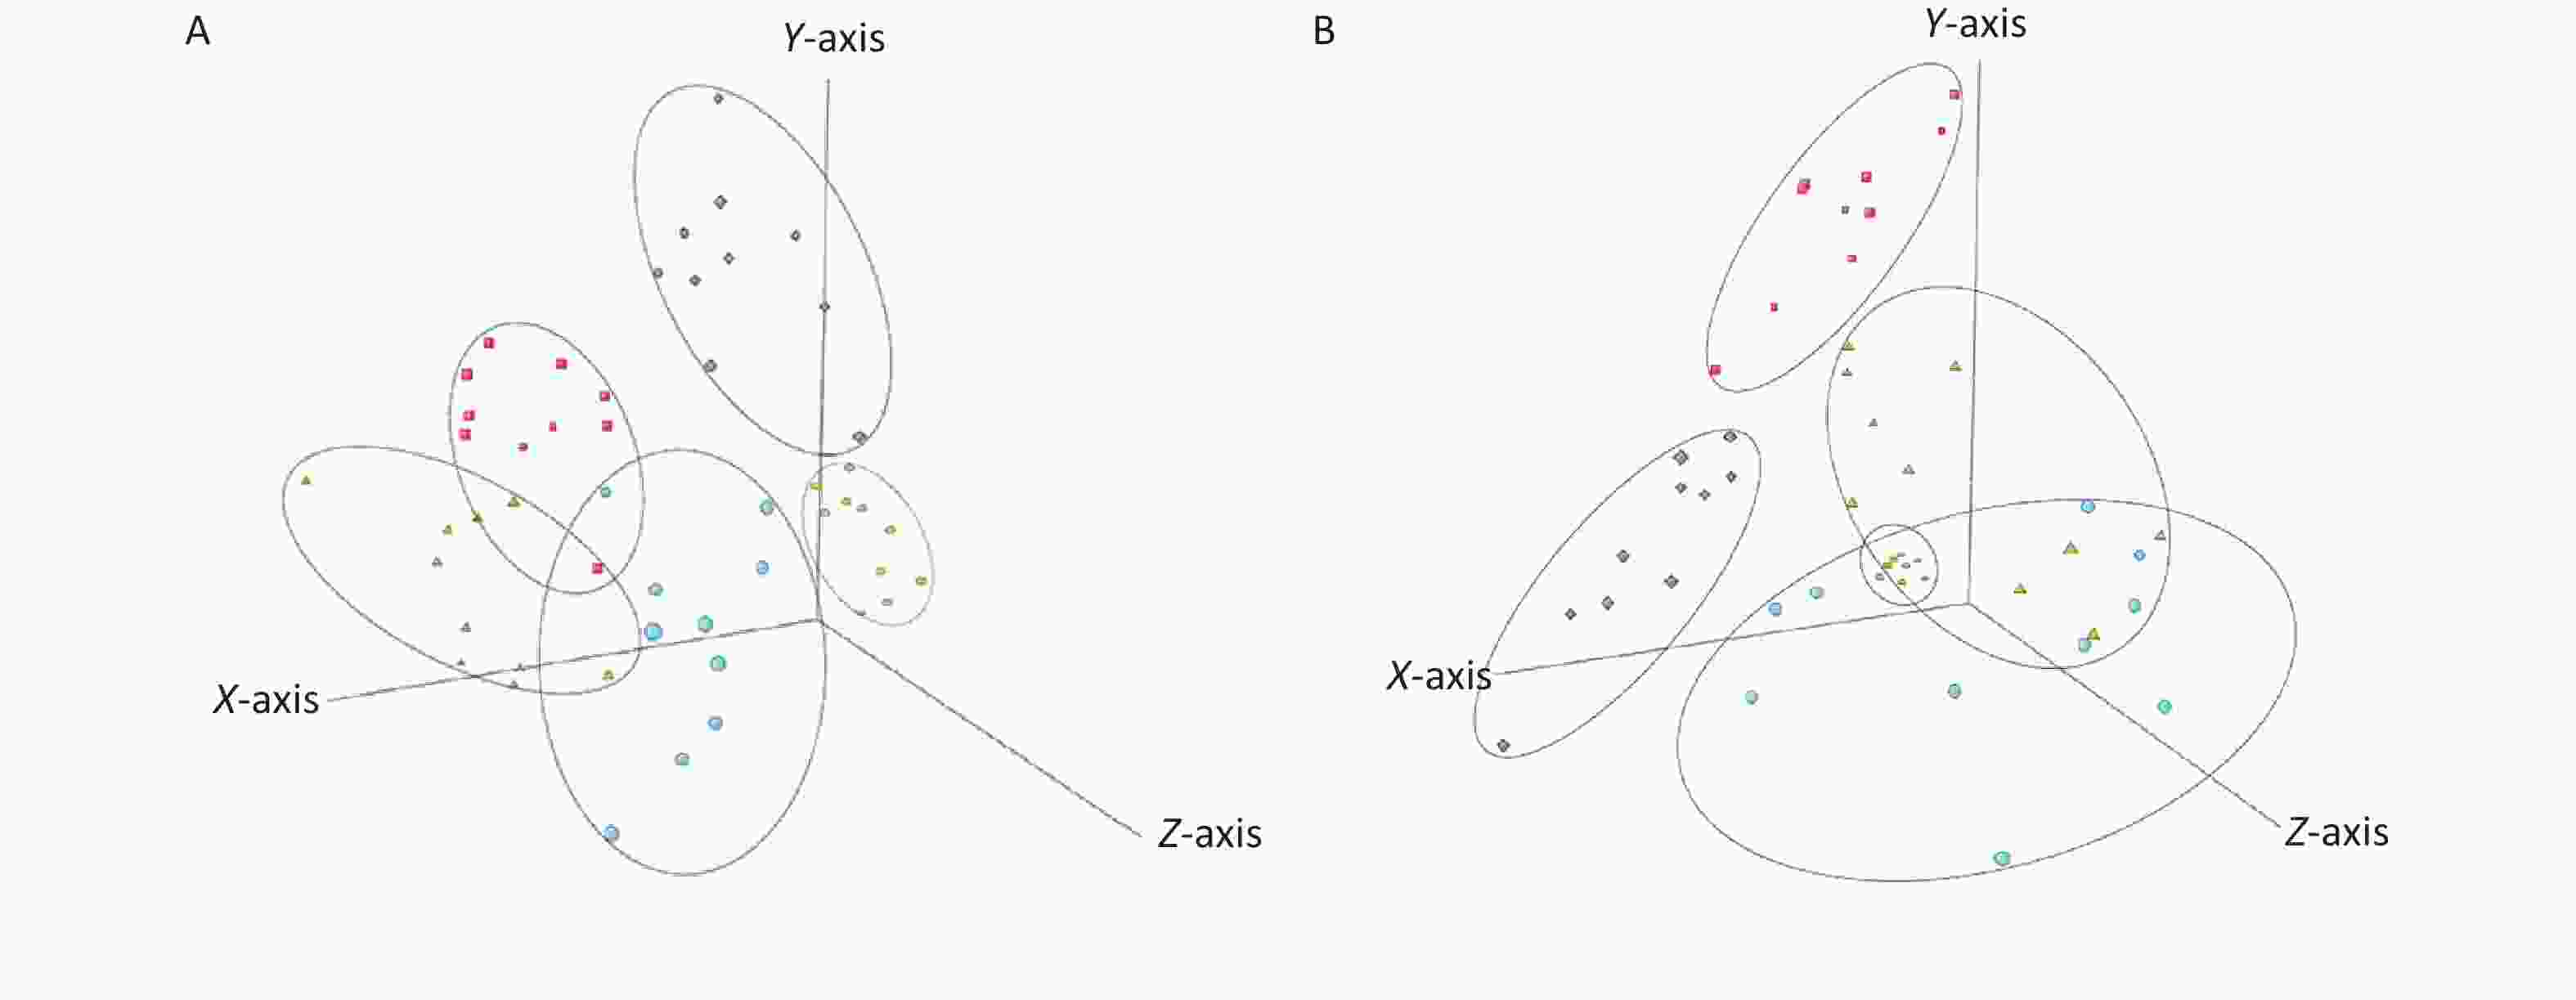
Figure 1. Three dimensional principal component analysis score plots of plasma samples from mice from different treatment groups and their quality control (Qc) samples analyzed in (A) ESI+ mode and (B) ESI- mode. Semicircles = Qc group; rhombi = control group; squares = low-dose group (0.1 μg/kg bw); triangles = medium-dose group (0.2 μg/kg bw); circles = high-dose group (0.3 μg/kg bw).
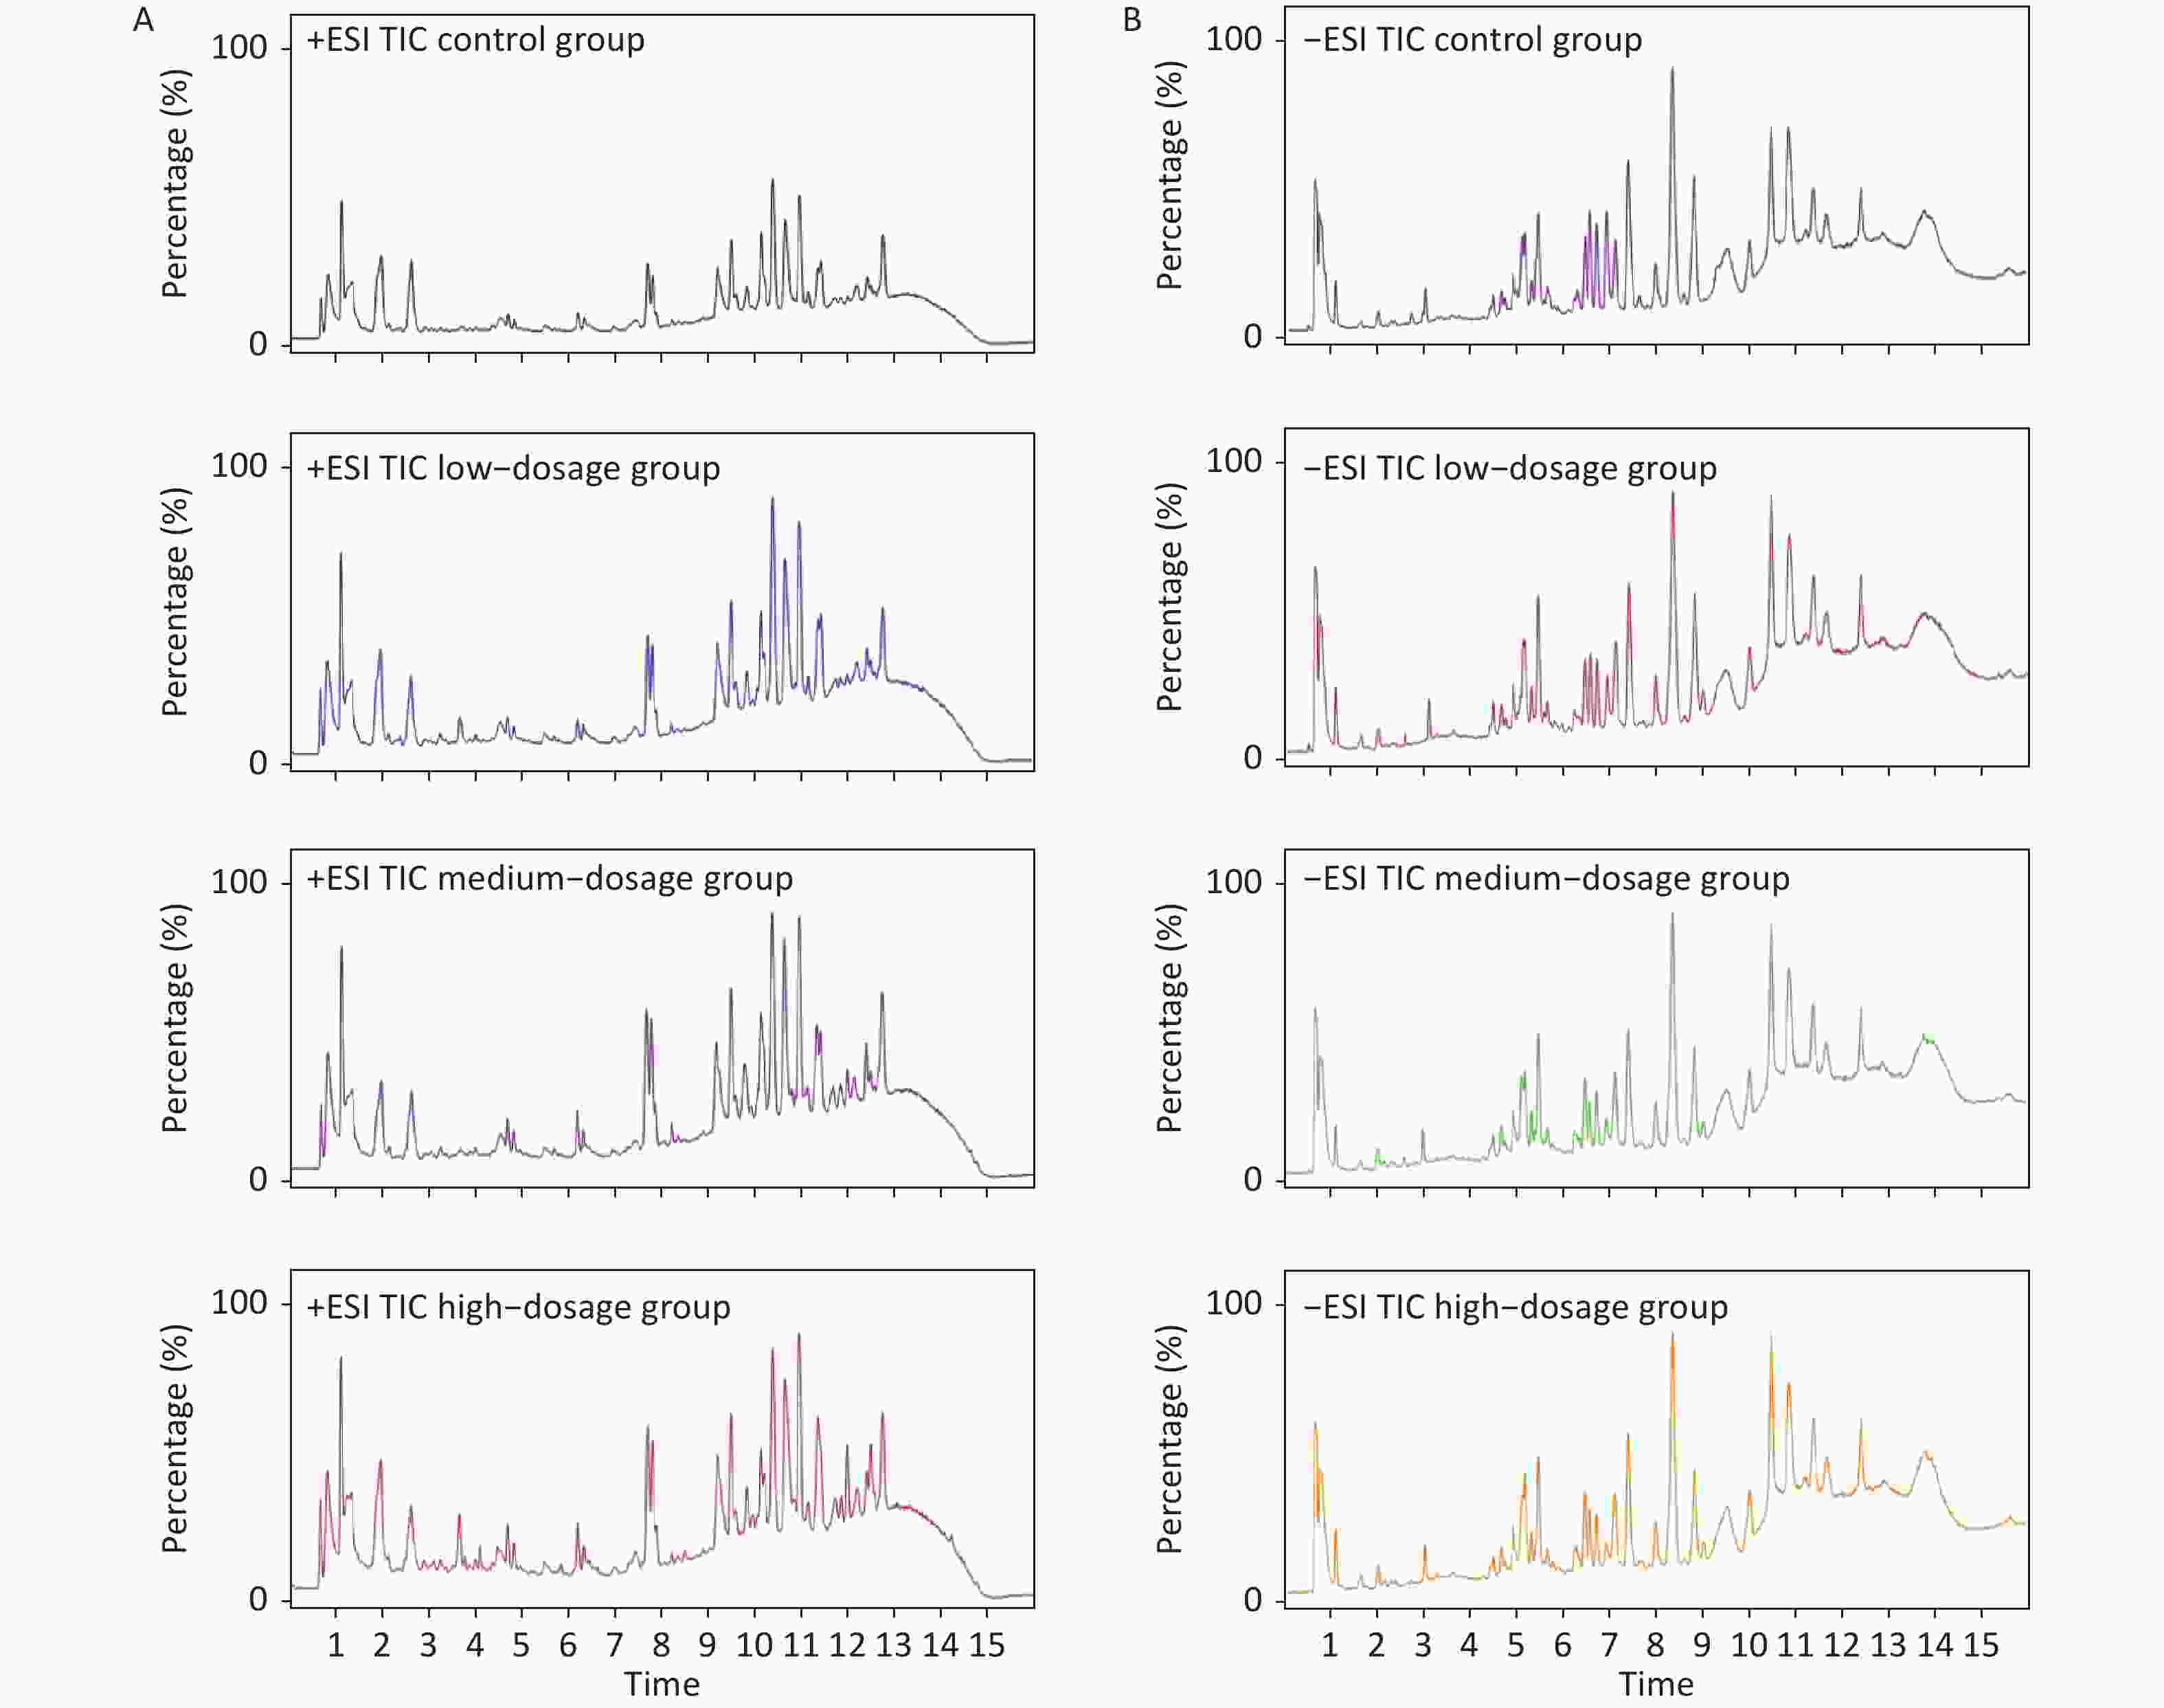
Figure S3. Representative total ion chromatograms (TIC ESI+ [A] and ESI- [B] ) produced from UPLC-Q/TOF-MS analyses of samples extracted from mice from different treatment groups.
Peaks of ions that were significantly changed (P < 0.05) and those exhibiting relative FC > 2.0, and VIP > 1 were identified as potential metabolites for investigation, and selected ions were identified by comparison with ion data stored in the online Human Metabolome (
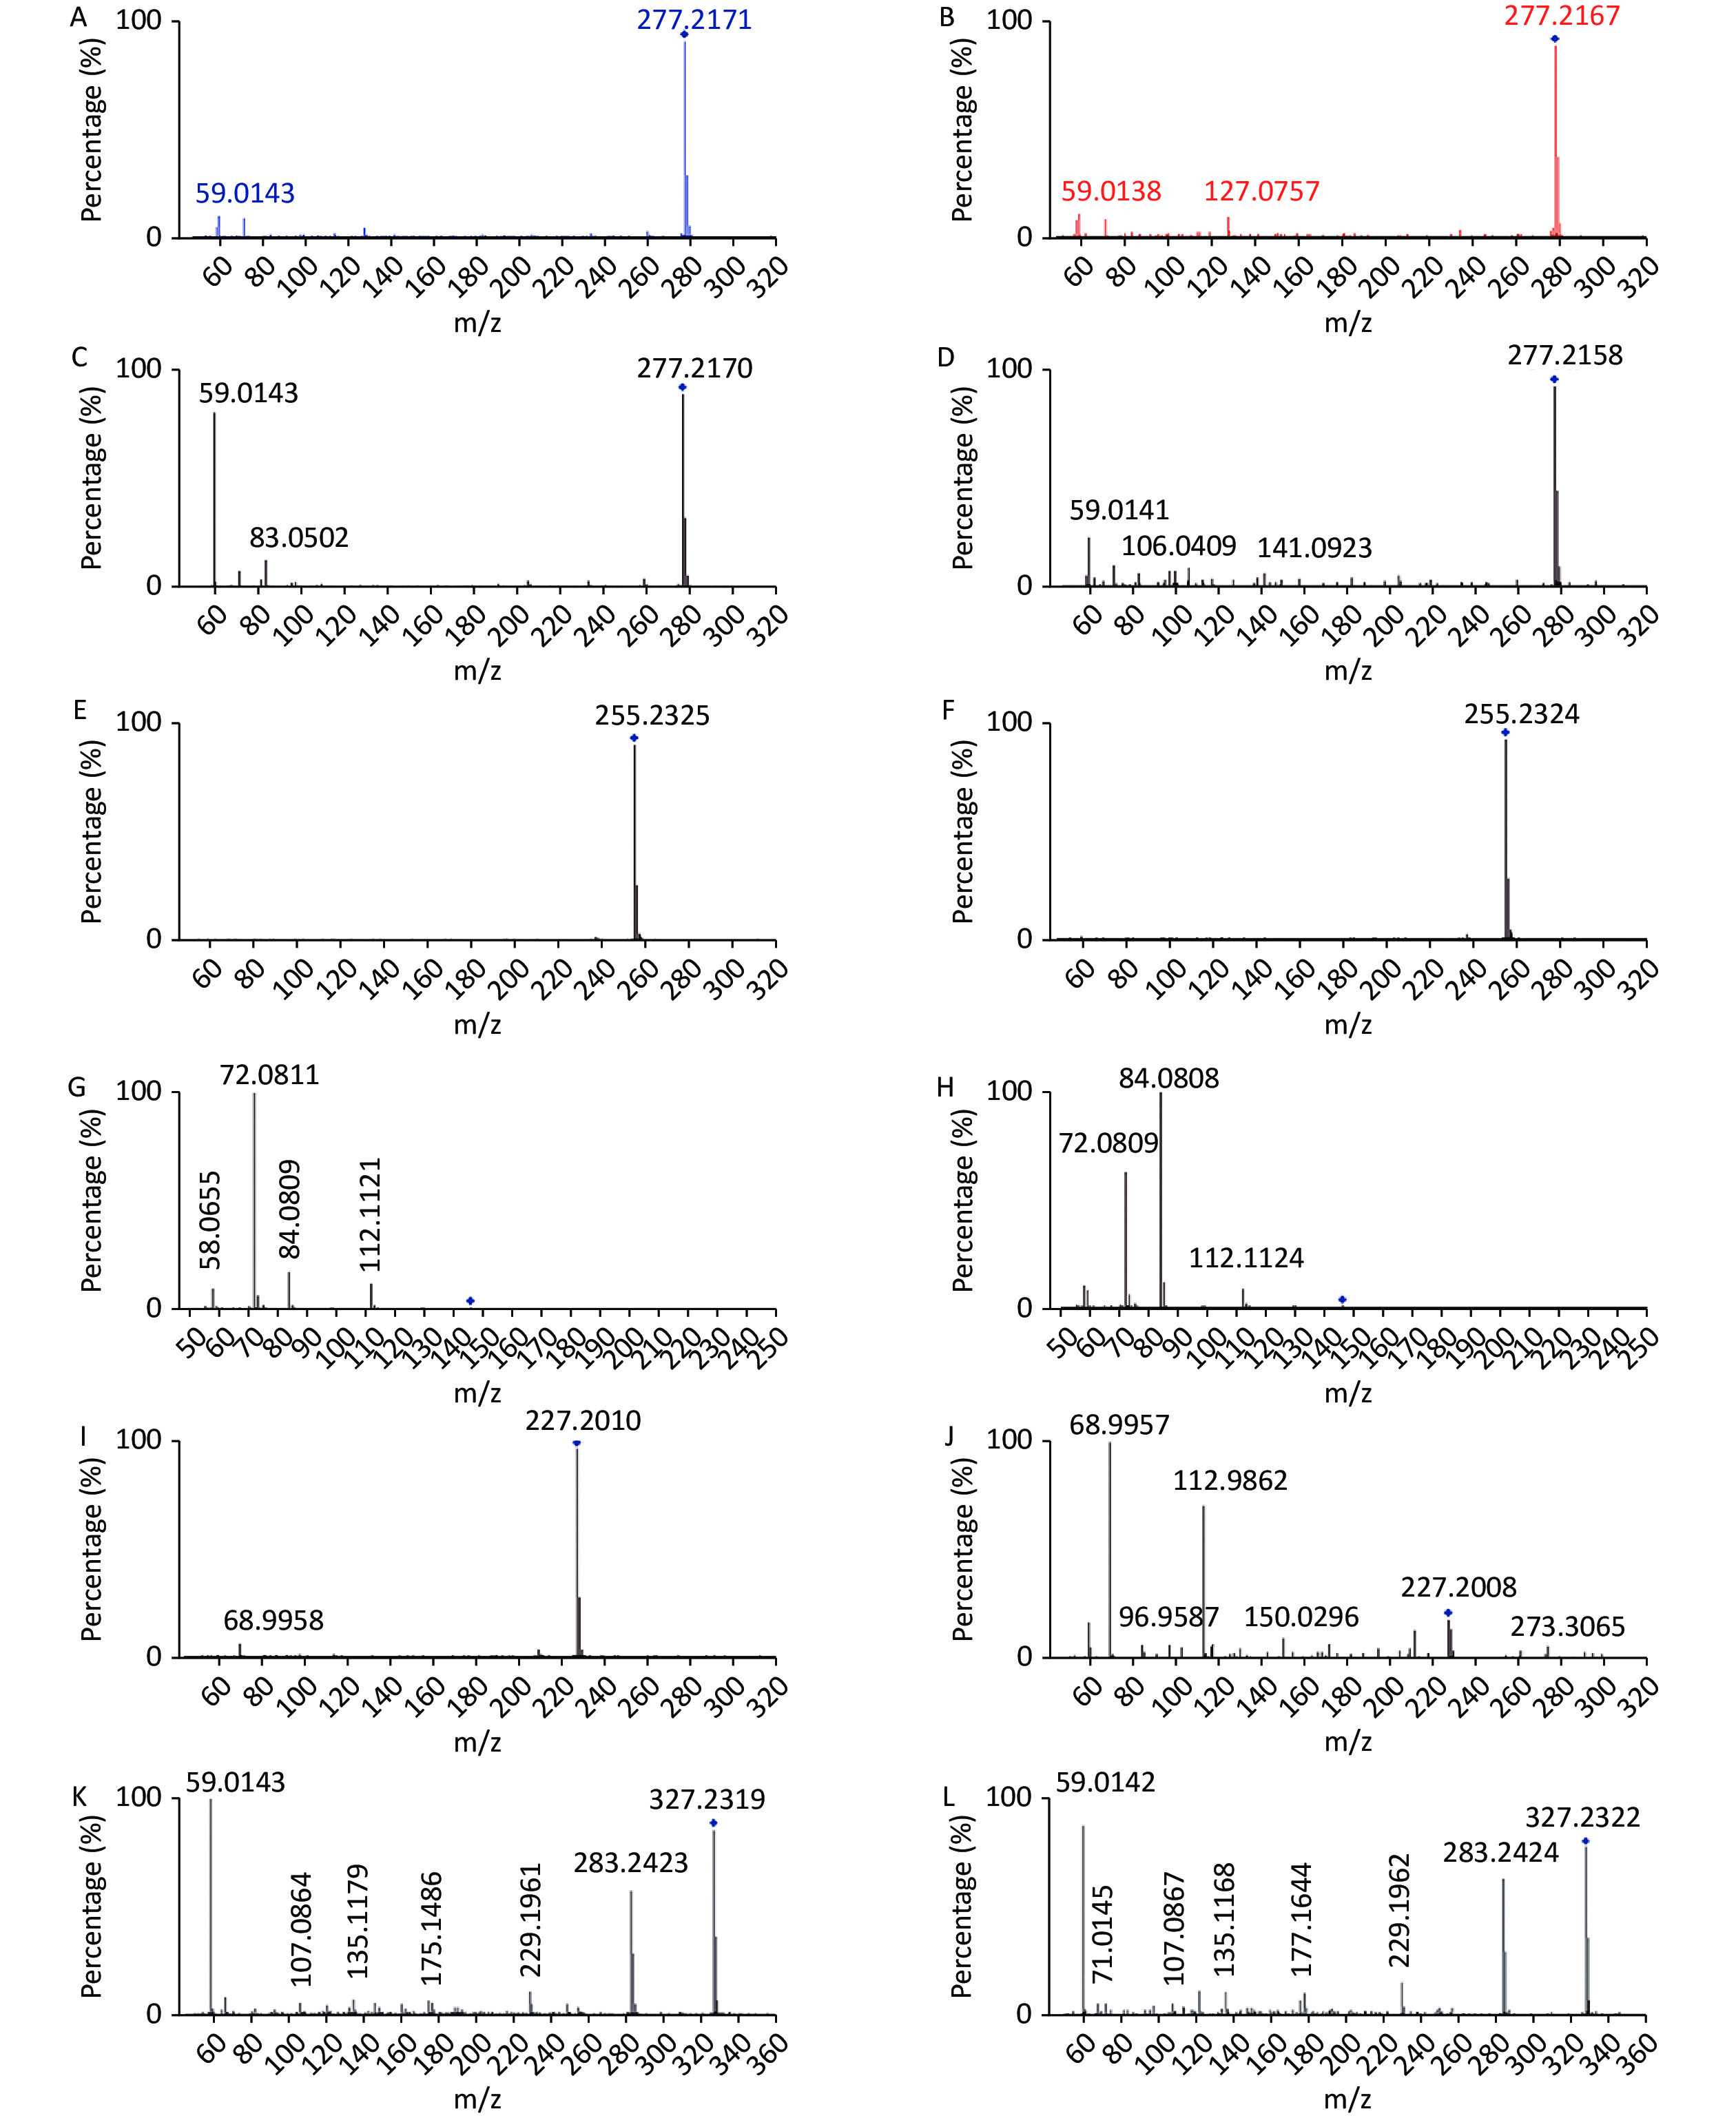
www.hmdb.ca ) and METLINE (http://metlin.scripps.edu ) databases. The mass tolerances between the measured m/z values and the exact masses of the compounds were set to 10 ppm. Ten different metabolites of interest were identified from their accurate masses and MS/MS fragments, and the structures of six of these metabolites were verified by comparing their retention times and MS/MS fragmentation patterns with those of reference compounds (Table 1 and Figure 2). Serum samples containing increased doses of α-amanitin were found to contain increased levels of retinal, retinyl ester, spermidine, propionylcarnitine, docosahexaenoic acid, myristic acid, palmitic acid, α-linolenic acid, and γ-linolenic acid (P < 0.01), whereas levels of tetracosapentaenoic acid (24:5n-6) were significantly decreased (P < 0.01). The metabolic pathways responsible for the production of these metabolites were analyzed using MetaboAnalyst 5.0, which revealed that the metabolic pathways responsible for the production of α-linolenic acid and linoleic acid, fatty acid biosynthesis, spermidine and spermine biosynthesis, and retinol metabolism were perturbed in the presence of α-amanitin (Supplementary Figure S4 available in www.besjournal.com).Potential
metabolitesRetention
time (min)Mass
SubmittedMass Delta
(ppm)P-value Fold change VIP Qc group
CV (%)Ion mode Related pathway Retinalb 11.52 284.2143 284.2140 1 8.70 × 10⁻⁷ 2.13 1.24 2.46 Positive Retinol Metabolism Retinyl esterb 11.55 302.2244 302.2246 1 5.87 × 10⁻⁷ 2.33 1.38 3.71 Positive Retinol Metabolism Spermidinea 0.69 145.1577 145.1579 1 7.38 × 10⁻⁷ 3.29 1.08 3.11 Positive Spermidine and
Spermine
BiosynthesisPropionylcarnitineb 0.98 217.1308 217.1314 3 4.96 × 10⁻⁴ 2.08 1.76 4.28 Positive Oxidation of
Branched Chain
Fatty AcidsDocosahexaenoic
acida11.91 328.2412 328.2402 3 2.29 × 10⁻⁴ 2.48 2.15 2.67 Negative α-Linolenic Acid
MetabolismMyristic acida 6.75 228.2088 228.2089 1 4.00 × 10⁻⁴ 3.64 4.34 2.07 Negative Fatty Acid
BiosynthesisPalmitic acida 8.35 256.2399 256.2402 1 5.22 × 10⁻⁴ 2.08 3.13 1.20 Negative Fatty Acid
Biosynthesisα-Linolenic acida 6.32 278.2244 278.2246 1 8.91 × 10⁻⁶ 2.17 2.76 4.01 Negative α-Linolenic Acid
Metabolismγ-Linolenic acida 6.63 278.2247 278.2246 1 5.49 × 10⁻⁶ 2.42 2.54 4.74 Negative α-Linolenic Acid
MetabolismTetracosapentaenoic
acid (24:5n-6)b9.31 358.2871 358.2872 1 2.84 × 10⁻⁴ 2.37 1.44 4.47 Negative α-Linolenic Acid
MetabolismNote. aIons that were identified through comparison with standard chemicals. bBiomarkers identified using the Human Metabolome Database (HMDB) and METLINE database. VIP, Variable important in projection. Table 1. Statistical analysis of differences in potential metabolites after α-amanitin treatment
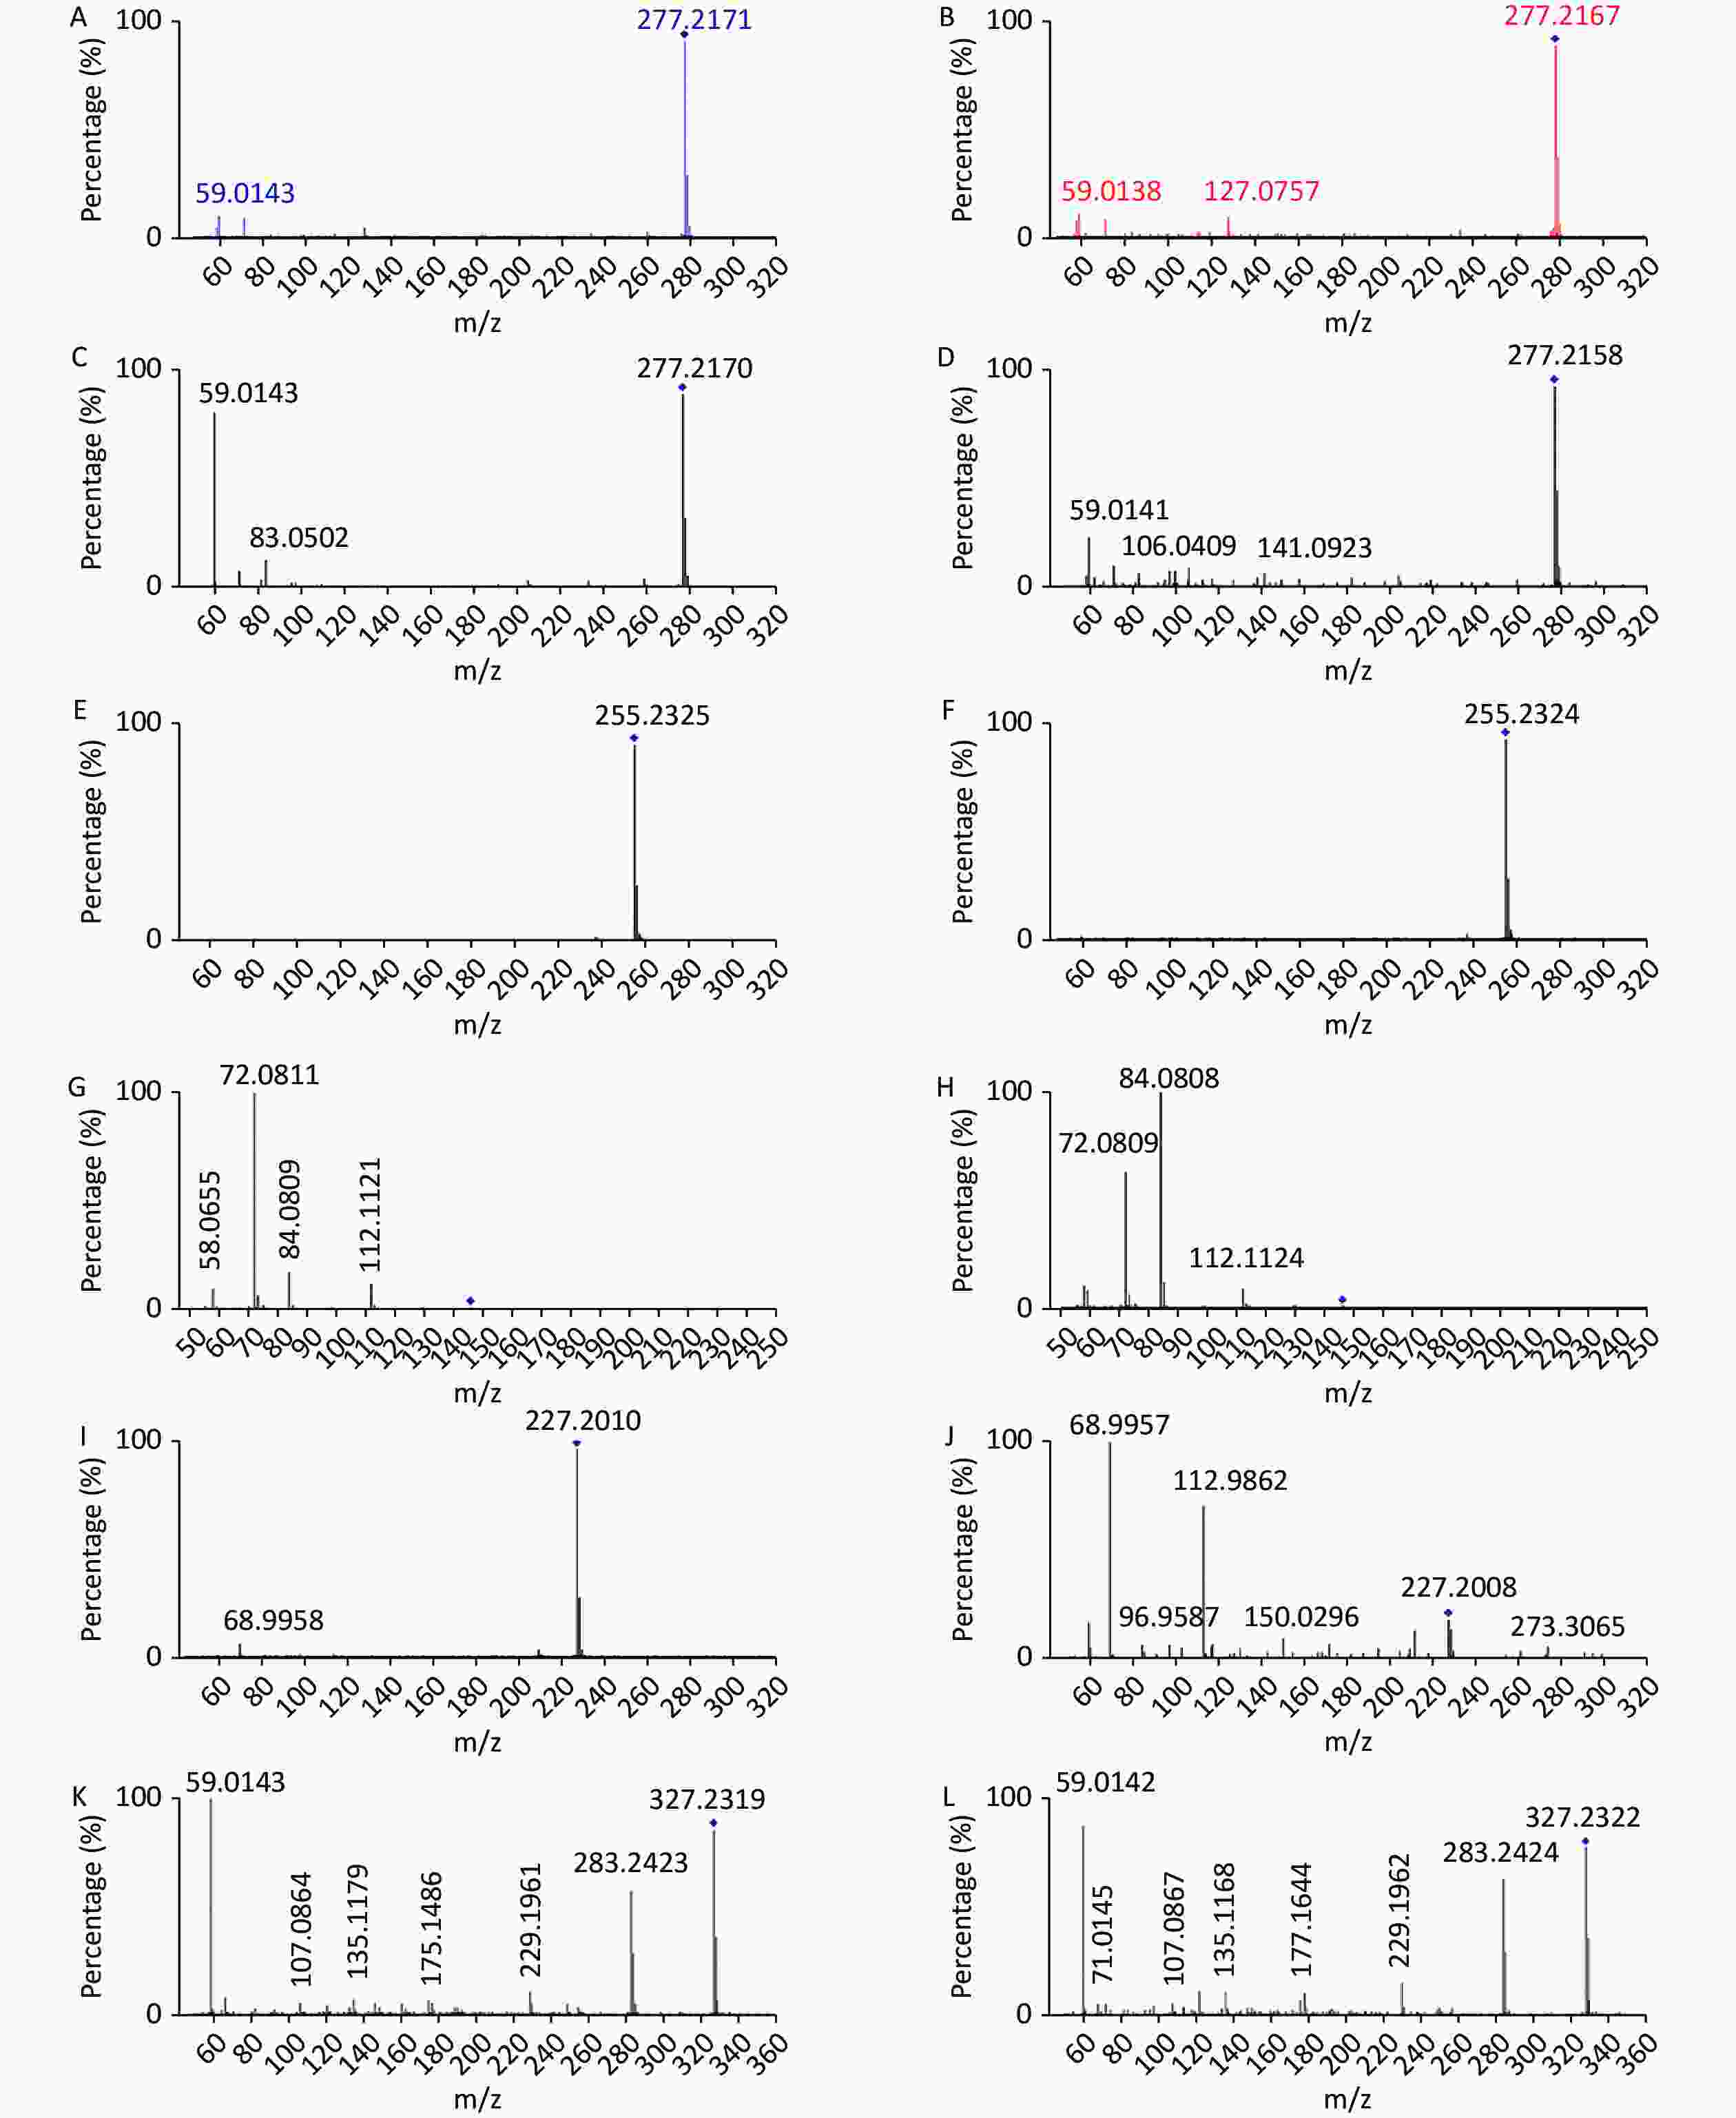
Figure 2. Comparison of MS/MS fragmentation patterns with those of reference compounds for verification of metabolite structure. (A) α-Linolenic acid standard substance (20 eV); (B) α-Linolenic acid of samples (20 eV); (C) γ-Linolenic acid standard substance (20 eV); (D) γ-Linolenic acid of samples (20 eV);(E) Palmitic acid standard substance (20eV); (F) Palmitic acid of samples (20 eV); (G) Spermidine standard substance (20 eV); (H) Spermidine of samples (20 eV); (I) Myristic acid standard substance (10 eV); (J) Myristic acid of samples (10 eV); (K) Docosahexaenoic acid standard substance (10 eV); (L) Docosahexaenoic acid of samples (10 eV).
Retinaldehyde and retinol esters are natural metabolites of vitamin A and its derivatives, and the liver acts as the main storage compartment for vitamin A in the body. Serum from mice dosed with α-amanitin contained elevated levels of retinal and retinol esters, indicating that dosing mice with α-amanitin results in abnormal metabolism of retinol. This observation differs from findings in other types of chronic liver diseases, where liver damage has been reported to result in lower concentrations of retinol-derived products[5]. Therefore, the observed increase in retinol-derived products produced in the presence of α-amanitin may be of value in the clinical diagnosis of α-amanitin poisoning.
Linoleic and docosahexaenoic acids are essential ω-3-unsaturated fatty acids that are important metabolites produced in biosynthetic pathways leading to polyunsaturated fatty acids. Tetracosapentaenoic acid is an important component of the unsaturated fatty acid metabolism pathway and is involved in the biotransformation of Docose Hexaenoie Acid (DHA). Linoleic acid is also known to be important for regulating the expression of genes involved in fatty acid metabolism and inflammation[6]. Changes in docosahexaenoic acid concentration are also closely related to inflammatory changes and the progression of liver disease[7]. The current study revealed that linoleic acid and DHA levels in the plasma of mice treated with α-amanitin were significantly greater than those in the control group, suggesting that α-amanitin-induced liver injury causes disruption of fatty acid oxidation pathways, which could potentially lead to further cellular damage through an increase in lipid peroxidation pathways.
Palmitic acid, myristic acid, and trans-hexa-dec-2-enoic acid are metabolites in long-chain fatty acid metabolism pathways, and these storage fatty acids are broken down into acetyl-CoA that enters the Krebs metabolic cycle as the main energy source of cells. The current study revealed that exposure to α-amanitin results in increased levels of palmitic, myristic, and hexa-dec-2-enoic acids, indicating that the overall rate of fatty acid metabolism is reduced in the presence of this toxin. Such inhibition of catabolic fatty acid pathways is likely to lead to an accumulation of toxic intermediates, and an excess of long-chain saturated fatty acids has been reported to enhance inflammatory responses that could potentially amplify the liver-damaging effects of α-amanitin[8].
Propionylcarnitine is an intermediate produced through the oxidation of branched-chain fatty acids. Elevated levels of propionylcarnitine are associated with abnormal β-oxidation pathways, leading to the accumulation of long-chain β-keto-fatty acids. The current study revealed that exposure to α-amanitin resulted in the formation of significant amounts of propionylcarnitine, which has the potential to induce abnormal metabolic pathways leading to long-chain β-keto-fatty acids. Inhibition of fatty acid metabolism leads to the accumulation of toxic intermediates, such as long-chain acylcarnitine derivatives[8]; therefore, α-amanitin may also have an inhibitory effect on other oxidation pathways of branched-chain fatty acids. Propionylcarnitine has been used as a screening marker for liver injury[9]. The current study found that propionylcarnitine levels were significantly increased in the presence of α-amanitin, indicating that procarnitine levels may be a useful diagnostic serum indicator of liver injury caused by α-amanitin.
Spermidine is a polyamine that controls interactions between DNA and proteins to regulate the growth and differentiation of mammalian cells, with increased polyamine levels associated with rapidly growing tissues, such as regenerated rat liver, chicken embryos, and tumors. Liver injuries are known to result in increased polyamine levels, including the enhanced production of spermidine, which induces pathways that can lead to liver regeneration. Spermidine levels in α-amanitin-administered groups were significantly higher than those in the control group, thus implying that α-amanitin-induced liver injury in mice triggers spermidine biosynthesis in vivo. Polyamine biosynthesis was found to increase directly as α-amanitin-induced liver damage occurred, with its mode of action contrasting with that of other liver-damaging chemicals that normally result in decreased polyamine biosynthesis[10].
In summary, we successfully conducted serum metabolomics using UPLC/Q-TOF MS technology on mice treated with α-amanitin. Metabolomic analyses showed differences in 10 serum metabolites between the control and α-amanita-treated groups. These α-amanitin-induced changes in the 10 serum metabolites could potentially be used as clinical biomarkers to diagnose liver damage caused by α-amanitin poisoning.
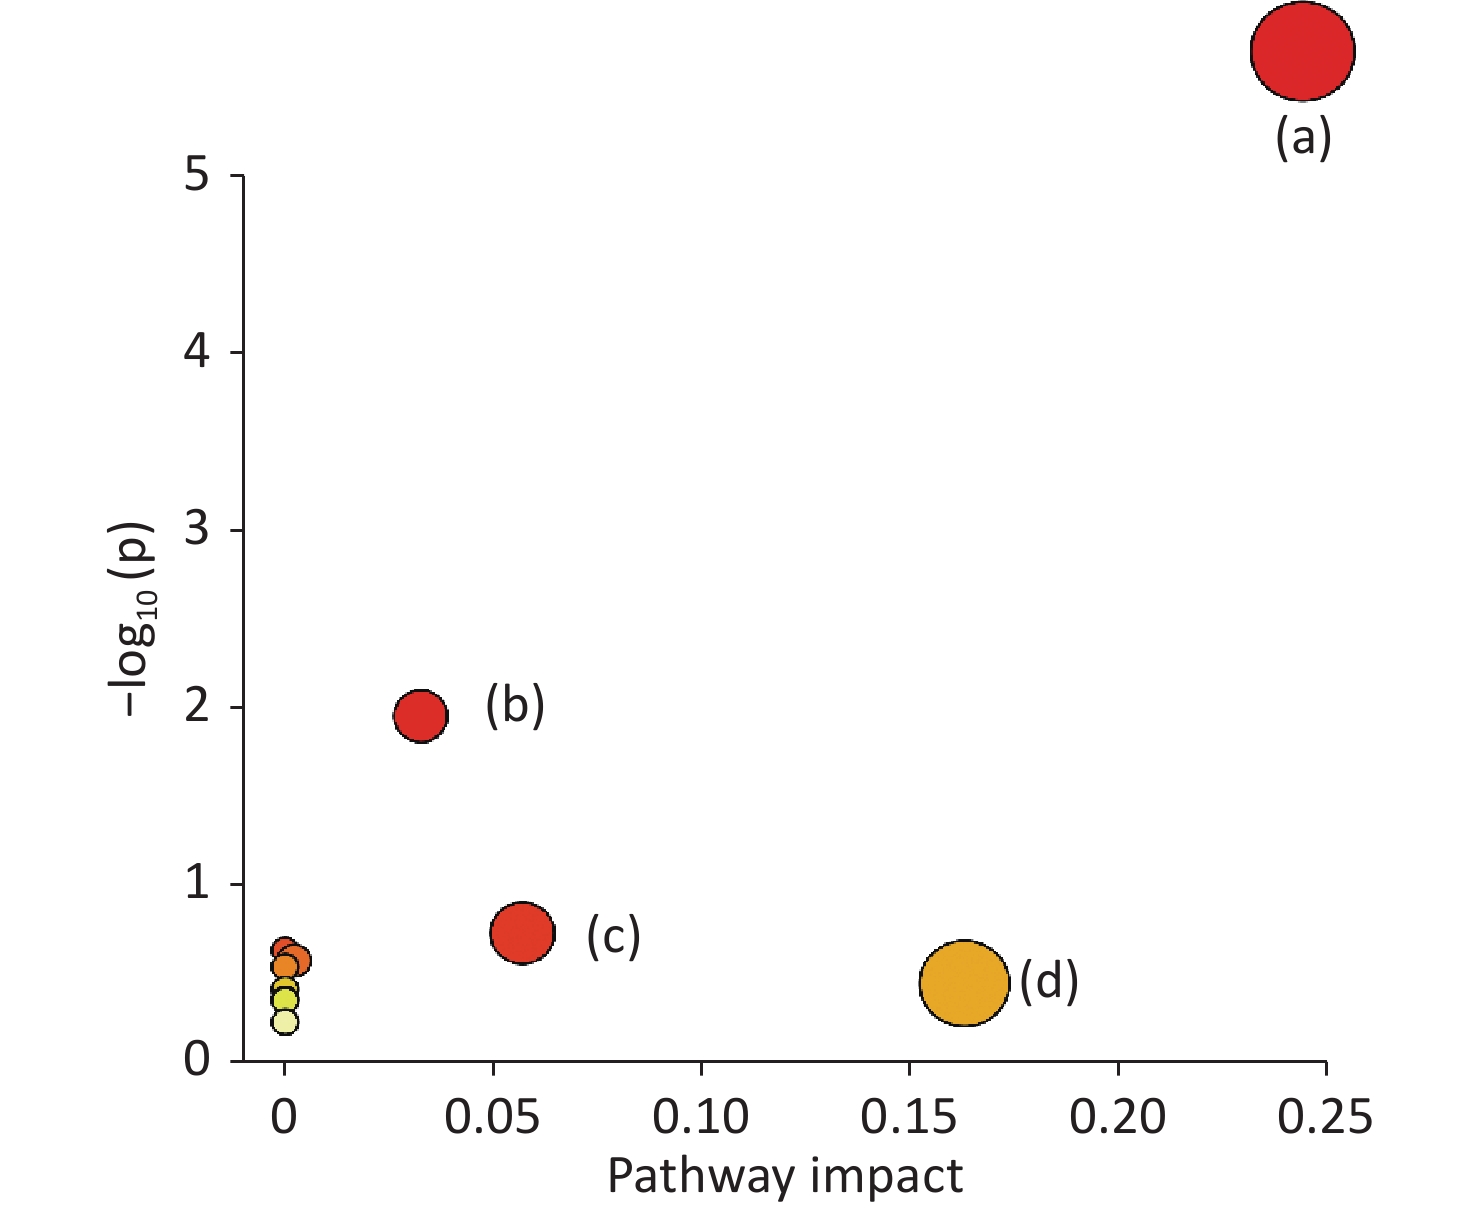
Figure S4. Summary of pathway analysis using MetaboAnalys: (a) α-linolenic acid metabolism, (b) fatty acid biosynthesis, (c) spermidine and spermine biosynthesis, and (d) retinol metabolism.
HTML
 22362Supplementary Materials.pdf
|

|

 Quick Links
 DownLoad: