


-
Adolescent dissociative disorders (ADDs) have been recognized as significant psychological issues with an estimated prevalence of 45.2% in psychiatric outpatient clinics[1]. Previous studies have demonstrated that dissociative symptoms (DSs) manifest as early signs of dissociative disorders (DDs)[2]. DSs are characterized as aberrations in one's feelings, experiences, and thoughts in the realm of awareness and memory[3]. DSs with high dissociation scores primarily present with memory disturbances, emotional constriction, depersonalization, and identity alterations[3]. Studies have indicated that adolescent dissociative symptoms (ADSs) can lead to a range of unfavorable outcomes, including DDs, antisocial personality disorder, alcohol use disorder, and non-suicidal self-injury[4]. These findings establish a link between ADSs and their adverse consequences and, thus, highlight the critical role of early sign identification in ADDs[2,4]. Moreover, evidence suggests that the effective identification and prevention of ADSs can significantly influence the incidence and development of psychiatric disorders in adolescence[2-4].
To date, we still lack a fully precise approach to interventions in ADSs at a sex-stratified level. Clinicians and families require gender-specific information necessary to monitor adolescent mentality growth. Our previous study, based on student populations, suggested that the development of ADSs during the COVID-19 pandemic was the result of a multifactorial combination of sociodemographic and psychological traits and environmental factors[5]. Unfortunately, we did not explore the interaction effects among independent impact factors of gender-specific ADSs. To bridge these gaps, we performed a gender-specific study of ADSs using a structural equation model (SEM) to investigate the direct and interactive effects of ADSs and multiple impact factors by gender stratification. Several studies have confirmed that SEM is a system of linear equations that can be visually described using path diagrams. SEM was used to examine the relationship between the implied conditional dependency among variables and to estimate whether the covariance structure of the empirical data matched the structure implied by the multivariate model.
We employed a multistage random sampling survey method to determine the sample size for our study. A final sample size of 2,700 was calculated, considering the number of participants lost during follow-up, rejection rate, sampling error, and stratification factors. We performed a school-based, cross-sectional, multicenter study in Hangzhou City, China, from January 1, 2021 to June 30, 2022. Using a multiphase, stratified, and cluster sampling technique, we randomly selected mainstream adolescents aged 13‒18 years who were fluent in Chinese. Individuals with a history of psychosis or neurocognitive deficits or those who received secondary mental health services were excluded from the study. Supplementary Figure S1 (available in www.besjournal.com) provides further details on the sampling process used in our study.
We employed standard scales to screen for ASDs and assess their impact on social, family and school environments and mental health status (Supplementary Table S1, available in www.besjournal.com). The ADSs are estimated using a two-stage appraisal procedure. In the first stage, we used the Adolescent Dissociative Experience Scale (A-DES)[6] and assessed severity based on the mean score of all A-DES items (score range: 1–10 points; higher scores indicate greater severity). Participants with a mean score of three or more were identified as having ADSs[6]. Our previous study confirmed that the A-DES has high reliability and validity, with a Cronbach’s alpha coefficient of 0.97[5]. In the present sample, internal consistency was 0.91. In the second stage, individuals identified as having ADSs were evaluated by three psychiatrists for a final diagnosis. The investigators included psychiatrists, medical students, and school healthcare personnel, all of whom were uniformly trained. Approximately 60 trained investigators administered two questionnaires (i.e., the A-DES and the Diagnostic and Statistical Manual of Mental Disorders, fifth edition) to subjects who were assessed as having ADSs. Face-to-face evaluations and investigations were performed by the investigators. The study utilized three trained investigators in each School Health Surveillance System (SHSS) center to ensure the research process quality.
Scales Response of scales Range of scores Items and interpretation Adolescent Dissociative Experience Scale (A-DES) From ‘ever = 0’ to ‘always = 10’ 0–10 It includes the experiences of dissociative amnesia (items 2, 5, 8, 12, 15, 22, 27), depersonalization/derealization (items 3, 6, 9, 11, 13, 17, 20, 21, 25, 26, 29, 30), absorption/imaginative involvement (items 1, 7, 10, 18, 24, 28), and passive influence (items 4, 14, 16, 19, 23). Higher scores indicate greater severity. Chinese Adaptation Scale for Adolescents (CASA) From ‘not at all = 1’ to ‘fully = 4’ 17–68 It includes emotional adaptation (6 items), social adaptation (6 items), and study and life adaptation (5 items). Higher scores indicate better social adjustment abilities. Chinese version of Student-Teacher Relationship Scale (STRS-CV) From ‘not at all = 1’ to ‘entirely = 5’ 28–140 A 28-item self-report instrument, which includes four domains: intimacy, conflict, support, and satisfaction. The three dimensions of intimacy, support and satisfaction reflect a positive teacher-student relationship, which higher scores indicate better teacher-student relationship. The dimension of conflict reflects a negative teacher-student relationship, in which higher scores indicate worse teacher-student relationship. Chinese version of Peer Relationship Inventory (CPRI) From ‘not at all = 1’ to ‘fully = 5’ 20–100 A 20-item self-report instrument, which measures three analytically derived dimensions of peer relations: social maturity, aggression, and independence. Higher scores indicate more positive peer relationship. Chinese version of Family Environment Scale (FES-CV) From ‘no = 0’ and ‘yes = 1’ 0–90 A 90-item self-report instrument, which includes three dimensions measured by 10 subscales that include relationship dimension [cohesion (score range, 0–9 points), expressiveness (score range, 0–9 points), and conflict (score range, 0–9 points) subscales], personal growth dimension [independence (score range, 0–9 points), achievement orientation (score range, 0–9 points), intellectual-cultural orientation (score range, 0–9 points), active-recreational orientation (score range, 0–9 points), and moral-religious emphasis (score range, 0–10 points) subscales], and system maintenance dimensions [organization (score range, 0–8 points) and control (score range, 0–9 points) subscales]. Higher scores indicate better family relationship in the subscales of cohesion, expressiveness, independence, achievement orientation, intellectual-cultural orientation, active-recreational orientation, moral-religious emphasis, and organization. Higher scores signify worse family relationship in the subscales of conflict and control. Chinese version of Symptom Check List-90 (SCL-90-CV) From ‘not at all = 1’ to ‘extremely = 5’ 90–450 A 90-item self-report instrument, which includes ten subscales (i.e., objective-comprehensive, somatic complaint, interpersonal sensitivity, depression, anxiety, hostility, phobic anxiety, paranoid ideation, psychoticism, and diet/sleeping) that respond to an individual's specific aspect of the symptomatic situation. Higher scores suggest more serious psychological problems. Table S1. Description of scales in this study
In our multicenter cross-sectional study, we analyzed 2,427 subjects. The response rate was 89.89% (2,427/2,700). The male-to-female sex ratio was 1.06:1 (1,249/1,178). The average age of our participants was 15.49 ± 1.64 years. There were 1,678 (69.14%) and 749 (30.86%) participants, respectively, in rural and urban areas. The overall positivity rate of ADSs was 22.46% (545/2,427) in Hangzhou. Among adolescents with ADSs, the positivity rate was 18.68% (220/1,178) and 26.02% (325/1,249) for female and male participants, respectively. Our analysis revealed that adolescent dissociative scores were higher in male participants, with a t-value of 3.57 (P < 0.001). Similarly, the positivity rate of ADSs was also higher in male participants with a chi-square value of 18.78 (P < 0.001) (Table 1).
Variables Total ADSsa χ2* P-value Dissociative symptoms scoresa t-value* P-value Gender Male 1,249 325 (59.63) 18.78 < 0.001 2.64 ± 2.34 3.57 < 0.001 Female 1,178 220 (40.37) 2.33 ± 1.91 Age groups (years) 13‒15 1,218 261 (47.90) 1.48 0.224 2.46 ± 2.28 −0.83 < 0.001 16‒18 1,209 284 (52.10) 2.52 ± 2.00 Residence area Rural 1,678 402 (73.76) 7.04 0.008 2.59 ± 2.16 3.28 0.094 Urban 749 143 (26.20) 2.28 ± 2.09 Note. aData are presented as No. (%) or mean ± standard deviation. ADSs, adolescent dissociative symptoms. *Chi-square test, Independent samples t−test. Table 1. Baseline characteristics of subjects (N = 2,427)
We conducted linear regression analyses using the ADSs scores as the dependent variable and sociodemographic characteristics, environmental factors, and psychological variables as independent variables. Supplementary Table S2 (available in www.besjournal.com) summarizes the results of univariate analyses of the impact factors of ADSs by gender stratification. Among the 39 variables tested, 28 (e.g., left-behind adolescents, social adaptation, family cohesion, and somatic complaints) were associated with male ADSs (P < 0.05). Meanwhile, 11 variables (e.g., age, teacher-student positive relationships, family independence, and family control) were not associated with male ADSs (P > 0.05). Female ADSs were associated with 29 variables (e.g., academic achievement, study and life adaptation, teacher-student positive relationships, family conflict, and psychoticism) (P < 0.05) and had no link to 10 other variables (e.g., rural areas, family independence, family control) (P > 0.05). Significant factors were included in the stepwise multiple linear regression analyses stratified by gender (P < 0.05).
Gender Variables Standardized regression coefficient Standard error t P-value* Standardized regression coefficient (95% confidence interval) Males Sociodemographic characteristics Age groups (years) 0.026 0.132 0.913 0.361 −0.139 to 0.381 Rural areas −0.096 0.140 −3.404 0.001 −0.749 to −0.201 Family economic status 0.027 0.090 0.969 0.333 −0.09 to 0.265 Parents' marital status 0.022 0.117 0.762 0.446 −0.14 to 0.318 Academic achievement −0.019 0.066 −0.655 0.513 −0.173 to 0.086 Left-behind adolescents −0.104 0.190 −3.704 < 0.001 −1.074 to −0.33 Normalized body size −0.011 0.071 −0.403 0.687 −0.169 to 0.111 Single child 0.044 0.132 1.570 0.117 −0.052 to 0.467 Boys' sperma to rrhea −0.060 0.135 −2.134 0.033 −0.553 to −0.023 Outpatient psychiatric visit in one year −0.131 0.251 −4.655 < 0.001 −1.661 to −0.676 Social environmental factors Social adjustment status Emotional adaptation −0.207 0.018 −7.468 < 0.001 −0.170 to −0.099 Social adaptation −0.187 0.017 −6.737 < 0.001 −0.151 to −0.083 Study and life adaptation −0.146 0.019 −5.224 < 0.001 −0.135 to −0.061 School environment factors Teacher-student relationship Positive −0.029 0.008 −1.033 0.302 −0.023 to 0.007 Conflict 0.208 0.017 7.507 < 0.001 0.095 to 0.163 Peer relationship Social emotion −0.071 0.014 −2.529 0.012 −0.063 to −0.008 Interpersonal interaction −0.116 0.015 −4.132 < 0.001 −0.094 to −0.033 Interpersonal harmony −0.116 0.011 −4.130 < 0.001 −0.070 to −0.025 Family environment factors Expressiveness −0.135 0.043 −4.819 < 0.001 −0.294 to −0.124 Conflict 0.226 0.033 8.208 < 0.001 0.205 to 0.334 Independence −0.028 0.043 −0.995 0.320 −0.128 to 0.042 Achievement orientation −0.011 0.042 −0.376 0.707 −0.098 to 0.067 Intellectual-cultural orientation −0.081 0.033 −2.866 0.004 −0.158 to −0.03 Active-recreational orientation −0.147 0.033 −5.254 < 0.001 −0.238 to −0.109 Control 0.046 0.035 1.644 0.100 −0.011 to 0.126 Moral-religious emphasis −0.114 0.044 −4.058 < 0.001 −0.267 to −0.093 Organization −0.199 0.042 −7.188 < 0.001 −0.388 to −0.221 Cohesion −0.189 0.038 −6.794 < 0.001 −0.332 to −0.183 Psychological factors Symptom Check List-90 scores Obsessive–compulsive 0.367 0.008 13.931 < 0.001 0.098 to 0.131 Somatic complaints 0.381 0.009 14.565 < 0.001 0.111 to 0.146 Interpersonal sensitivity 0.38 0.009 14.495 < 0.001 0.117 to 0.154 Depression 0.402 0.007 15.487 < 0.001 0.089 to 0.115 Anxiety 0.418 0.009 16.25 < 0.001 0.129 to 0.165 Hostility 0.388 0.014 14.887 < 0.001 0.183 to 0.238 Phobic anxiety 0.375 0.013 14.283 < 0.001 0.163 to 0.215 Paranoid ideation 0.405 0.015 15.642 < 0.001 0.203 to 0.261 Psychoticism 0.387 0.01 14.834 < 0.001 0.129 to 0.169 Diet/sleeping 0.41 0.013 15.875 < 0.001 0.178 to 0.228 Females Sociodemographic characteristics Age groups (years) 0.014 0.111 0.497 0.619 −0.163 to 0.274 Rural areas −0.038 0.124 −1.288 0.198 −0.402 to 0.083 Family economic status 0.053 0.094 1.815 0.07 −0.014 to 0.353 Parents' marital status 0.007 0.086 0.248 0.804 −0.147 to 0.189 Academic achievement −0.19 0.061 −6.622 < 0.001 −0.525 to −0.285 Left-behind adolescents −0.085 0.144 −2.918 0.004 −0.701 to −0.137 Normalized body size 0.087 0.062 2.985 0.003 0.063 to 0.307 Single child −0.014 0.119 −0.492 0.623 −0.293 to 0.175 Girls' menstruation 0.071 0.189 2.434 0.015 0.089 to 0.831 Outpatient psychiatric visit in one year −0.176 0.178 −6.132 < 0.001 −1.438 to −0.741 Social environmental factors Social adjustment status Emotional adaptation −0.276 0.016 −9.858 < 0.001 −0.191 to −0.128 Social adaptation −0.331 0.016 −12.012 < 0.001 −0.226 to −0.162 Study and life adaptation −0.302 0.016 −10.86 < 0.001 −0.21 to −0.146 School environment factors Teacher-student relationship Positive −0.112 0.007 −3.859 < 0.001 −0.043 to −0.014 Conflict 0.145 0.017 5.027 < 0.001 0.053 to 0.12 Peer relationship Social emotion −0.114 0.014 −3.93 < 0.001 −0.084 to −0.028 Interpersonal interaction −0.22 0.015 −7.743 < 0.001 −0.144 to −0.086 Interpersonal harmony −0.256 0.01 −9.09 < 0.001 −0.111 to −0.072 Family environment factors Expressiveness −0.224 0.033 −7.884 < 0.001 −0.324 to −0.195 Conflict 0.308 0.025 11.096 < 0.001 0.229 to 0.327 Independence −0.028 0.038 −0.947 0.344 −0.112 to 0.039 Achievement orientation 0.044 0.033 1.502 0.133 −0.015 to 0.114 Intellectual-cultural orientation −0.136 0.027 −4.723 < 0.001 −0.177 to −0.073 Active-recreational orientation −0.108 0.024 −3.731 < 0.001 −0.138 to −0.043 Control −0.015 0.029 −0.529 0.597 −0.072 to 0.041 Moral-religious emphasis −0.056 0.036 −1.935 0.053 −0.141 to 0.001 Organization −0.273 0.033 −9.715 < 0.001 −0.389 to −0.258 Cohesion −0.261 0.026 −9.272 < 0.001 −0.292 to −0.19 Psychological factors Symptom Check List-90 scores Obsessive–compulsive 0.581 0.006 24.477 < 0.001 0.133 to 0.156 Somatic complaints 0.564 0.006 23.425 < 0.001 0.122 to 0.145 Interpersonal sensitivity 0.571 0.006 23.849 < 0.001 0.141 to 0.167 Depression 0.609 0.004 26.309 < 0.001 0.101 to 0.118 Anxiety 0.607 0.006 26.191 < 0.001 0.143 to 0.166 Hostility 0.593 0.009 25.281 < 0.001 0.214 to 0.25 Phobic anxiety 0.524 0.009 21.116 < 0.001 0.172 to 0.207 Paranoid ideation 0.611 0.01 26.456 < 0.001 0.244 to 0.283 Psychoticism 0.622 0.006 27.227 < 0.001 0.161 to 0.186 Diet/sleeping 0.584 0.009 24.695 < 0.001 0.204 to 0.239 Note. *Data in bold are statistically significant (P < 0.05). Table S2. Univariate linear regression analysis for the association between different gender and adolescent dissociation symptoms in Hangzhou, China (N = 2,427)
Stepwise multiple linear regression analyses stratified by gender, indicated that realistic external factors, such as psychological (i.e., anxiety, diet/sleeping, and paranoid ideation), family (i.e., family expressiveness and family conflict), and rural areas appeared to only impact male ADSs. Psychological factors include psychoticism, paranoid ideation, somatic complaints, obsessive-compulsiveness, and hostility; family (i.e., family organization) and school factors (i.e., peer interpersonal interaction relationship) were associated with female ADSs only (Supplementary Table S3, available in www.besjournal.com).
Gender Variables Standardized regression coefficient Standard error t P-value* Standardized regression coefficient (95% confidence interval) Males Psychological factors Anxiety 0.171 0.019 3.144 0.002 0.023 to 0.098 Diet/sleeping 0.142 0.024 2.933 0.003 0.023 to 0.117 Paranoid ideation 0.107 0.029 2.119 0.034 0.033 to 0.112 Family environmental factors Family conflict 0.104 0.032 3.875 < 0.001 0.061 to 0.186 Family expressiveness −0.058 0.04 −2.246 0.025 −0.169 to −0.011 Sociodemographic characteristics Rural areas −0.05 0.126 −1.966 0.049 −0.497 to −0.001 Females Psychological factors Psychoticism 0.168 0.014 3.28 0.001 0.019 to 0.075 Paranoid ideation 0.168 0.02 3.564 < 0.001 0.033 to 0.112 Somatic complaints 0.115 0.009 3.077 0.002 0.01 to 0.045 Obsessive–compulsive 0.109 0.01 2.715 0.007 0.008 to 0.047 Hostility 0.125 0.017 2.892 0.004 0.016 to 0.082 Family environmental factors Family organization −0.051 0.028 −2.151 0.032 −0.115 to −0.005 School environmental factors Peer interpersonal interaction relationship −0.071 0.012 −3.129 0.002 −0.06 to −0.014 Table S3. Stepwise multiple linear regression analysis for the association between different gender and adolescent dissociation symptoms in Hangzhou, China (N = 2,427)
Based on the multiple linear regression models described above, we designed SEMs for both male and female ADSs as shown in Figure 1. The SEM model fit indices indicated that the proposed models fit the data accurately, with a comparative fit index (CFI) of 0.996, goodness-of-fit index (GFI) of 0.994, root mean square error of approximation (RMSEA) of 0.034, Akaike’s Information Criterion (AIC) of 60.472, and Bayes Information Criterion (BIC) of 152.814 for male ADSs. Similarly, the fitted SEM indicator values for female ADSs were within the recommended values, with CFI = 0.989, GFI = 0.982, RMSEA = 0.061, AIC = 125.961, and BIC = 227.393 (Supplementary Table S4, available in www.besjournal.com).
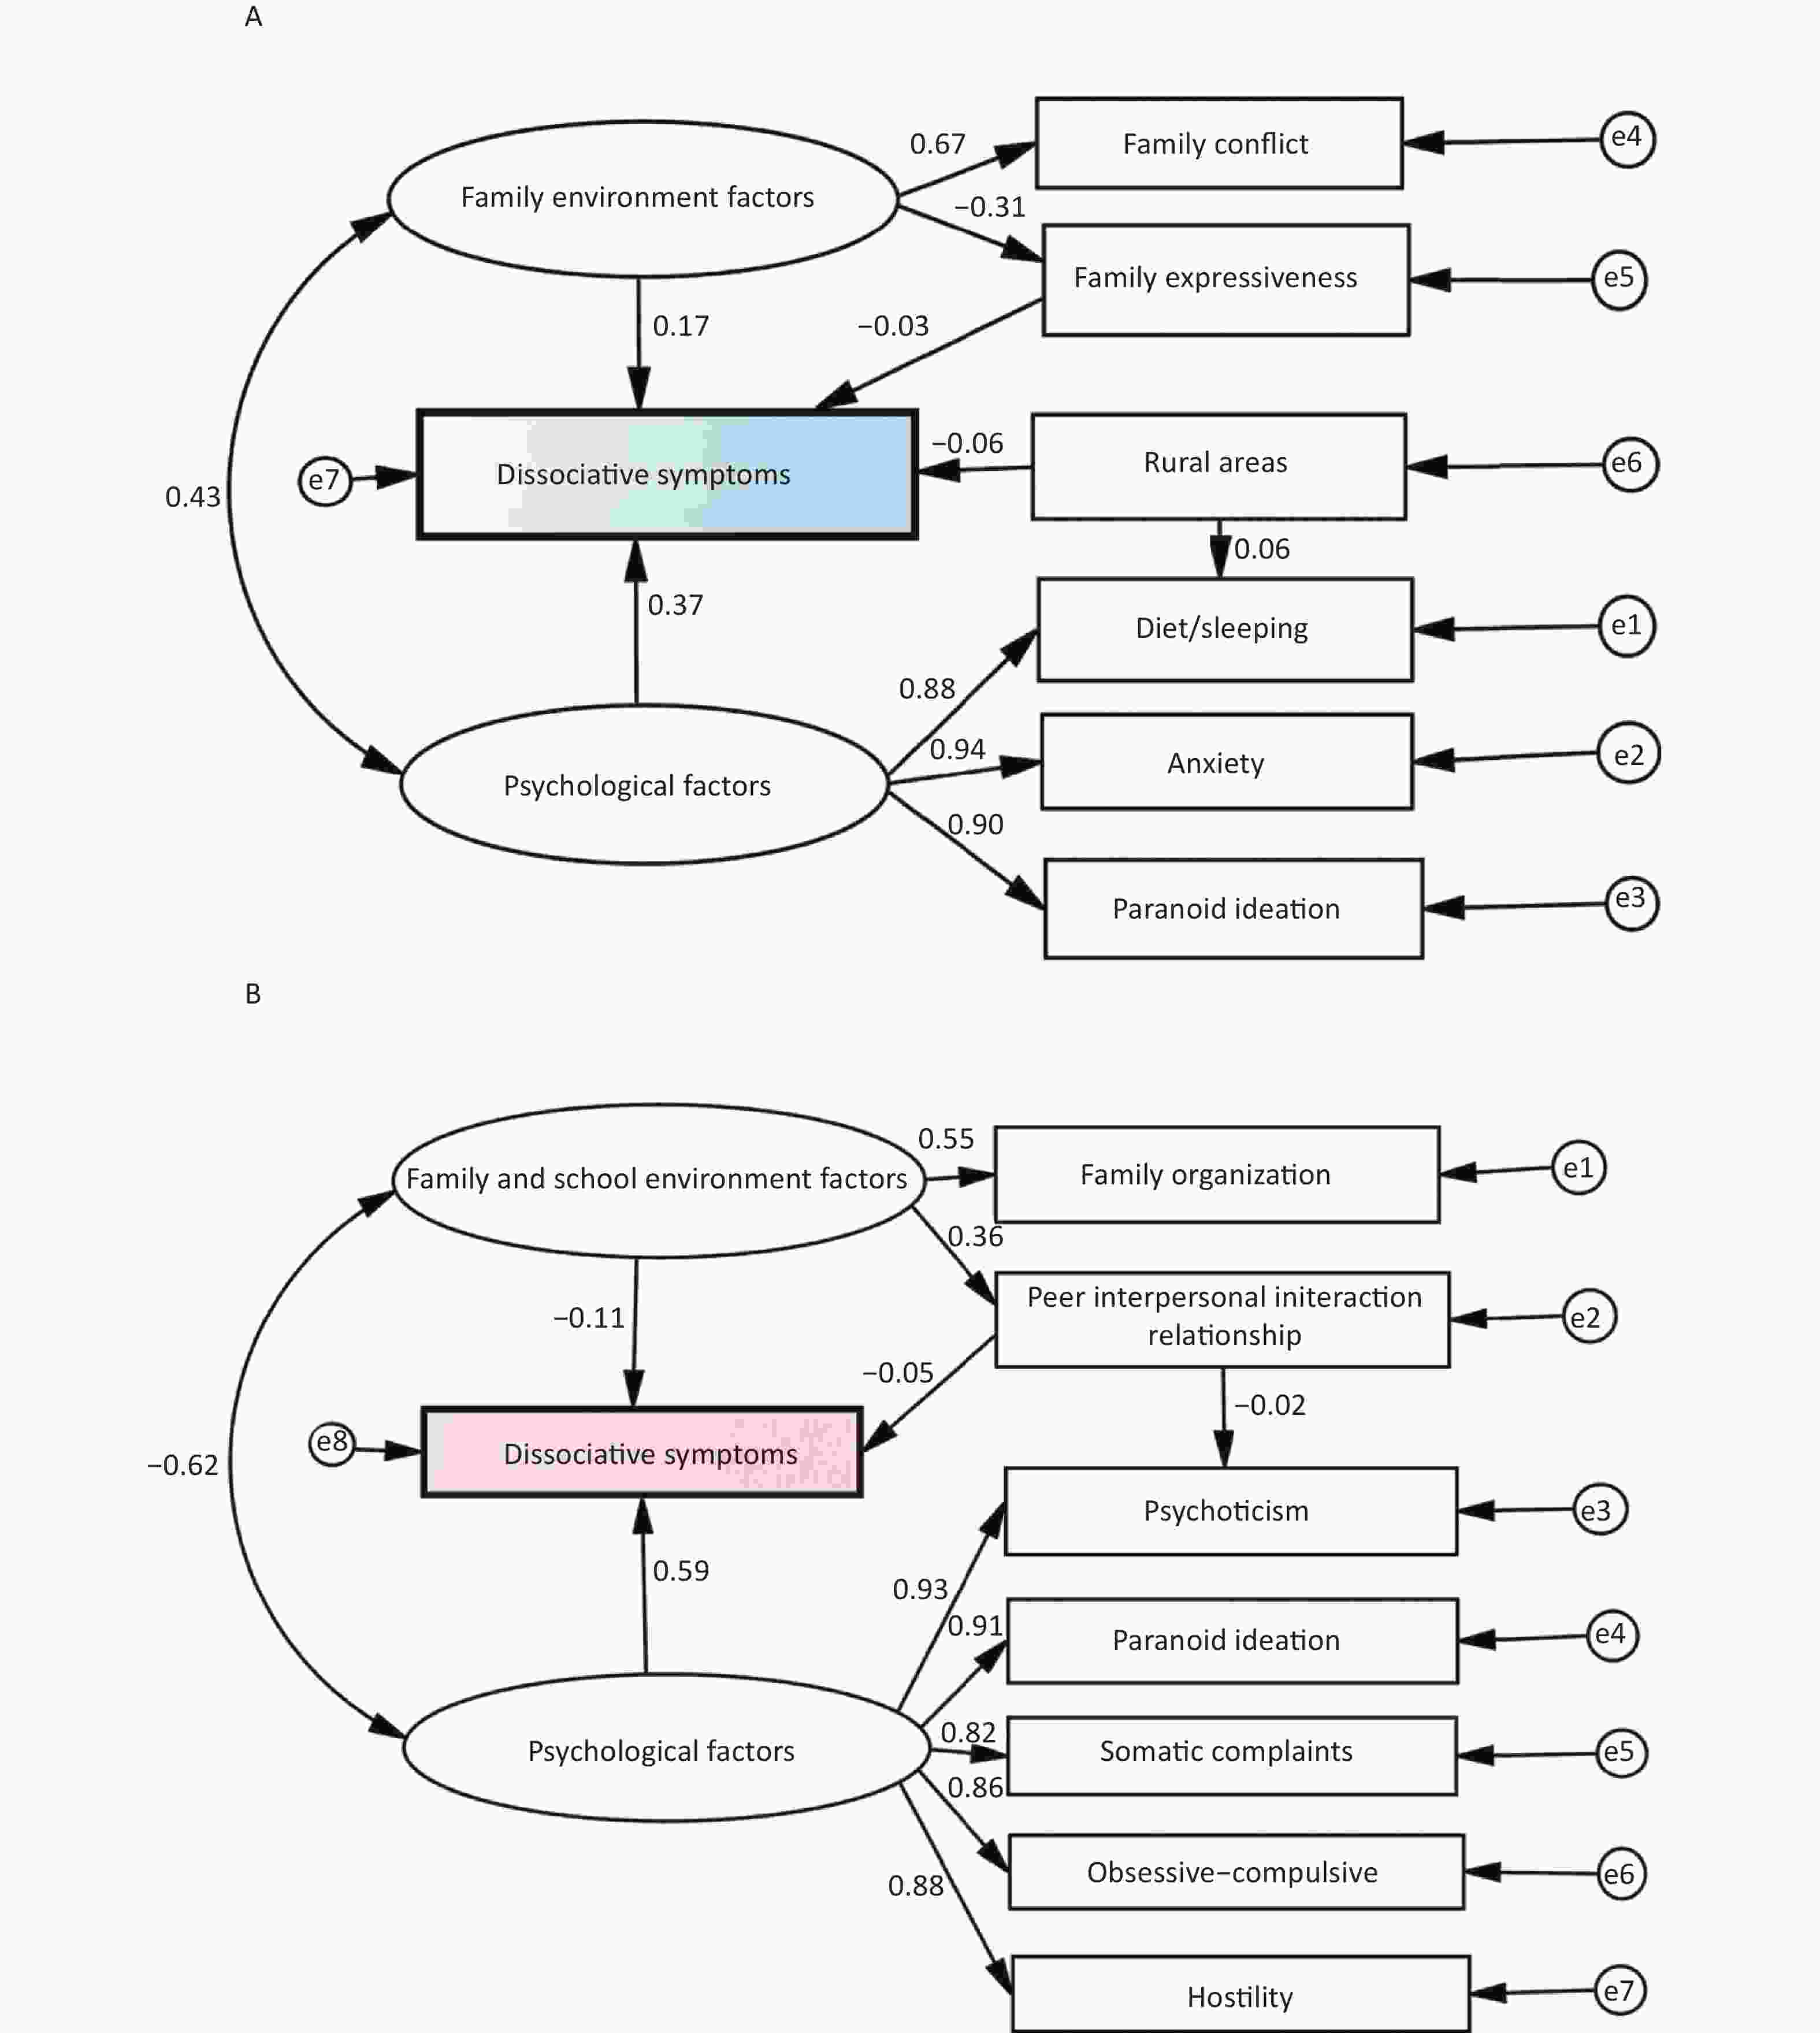
Figure 1. The structural equation models of dissociative symptoms among adolescents (A, males; B, females).
The male SEM model suggests that various factors such as family conflict, family expressiveness, rural areas, anxiety, diet/sleeping, and paranoid ideation play crucial roles in predicting male ADSs. Psychological factors in the male SEM model included anxiety, diet/sleeping, and paranoid ideation, which were positively associated with ADSs [standardized β = 0.369, standard error (SE) = 0.021, P < 0.001]. Family environment factors, such as family conflict and expressiveness, were also found to contribute to DSs (standardized β = 0.169, SE = 0.121, P = 0.013). Extensive research has indicated that family conflict and expressiveness are key variables that affect DSs[7]. This is because the family environment is an essential source of emotional support for adolescents, and those without such support are predisposed to poor moods and adverse events. Furthermore, the study found that participants from rural areas were more prone to ADSs (standardized β = 0.058, SE = 0.125, P = 0.021). This finding is consistent with earlier observations that depressive tendencies are associated with rural areas[8]. Interestingly, an interaction effect was found between family environmental and psychological factors (standardized β = 0.429, SE = 0.250, P < 0.001). Diet/sleeping had a direct effect on male ADSs by affecting rural areas (standardized β = −0.062, P = 0.001) (Figure 1A, Table 2, and Supplementary Table S5, available in www.besjournal.com). In summary, the male SEM identified several critical predictors of male ADSs, including family conflicts and expressiveness, rural areas, anxiety, diet/sleeping, and paranoid ideation. This study highlights the importance of family environments in supporting adolescents’ emotional well-being, especially among those living in rural areas. Additionally, the findings demonstrate the complex interplay between various factors that contribute to ADSs, emphasizing the need for comprehensive interventions that simultaneously address multiple factors.
Gender Paths Total effect Direct effect Indirect effect Standardized estimates (β) 95% CI P-value Standardized estimates (β) 95% CI P-value Standardized estimates (β) 95% CI P-value Males Psychological factors → Dissociative symptoms 0.369 0.266 to 0.448 < 0.001 0.369 0.266 to 0.448 < 0.001 NA NA NA Psychological factors → Anxiety 0.939 0.918 to 0.956 < 0.001 0.939 0.918 to 0.956 < 0.001 NA NA NA Psychological factors → Diet/sleeping 0.884 0.857 to 0.908 < 0.001 0.884 0.857 to 0.908 < 0.001 NA NA NA Psychological factors → Paranoid ideation 0.903 0.880 to 0.923 < 0.001 0.903 0.880 to 0.923 < 0.001 NA NA NA Family environment factors → Dissociative symptoms 0.178 0.087 to 0.308 < 0.001 0.169 0.068 to 0.311 < 0.001 0.010 0.006 to
0.0280.029 Family environment factors → Family expressiveness −0.311 −0.389 to −0.224 < 0.001 −0.311 −0.389 to −0.224 < 0.001 NA NA NA Family environment factors → Family conflict 0.670 0.525 to 0.884 < 0.001 0.670 0.525 to 0.884 < 0.001 NA NA NA Family expressiveness → Dissociative symptoms −0.032 −0.092 to 0.033 0.298 −0.032 −0.092 to 0.033 0.298 NA NA NA Rural area → Diet/sleeping −0.062 −0.090 to −0.035 < 0.001 −0.062 −0.090 to −0.035 < 0.001 NA NA NA Females Psychological factors → Psychoticism 0.928 0.912 to 0.943 < 0.001 0.928 0.912 to 0.943 < 0.001 NA NA NA Psychological factors → Paranoid ideation 0.908 0.891 to 0.922 < 0.001 0.908 0.891 to 0.922 < 0.001 NA NA NA Psychological factors → Somatic complaints 0.825 0.797 to 0.852 < 0.001 0.825 0.797 to 0.852 < 0.001 NA NA NA Psychological factors → Obsessive-compulsive 0.858 0.838 to 0.877 < 0.001 0.858 0.838 to 0.877 < 0.001 NA NA NA Psychological factors → Hostility 0.884 0.865 to 0.900 < 0.001 0.884 0.865 to 0.900 < 0.001 NA NA NA Psychological factors → Dissociative symptoms 0.592 0.480 to 0.690 < 0.001 0.592 0.480 to 0.690 < 0.001 NA NA NA Family and school environment factors → Peer interpersonal interaction relationship 0.358 0.270 to 0.443 < 0.001 0.358 0.270 to 0.443 < 0.001 NA NA NA Family and school environment factors → Family organization 0.549 0.453 to 0.670 < 0.001 0.549 0.453 to 0.670 < 0.001 NA NA NA Family and school environment factors → Dissociative symptoms −0.129 −0.275 to −0.007 0.040 −0.111 −0.267 to 0.017 0.082 −0.018 −0.039 to
0.0070.142 Peer interpersonal interaction relationship → Psychoticism −0.023 −0.052 to 0.006 0.115 −0.023 −0.052 to 0.006 0.115 NA NA NA Peer interpersonal interaction relationship → Dissociative symptoms −0.049 −0.114 to 0.016 0.142 −0.049 −0.114 to 0.016 0.142 NA NA NA Note. CI, confidence interval; NA, not available. Table 2. Total, direct and indirect standardized effects identified via the structural equation models
Unlike the male SEM model, the pathways in the female SEM model indicated a significant association between psychological factors (i.e., psychoticism, paranoid ideation, somatic complaints, obsessive-compulsive symptoms, and hostility) and ADSs (standardized β = 0.592, SE = 0.014, P < 0.001). Previous research has identified common mental disorders such as anxiety and somatoform as risk factors for DSs[2,3]. These disorders can lead to physical discomfort and decreased immune function, significantly affecting the quality of life of adolescents and exacerbating DSs. The female SEM also highlighted family and school environment factors (i.e., family organization and peer interpersonal interaction relationships) as related to ADSs (standardized β = –0.129, P = 0.040). Moreover, the study showed an interaction effect (standardized β = –0.621, SE = 0.323, P < 0.001) between psychological factors and family and school environment factors for ADSs (Figure 1B, Table 2, and Supplementary Table S5). As such, gender differences in ADSs were significant in this SEM. Further exploration is necessary to understand these differences, which may be attributed to the cognitive-emotional needs of adolescents of different genders. Compared to their male counterparts, female adolescents may be more inclined to seek peer support and information[9]. These findings have crucial implications for developing gender-specific intervention strategies for ADSs.
Notably, our SEM models indicated that poor psychological conditions were the strongest predictor of both male (total standardized β = 0.369, P < 0.001) and female (total standardized β = 0.592, P < 0.001) ADSs (Figure 1, Table 2, and Supplementary Table S5). Gender differences have a significant psychological impact on ADSs. For instance, anxiety and diet/sleeping were associated only with male ADSs, while hostility, psychoticism, somatic complaints, and obsessive-compulsive behaviors were related only to female ADSs. A previous study in the United States suggests that DSs can be a pathway through which anxiety is associated with suicidal ideation[2]. Additionally, the present findings might be in accordance with studies showing that the mental health of male adolescents was more likely to be influenced by sociodemographic and family environmental factors (e.g., rural area, family conflict, and family expressiveness)[8,10]; Correspondingly, the mental health of female adolescents was more associated with school and family environmental factors (e.g., peer interpersonal interaction relationship and family organization). Thus, there is an urgent need to develop targeted intervention policies and programs from a gender lens. Several studies have shown that dissociation plays a significant role in eating and sleep disorders[2]. These findings further support the association between diet/sleeping and male ADSs. In contrast to male ADSs, female ADSs seemed to be more affected by mental factors. Consequently, female adolescents with poor mental health status require more attention.
This study has several limitations, largely due to the limitations of the available data. First, we could not confirm causal associations in this cross-sectional study, which could only evaluate associations between ADSs and observed factors. Second, our sample comprised only adolescents from Hangzhou City. Therefore, our results cannot be extrapolated to the entire adolescent population. Third, we need to further explore the risk factors for ADSs in future longitudinal studies.
-
Studies involving human participants were reviewed and approved by the Ethics Committee of the Hangzhou Center for Disease Control and Prevention. Written informed consent to participate in this study was obtained from the participants’ legal guardians or next of kin.
HTML
 23027+Supplementary Materials.pdf
|

|

 Quick Links
 DownLoad: