


-
Insulin resistance (IR) has traditionally been identified as a hallmark characteristic of obesity-associated type 2 diabetes mellitus (T2DM), wherein the response of peripheral tissues such as the liver, skeletal muscle, and adipose tissue to insulin is reduced. Obesity and IR, which, until recently, were a major concern in adults, have become more prevalent in children and adolescents globally. According to the World Health Organization, people who are overweight and obese account for 44% of diabetes cases, 23% of ischemic heart disease cases, and 7%–41% of certain cancers[1-2]. Per the International Diabetes Federation, diabetes affects 1.1 million children and adolescents aged 14–19 years. In India, the prevalence of prediabetes and diabetes among young adults is 12.3% and 8.4%, respectively. T2DM and IR are strongly linked to obesity, and the prevalence of obesity-related diabetes is expected to double to 300 million by 2025[3]. The increasing prevalence of IR among children and adolescents is associated with the growing incidence of adult diseases, including T2DM and cardiovascular disease, making it a public health concern[4].
Recently, the brain was identified as an insulin-responsive organ, and its regulatory role in insulin signaling pathways and glucose metabolism has been established[5]. IR is a likely pathogenesis of the brain, specifically the hypothalamus (hypothalamic insulin resistance, hyp-IR), a region rich in insulin receptors that may regulate the homeostatic functions of the liver in addition to insulin secretion and its subsequent actions[6].
Experimental animal studies, epidemiological evidence, and clinical trials have reported that high-fructose corn syrup is singularly responsible for IR development in both adult and pediatric populations[7-8]. We previously delineated the underlying molecular signals that may mediate the genesis of hepatic IR (hep-IR) in developing rats[9-11].
Recent trends indicate that modern children and adolescents are increasingly exposed to electromagnetic fields (EMFs) from mobile phones (900–2,000 MHz) during their growth years[12]. Mobile phones operate on non-ionizing low-frequency EMFs to elicit thermal and non-thermal effects, of which the biological effects have been attributed to the latter[13-15]. There is particular concern regarding the health effects of mobile phones on children and adolescents, as they are avid, unrestricted, and potential long-term users. Moreover, their developing nervous system, including the brain tissue conductivity and relative head size, makes them more susceptible to highly penetrating EMF radiation[16].
EMFs from mobile phones can exert nonthermal and thermal effects[17-18], and the former poses a health risk, thereby making it necessary to define exposure limits. Increasing evidence suggests that non-thermal interactions affect the cardiac, reproductive, and central neurological systems[19-20]. Non-thermal electromagnetic radiation increases reactive oxygen species (ROS) levels and causes aberrant metabolic activities in biological systems[21]; however, studies that delineate the underlying molecular mechanism(s) are lacking.
We previously reported that when weaned rats were subjected to concomitant stressors, i.e., EMF radiation from mobile phones (1,760 MHz, 2 h/day) and fructose consumption (15%), the pathways of eating and satiety behaviors that operate to maintain the “set-point” of energy homeostasis in the hypothalamus and liver were severely disturbed by early adulthood[22]. To the best of our knowledge, this is the first experimental report that implicates these two stressors in the pathogenesis of hyp-IR and hep-IR during growth. The underlying mechanism was postulated to be the disruption of the ghrelin and leptin signaling pathways, which participate in the central neuroendocrine control of energy homeostasis. These stressors shift glucose metabolism towards gluconeogenesis, disrupt insulin signaling, and alter mitochondrial function[22]. However, there is a paucity of data elucidating the effects of these stressors on the molecular signals of IR, mitochondrial function, and oxidative stress in the hypothalamus and liver of growing rats. This study provides further evidence in continuation of our previous study.
-
Weaned male albino Wistar rats (44.5 ± 10 g; 28 days old) were housed under standard conditions of temperature (22 ± 2 °C), humidity, and dark/light cycle (12/12 h) throughout the experiment. The experiments were conducted in accordance with the guidelines of the Committee for the Purpose of Control and Supervision of Experiments on Animals. All experimental protocols were approved by the Institutional Animal Ethics Committee (IAEC/14/II-04 and DIPSAR/IAEC/15-II/07).
The study duration was 8 weeks, from the weaning day (28 days old) until early adulthood (84 days old), and spanned the pre-, peri-, and post-pubertal stages of rat development. Weaned male Wistar albino rats were randomly divided into four groups (n = 6 each), namely: Normal, Exposure Only (ExpO), Fructose Only (FruO), and Exposure with Fructose (EF) for the 8-week study period.
In the Normal group, animals had free access to standard laboratory chow and filtered drinking water. The animals had free access to standard laboratory chow and 15% fructose as a drinking solution. In the ExpO group, the animals had free access to standard laboratory chow and filtered drinking water. Additionally, they were exposed to EMF from mobile phones (frequency of 1,760 MHz, power density of 0.3988 mW/cm2, GSM, and SAR of 0.181 W/kg) for 2 h/day for 8 weeks. In the EF, the animals had free access to standard laboratory chow and 15% fructose as a drinking solution. Additionally, they were exposed to EMF from mobile phones (frequency of 1,760 MHz, power density of 0.3988 mW/cm2, GSM, and SAR of 0.181 W/kg) for 2 h/day for 8 weeks.
-
As described earlier, a Plexiglas cage of adjustable length that could comfortably house one rat at a time was used as the exposure chamber[22]. The mobile phone was placed on top of the exposure chamber such that its antenna preferentially emitted EMF towards the whole body of the rat. The platform carrying the mobile phone was tied firmly with a string to a pulley controlled by a stepper motor (programmed using Pluronic software). The platform was moved using a programmed motor at an angular momentum of 2–45 degrees.
-
Power was continuously generated using a mobile tower antenna operating at 1.76 GHz continuously. For rats weighing 55–220 g, the whole-body average SAR is 0.18 W/kg.
To measure SAR, the intensity of EMF emitted by the mobile phones was measured with the electric field probe with the transmitter (NADRADH NBM520 Model) operating at a frequency range of 1.76–1.92 GHz and ensured that exposure from EMF radiation was evenly distributed on rat. The average power density in the range of 0.0968–0.3988 mw/cm2 was used to measure the SAR value against whole body weight (g), length (from head to tail tip) (cm), and width (cm) of the exposed rats every week of the study period.
Using this system, the ExpO and EF groups received EMF exposure from mobile phones in “switched-on mode” (1,760 MHz, 0.3988 mW/cm2, specific absorption rate 0.181 W/kg, 2 h/day x 8 weeks)
-
After the study period ended, the rats were euthanized using CO2 to surgically remove the hypothalamus and liver that were immediately stored (−80 °C), as detailed elsewhere[22].
-
The hypothalamic and hepatic tissue samples were homogenized in 0.1% RIPA lysis buffer with 100 μL protease inhibitor and centrifuged (13,000 ×g, 15 min, 4 °C), after which the protein content was measured[23]. The samples were denatured in a sample-reducing buffer (PierceTM lane marker reducing sample buffer, Cat #39000, Thermo Scientific, USA), and proteins (20 μg/lane) were resolved on a 10% SDS-polyacrylamide gel by electrophoresis and then transferred to nitrocellulose membrane (90 min at 90 V, Bio-Rad system, USA). The blots were incubated with a blocking buffer (3% BSA) in Tris-buffered saline containing 0.2% Tween 20 (TBS-T) for 1 h at room temperature followed by overnight incubation (4 °C) with the primary antibodies: anti-p-AMPKα (Thr 172) (1:500; Cat #40H9, Cell Signaling Technology, USA), anti-SIRT 1 (1:1,000; Cat #9475, Cell signaling Technology, USA), anti- UCP2 (1:1,000; Cat #NBP100-59742, Novus biological, USA), anti-IRS1 (1:1,000; Cat #59G8, Cell signaling Technology, USA), anti-AKT (1:1,000; Cat #9272, Cell signaling Technology, USA), anti-p-AKT (1:1,000; Cat #Ser 473, Cell signaling Technology, USA), anti-p-PI3K (1:1,000; Cat #bs-3332-R, Bioss, USA), anti-FOXO 1 (1:500; Cat #D7C1H, Cell signaling Technology USA), anti-OXPHOS (Cocktail of Complex I, II, III, IV and V) (1:500; Cat #ab110413, Abcam, USA), anti-MnSOD (1:1,000; Cat #14C10, Cell signaling Technology, USA), anti-Catalase (1:1,000; Cat #ab52477, Abcam, USA), and anti-GAPDH (1:1,000; Cat #14C10, Cell Signaling Technology, USA). The blots were then washed thrice with TBS-T and incubated with secondary anti-rabbit/ anti-mouse or IgG-HRP antibody (1:10,000, Cat #ab97051, Abcam Sigma Aldrich, St. Louis, Missouri, USA), and immunodetection was performed using enhanced chemiluminescence (Luminata strong™-Western HRP substrate, Merck-Millipore, Billerica, MA, USA) and quantified (Gel ChemiDoc™, Bio-Rad imaging system, USA). Digital images were analyzed by densitometry using the ImageJ software (National Institutes of Health, Bethesda, MD, USA).
-
Frozen hypothalamic (50 mg) and liver (100 mg) tissues were thawed, homogenized in phosphate-buffered saline (0.1 mol/L, pH 7.4), and centrifuged (10,000 rpm, 5 min, 4 °C). Superoxide dismutase (SOD) activity in the supernatant was determined as the amount of enzyme required for 50% inhibition of pyrogallol autoxidation per mL of assay mixture and was expressed as U/(min∙mg) protein. The assay mixture contained freshly prepared pyrogallol (100 μL, 0.13 mmol/L), HCl (10 mmol/L), and EDTA (3.3 mmol/L). The reaction was initiated by the addition of pyrogallol (100 μL) in the supernatant sample (100 μL) and the rate of increase in the absorbance at 420 nm was recorded spectrophotometrically for 2 min (from 1 min 30 s to 3 min 30 s, Aqua Mate AQ 8000, Thermo Scientific, USA). A lag time of 1 min 30 s was allowed to attain a steady state for pyrogallol autoxidation[24].
-
Frozen hypothalamus (50 mg) and liver (100 mg) were thawed, homogenized with potassium phosphate buffer (50 mmol/L, pH 7.4), and centrifuged (3,400 rpm, 15 min, 4 °C)[25]. The supernatant was analyzed for catalase activity based on the formation of chromic acetate from dichromate and glacial acetic acid using hydrogen peroxide[26]. The assay mixture contained H2O2 solution (400 μL, 0.8 mmol/L), phosphate buffer (500 μL, 50 mmol/L, pH 7.0), and supernatant sample (100 μL). The assay mixture (1 mL) was added to the dichromate/acetate solution at 60-s intervals. The solution was placed in a water bath (100 °C, 10 min) until a stable green color developed, which was determined spectrophotometrically at 570 nm. The catalase activity was expressed as µmol H2O2 consumed per 30 s per mg protein.
-
Frozen hypothalamus (50 mg) and liver tissue (100 mg) were thawed, homogenized in phosphate buffer saline (500 μL, 0.1 mol/L, pH 7.4), centrifuged (10,000 rpm, 5 min, 4 °C), and analyzed.
Reduced glutathione (GSH) was directly determined by the oxidation of 5,5´-dithiobis (2-nitrobenzoic acid) to 5-thio-2-nitrobenzoic acid. The tissue homogenate (0.5 mL) was precipitated with 5% TCA (2 mL) containing EDTA (1 mmol/L) and centrifuged (200 rpm, 10 min). The reaction mixture contained freshly prepared Ellman’s reagent (2,2´-dinitro-5,5´-dithiobenzoic acid) phosphate buffer (0.3 mol/L), 1% sodium citrate (1.8 mL, 0.1 mmol/L), and supernatant sample (0.2 mL). The reaction mixture was incubated at 30 °C for 10 min and the change in absorbance per minute was recorded at 412 nm. The GSH content was expressed as µmol/mg wet tissue[27].
-
The frozen hypothalamus was thawed, washed, minced, and homogenized in mitochondria isolation buffer containing Tris-HCl (50 mmol/L), NaCl (120 mmol/L), KCl (5 mmol/L), MgSO4 (1 mmol/L), CaCl2 (1 mmol/L), glycerol (10%), sucrose (1 mol/L), protease inhibitor (1:100 of buffer), and pH 7.4 using homogenizer (3 strokes, 1 min). The homogenate was centrifuged (600 xg, 10 min, 4 °C) twice, and the obtained supernatant was re-centrifuged (13,000 xg, 5 min, 4 °C) to precipitate mitochondrial enriched fraction[28]. Samples of the mitochondria-enriched fraction were assayed for protein concentration[29].
-
buffer containing Tris-HCl (50 mmol/L), NaCl (120 mmol/L), KCl (5 mmol/L), MgSO4 (1 mmol/L), CaCl2 (1 mmol/L), glycerol (10%), sucrose (1 mol/L), protease inhibitor (1:100 of buffer); pH 7.4 using homogenizer (10 strokes, 1 min). The homogenates were centrifuged (740 ×g, 5 min, 4 °C) and the supernatant was re-centrifuged (9,000 xg, 10 min, 4 °C). The supernatant was centrifuged (10,000 xg, 10 min, 4 °C) to precipitate the mitochondrial fraction[30]. The pellets were collected, resuspended in (1.5 mL) mitochondrial suspension medium, and assayed for protein concentration using the Bradford method[29].
-
The activity of Complex I was determined as the rate of reduction of dichlorophenolindophenol (DCPIP) to oxidized NADH. The reaction mixture (950 μL) contained monobasic potassium phosphate (25.0 mmol/L), dichlorophenolindophenol (50.0 mmol/L), antimycin A (1.0 mmol/L), decylubiquinone (17.5 mmol/L), (5.0 mg/mL), BSA, and mitochondrial enriched sample (50.0 μL, approximately 30.0 μg). The reaction mixture was allowed to equilibrate (RT, 1 min), and the reaction was initiated with NADH (20.0 μL, 0.8 mmol/L) and rotenone (4.0 μmol/L) and monitored every 30 s for 3 min[31]. Absorbance was recorded at 600 nm. Enzyme activity was expressed as nanomoles of NADH-reduced/min/mg protein[32].
-
The reaction mixture with a mitochondrial-rich fraction (50 μL), DCPIP (80 mol/L), succinate (10 mmol/L), rotenone (4 μmol/L), and ATP (0.2 mmol/L) was incubated (10 min, 30 °C), and the reaction was initiated with decylubiquinone (80 µmol/L). Enzyme activity was monitored as the decrease in absorbance at 600 nm for 5 min. Malonate (10 mmol/L), which is a competitive inhibitor, was added to inhibit succinate[33]. Succinate decylbiquinone reductase activity was expressed as nmol/L 2,6-dichlorophenolindophenol (DCPIP) reduced/min/mg protein.
-
Cytochrome c activity was determined by measuring the oxidation of reduced cytochrome c using dithiothreitol. The reaction mixture contained reduced cytochrome C (0.1 mL) and a mitochondrial-rich fraction sample (50 μL). The decrease in absorbance was measured at 550 nm (3 min) as the rate of disappearance of reduced cytochrome C[34]. Enzyme activity was expressed as nanomoles of cytochrome c oxidized/min/mg protein.
-
ATPase activity was measured directly by measuring inorganic phosphate release from ATP. The reaction mixture contained oligomycin (2 mmol/L), MgCl2 (50 mmol/L), EDTA (0.2 mmol/L), and Tris-HCl (50 mmol/L, pH 8). A mitochondrial-rich fraction sample (50 μL) was pre-incubated (10 min), and ATP (5 mmol/L) was added[35]. The reaction was terminated after 5 min using 10% (w/v) trichloroacetic acid. After centrifugation (800 g, 5 min), the phosphorus content in the clear supernatant was measured at 680 nm[36].
-
Statistical analysis was performed with a two-way analysis of variance (ANOVA) followed by the Bonferroni post hoc test using GraphPad Prism ver. 5.0. (San Diego, CA, USA). For each analysis, the values are represented as Mean ± SD (n = 6). A value of *P < 0.05 vs. Normal, $P < 0.05 vs. ExpO, #P < 0.05 vs. FruO and ϕP < 0.05 vs. ExpO was considered statistically significant.
-
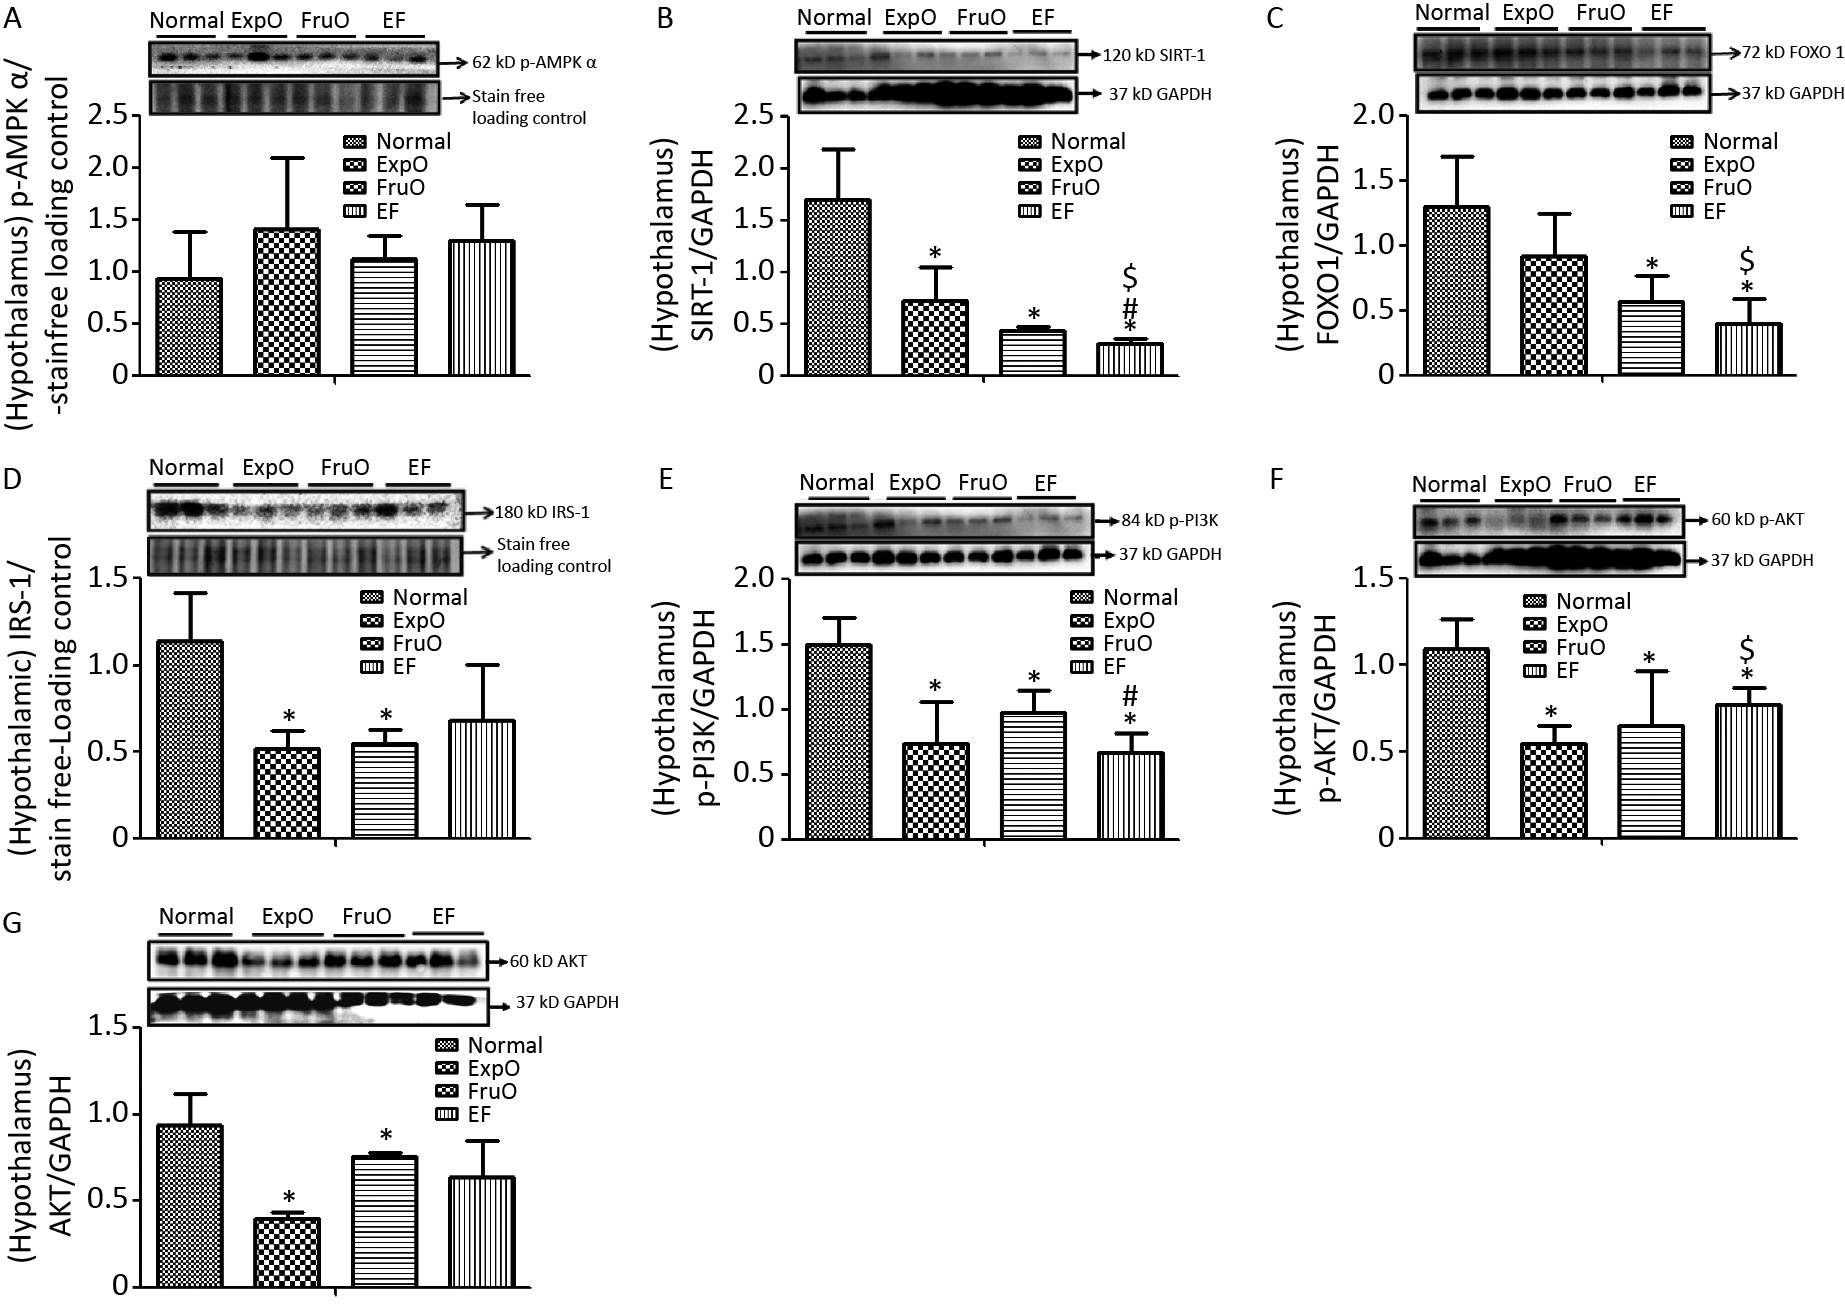
AMPK plays key roles as an energy sensor, a metabolic regulator, and a mitochondrial function and homeostasis regulator. The hypothalamic expression of intracellular energy sensor p-AMP-activated protein kinase (p-AMPKα) normalized with respect to internal loading control in Normal, ExpO, FruO, and EF was 1.04 ± 0.24, 1.24 ± 0.66, 1.16 ± 0.67, and 1.05 ± 0.05, respectively (Figure 1A).

Figure 1. Effect of EMF and fructose consumption in childhood-adolescence perturbed the hypothalamic master regulator protein of mitochondrial and insulin functions and skews hypothalamic transmitting insulin signaling via PI3K/AKT by early adulthood. (A) Metabolic key regulator protein p-AMPKα remained unaffected in EF, and (B) SIRT1 was significantly reduced in EF. (C) Expression of the insulin function regulator protein-FOXO-1 was markedly reduced in EF. (D) Hypothalamic expression of signaling adapter protein IRS1 was significantly reduced in ExpO and FruO. (E) Transducer protein PI3K expression was significantly reduced in EF. (F) Expression of the protein p-AKT was significantly reduced in EF and (G) AKT was unchanged. Thus, this shows hypothalamic PI3K/AKT signaling is impaired to attenuate the insulin signaling in response to glucose metabolism and energy regulation.
SIRT1 is a sirtuin deacetylase target protein that regulates energy balance aspects via mitochondrial OXPHOS. It functions as a sensor of redox changes and as a master metabolic mitochondrial homeostasis regulator. The master metabolic regulator of mitochondrial homeostasis, sirtuin 1 (SIRT1), normalized to GAPDH, was significantly reduced (P < 0.05) in ExpO, FruO, and EF compared to normal. EF also showed a significant (P < 0.05) reduction in SIRT1 expression compared to ExpO and FruO (Figure 1B), suggesting that AMPK-dependent SIRT 1 activity was reduced, which may have disrupted the mitochondrial redox equilibrium for ROS generation mediated by uncoupling protein (UCP2).
The hypothalamic insulin transcription factor and mitochondrial oxidative stress regulator, FOXO-1 normalized to GAPDH, were markedly reduced (P < 0.05) in FruO and EF compared to the Normal group. Moreover, FOXO-1 expression in EF was significantly (P < 0.05) lower than that in the ExpOs group (Figure 1C) which may have disturbed mitochondrial function via mitochondrial OXPHOS and insulin signaling.
The hypothalamic expression of the key target, insulin receptor tyrosine kinase protein (IRS1), was significantly lower (P < 0.05) in the ExpO and FruO groups than in the Normal group (Figure 1D). Intracellular insulin signal transducer protein (p-PI3K) was significantly decreased (P < 0.05) in the ExpO and EF groups. FruO showed significantly lower (P < 0.05) p-PI3K expression compared to the ExpO group (Figure 1E). Intracellular insulin signal transducer protein B (p-AKT) was significantly reduced (P < 0.05) in the ExpO, FruO, and EF groups compared to the Normal group. p-AKT expression was also reduced in the EF group compared to the FruO group. (Figure 1F). Hypothalamic expression of AKT normalized to GAPDH was significantly decreased (P < 0.05) in ExpO and FruO mice compared to normal mice. However, EF showed a significant increase (P < 0.05) in AKT expression compared to the ExpO group (Figure 1G). These results indicate that the reduced expression of IRS1, PI3K, and AKT in the hypothalamus impairs insulin signaling, leading to hypothalamic IR.
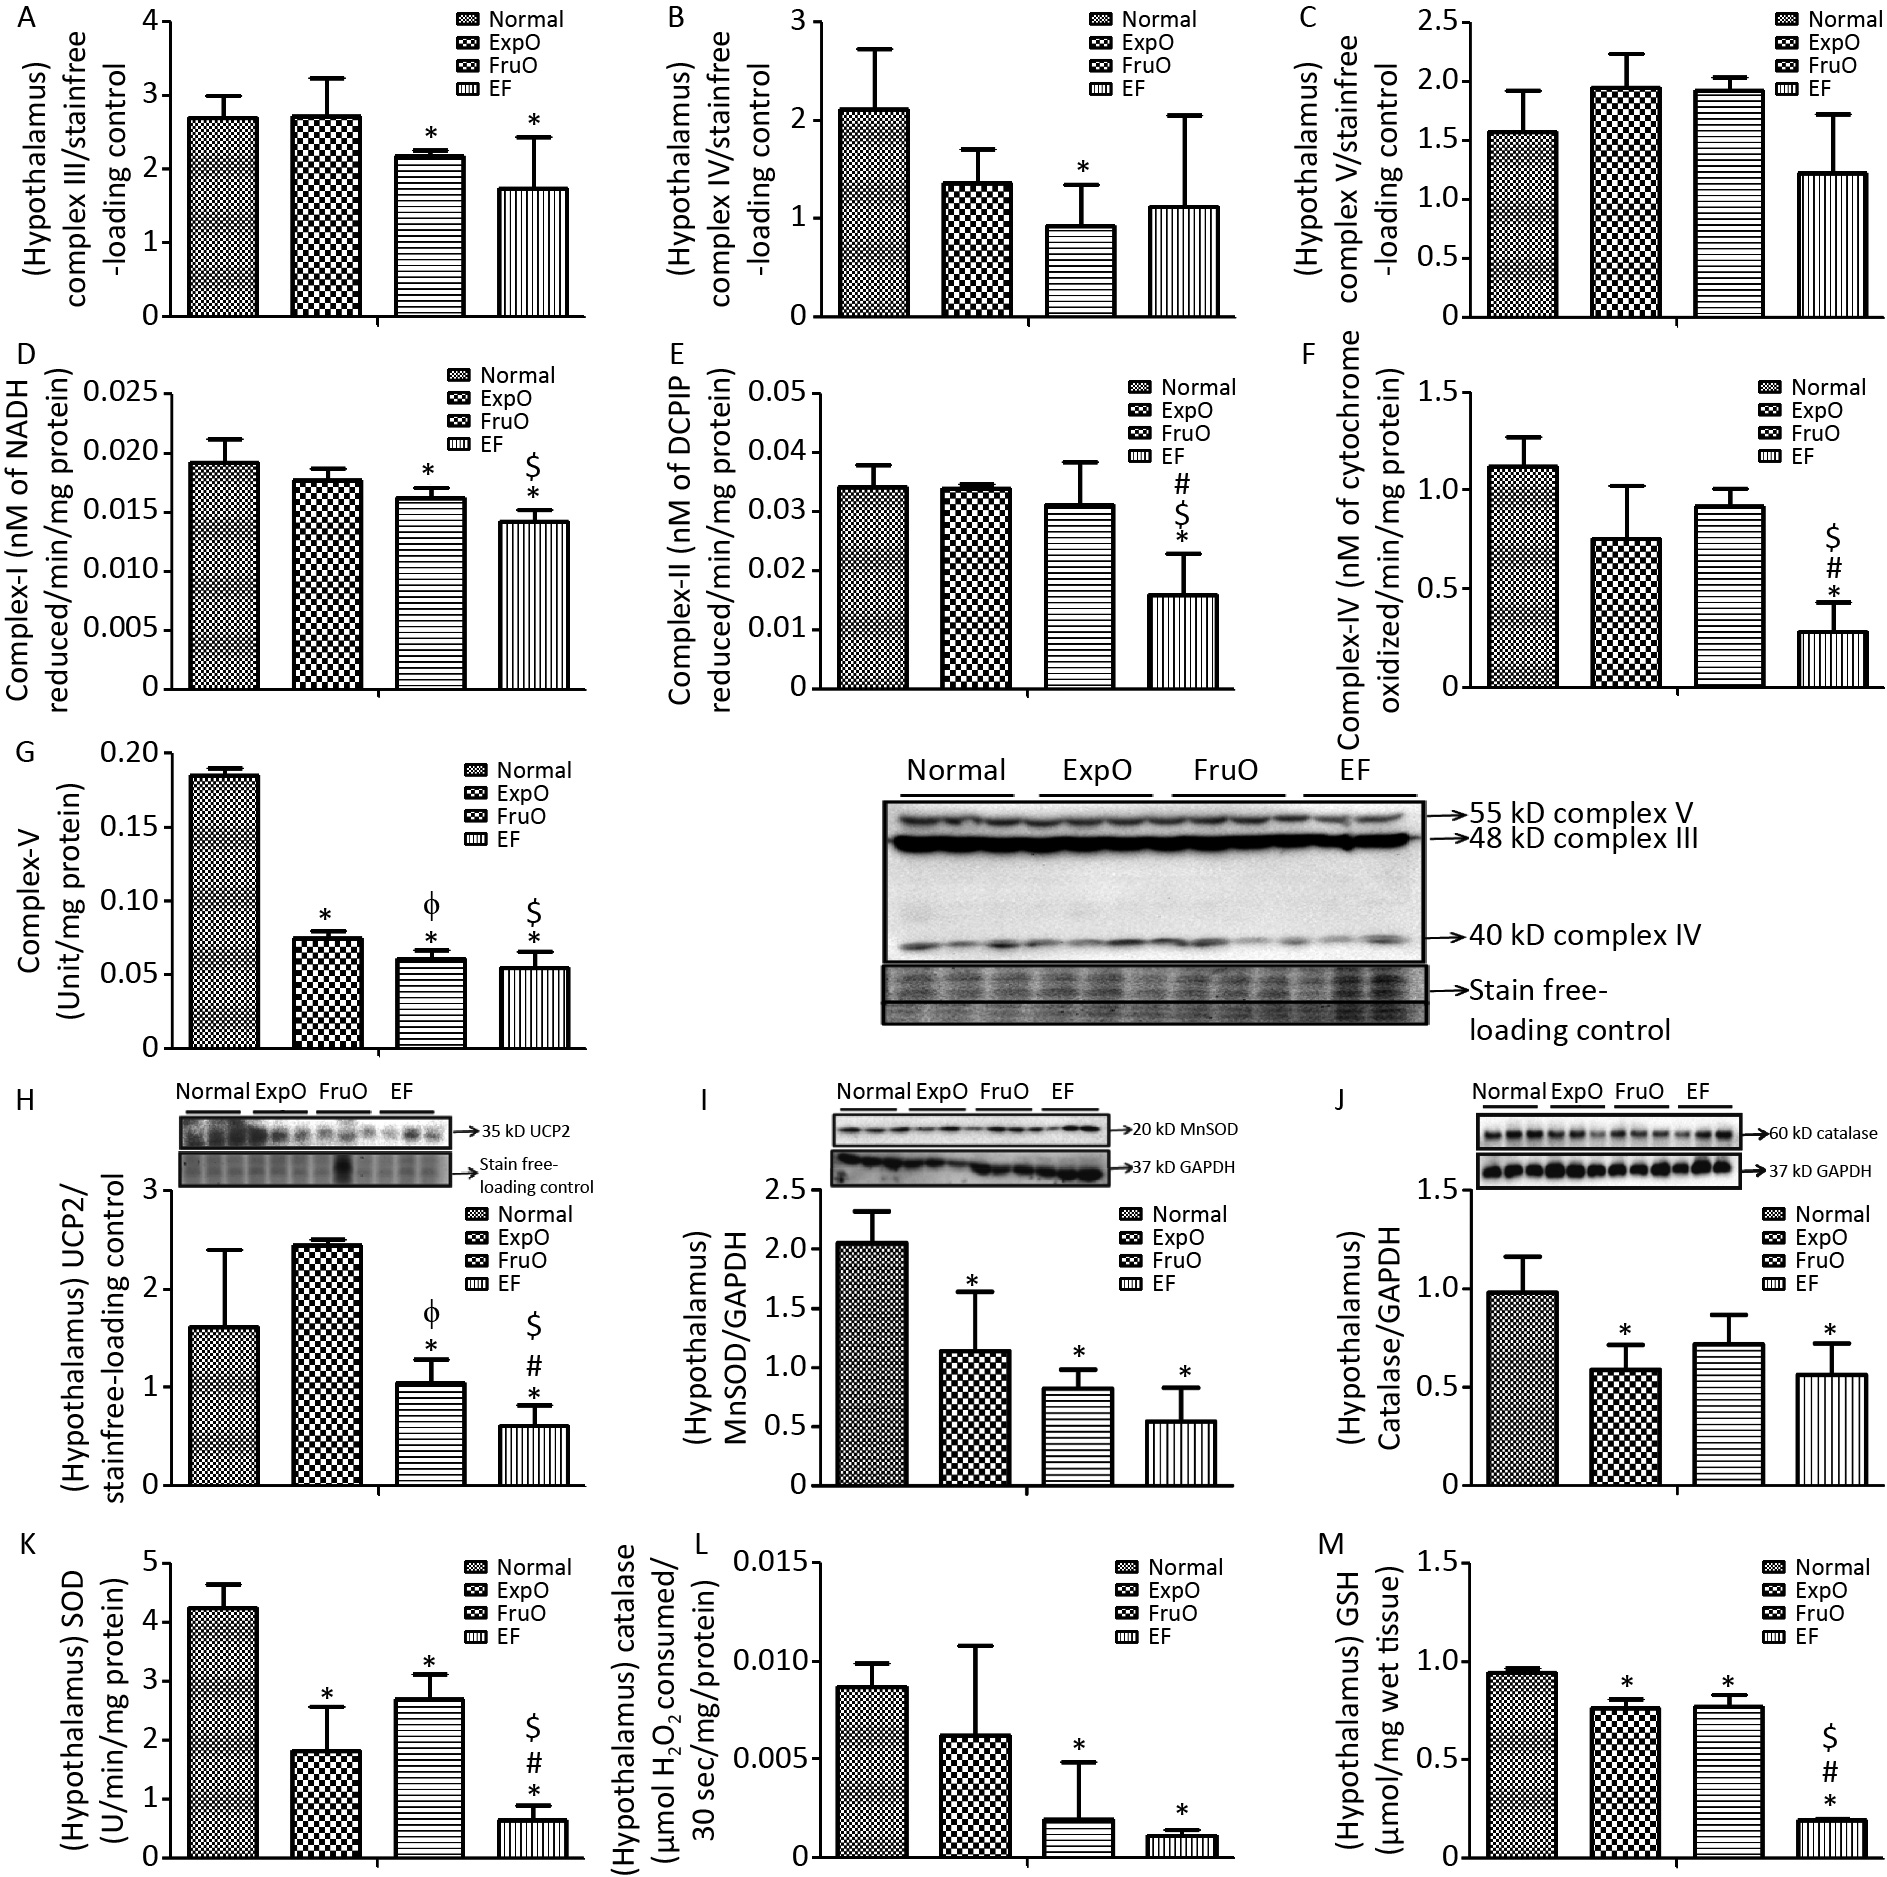
The hypothalamic protein expression of the mitochondrial OXPHOS, and complex–III in the Normal, ExpO, FruO, and EF groups was 1.56 ± 0.809, 1.793 ± 0.524, 1.82 ± 0.178, and 1.34 ± 0.916, respectively and was significantly reduced (P < 0.05) in FruO and EF than in Normal (Figure 2A). Complex IV expression was 2.12 ± 0.618, 1.37 ± 0.33, 0.92 ± 0.43, and 1.12 ± 0.92 in the Normal, ExpO, FruO, and EF groups, respectively, and was significantly reduced (P < 0.05) in FruO than in Normal (Figure 2B). The hypothalamic complex V expression in the Normal, ExpO, FruO, and EF groups was 1.57 ± 0.34, 1.95 ± 0.28, 1.93 ± 0.11, and 1.22 ± 0.5, respectively (Figure 2C).

Figure 2. Effect of EMF and fructose consumption in childhood-adolescence interrupt hypothalamic mitochondrial oxidative phosphorylation (OXPHOS) system in ATP production and skews antioxidant defensive system by early adulthood. (A) Hypothalamic expression of Complex III was significantly reduced in EF. (B) and (C) Expression of protein Complex IV was significantly reduced in FurO and Complex V was unchanged in EF. (D) The activity of Complex I was significantly reduced in EF. (E, F, and G) Activity of Complex II, Complex IV, and Complex V was markedly reduced in EF. (H) Hypothalamic UCP2 expression, an ROS regulator, was significantly reduced in EF. (I) Expression of MnSOD, a ROS regulator, was significantly reduced in EF. (J) Expression of Catalase, which protects from ROS-induced oxidative damage, was significantly reduced in EF. (K, L, and M) Activity of SOD, catalase, and GSH was significantly reduced in EF.
The activity of the hypothalamic mitochondrial OXPHOS enzyme NADH CoQ reductase (complex I) was significantly lower (P < 0.05) in the FruO and EF groups than in the Normal group. Also, the Complex I activity was significantly decreased (P < 0.05) in the EF group compared to that in the ExpO group (Figure 2D). The succinate-ubiquinone oxidoreductase (complex II) level in the Normal, ExpO, FruO, and EF groups was 0.034 ± 0.004, 0.034 ± 0.001, 0.031 ± 0.007, and 0.015 ± 0.006 nmol/L, respectively. It was significantly reduced (P < 0.05) in EF compared to that in the Normal, ExpO, and FruO groups (Figure 2E).
The cytochrome C oxidase (complex IV) level in the Normal, ExpO, FruO, and EF groups was 1.121 ± 0.15, 0.76 ± 0.27, 0.92 ± 0.08, and 0.28 ± 0.15 nmol/L, respectively. It was significantly reduced (P < 0.05) in the EF group compared to that in the Normal, ExpO, and FruO groups (Figure 2F). Moreover, the complex II and complex IV activities in EF were significantly lower (P < 0.05) than those in the ExpO and FruO groups. The hypothalamic ATP synthase (Complex-V) activity significantly decreased (P < 0.05) in the ExpO, FruO, and EF groups compared to that in the Normal group. Complex V activity was also significantly decreased (P < 0.05) in the EF compared to the ExpO and FruO groups (Figure 2G). Taken together, the reduced hypothalamic OXPHOS in the EF evidences mitochondrial dysfunction therein and may be responsible for hyp-IR.
UCP2 is located in inner mitochondria and regulates mitochondrial ROS production. Here, we report that its hypothalamic expression, normalized against that of the internal loading control, was significantly reduced (P < 0.05) in FruO and EF compared to the Normal group. Additionally, UCP2 expression was significantly reduced (P < 0.05) in FruO and EF compared to that in ExpO (Figure 2H). The expression of the hypothalamic mitochondrial protein, manganese-dependent superoxide dismutase (MnSOD), was markedly reduced (P < 0.05) in the ExpO, FruO, and EF groups compared to the Normal group (Figure 2I). The hypothalamic expression of the protein catalase normalized against GAPDH was significantly decreased (P < 0.05) in the ExpO and EF groups compared to the Normal group (Figure 2J).
The hypothalamic level of antioxidant enzymes SOD in the Normal, ExpO, FruO, and EF groups was 4.26 ± 0.38, 1.82 ± 0.75, 2.71 ± 0.42, and 0.66 ± 0.23 U, respectively, and was significantly reduced (P < 0.05) in the ExpO, FruO, and EF groups compared to the Normal group. SOD activity in the EF group was significantly lower (P < 0.05) than that in the ExpO and FruO groups (Figure 2K). Hypothalamic catalase activity was significantly reduced (P < 0.05) in the FruO and EF groups compared to that in the Normal group (Figure 2L). The hypothalamic activity of GSH in the Normal, ExpO, FruO, and EF groups was 0.94 ± 0.03, 0.76 ± 0.046, 0.77 ± 0.05 and 0.19 ± 0.01 U, respectively, and was significantly reduced (P < 0.05) in the ExpO, FruO, and EF groups compared to the Normal group. Furthermore, EF significantly reduced (P < 0.05) GSH activity compared to ExpO and FruO (Figure 2M). The results indicated that the combined effects of exposure to EMF from mobile phones and fructose consumption severely disturbed the ROS regulator protein, leading to disruption of the activities of the antioxidant enzymes in EF.
-
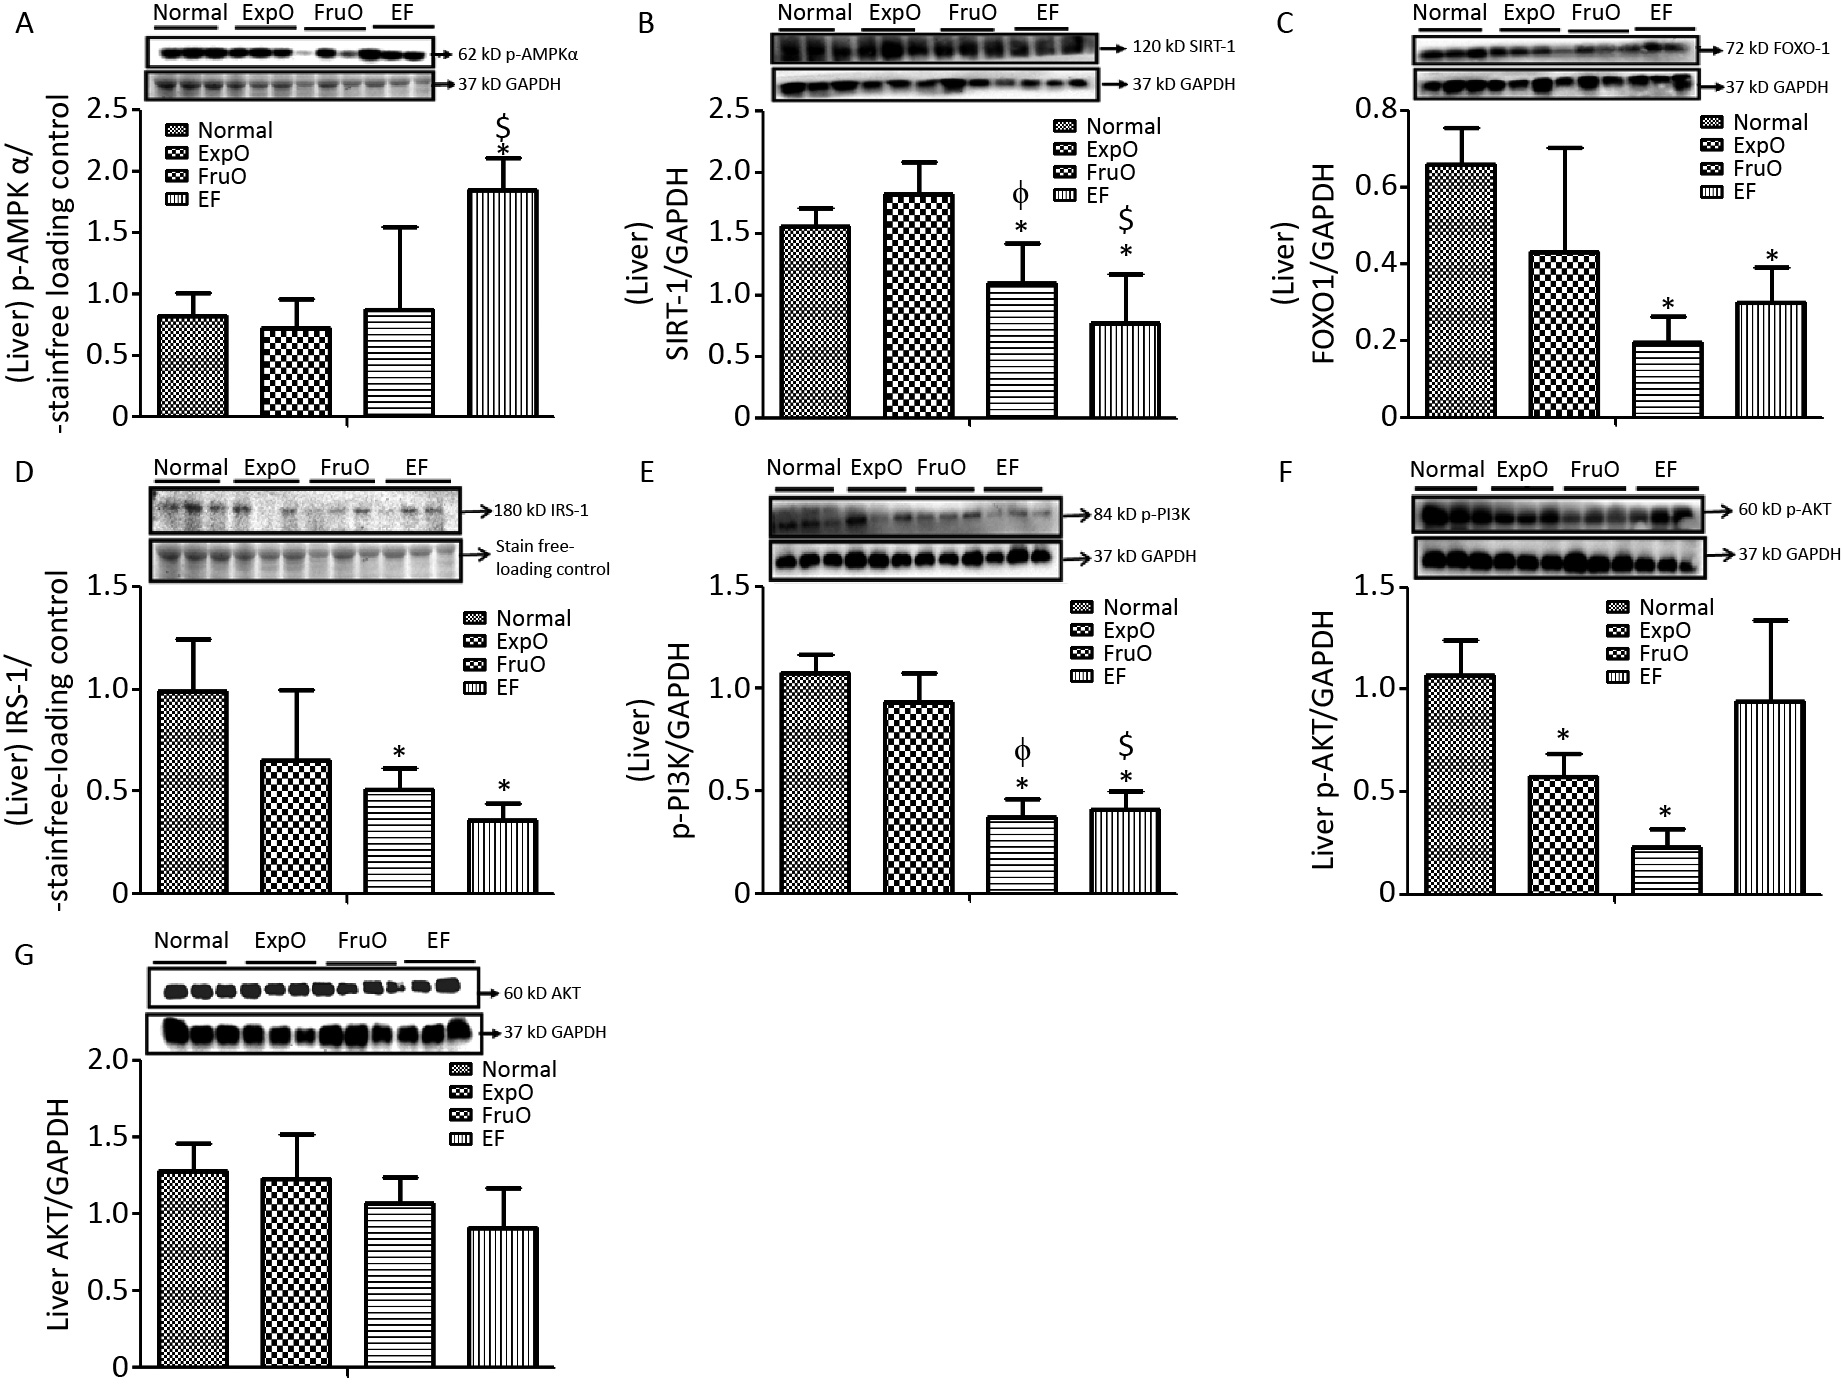
The hepatic expression of the protein p-AMPK-α was significantly increased (P < 0.05) in EF as compared to the Normal, ExpO, and FruO groups. Additionally, the hepatic p-AMPK-α expression was significantly reduced (P < 0.05) in the EF group compared to the ExpO group (Figure 3A). The expression of hepatic SIRT1 normalized against GAPDH was significantly reduced (P < 0.05) in FruO and EF compared to the Normal group. Hepatic SIRT1 expression in the EF and FruO groups was significantly reduced (P < 0.05) compared to the ExpO group (Figure 3B). The expression of the transcription factor FOXO1 normalized to GAPDH was significantly decreased (P < 0.05) in FruO and EF compared to normal (Figure 3C). A reduction in the levels of master metabolic regulators, as observed in EF, has been implicated in the disruption of insulin signaling and mitochondrial function, which may lead to the pathogenesis of hep-IR.

Figure 3. Effects of EMF and fructose consumption during childhood and adolescence on hepatic master regulator proteins of mitochondrial and insulin function and impairment of hepatic insulin signaling via PI3K/AKT in early adulthood. (A) Metabolic key regulator protein p-AMPKα was significantly increased in EF and (B) SIRT1 was significantly reduced in EF. (C) Expression of the transcription factor mediator of insulin function and mitochondrial OXPHOS. FOXO-1 was markedly reduced in EF. (D) Hepatic signaling adapter protein IRS1 was significantly reduced in FruO and EF. (E) Expression of transducer protein p-PI3K was significantly reduced in FruO and EF. (F) Expression of the protein p-AKT was significantly reduced in ExpO and FruO. (G) AKT was unchanged in EF.
Hepatic expression of the insulin receptor tyrosine kinase protein (IRS1) and intracellular signal transducer, p-PI3K, normalized to GAPDH, was significantly reduced (P < 0.05) in the FruO and EF groups compared to the Normal group. The expression of p-PI3K was significantly reduced (P < 0.05) in FruO and EF compared to that in ExpO (Figure 3D–E). The expression of hepatic p-AKT normalized to GAPDH was significantly lower (P < 0.05) in ExpO and FruO cells, whereas AKT expression remained unchanged (Figure 3F–G).
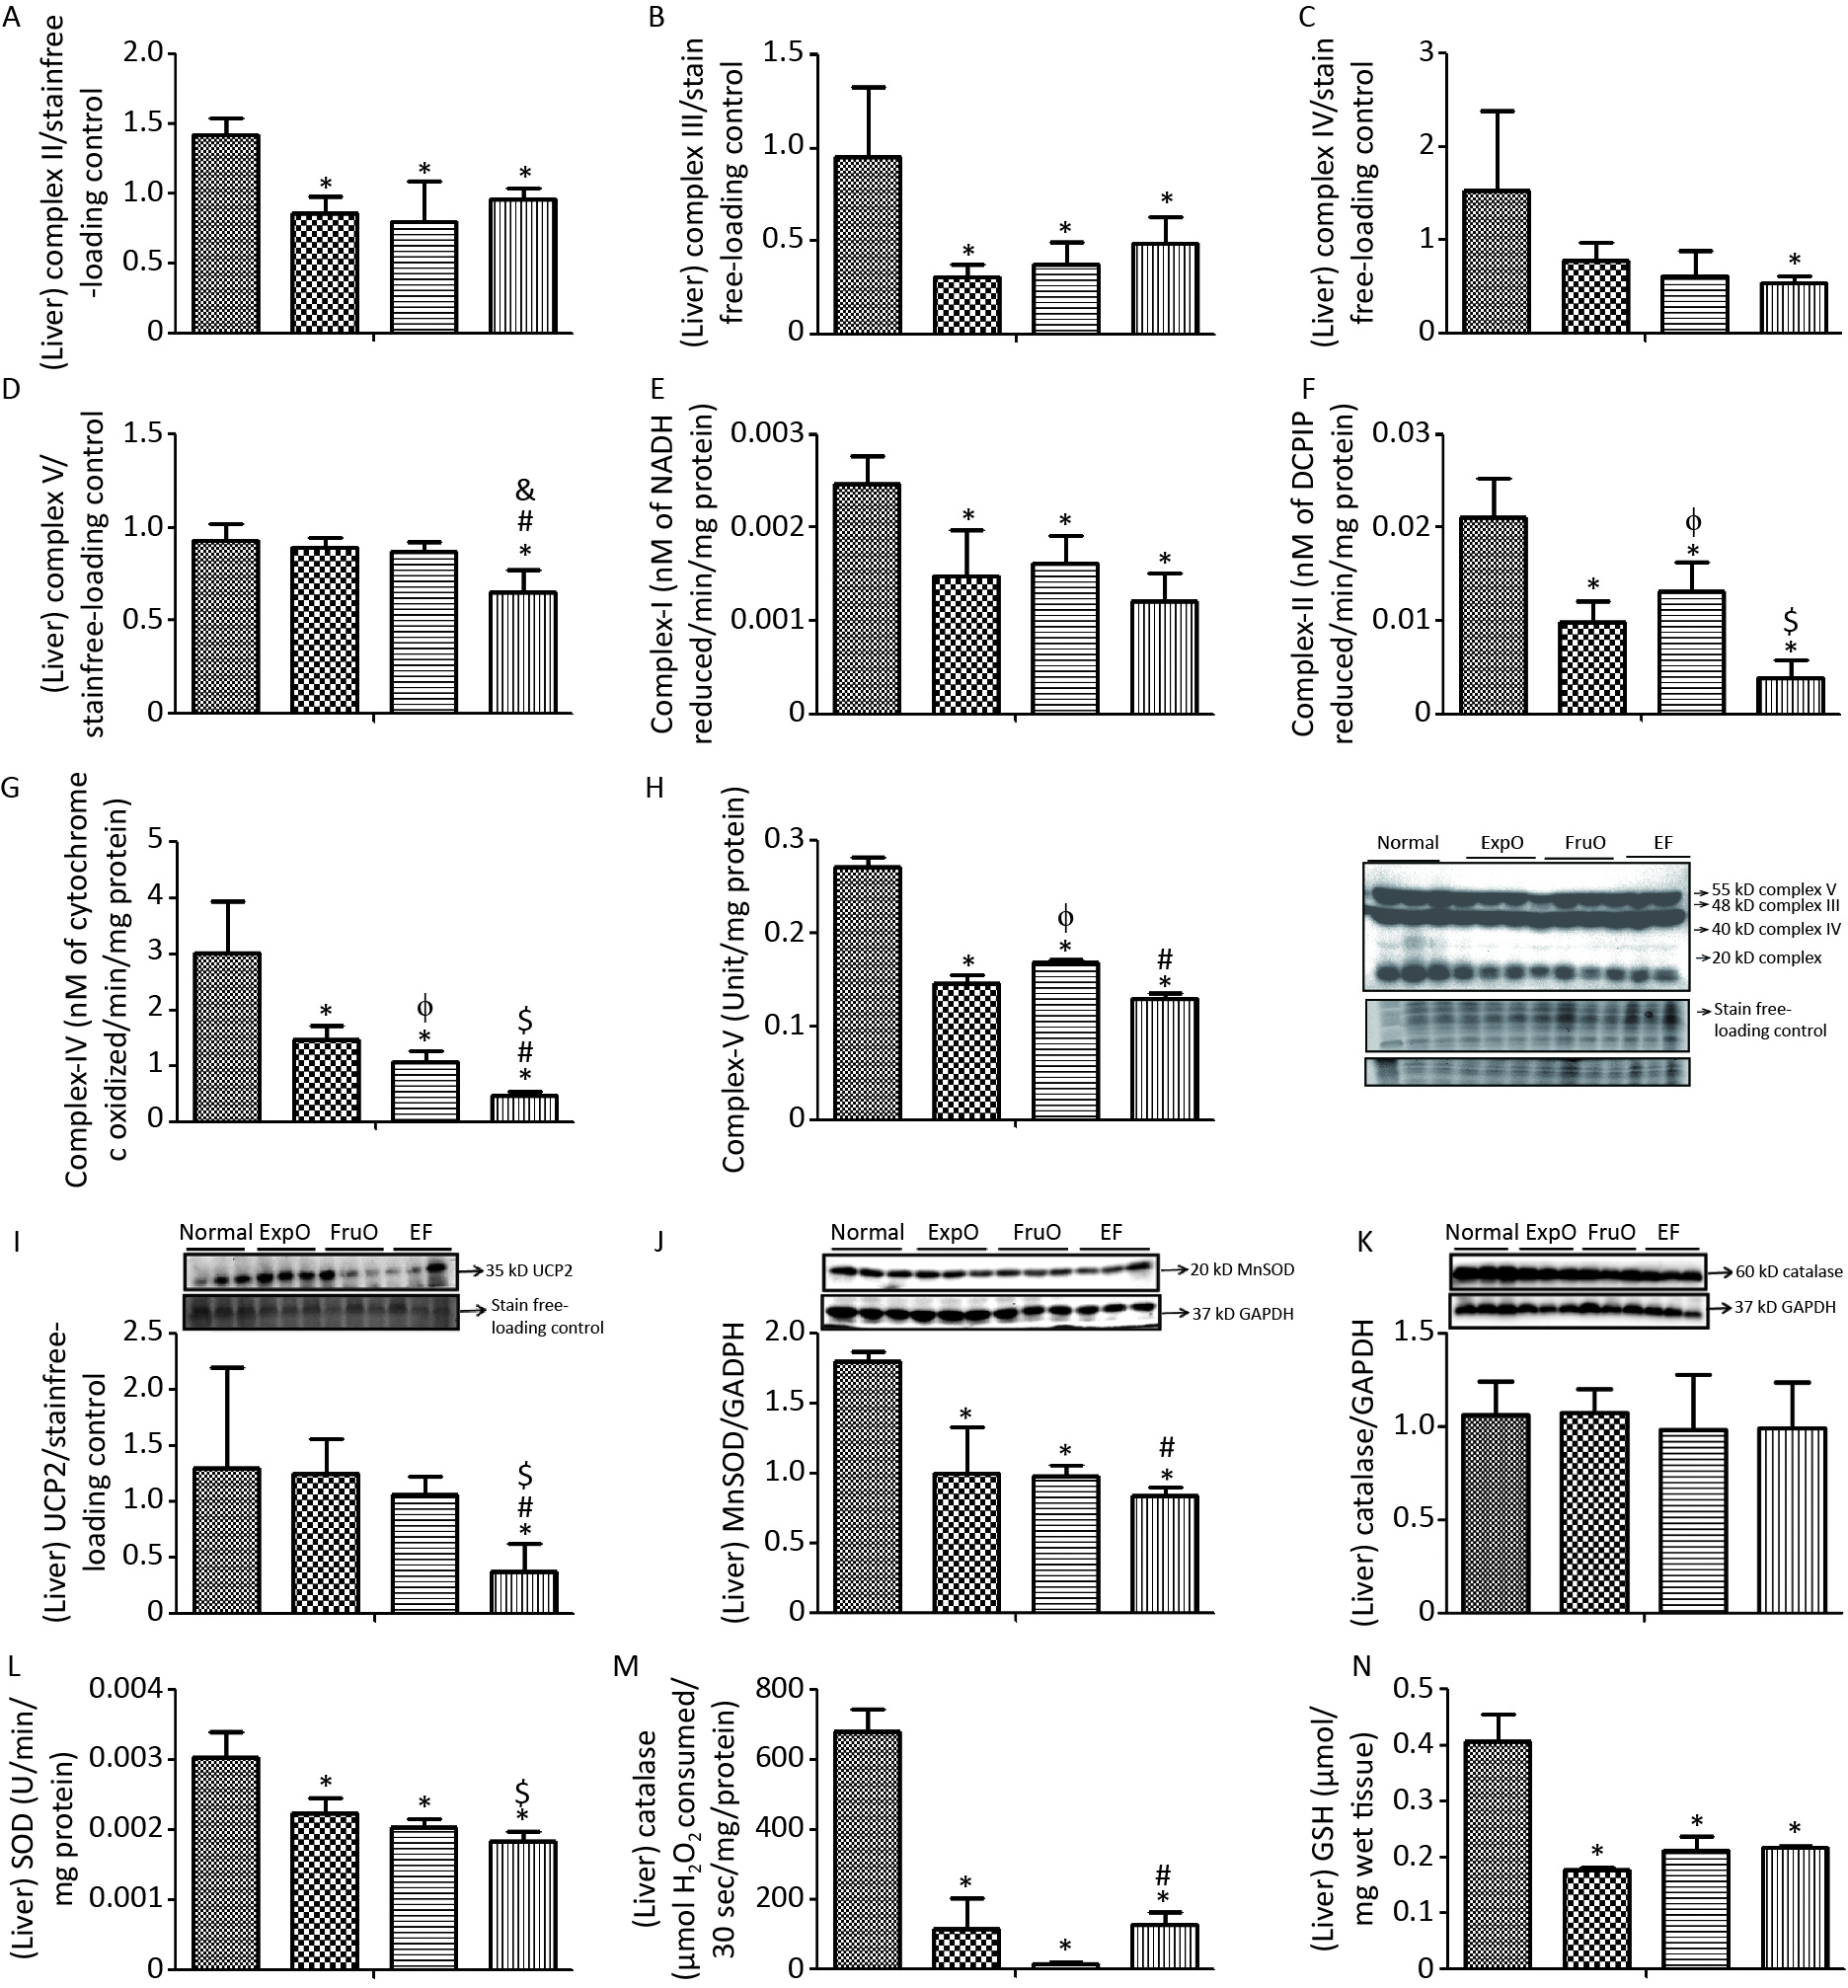
The expression of hepatic OXPHOS proteins, Complex II (Succinate-Ubiquinone Oxidoreductase), Complex III (Ubiquinol-Cytochrome C Oxidoreductase) was significantly reduced (P < 0.05) in ExpO, FruO, and EF than Normal (Figure 4A–B). Hepatic expression of Complex IV (Cytochrome C Oxidase) and Complex V (ATP synthase) was significantly reduced (P < 0.05) in the EF group compared to that in the Normal group (Figure 4C–D).
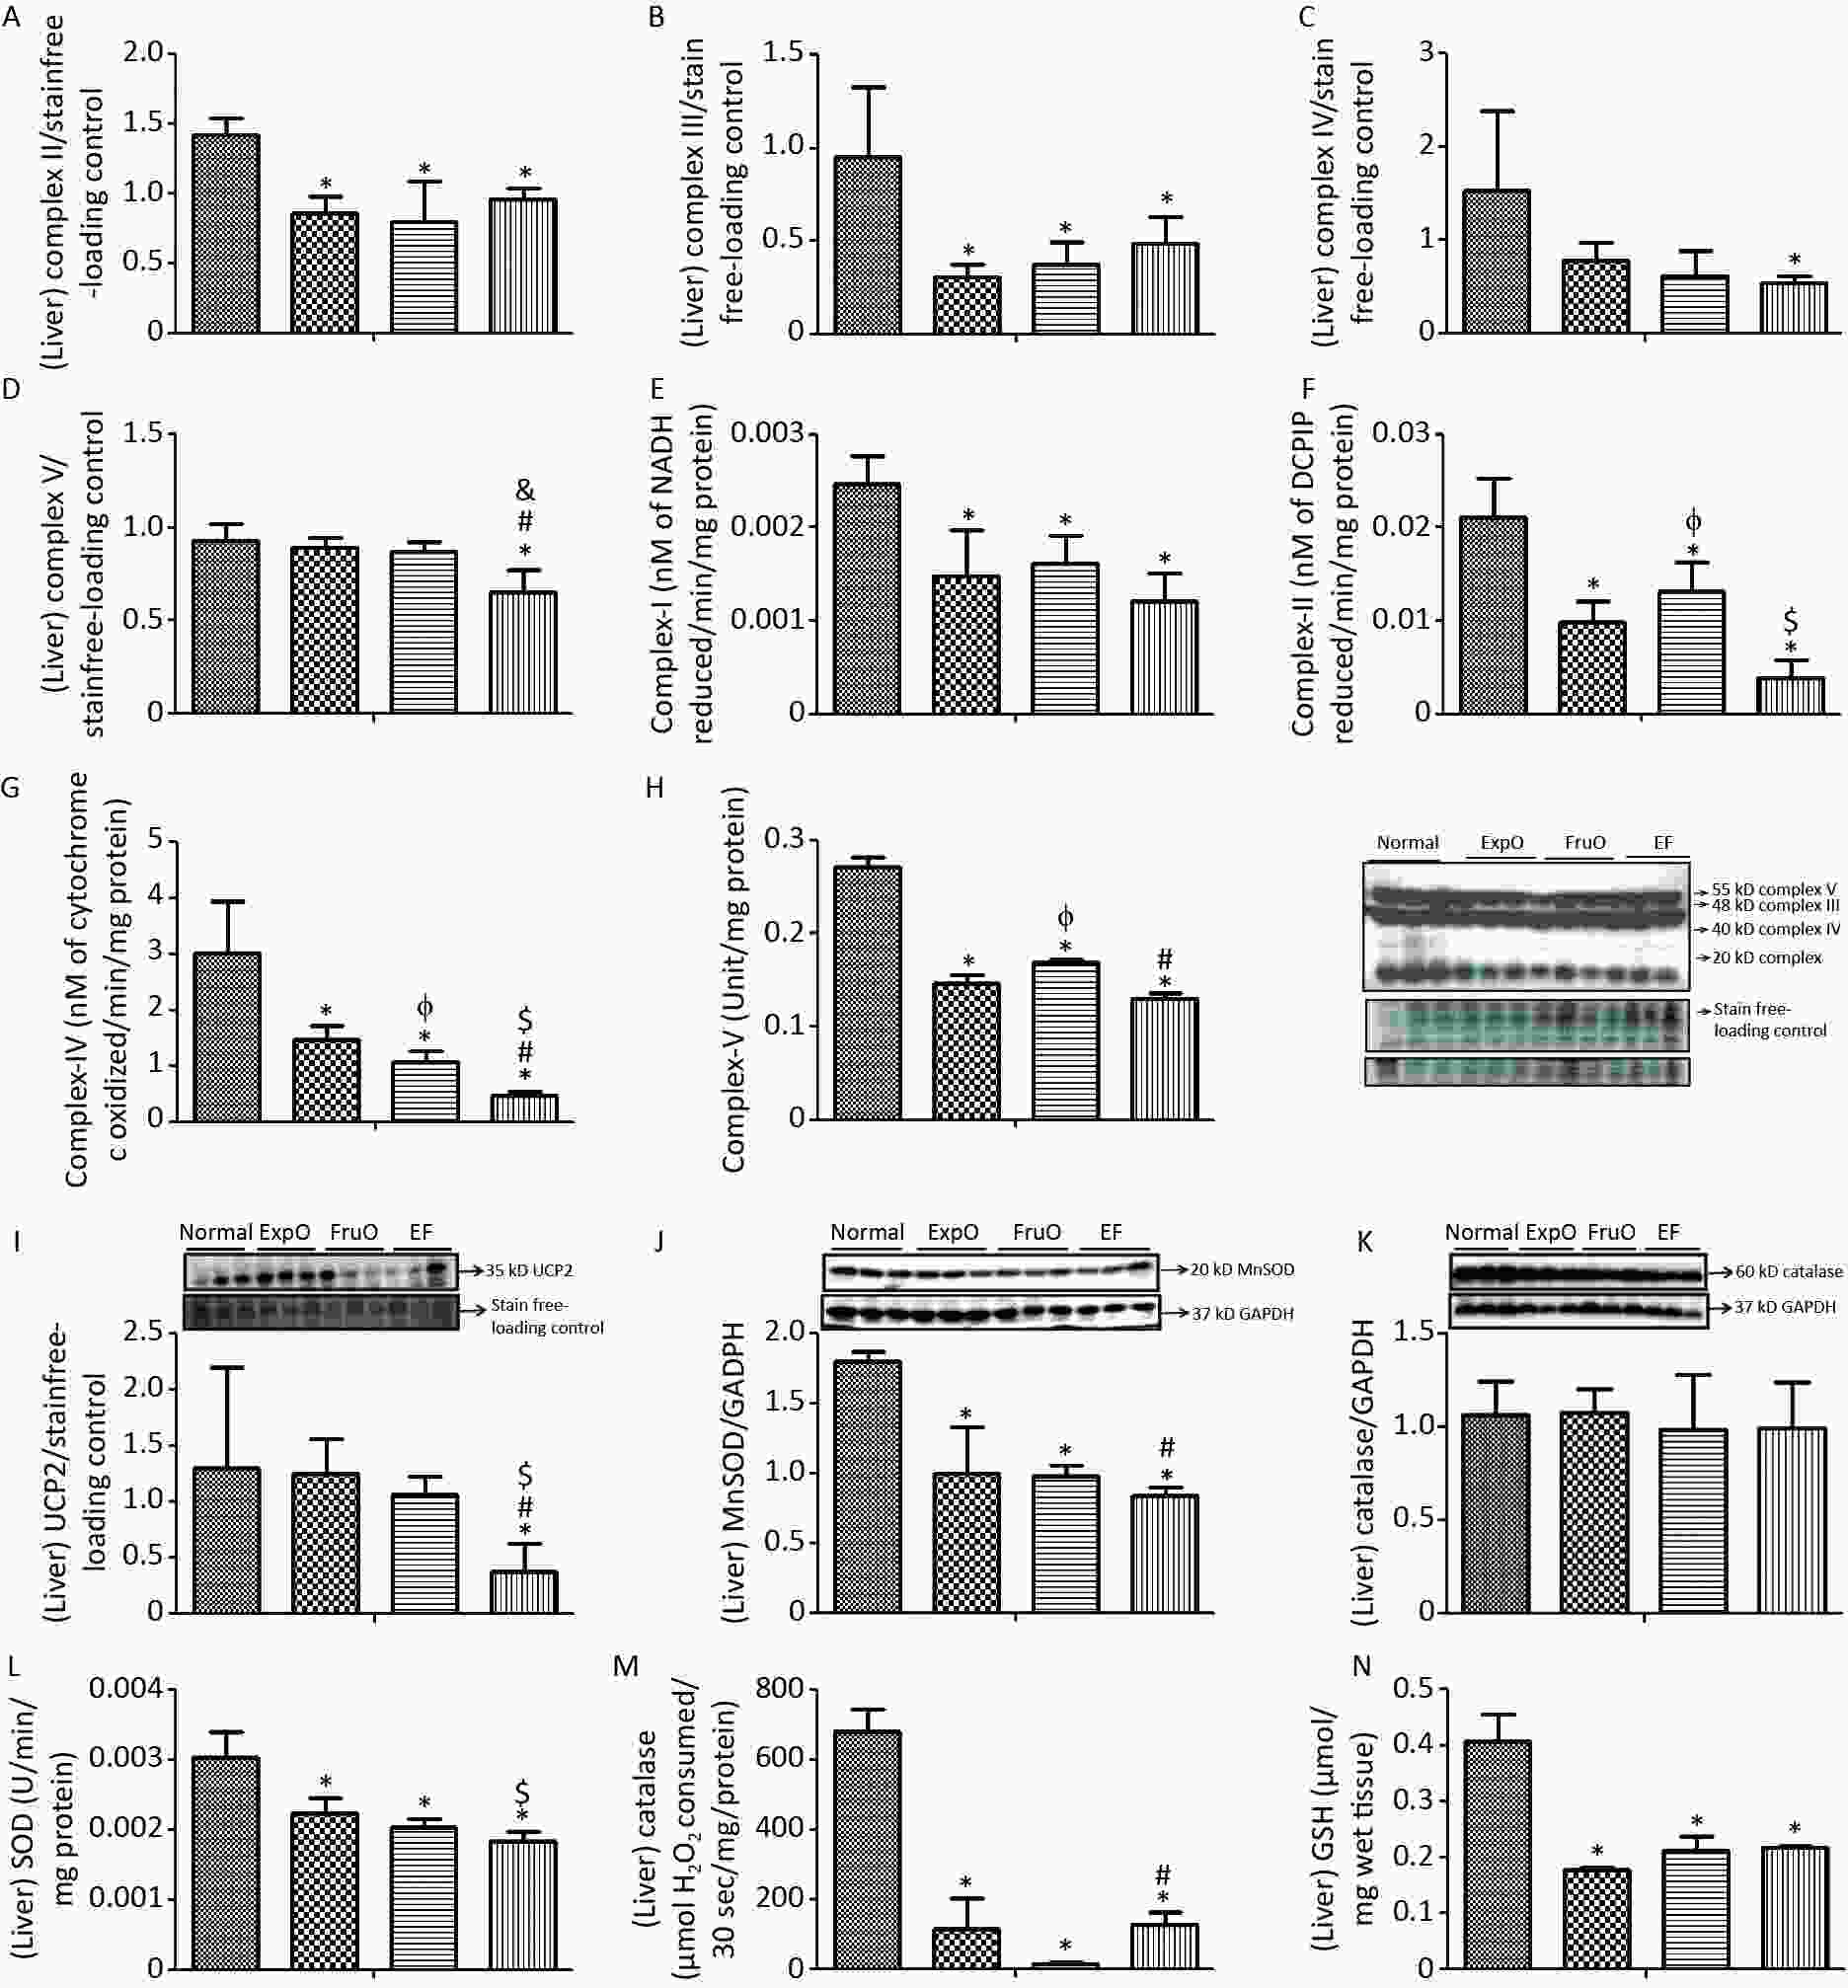
Figure 4. Effect of EMF and fructose consumption in childhood-adolescence interrupt hepatic mitochondrial oxidative phosphorylation (OXPHOS) Complex (I–V) in ATP production and skews the hepatic antioxidant defensive system by early adulthood. (A–B) Hepatic expression of Complex II and Complex III was significantly reduced in ExpO, FruO, and EF. (C–D) Expression of protein Complex IV and Complex V was significantly reduced in EF. (E, F, G, and H) Activity of Complex I, Complex II, Complex IV, and Complex V was markedly reduced in EF. (E) Hepatic expression of UCP2, a ROS regulator, was significantly reduced in EF (I) Expression of MnSOD, a ROS regulator, was significantly reduced in ExpO, FruO, and EF. (J) Expression of Catalase, which protects from ROS-induced oxidative damage, was significantly unchanged in EF. (K) Expression of Catalase was significantly reduced in EF. (L, M, and N) Activity of SOD, catalase, and GSH was significantly reduced in EF.
The hepatic OXPHOS enzyme NADH CoQ reductase (Complex I) activity was significantly lower (P < 0.05) in the ExpO, FruO, and EF groups than in the Normal (Figure 4E). Succinate-ubiquinone oxidoreductase (Complex–II) activity in the Normal, ExpO, FruO, and EF groups was 0.021 ± 0.004, 0.013 ± 0.003, 0.009 ± 0.002, and 0.004 ± 0.002 nmol/L, respectively and significantly reduced (P < 0.05) in the ExpO, FruO and EF groups compared to the Normal groups. A significant decrease (P < 0.05) in the activity of Complex IV in FruO and EF was recorded compared to that in ExpO (Figure 4F). The activity of cytochrome C oxidase (Complex IV) in Normal, ExpO, FruO, and EF was 3.02 ± 0.91, 1.05 ± 0.21, 1.47 ± 0.24, and 0.46 ± 0.07 nmol/L, respectively. Complex IV activity was significantly reduced (P < 0.05) in ExpO, FruO, and EF compared to Normal; FruO and EF also showed a significant decrease (P < 0.05) in the activity of Complex IV compared to ExpO (Figure 4G). The hepatic ATP synthase (Complex V) activity was significantly reduced (P < 0.05) in the ExpO and FruO groups compared to the Normal group. However, EF showed a significant decrease (P < 0.05) in Complex V activity compared to Normal, ExpO, and FruO. (Figure 4H). Taken together, the reduced hepatic OXPHOS activity in EF may be associated with mitochondrial dysfunction, leading to hep-IR.
The hepatic mitochondrial uncoupling protein (UCP2) expression was significantly decreased (P < 0.05) in the EF group compared to the Normal, ExpO, and FruO groups (Figure 4I). The hepatic expression of the proteins manganese superoxide dismutase (MnSOD) normalized with GAPDH was significantly reduced (P < 0.05) in the ExpO, FruO, and EF groups compared to the Normal group. EF showed a significant decrease (P < 0.05) in MnSOD expression compared to FruO (Figure 4J). The expression of hepatic catalase normalized to that of GAPDH remained unaffected in the EF (Figure 4K). The level of hepatic SOD enzyme in the Normal, ExpO, FruO, and EF groups was 0.003 ± 0.0003, 0.002 ± 0.0002, 0.007 ± 0.0002, and 0.0018 ± 0.0001 U, respectively, and significantly decreased (P < 0.05) in ExpO, FurO, and EF than Normal. SOD activity was significantly lower (P < 0.05) in the EF group than in the ExpO group (Figure 4L). Hepatic catalase and GSH levels were significantly lower (P < 0.05) in the ExpO, FurO, and EF groups than in the Normal group (Figure 4M–N). The results indicated that the combined effect of ELF exposure and fructose consumption during childhood and adolescence severely decreased the mechanisms of antioxidant activity in EF.
-
The hypothalamus mediates two important and interlinked roles via insulin: food intake and hexose metabolism regulation. The disruptive state of these two central functions is identified as hyp-IR, for which factors such as stress, inflammation, and a high-fat diet are implicated; however, the exact etiology remains unknown[37]. The liver is responsible for insulin-mediated glucose uptake, gluconeogenesis suppression, and lipolysis, and the disruption of these actions leads to the pathogenesis of hep-IR[38]. The hallmark of hep-IR is the dysregulation of two key gluconeogenic enzymes, phosphoenolpyruvate carboxykinase and glucose-6 phosphatase[39]. Thus, hyp-IR and hep-IR are characterized by altered insulin signaling that manifests as skewed food intake, hexose metabolism, and obesity, which are global health concerns[37].
Excess fructose consumption is believed to be a major contributing factor to chronic metabolic diseases, including IR, hypertriglyceridemia, nonalcoholic fatty liver disease, hyperglycemia, T2DM, obesity, and cancer[40]. According to data from the National Health and Nutrition Examination Survey, children aged 2–18 years derive 40% of their total energy from solid fats and added sugars present in soda, fruit drinks, dairy desserts, grain desserts, and pizza[41]. Consumption of high-fructose corn syrup has increased over the last 10–20 years, particularly among children and adolescents[42-45]. This increase has been associated with the emergence of IR, obesity, and metabolic problems in developing age groups.
We previously reported that weaned rats provided access to fructose solution (15%) for 8 weeks exhibited increased fasting blood glucose, decreased hepatic hexokinase, and decreased glucose tolerance by early adulthood[9]. Downregulation of intracellular signals such as PI3K/AKT and JAK-STAT3 has emerged as molecular evidence for IR development in early adulthood[9-11]. Here, we add to this knowledge by demonstrating the combined effects of two stressors [EMF from mobile phone (2 h/day) and unrestricted fructose (15%) consumption] during the pre-, peri-, and post-pubertal stages of development in the early pathogenesis of hyp-IR and hep-IR.
It has been established that the hypothalamus and liver communicate with each other via neuropeptides such as leptin, ghrelin, and NPY to regulate food intake, satiety, and energy expenditure, and the disruption of this pathway leads to the pathogenesis of IR[46-47]. In the present study, hypothalamic expression of AMPK and NPY was diminished in EF mice by early adulthood. This explains the imbalanced feeding behavior, metabolism, and insulin signaling in EF mice.
In the hypothalamus, the IRS1/PI3K/AKT is the dominant regulatory molecular pathway involved in hexose metabolism[48]. Here, for the first time, we provide crucial experimental data showing that central and peripheral master metabolic regulators (AMPK-SIRT1/UCP2-FOXO1), insulin receptor substrate signals (IRS1/PI3K/AKT), and mitochondrial function (OXPHOS) are severely disrupted in the pathogenesis of hyp-IR and hep-IR. These results, in conjunction with our previous data, explain the global epidemic of hyp-IR and hep-IR in children, adolescents, and young adults to a considerable extent[22].
Previous studies have shown that low ATP levels activate the energy sensor protein AMPK, which restores cellular ATP reserves via fatty acid oxidation[49-50]. We previously reported that AMPK expression is reduced in EF compared to the Normal group[22]. Here, we show here that in EF mice, mitochondrial oxidative phosphorylation and IRS may explain the shift in metabolism from glycolysis to gluconeogenesis.
SIRT1 is a sirtuin deacetylase target protein that regulates energy balance via mitochondrial OXPHOS, and functions as a sensor of redox changes and master metabolic regulators of mitochondrial homeostasis[51-52]. The present data show that the stressors of EMF from mobile phones and fructose consumption (EF) jointly reduce the protein expression of SIRT1 in the hypothalamus and liver to inhibit insulin signaling and mitochondrial oxidative phosphorylation, which have been implicated in IR development[53-54].
The Foxohead box protein 1 (FOXO-1) integrates insulin signaling with mitochondrial function, and is a critical mediator of impaired glucose homeostasis in hep-IR and mitochondrial oxidative stress[55-57]. In consonance, FOXO-1 expression in EF was reduced in both the hypothalamus and liver, which may have led to the disintegration of communication between the insulin receptor substrate proteins and mitochondrial oxidative function. It may be deduced that reduced FOXO-1, due to impaired deacetylation by SIRT 1, may be responsible for inhibiting the phosphorylation series of IRS1 the PI3K/AKT cascade. The PI3K/AKT pathway is one of the foremost signal transduction pathways that play a regulatory role in insulin sensitivity mediated by AMPK-SIRT1/FOXO-1, and its inhibition may be pivotal in the pathogenesis of IR[58-60]. It is evident from our present results that the reduced expression of IRS1 and p-PI3K decreased AKT phosphorylation in the hypothalamus and liver of EF to interrupt downstream insulin signaling (PI3K/ AKT pathway). In EF, AKT fails to regulate glycolysis in the hypothalamus and liver or activates hepatic gluconeogenesis by directly disrupting SIRT 1 mediated FOXO-1/AKT signaling activation.
Several studies have supported the hypothesis that mitochondrial dysfunction is a key pathomechanism linking obesity and T2DM, both of which are characterized by insulin resistance. A decrease in OXPHOS is most frequently associated with an increase in mitochondrial ROS generation, which has been linked to the onset and progression of metabolic changes[61-62]. Collectively, these results suggest that concomitant exposure to EMF-MPs and fructose consumption in childhood and adolescence decreases the hepatic oxidative phosphorylation capacity in EF in early adulthood. This leads to disturbed hepatic glucose and lipid homeostasis, which is linked to energy balance, particularly ATP production in EF mice.
Generally, the oxidation and reduction of nicotinamide adenine dinucleotide (NAD+/NADH) or flavine-adenine dinucleotide (FAD/FADH2) molecules by different protein complexes (complexes I–IV) generate a proton gradient in the intermembrane space of the organelles, which is used by ATP synthase (complex V) to convert ADP and organic phosphate into ATP[63]. In EF mice, reduced complex activity, along with increased ROS levels during OXPHOS, primarily in complexes I and III, lead to oxidative stress.
An intrinsic mitochondrial malfunction at the level of the oxidative phosphorylation system and electron transport chain results in mitochondrial dysfunction, which manifests as a primary defect and hinders insulin signaling, causing IR by activating a cascade of events, culminating in the intracellular diacylglycerol accumulation[64]. It has been hypothesized that a high-fructose diet reduces mitochondrial respiration and ATP generation[65]. Similarly, exposure to EMFs also affects biological systems by increasing ROS and altering the activities of antioxidant defense enzymes and the OXPHOS system[66-67].
Our study indicates that the combined effect of EMF-MPs and fructose consumption (15%) reduces OXPHOS (complexes I, II, III, and IV) in the electron transport chain. The transport of electrons generated from the oxidation of NADH and FADH2 is hindered during glycolysis, and beta-oxidation alters the electrochemical gradient. Furthermore, reduced complex V activity leads to decreased oxidative capacity, mitochondrial dysfunction, and reduced ATP production in EF mice.
UCP2 is an anion carrier expressed in the mitochondrial inner membrane that uncouples oxygen consumption by the respiratory chain from ATP synthesis and acts as a negative regulator of ROS production in the mitochondrial respiratory chain[68-69]. Here, we report that in EF, the hypothalamic and hepatic UCP2 expression is decreased compared to that in normal tissue. Our findings showed that in EF mice, the expression of mitochondrial OXPHOS proteins (complexes I, II, III, IV, and ATPase) was reduced, and oxidative stress was increased in the hypothalamus and liver. Moreover, reduced levels of intracellular SOD, catalase, and GSH activity, along with decreased hypothalamic and hepatic mitochondrial MnSOD expression in EF mice indicate that the pathway responsible for mitigating oxidative stress is diminished.
Taken together, these data show that the concomitant effect of EMF-MPs and 15% fructose consumption leads to the development of hypothalamic and hepatic insulin resistance in EF by early adulthood. Central and peripheral master metabolic regulators (AMPK-SIRT1/UCP2-FOXO1), insulin receptor substrate signals (IRS1/PI3K/AKT), and mitochondrial functions (OXPHOS) were severely disrupted. Impaired master metabolic regulators perturb insulin signaling and diminish mitochondrial OXPHOS. This study is clinically relevant as it provides evidence that exposure to EMF-MPs with unrestricted 15% fructose consumption during childhood and adolescence causes IR in adulthood, which may become a major risk factor for the development of NAFLD and metabolic syndrome by early adulthood.
-
These data indicate that the EMF from mobile phones and fructose consumption during childhood-adolescence coalesce to mitigate master metabolic regulators (AMPK-SIRT1) and signals of oxidative phosphorylation and insulin functions (UCP2 and FOXO1) in the hypothalamus and liver, ultimately initiating the genesis of hyp-IR and hep-IR by early adulthood.
HTML
Animals
EMF Exposure
Specific Absorption Rate (SAR) Value
Sample Collection
Western Blotting
Determination of Oxidative Stress Markers Activity
Superoxide Dismutase
Catalase
Reduced Glutathione
Isolation of Mitochondrial Enriched Fraction
Hypothalamus
Liver
Determination of Mitochondrial Respiratory Chain (Oxidative Phosphorylation)–Enzyme Activity
NADH-ubiquinone Oxidoreductase (Complex I Activity)
Succinate-ubiquinone Oxidoreductase (Complex II Activity)
Cytochrome C Oxidase (Complex IV Activity)
ATPase Synthase (Complex V Activity)
Statistical Analysis
Effect of EMF from Mobile Phone and Fructose Consumption on Hypothalamic Master Metabolic Regulators (AMPK, SIRT-1, FOXO-1), Insulin Signaling (IRS-PI3K/AKT) Pathway, OXPHOS, and Antioxidant Defense System
Effect of EMF from Mobile Phone and Fructose Consumption on Hepatic Master Metabolic Regulators (AMPK, SIRT 1, FOXO 1), Insulin Signaling (IRS-PI3K/AKT) Pathway, OXPHOS, and Antioxidant Defense System
CONFLICTS OF INTEREST The authors declare no conflicts of interest.

 Quick Links
 DownLoad: