


-
Human epidermal growth factor receptor-2 (HER2) is a transmembrane tyrosine protein kinase receptor with intracellular tyrosine kinase activity[1]. HER2 amplification or transcriptional dysregulation leading to overexpression of HER2 protein can enhance kinase-mediated activation of downstream signaling pathways[2], which results in promotion of cell proliferation and migration. Therefore, HER2 is regarded as a negative prognostic factor associated with resistance to endocrine therapy and chemotherapy regimens[3]. Accounting for 15%–20% of breast cancer (BC) cases, HER2-positive BC, defined as BC harboring HER2 over expression and/or amplification, is reportedly more aggressive and has a poorer prognosis compared to other BC types[4,5]. Fortunately, HER2-targeted drugs, such as trastuzumab, pertuzumab, lapatinib, and trastuzumab emtansine (T-DM1), have been widely used to treat patients with HER2-positive BC, which changes the natural biological process of this disease[6]. Despite the tremendous success of anti-HER2 therapy for patients with HER2-positive BC, administration of conventional HER2-directed agents reportedly has a limited effect on HER2-negative BC cases, that is, BC without HER2 overexpression or amplification[7]. Currently, trastuzumab deruxtecan, also known as T-DXd or DS-8201, a novel antibody-drug conjugate (ADC) targeting HER2, is being widely used in the field of anti-HER2 therapy and has already been approved for patients with metastatic, HER2-positive BC who have received ≥ 2 prior anti-HER2–based regimens[8,9]. Comprising anti-HER2 monoclonal antibody (MoAb) trastuzumab, a cleavable tripeptide-based linker, and a topoisomerase I inhibition payload with a drug-antibody ratio of 8:1, T-DXd evokes potent antitumor activity against tumor cells with HER2 overexpression as well as surrounding and bystander tumor cells with low HER2 expression[10]. Favorable outcomes have been reported in the phase 3 Destiny-Breast04 (NCT03734029) clinical trial, where T-DXd substantially improved the progression-free survival (PFS) and overall survival (OS) of patients with low HER2 expression compared with those observed in the physician's choice group[11]. The United States Food and Drug Administration approved T-DXd for treatment of adult patients with unresectable or metastatic HER2-low BC who had received prior chemotherapy in a metastatic setting or who developed disease recurrence during or within six months of completing adjuvant chemotherapy[12]. Subsequently, the concept of “HER2-low” was proposed and traditional dichotomous classification of HER2 status was challenged. HER2-low BC is heterogeneous and comprises hormone receptor (HR)-positive and-negative BC with variable clinicopathological features and genetic profiles[13]. Whether HER2-low is a latent biological subtype and an independent prognostic factor that could guide the choice of classical systematic treatment or a subgroup that can only benefit from novel ADC is an ongoing debate[14]. Majority of the previous studies have indicated that HER2-low was enriched in HR-positive group and that clinicopathological features along with survival performance were associated with HR status and disease stage[15,16]. However, there were several studies that found no prognostic importance associated with HER2-low and no solid evidence that HER2-low can be regarded as a distinct category[17-20]. Recently, the European Society for Medical Oncology (ESMO) disseminated an expert consensus on the definition, diagnosis, and management of HER2-low BC, asserting that HER2-low should not be categorized as an independent subtype of BC[21]. Furthermore, substantial evidence validating HER2-low as an independent prognostic factor remains lacking[22,23]. Despite the increasing number of retrospective studies focusing on HER2-low, only a few have been conducted on HER2-low in the Chinese population. Moreover, current studies on HER2-low definition are associated with metastatic BC; however, less is known about early stage BC, which limits early intervention and precise treatment in the era of personalized therapy. Therefore, we conducted this single-center, long-term follow-up, retrospective study in a Chinese population to compare the clinicopathological features and survival differences between patients with HER2-low and HER2-immunohistochemistry (IHC)0 early BC.
-
Patients diagnosed with BC at the Chinese PLA General Hospital between January 2011 and December 2015 formed our study population. Demographic and clinical variables of the participants were extracted from the electronic medical records. The inclusion criteria were as follows: (1) diagnosis of BC made using presurgical core needle biopsy or surgical specimens; (2) stage I–III disease; and (3) patients who did not receive any neoadjuvant radiotherapy, chemotherapy, or endocrine therapy prior to surgery. The exclusion criteria were: (1) combination with other malignant tumors; (2) failure to obtain clinical information or patients lost to follow-up; and (3) bilateral BC or ductal carcinoma in situ.
The following clinicopathological information of the study participants was retrieved from the medical records: age; menopausal status; histological type; nuclear grade; tumor, node, and metastasis stage (American Joint Committee on Cancer, AJCC 8th edition); estrogen receptor (ER) status; progesterone (PR) status; HER2 status; Ki-67 index; and adjuvant treatment regimen. Follow-ups were performed by periodically reviewing patient records between surgery and the last follow-up in December 2022.
-
ER, PR, HER2, Ki-67, and TOP2A expression levels were assessed using IHC. According to the American Society of Clinical Oncology/College of American Pathologists (ASCO/CAP) guidelines updated in 2018[3], HER2 positivity refers to HER2 IHC3+ or HER2 IHC2+ with HER2 amplification testing by fluorescence in situ hybridization (FISH) (HER2 IHC2+/FISH+), whereas HER2 negativity refers to HER2 IHC0, IHC1+, or IHC2+ with FISH. In this study, HER2-low expression was defined as HER2 IHC1+2+/FISH- in accordance with the ESMO expert consensus statements on HER2-low BC[24]. In the context of ER and PgR status, samples demonstrating 1%–100% tumor nuclei positivity for ER or PgR were interpreted as positive. If 1%–10% of the tumor cell nuclei were immunoreactive, the sample was reported as ER-low[25]. Recurrent and metastatic lesions were rebiopsied in patients with relapsed disease. Core-needle biopsy was performed under ultrasound guidance or surgery. GATA3, mammaglobin, and GCDFP15 were tested to confirm the breast origin of metastatic tumors. All pathological specimens were independently reviewed by at least two experienced pathologists at the Chinese PLA General Hospital.
-
The primary aim of this study was to compare disease-free survival (DFS) and OS between the HER2-IHC0 and HER2-low subgroups in terms of HR status. DFS was calculated as the time from random assignment to relapse, secondary malignancy, or death from any cause. OS was defined as the time from random assignment to death from any cause. The secondary aims of this study were: (i) to determine the differences in DFS and OS between the HER2-IHC0 and HER2-low subgroups in the HR+ and HR- subgroups, respectively, and (ii) to determine the correlation between ER status and clinicopathological parameters in the HER2-IHC0 and HER2-low groups. The exploratory aims were: (i) to analyze the DFS and OS differences between the HER2-IHC0 and HER2-low groups at different ER levels, and (ii) to confirm the instability of HER2 IHC status at primary and metastatic sites.
-
The distribution of measurement data was examined using the Shapiro-Wilk test. For normally distributed data, means ± standard deviations were reported, and group comparisons were performed using the t‐test. Non-normally distributed continuous variables were described using medians and interquartile ranges, and group differences were assessed using the Wilcoxon rank-sum test. Categorical data with skewed distributions were presented as counts and percentages, and intergroup comparisons were performed using either Chi-square or Fisher’s exact test. DFS and OS were estimated using the Kaplan-Meier (K-M) method, and the outcomes were compared using the log-rank test. The median follow-up period was calculated using the reverse KM method. COX regression analysis was used for univariate and multivariate survival analyses and hazard ratios (HR) with 95% confidence intervals (CI). Variables considered clinically relevant (P < 0.05) in the univariate analyses were entered into the multivariate COX proportional hazards regression model. Correlations between HER2 expression and ER status were determined using the Mantel-Haenszel χ2 test. The Cohen’s kappa coefficient (k) was used to evaluate the concordance between HER2 expression in primary tumors and matched biopsies. All tests were two-sided and level of significance was set at P < 0.05. Statistical analyses were performed using the SPSS version 25 (SPSS Inc., Chicago, IL, USA), GraphPad Prism version 9.3.1 (GraphPad Software, San Diego, California, USA) and R software version 4.3.1 (http://cran.r-project.org).
-
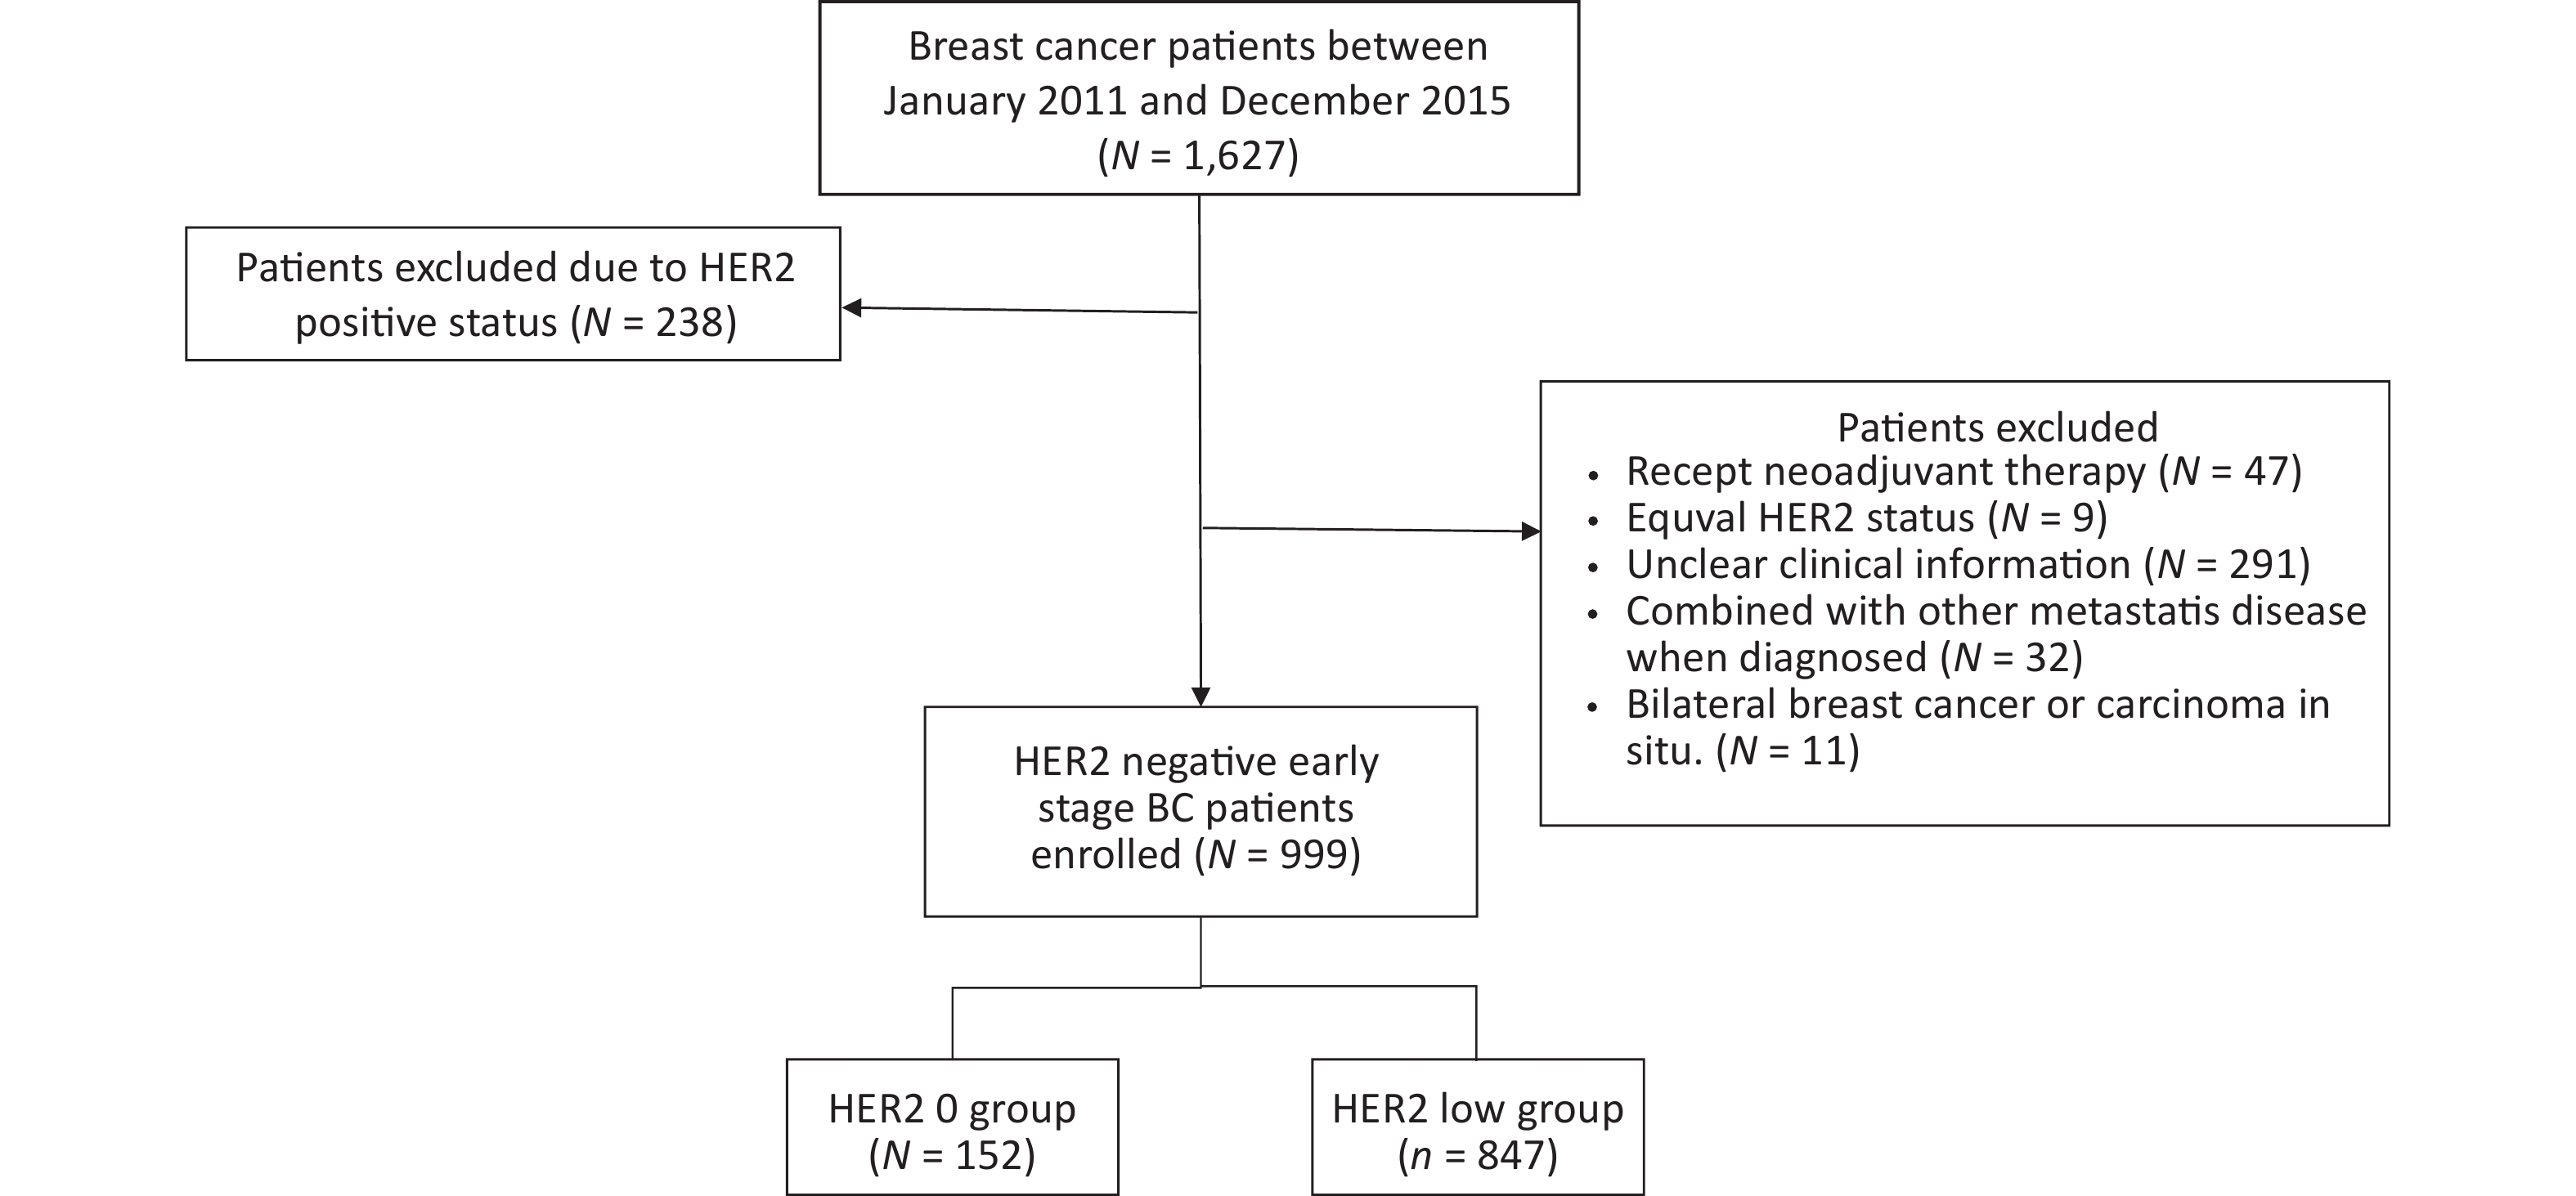
A total of 1,627 patients were diagnosed with early stage BC between January 2011 and December 2015. Of these, 238 patients were excluded due to HER2-positive status, and 390 HER2-negative patients were not included in the study on the basis of exclusion criteria. Ultimately, 999 patients were included in the further analyses. A flowchart depicting the progression of study is shown in Figure 1.

Figure 1. Study flowchart. BC, Breast cancer; HER2, human epidermal growth factor receptor-2.
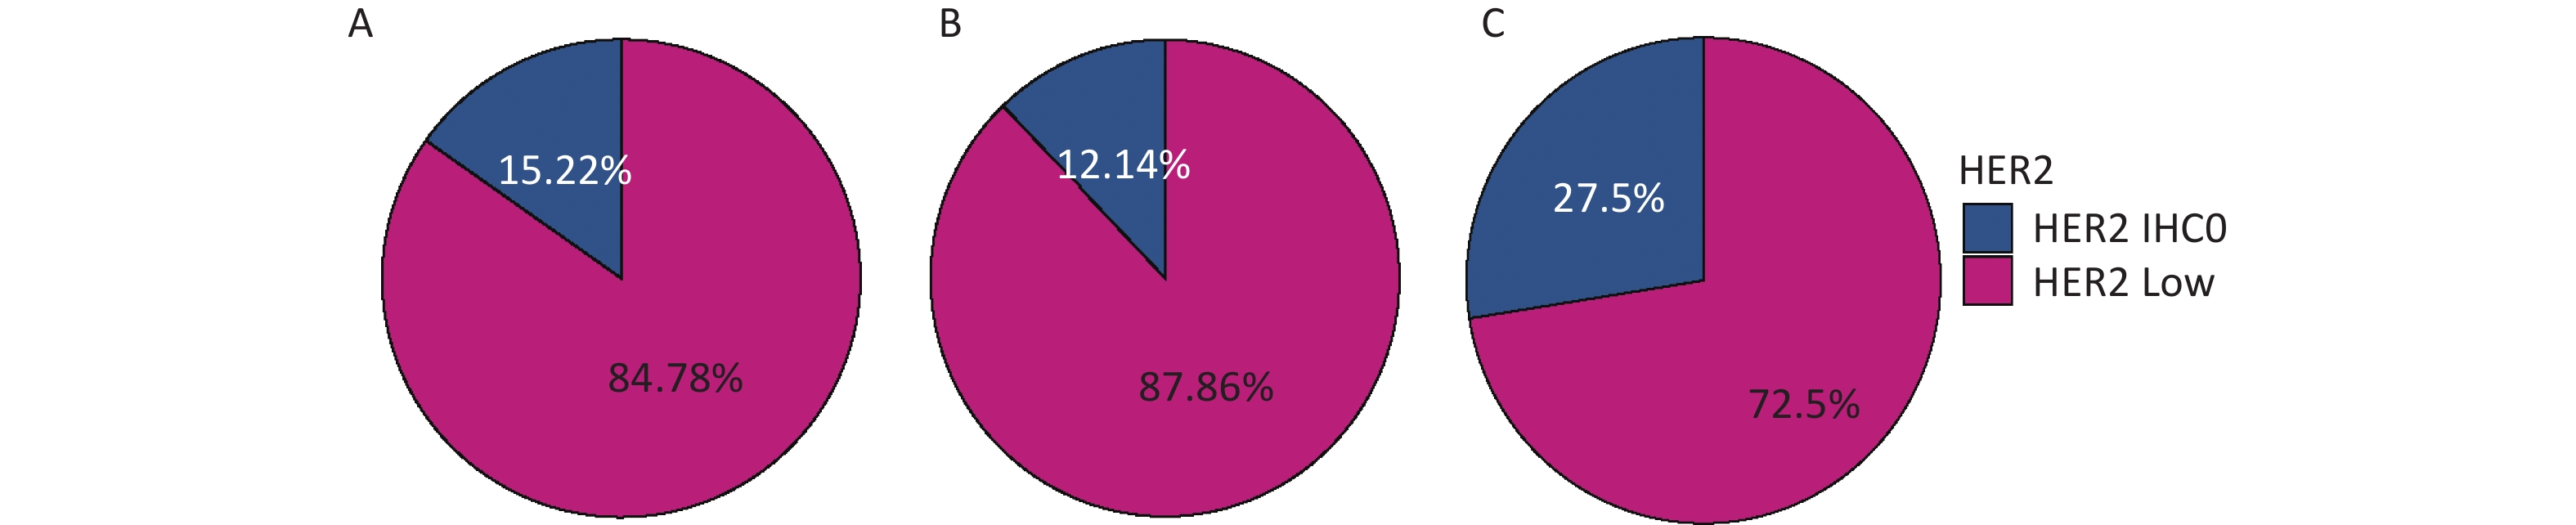
The percentages of HER2-low in the whole cohort, HR-positive group, and HR-negative group were 84.78%, 87.86%, and 72.5%, respectively, as shown in Figure 2.
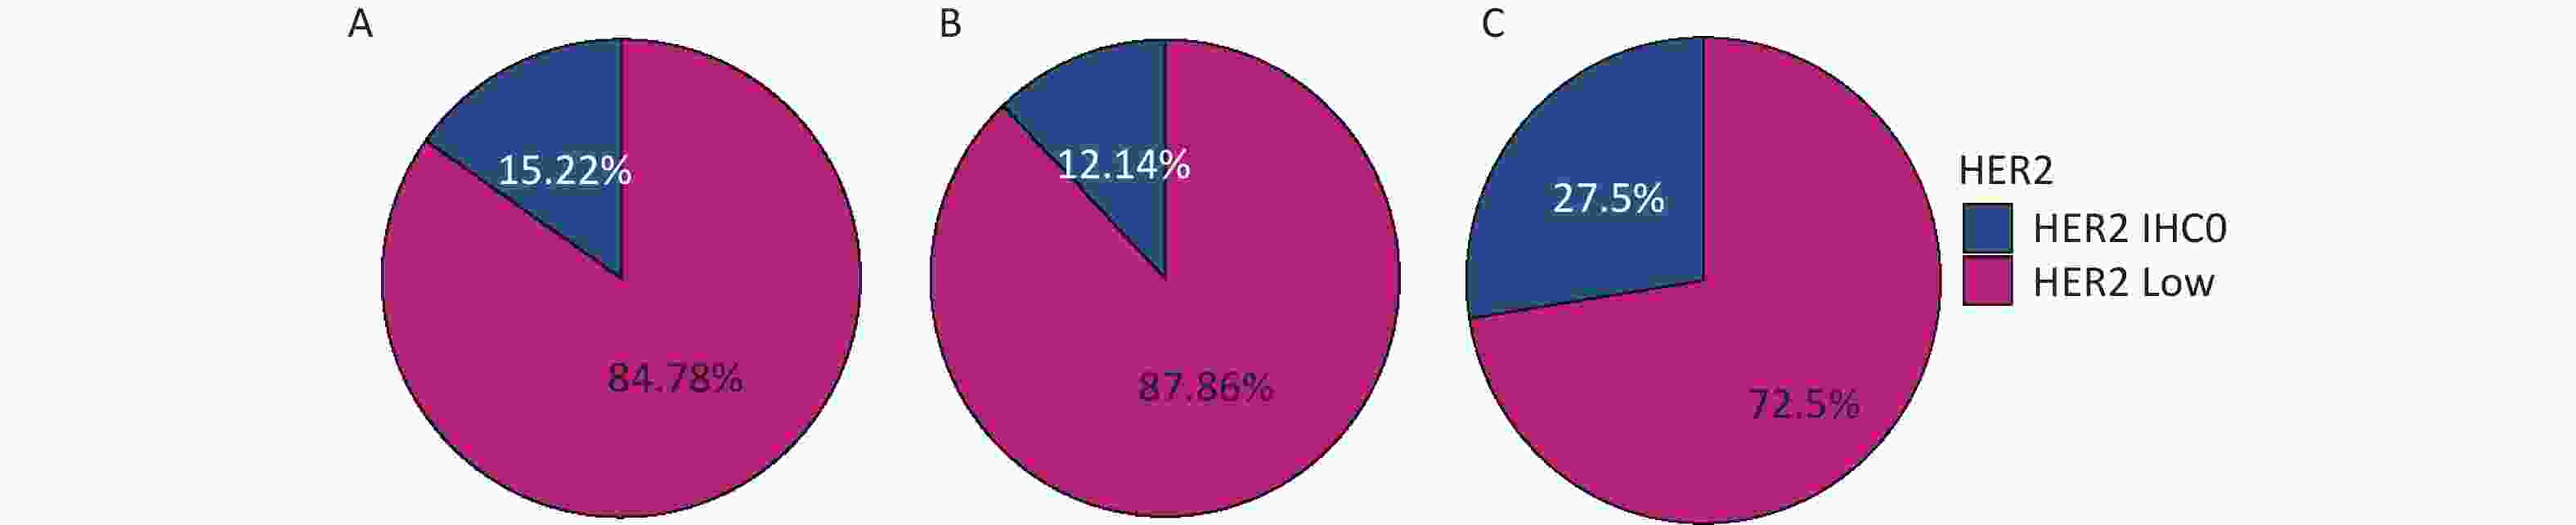
Figure 2. Distribution of HER2-low in (A) the whole cohort; (B) HR-positive group; (C) HR-negative group. HER2, human epidermal growth factor receptor-2; IHC, immunohistochemistry.
The median age of patients at the time of diagnosis was 49.00 years. A total of 55.0% of the patients had a body mass index (BMI) less than 25 kg/m2, and 55.0% of the patients were postmenopausal at the time of diagnosis. The most prevalent histological type was invasive ductal carcinoma (90.0%), with the highest grade being grade 2 (67%). Majority of the patients in our cohort had T1 and T2 disease (97.0%), and more than half of the patients had node-negative disease (60%). ER negativity (37% vs. 19%) and low ER levels (5.9% vs. 4.3%) were more frequently observed in the HER2-IHC0 group than in the HER2-low group. On the other hand, the frequency of ER levels being > 10% was higher in the HER2-low group than in the HER2-IHC0 group (76% vs. 57%, P < 0.001). The rate of PR positivity was also higher in the HER2-low group (77% vs. 61%, P < 0.001). In the context of treatment regimen, a significantly higher proportion of endocrine therapy was observed in the HER2-low group (80% vs. 32%, P < 0.001). No significant differences were found between the HER2-low and HER2-IHC0 groups in terms of age at the time of diagnosis, BMI, menopausal status, histological type, T stage, N stage, Ki-67 index, or TOP2A expression. Details of the clinicopathological factors of the HER2-IHC0 and HER2-low subgroups in the entire cohort are presented in Supplementary Table S1 (available in www.besjournal.com).
Characteristic Overall
N = 9991HER2 IHC 0
N = 1521HER2 low
N = 8471P value2 Age 49.00 (43.00, 59.00) 49.00 (42.75, 61.25) 50.00 (43.00, 59.00) 0.9 Age group, years 0.070 < 40 138 (14%) 25 (16%) 113 (13%) 40−59 622 (62%) 82 (54%) 540 (64%) > 59 239 (24%) 45 (30%) 194 (23%) BMI, kg/m2 0.7 ≤ 25 553 (55%) 82 (54%) 471 (56%) > 25 446 (45%) 70 (46%) 376 (44%) Menopausal 0.8 premenopausal 549 (55%) 82 (54%) 467 (55%) postmenopausal 450 (45%) 70 (46%) 380 (45%) Histology3 0.13 IDC 903 (90%) 133 (88%) 770 (91%) ILC 33 (3.3%) 4 (2.6%) 29 (3.4%) Others 63 (6.3%) 15 (9.9%) 48 (5.7%) Grade 0.2 1 59 (5.9%) 10 (6.6%) 49 (5.8%) 2 665 (67%) 92 (61%) 573 (68%) 3 275 (28%) 50 (33%) 225 (27%) T > 0.9 1 538 (54%) 83 (55%) 455 (54%) 2 431 (43%) 65 (43%) 366 (43%) 3 30 (3.0%) 4 (2.6%) 26 (3.1%) N > 0.9 0 596 (60%) 89 (59%) 507 (60%) 1 241 (24%) 38 (25%) 203 (24%) 2 102 (10%) 17 (11%) 85 (10%) 3 60 (6.0%) 8 (5.3%) 52 (6.1%) Stage 0.7 Ⅰ 402 (40%) 59 (39%) 343 (40%) Ⅱ 450 (45%) 67 (44%) 383 (45%) Ⅲ 147 (15%) 26 (17%) 121 (14%) ER4 , % < 0.001 0 220 (22%) 56 (37%) 164 (19%) 1−10 45 (4.5%) 9 (5.9%) 36 (4.3%) > 10 734 (73%) 87 (57%) 647 (76%) PR5 < 0.001 negative 256 (26%) 60 (39%) 196 (23%) positive 743 (74%) 92 (61%) 651(77%) Ki67 0.5 < 14% 216 (22%) 36 (24%) 180 (21%) ≥ 14% 783 (78%) 116 (76%) 667 (79%) TOP2A, % 0.8 < 30 866 (87%) 134 (88%) 732 (86%) 30−60 97 (9.7%) 13 (8.6%) 84 (9.9%) > 60 36 (3.6%) 5 (3.3%) 31 (3.7%) Radiotherapy 0.9 No 798 (80%) 122 (80%) 676 (80%) Yes 201 (20%) 30 (20%) 171 (20%) Chemotherapy > 0.9 No 372 (37%) 56 (37%) 316 (37%) Yes 627 (63%) 96 (63%) 531 (63%) Endocrine therapy < 0.001 No 272 (27%) 103 (68%) 169 (20%) Yes 727 (73%) 49 (32%) 678 (80%) Note. 1Median (IQR); n (%); 2Wilcoxon rank sum test; Pearson's Chi−squared test; Fisher's exact test; 3 IDC, invasive ductal carcnoma; ILC: invasive lobular carcinoma; 4ER: estrogen receptor; 5PR: progesterone receptor. T, T stage; N, N stage. Table S1. Demographic characteristics of the HER2−IHC0 and HER2 low groups in the whole cohort
We then analyzed these factors based on the HR groups. In the HR-positive group, a higher proportion of Ki-67 was observed in the HER2-low group (75% vs. 66%, P = 0.048), and no significant differences were found between the HER2-IHC0 and HER2-low groups in terms of other clinicopathological characteristics. More number of patients in the HER2-low group received adjuvant endocrine therapy (97% vs. 51%, P < 0.001). However, in the HR-negative group, more number of patients with HER2-low had invasive ductal type BC (94% vs. 84%, P = 0.021) and no differences were observed in terms of other factors, including treatment. Details of the clinicopathological characteristics of the patients stratified by HR status are presented in Table 1.
Characteristics Hormone receptor negative Hormone receptor positive HER2 IHC0
(N = 55)1HER2 Low
(N = 145)1P value2 HER2 IHC0
(N = 97)1HER2 Low
(N = 702)1P value2 Age (years) 48 (41, 59) 51 (43, 59) 0.6 49 (44, 62) 49 (43, 59) 0.500 Age group (years) 0.3 0.200 < 40 12 (22) 23 (16) 13 (13) 90 (13) 40−59 29 (53) 93 (64) 53 (55) 447 (64) > 59 14 (25) 29 (20) 31 (32) 165 (24) BMI (kg/m2) 0.5 0.300 ≤ 25 34 (62) 82 (57) 48 (49) 389 (55) > 25 21 (38) 63 (43) 49 (51) 313 (45) Menopausal 0.6 0.800 0 28 (51) 68 (47) 42 (43) 312 (44) 1 27 (49) 77 (53) 55 (57) 390 (56) Histology 0.021 0.400 IDC 46 (84) 137 (94) 87 (90) 633 (90) ILC 2 (4) 0 (0) 2 (2) 29 (4.1) Other 7 (13) 8 (5.5) 8 (8.2) 40 (5.7) Grade > 0.9 0.500 2 26 (47) 68 (47) 66 (68) 505 (72) 3 29 (53) 77 (53) 21 (22) 148 (21) 1 0 (0) 0 (0) 10 (10) 49 (7) T 0.4 > 0.9 1 28 (51) 64 (44) 55 (57) 391 (56) 2 26 (47) 80 (55) 39 (40) 286 (41) 3 1 (2) 1 (1) 3 (3) 25 (7) N > 0.9 0.800 0 33 (60) 87 (60) 56 (58) 420 (60) 1 10 (18) 30 (21) 28 (29) 173 (25) 2 8 (15) 16 (11) 9 (9) 69 (10) 3 4 (7) 12 (8) 4 (4) 40 (6) Stage 0.2 0.500 Ⅰ 24 (44) 47 (32) 35 (36) 296 (42) Ⅱ 20 (36) 73 (50) 47 (48) 310 (44) Ⅲ 11 (20) 25 (17) 15 (15) 96 (14) ER proportion (%) 0.200 0 55 (100) 145 (100) 1 (1) 19 (3) 1−10 − − 9 (9) 36 (5) > 10 − − 87 (90) 647 (92) PR 0.400 Negative 55 (100) 145 (100) 5 (5) 51 (7) Positive − − 92 (95) 651 (93) ki−67 proportion (%) > 0.9 0.048 < 14 3 (6) 7 (5) 33 (34) 173 (25) ≥ 14 52 (95) 138 (95) 64 (66) 529 (75) Radiotherapy 0.4 0.500 No 42 (76) 118 (81) 80 (82) 558 (79) Yes 13 (24) 27 (19) 17 (18) 144 (21) Chemotherapy > 0.9 0.400 No 12 (22) 32 (22) 44 (45) 284 (40) Yes 43 (78) 113 (78) 53 (55) 418 (60) Endocrine therapy < 0.001 No 55 (100) 145 (100) 48 (49) 24 (3) Yes − − 49 (51) 678 (97) Note. 1Data were represented as median (IQR) or n (%); 2Wilcoxon rank sum test / Pearson's Chi-squared test / Fisher's exact test; BMI, body mass index; IDC, invasive ductal carcinoma; ILC, invasive lobular carcinoma; ER, estrogen receptor; PgR, progesterone receptor; PR, progesterone; HER2, human epidermal growth factor receptor-2; IHC, -immunohistochemistry; T, T stage; N, N stage. Table 1. Baseline characteristics of patients stratified by hormone receptor
-
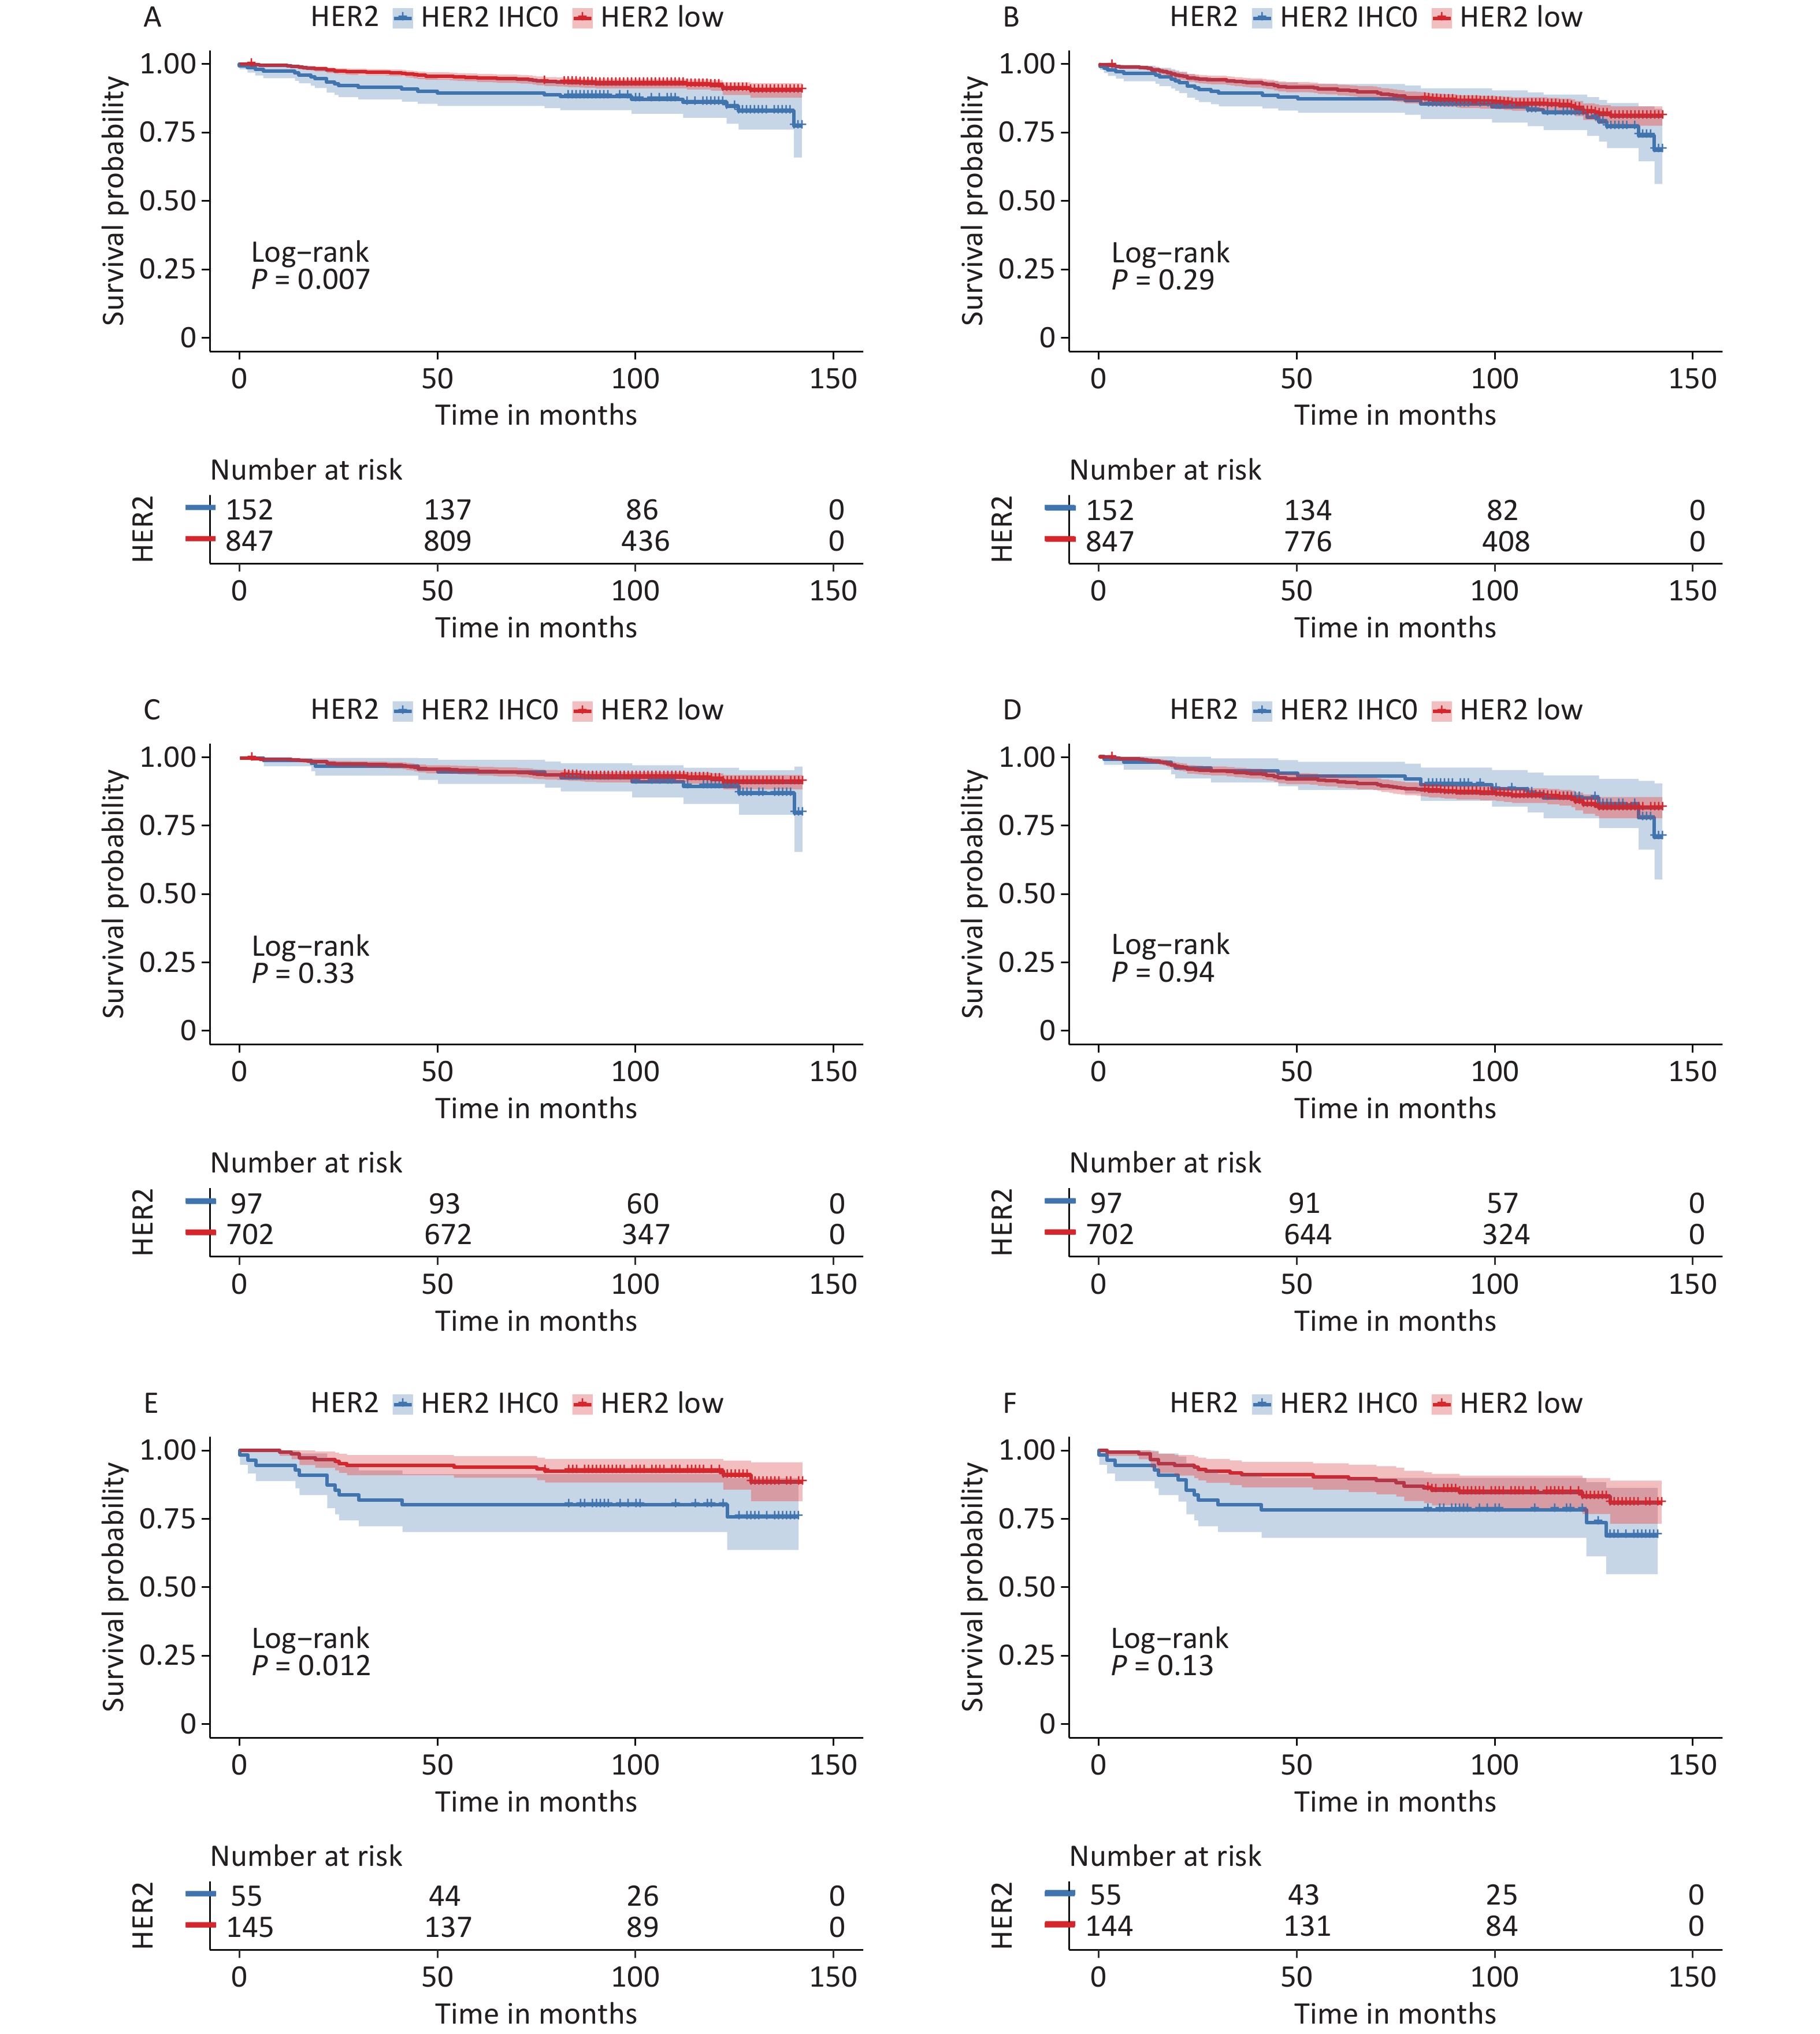
Survival data were analyzed from November 1, 2022, to December 31, 2022. The median follow-up time for all patients was 105 months (95% CI: 102–107 months), and the survival status was known for 937 (93.8%) patients. During this period, 89 patients died and 119 developed DFS events. The median OS and DFS were not reached. The K-M curves are summarized in Figure 3.
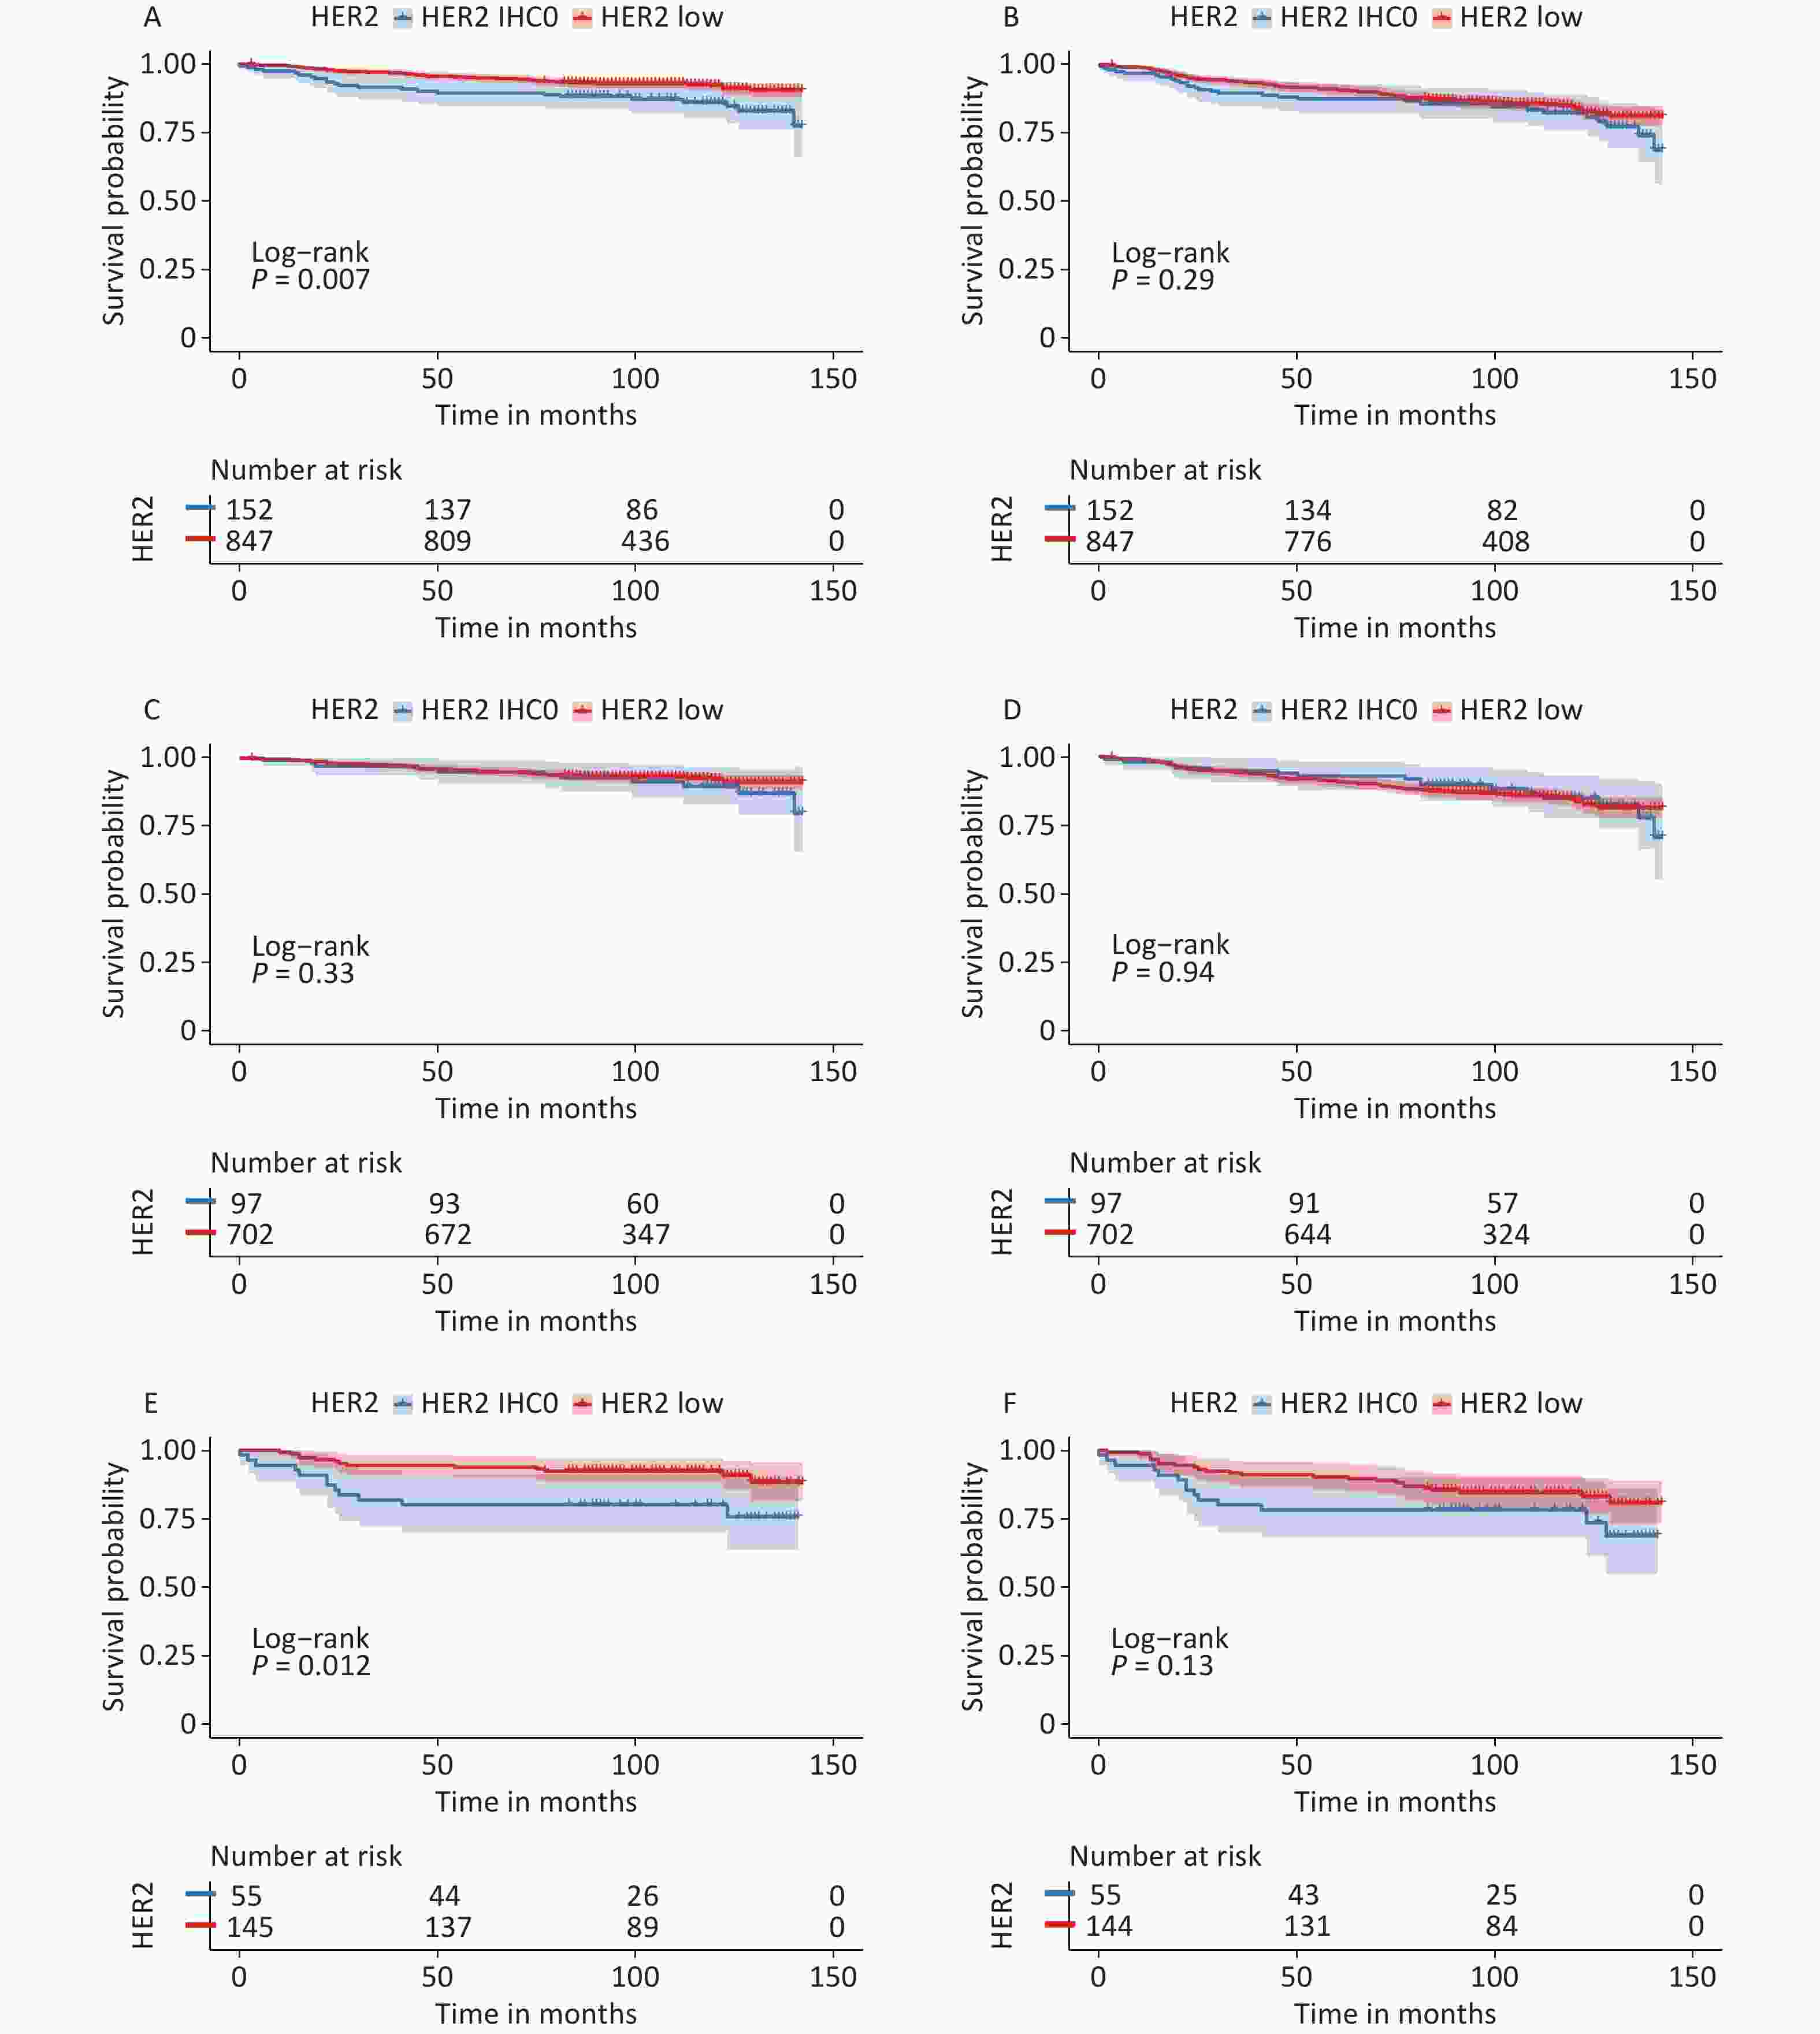
Figure 3. Survival analysis according to HER2 status. OS for HER2 low vs. HER2-IHC0 tumors in (A) the entire cohort; (C) HR-positive group; (E) HR-negative group; DFS for HER2 low vs. HER2-IHC0 tumors in (B) the entire cohort; (D) HR-positive group; (F) HR-negative group. P values were calculated using the stratified log-rank test. OS, overall survival; DFS, disease free survival; HER2, human epidermal growth factor receptor-2; IHC, immunohistochemistry; HR, hormone receptor.
In the context of whole population, K-M analysis suggested that OS of the HER2-low group improved significantly compared to that in the HER2-IHC0 group (HR: 0.525, 95% CI: 0.33–0.85, P = 0.007). However, no independent role of DFS was observed. In the HR-positive group, we observed slightly enhanced OS and DFS in the HER2-low group compared to that in the HER2-IHC 0 group; however, neither OS nor DFS were significantly different. The same trend was observed in the HR-negative group, with a significantly longer OS in the HER2-low group than in the HER2-IHC0 group (HR: 0.37, 95% CI: 0.173–0.83, P = 0.012); however, no significant survival difference was observed in DFS. Univariate analysis revealed that HER2-low was associated with increased OS (HR: 0.52; 95% CI: 0.33–0.85, P = 0.008). The same trend was observed in the 40–50 years age group along with ER and PR positive groups. However, higher T stage, N stage, clinical stage, Ki-67 ≥ 14%, and radiotherapy were associated with decreased OS. Multivariate analysis showed that HER2-low was an independent prognostic factor for improved OS (HR: 0.54, 95% CI: 0.33–0.89, P = 0.015). Hazard ratios for the COX models of OS are presented in Table 2.
Characterisics Univariate Multivariate HR 95% CI P value HR 95% CI P value Age (years) < 40 − − − − − − 40−59 0.59 0.32−1.09 0.095 0.63 0.33−1.20 0.158 > 59 1.49 0.80−2.77 0.204 1.35 0.57−3.19 0.488 BMI (kg/m2) ≤ 25 − − − > 25 1.05 0.69−1.59 0.834 Menopausal postmenopausal − − − − − − premenopausal 0.62 0.41−0.94 0.026 0.82 0.45−1.52 0.535 Histology IDC − − − ILC 0.69 0.17−2.80 0.603 Others 0.88 0.36−2.17 0.784 Grade 1 − − − − − − 2 0.48 0.24−0.99 0.046 0.36 0.17−0.76 0.008 3 0.78 0.37−1.63 0.511 0.38 0.17−0.85 0.019 T 1 − − − − − − 2 2.47 1.58−3.87 < 0.001 1.28 0.70−2.34 0.427 3 1.84 0.56−6.04 0.315 0.53 0.13−2.15 0.374 N 0 − − − − − − 1 2.1 1.28−3.43 0.003 1.12 0.61−2.05 0.708 2 2.24 1.19−4.24 0.013 0.93 0.23−3.77 0.915 3 3.68 1.91−7.09 < 0.001 1.44 0.31−6.75 0.645 Stage Ⅰ − − − − − − Ⅱ 3.19 1.76−5.77 < 0.001 2.34 0.97−5.67 0.06 Ⅲ 5.09 2.65−9.80 < 0.001 3.5 0.70−17.57 0.129 ER Negative − − − − − − Positive 0.65 0.41−1.02 0.06 1.25 0.60−2.61 0.558 PR Negative − − − − − − Positive 0.55 0.36−0.85 0.006 0.56 0.28−1.11 0.098 HER2 0 − − − − − − Low 0.52 0.33−0.85 0.008 0.54 0.33−0.89 0.015 Ki-67 proportion (%) < 14 − − − − − − ≥ 14 3.28 1.51−7.09 0.003 3.01 1.36−6.69 0.007 TOP2A proportion (%) < 30 − − − 30−60 0.75 0.34−1.62 0.458 > 60 1.41 0.57−3.48 0.462 Chemotherapy No − − − Yes 1.19 0.77−1.85 0.43 Radiotherapy No − − − − − − Yes 1.69 1.07−2.69 0.026 1.34 0.81−2.22 0.258 Endocrine therapy No − − − Yes 0.73 0.47−1.13 0.153 Note. BMI, body mass index; IDC, invasive ductal carcinoma; ILC, invasive lobular carcinoma; ER, estrogen receptor; PR, progesterone receptor; HR, hazard ratio; HER2, human epidermal growth factor receptor-2; IHC,-immunohistochemistry; OS, overall survival; T, T stage; N, N stage. Table 2. Univariate and multivariate COX analyses of OS between HER2 low and HER2−IHC0 groups
We also observed independent prognostic roles of nuclear grade, Ki-67 level, and clinical stage. However, we did not observe an independent prognostic role of HER2-low in the univariate or multivariate COX analyses for DFS. The hazard ratios for the COX in DFS models are presented in Supplementary Table S2 (available in www.besjournal.com).
Characteristics Univariate Multivariate HR 95% CI P value HR 95% CI P value Age, years < 40 − − − − − − 40−59 0.42 0.28−0.62 < 0.001 0.47 0.32−0.70 < 0.001 > 59 0.69 0.44−1.06 0.088 0.81 0.52−1.25 0.334 BMI, kg/m2 ≤ 25 − − − > 25 0.91 0.66−1.25 0.555 Menopausal postmenopausal − − − premenopausal 0.90 0.66−1.23 0.502 histology IDC − − − ILC 0.76 0.28−2.06 0.594 Others 0.90 0.46−1.77 0.769 Grade 1 − − − 2 0.86 0.45−1.65 0.653 3 1.35 0.69−2.64 0.383 T 1 − − − − − − 2 1.86 1.35−2.57 < 0.001 1.35 0.85−2.15 0.201 3 1.41 0.57−3.52 0.457 0.70 02.6−1.91 0.488 N 0 − − − − − − 1 1.7 1.17−2.47 0.005 1.13 0.70−1.80 0.62 2 2.06 1.29−3.31 0.003 0.87 0.31−2.46 0.791 3 3.44 2.11−5.61 < 0.001 1.23 0.39−3.84 0.726 Stage Ⅰ − − − − − − Ⅱ 1.91 1.30−2.83 0.001 1.25 0.66−2.36 0.502 Ⅲ 3.42 2.20−5.31 < 0.001 2.1 0.64−6.94 0.222 ER Negative − − − Positive 0.79 0.56−1.13 0.202 PR Negative − − − Positive 0.76 0.54−1.06 0.105 HER2 0 − − − Low 0.81 0.54−1.20 0.295 Ki67, % < 14 − − − ≥ 14 2.33 1.41−3.85 < 0.001 2.07 1.24−3.43 0.005 TOP2A, % < 30 − − − 30%−60 1.09 0.67−1.78 0.732 > 60 1.11 0.52−2.37 0.796 Chemotherapy No − − − Yes 1.35 0.97−1.89 0.078 Radiotherapy No − − − Yes 2.3 1.66−3.21 < 0.001 1.81 1.27−2.60 0.001 Endocrine therapy No − − − Yes 0.86 0.62−1.21 0.383 Note. T, T stage; N, N stage. Table S2. Univariate and multivariate Cox analyses of DFS between the HER2 low and HER−IHC0 groups
-
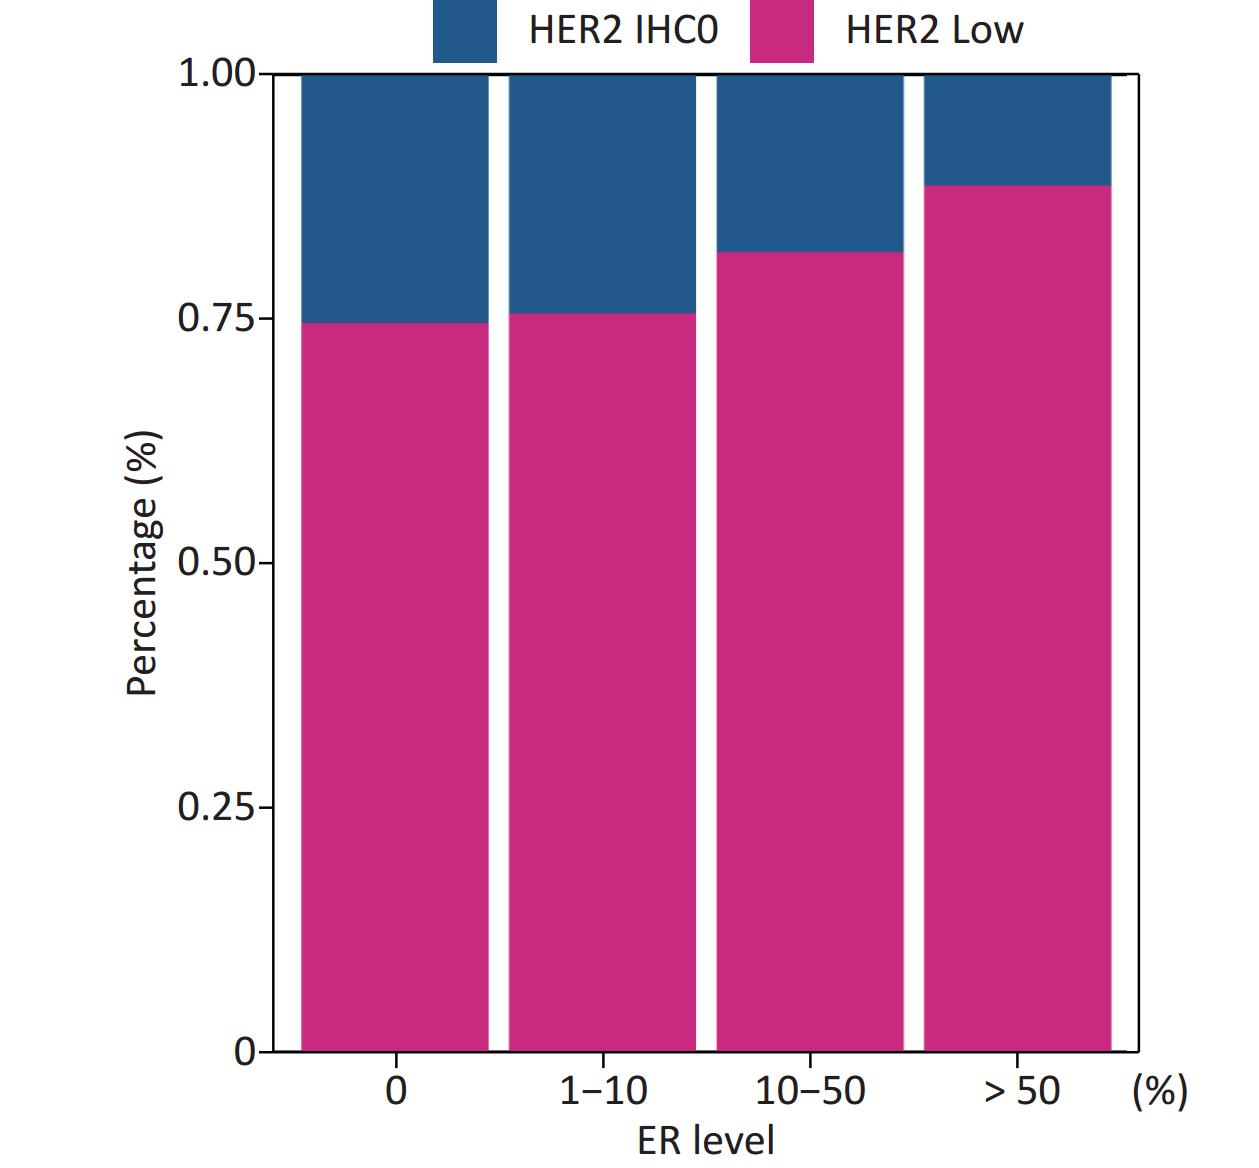
Patients in our cohort were divided into four groups according to their ER status: 0%, 1%–10%, 10%–50%, and > 50%; and the rates of HER2-low in these four groups were 74.54%, 75.51%, 81.76%, and 88.57%, respectively. The correlation between HER2-low and ER status is shown in Figure 4.

Figure 4. Positive correlation between ER levels and percentage of HER2 low (Mantel-Haenszel χ2 test, P < 0.001, Pearson’s R = 0.159, P < 0.001). ER, estrogen receptor; HER2, human epidermal growth factor receptor-2; IHC, immunohistochemistry.
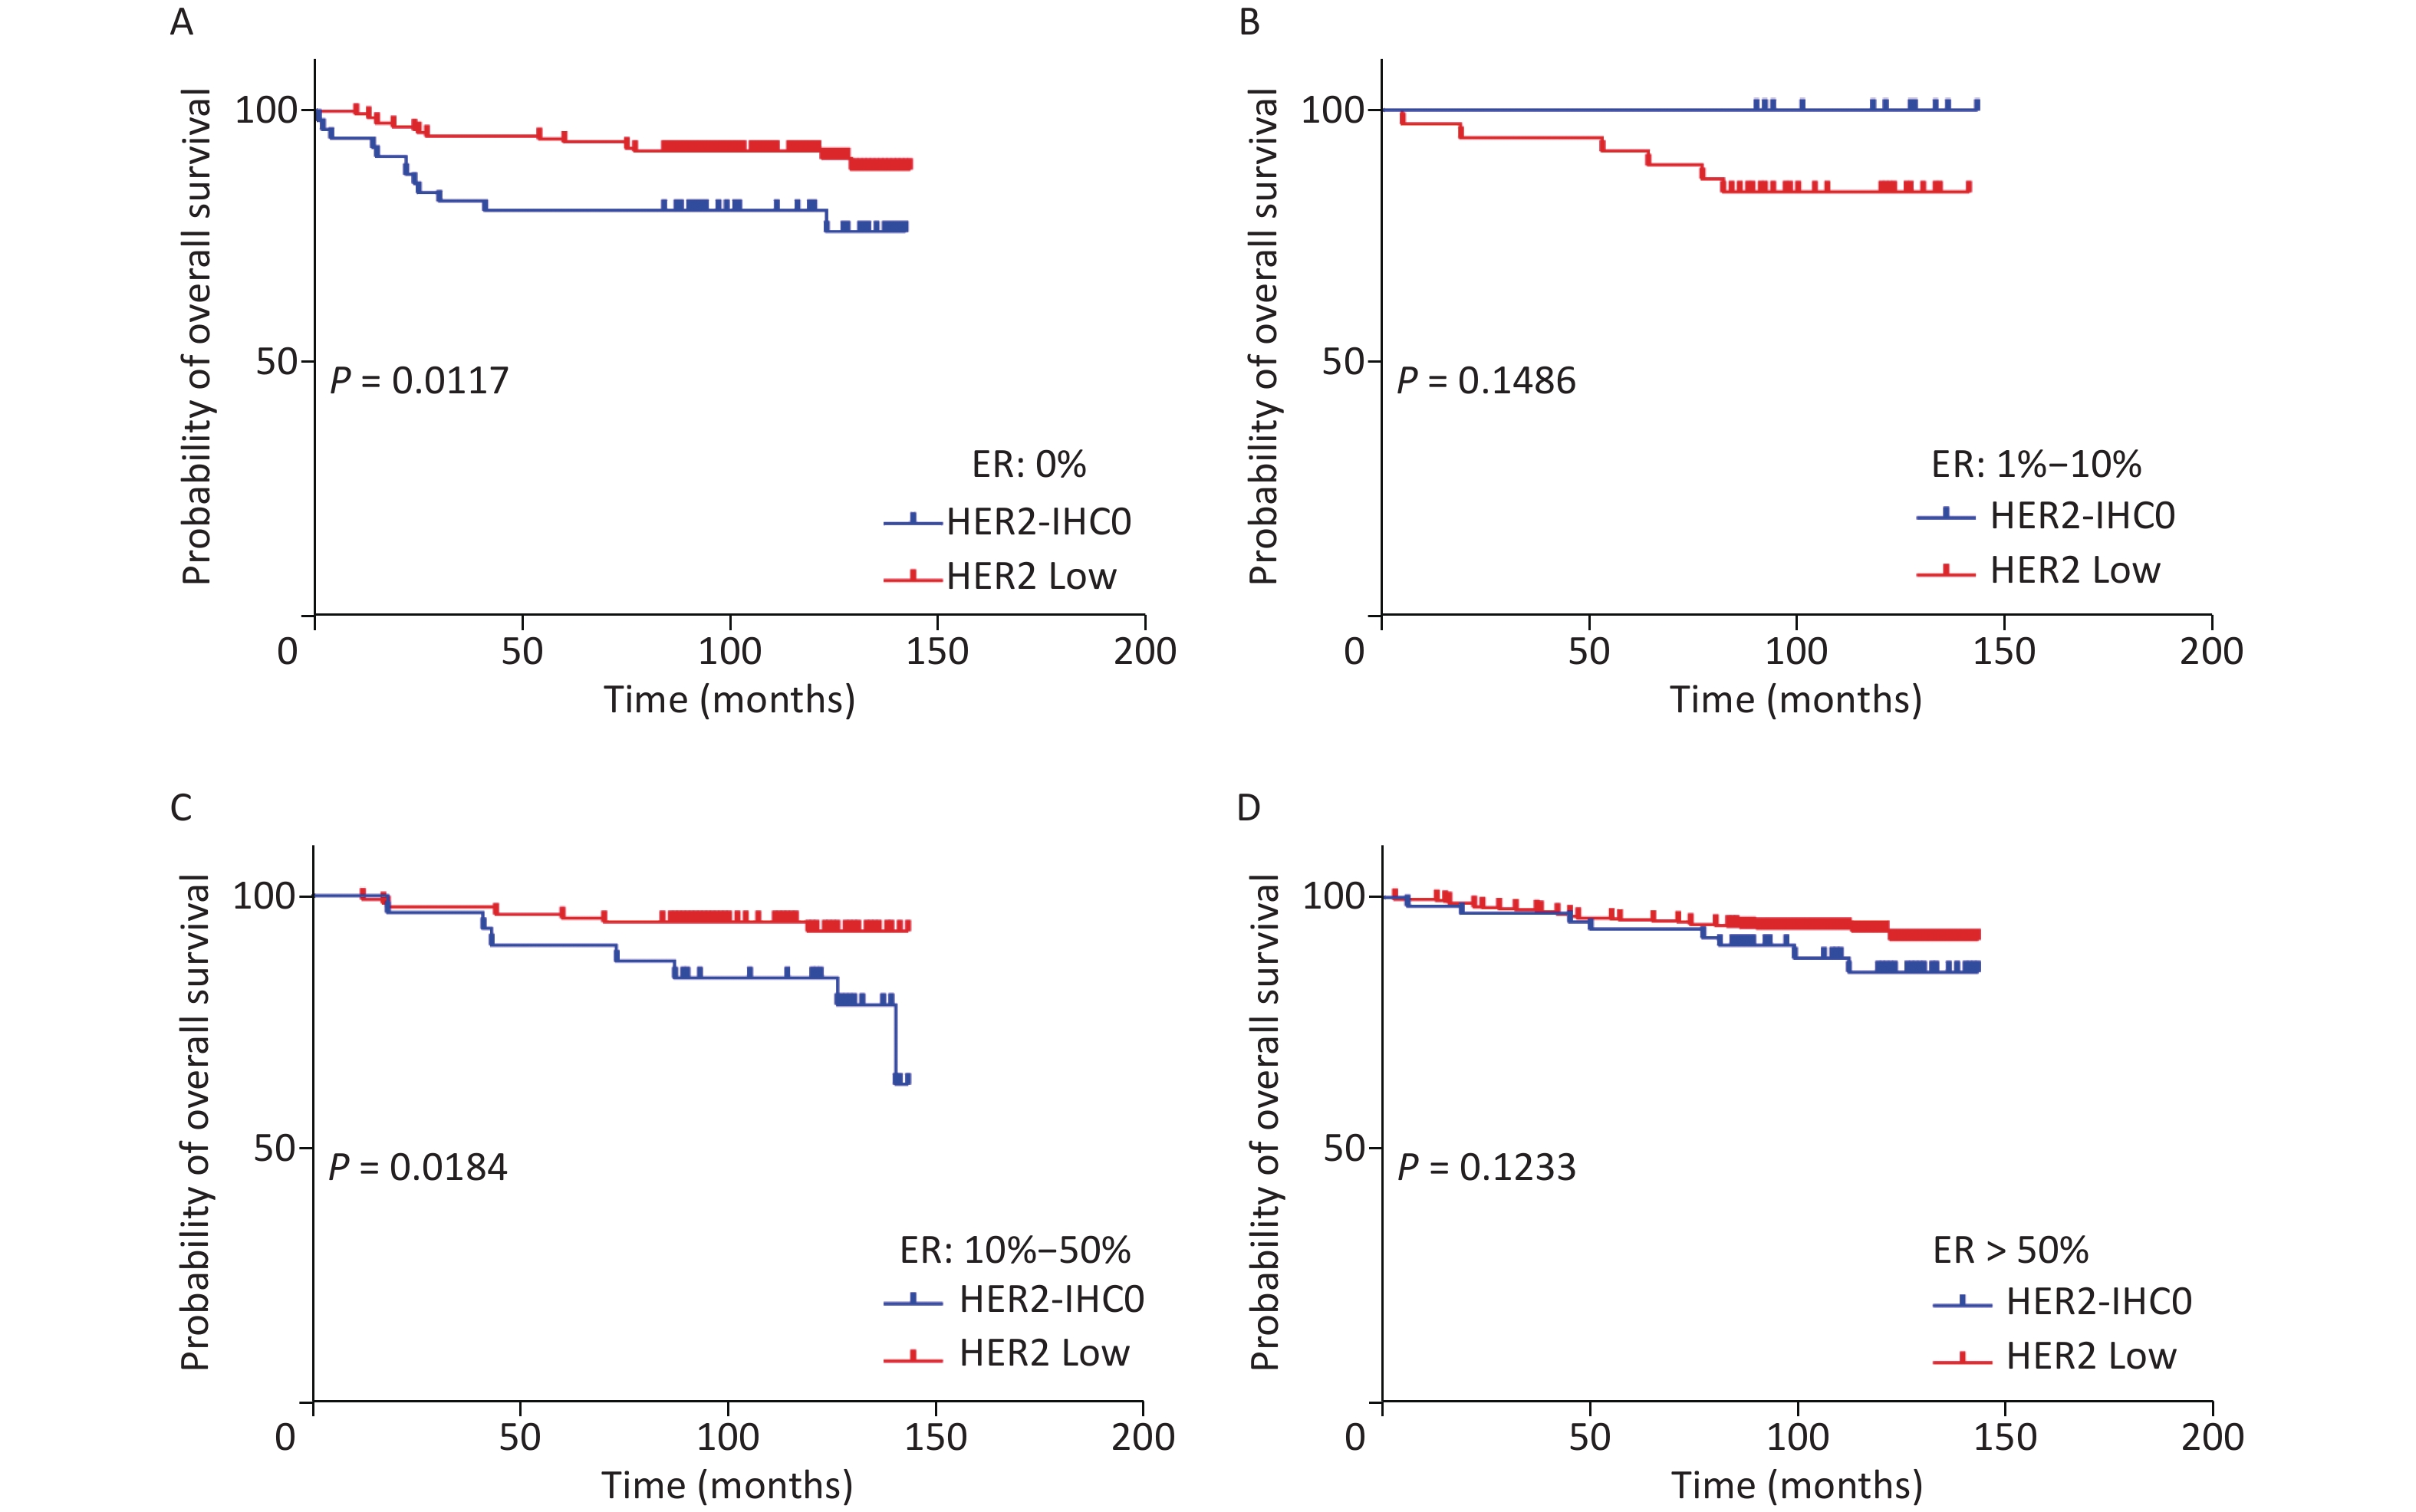
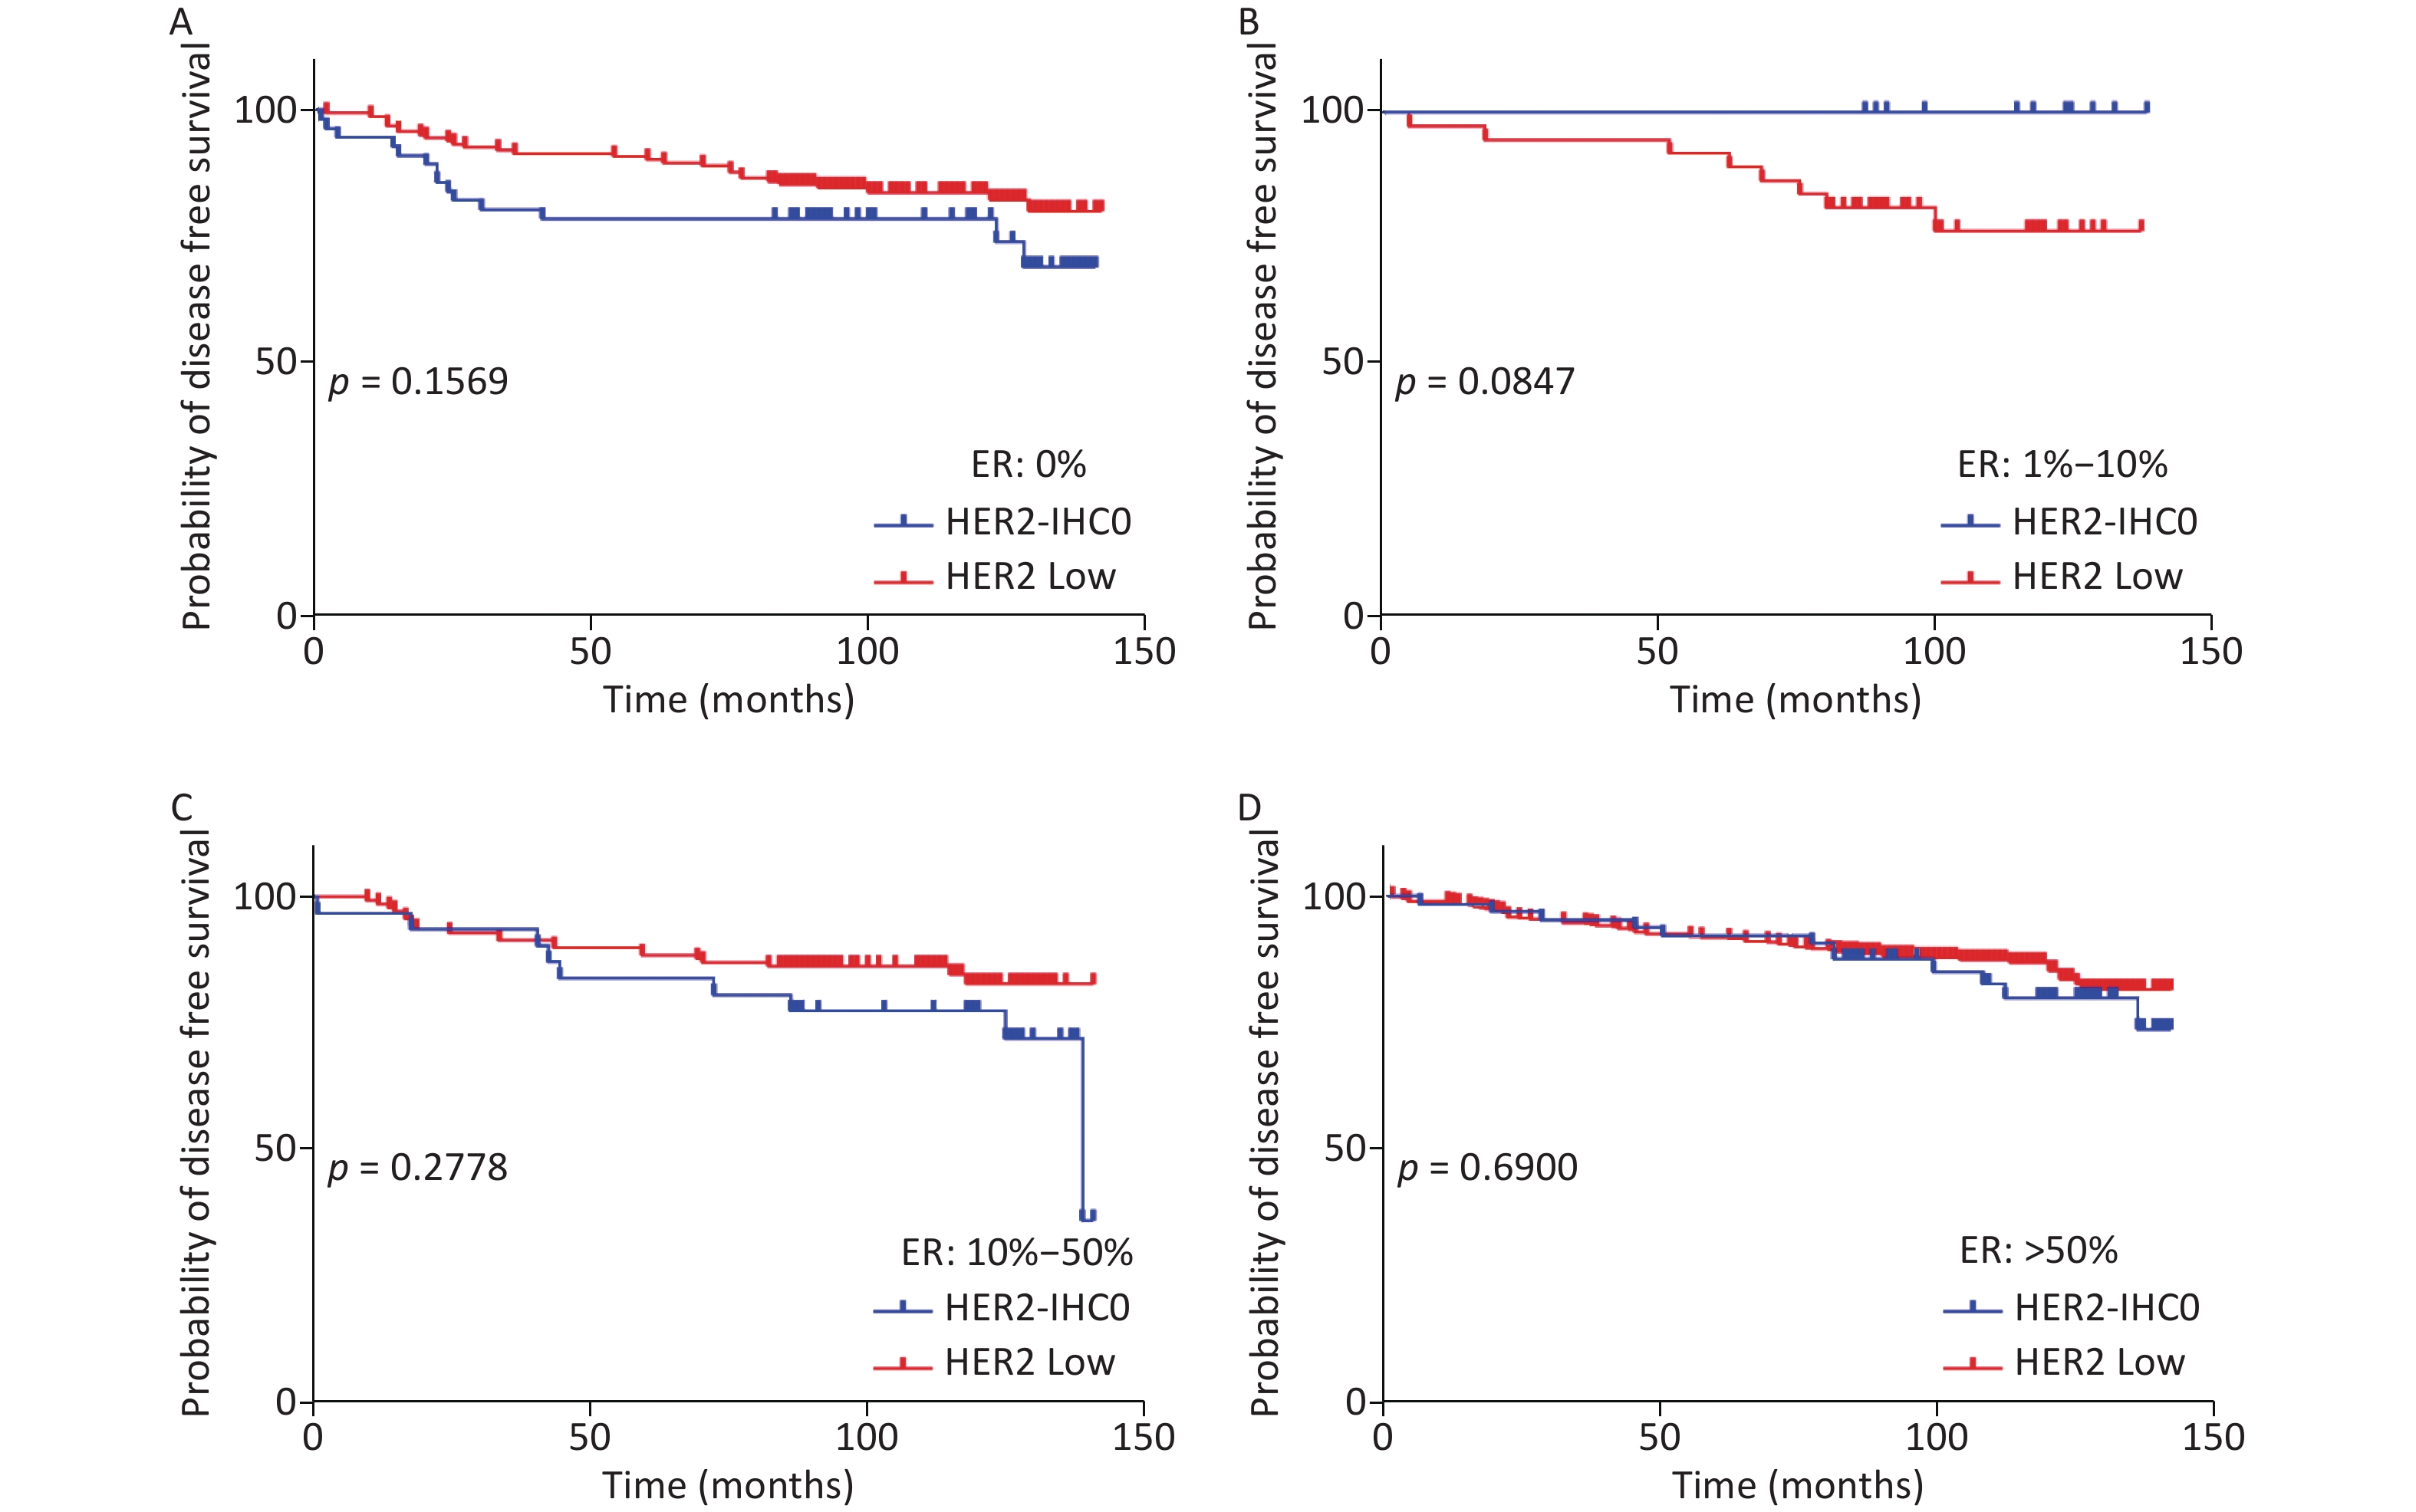
The distribution of HER2-low increased with increasing ER levels in each group (Mantel-Haenszel χ2 test, P < 0.001; Pearson’s R = 0.159, P < 0.001). It can be concluded that HER2-low was enriched in the ER high-expression groups, whereas HER2-IHC0 was concentrated in the ER-negative and ER-low groups. We further explored the survival differences between the HER2-IHC0 and HER2-low groups, and the results were presented using K-M curves (Supplementary Figure S1 and Supplementary Figure S2, available in www.besjournal.com). The HER2-low group showed a longer OS than the ER 0 and ER 10%–50% groups (ER: 0% group: HR = 0.319, 95% CI: 0.132–0.776, P = 0.0117; ER: 10%–50% group: HR = 0.2183, 95% CI: 0.06159–0.7737, P = 0.0291), whereas in the ER 1%–10% group, the HER2-low group showed the opposite trend; however, no significant difference was observed. No significant differences were observed between the groups in terms of DFS.
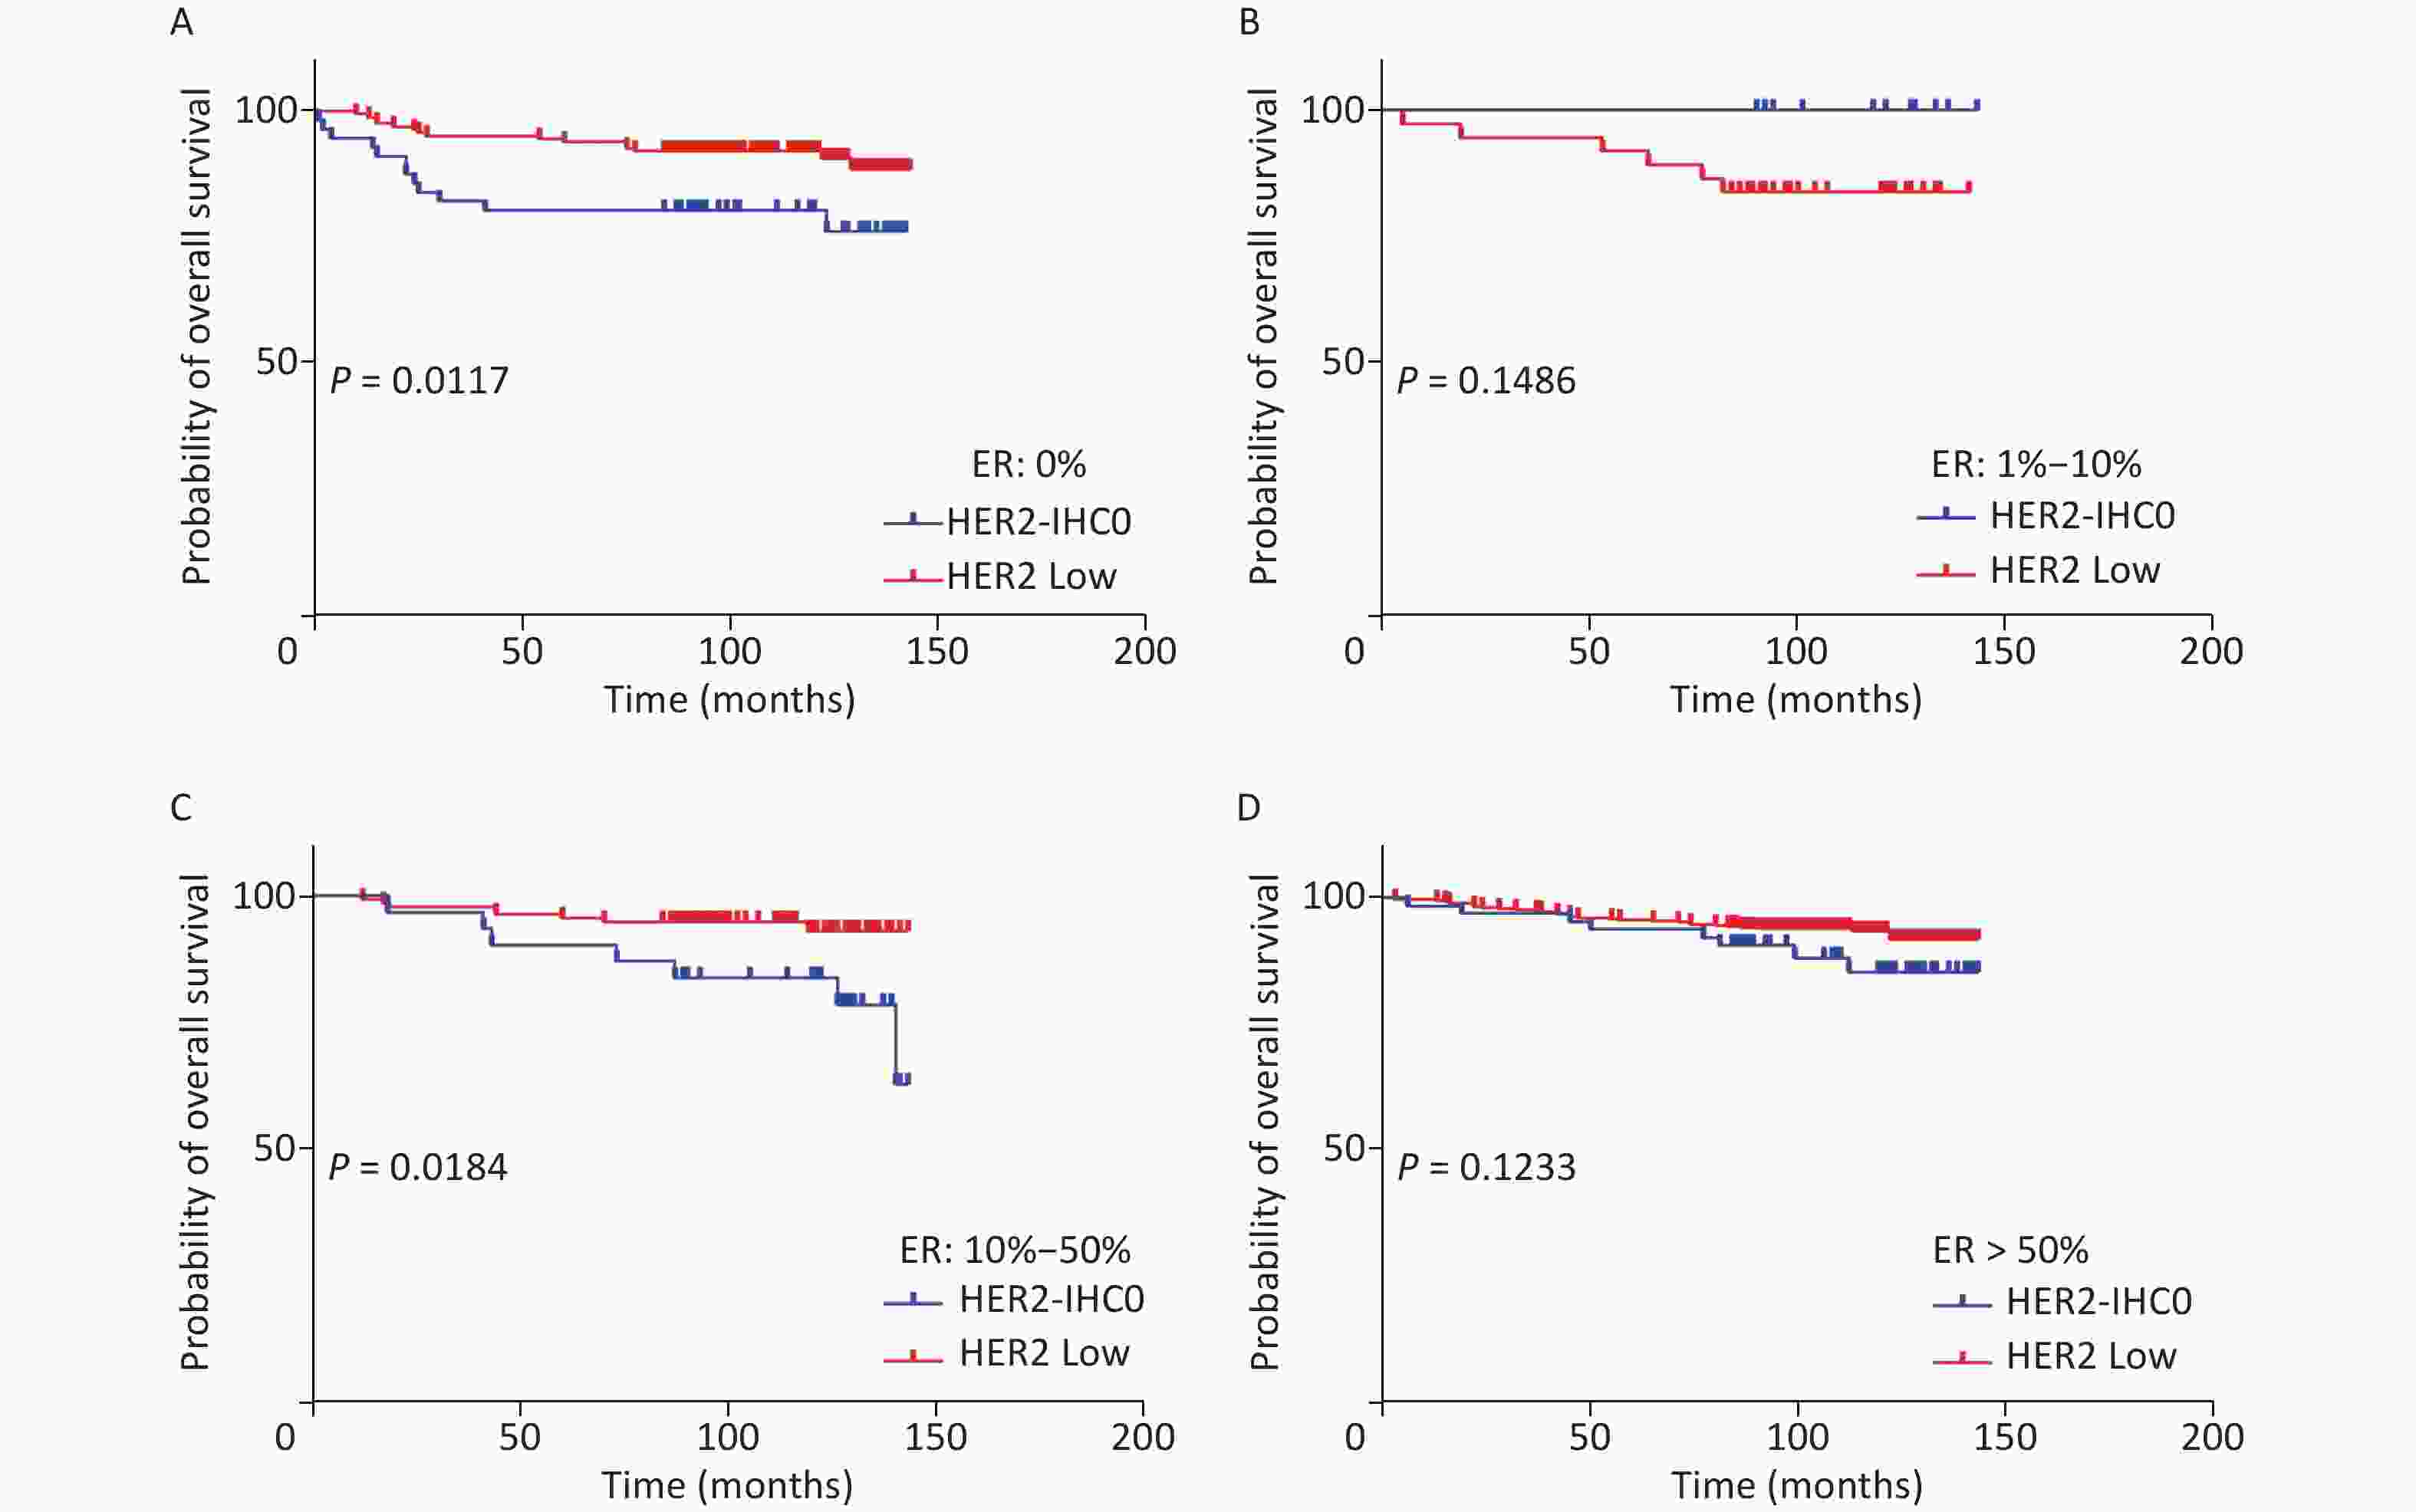
Figure S1. OS of HER2 low and HER2-IHC0 in different ER levels. (A) ER: 0%; B. ER: 1%–10%; (C) ER: 10%–50%; (D) ER > 50%. HER2 low group showed a longer OS in ER 0 and ER 10%–50% groups [ER: 0% group: HR = 0.319 (95% CI: 0.132–0.776), P = 0.0117; ER: 10%–50% group: HR = 0.2183 (95% CI: 0.06159–0.7737), P = 0.0291]. P-values were calculated using the stratified log-rank test.
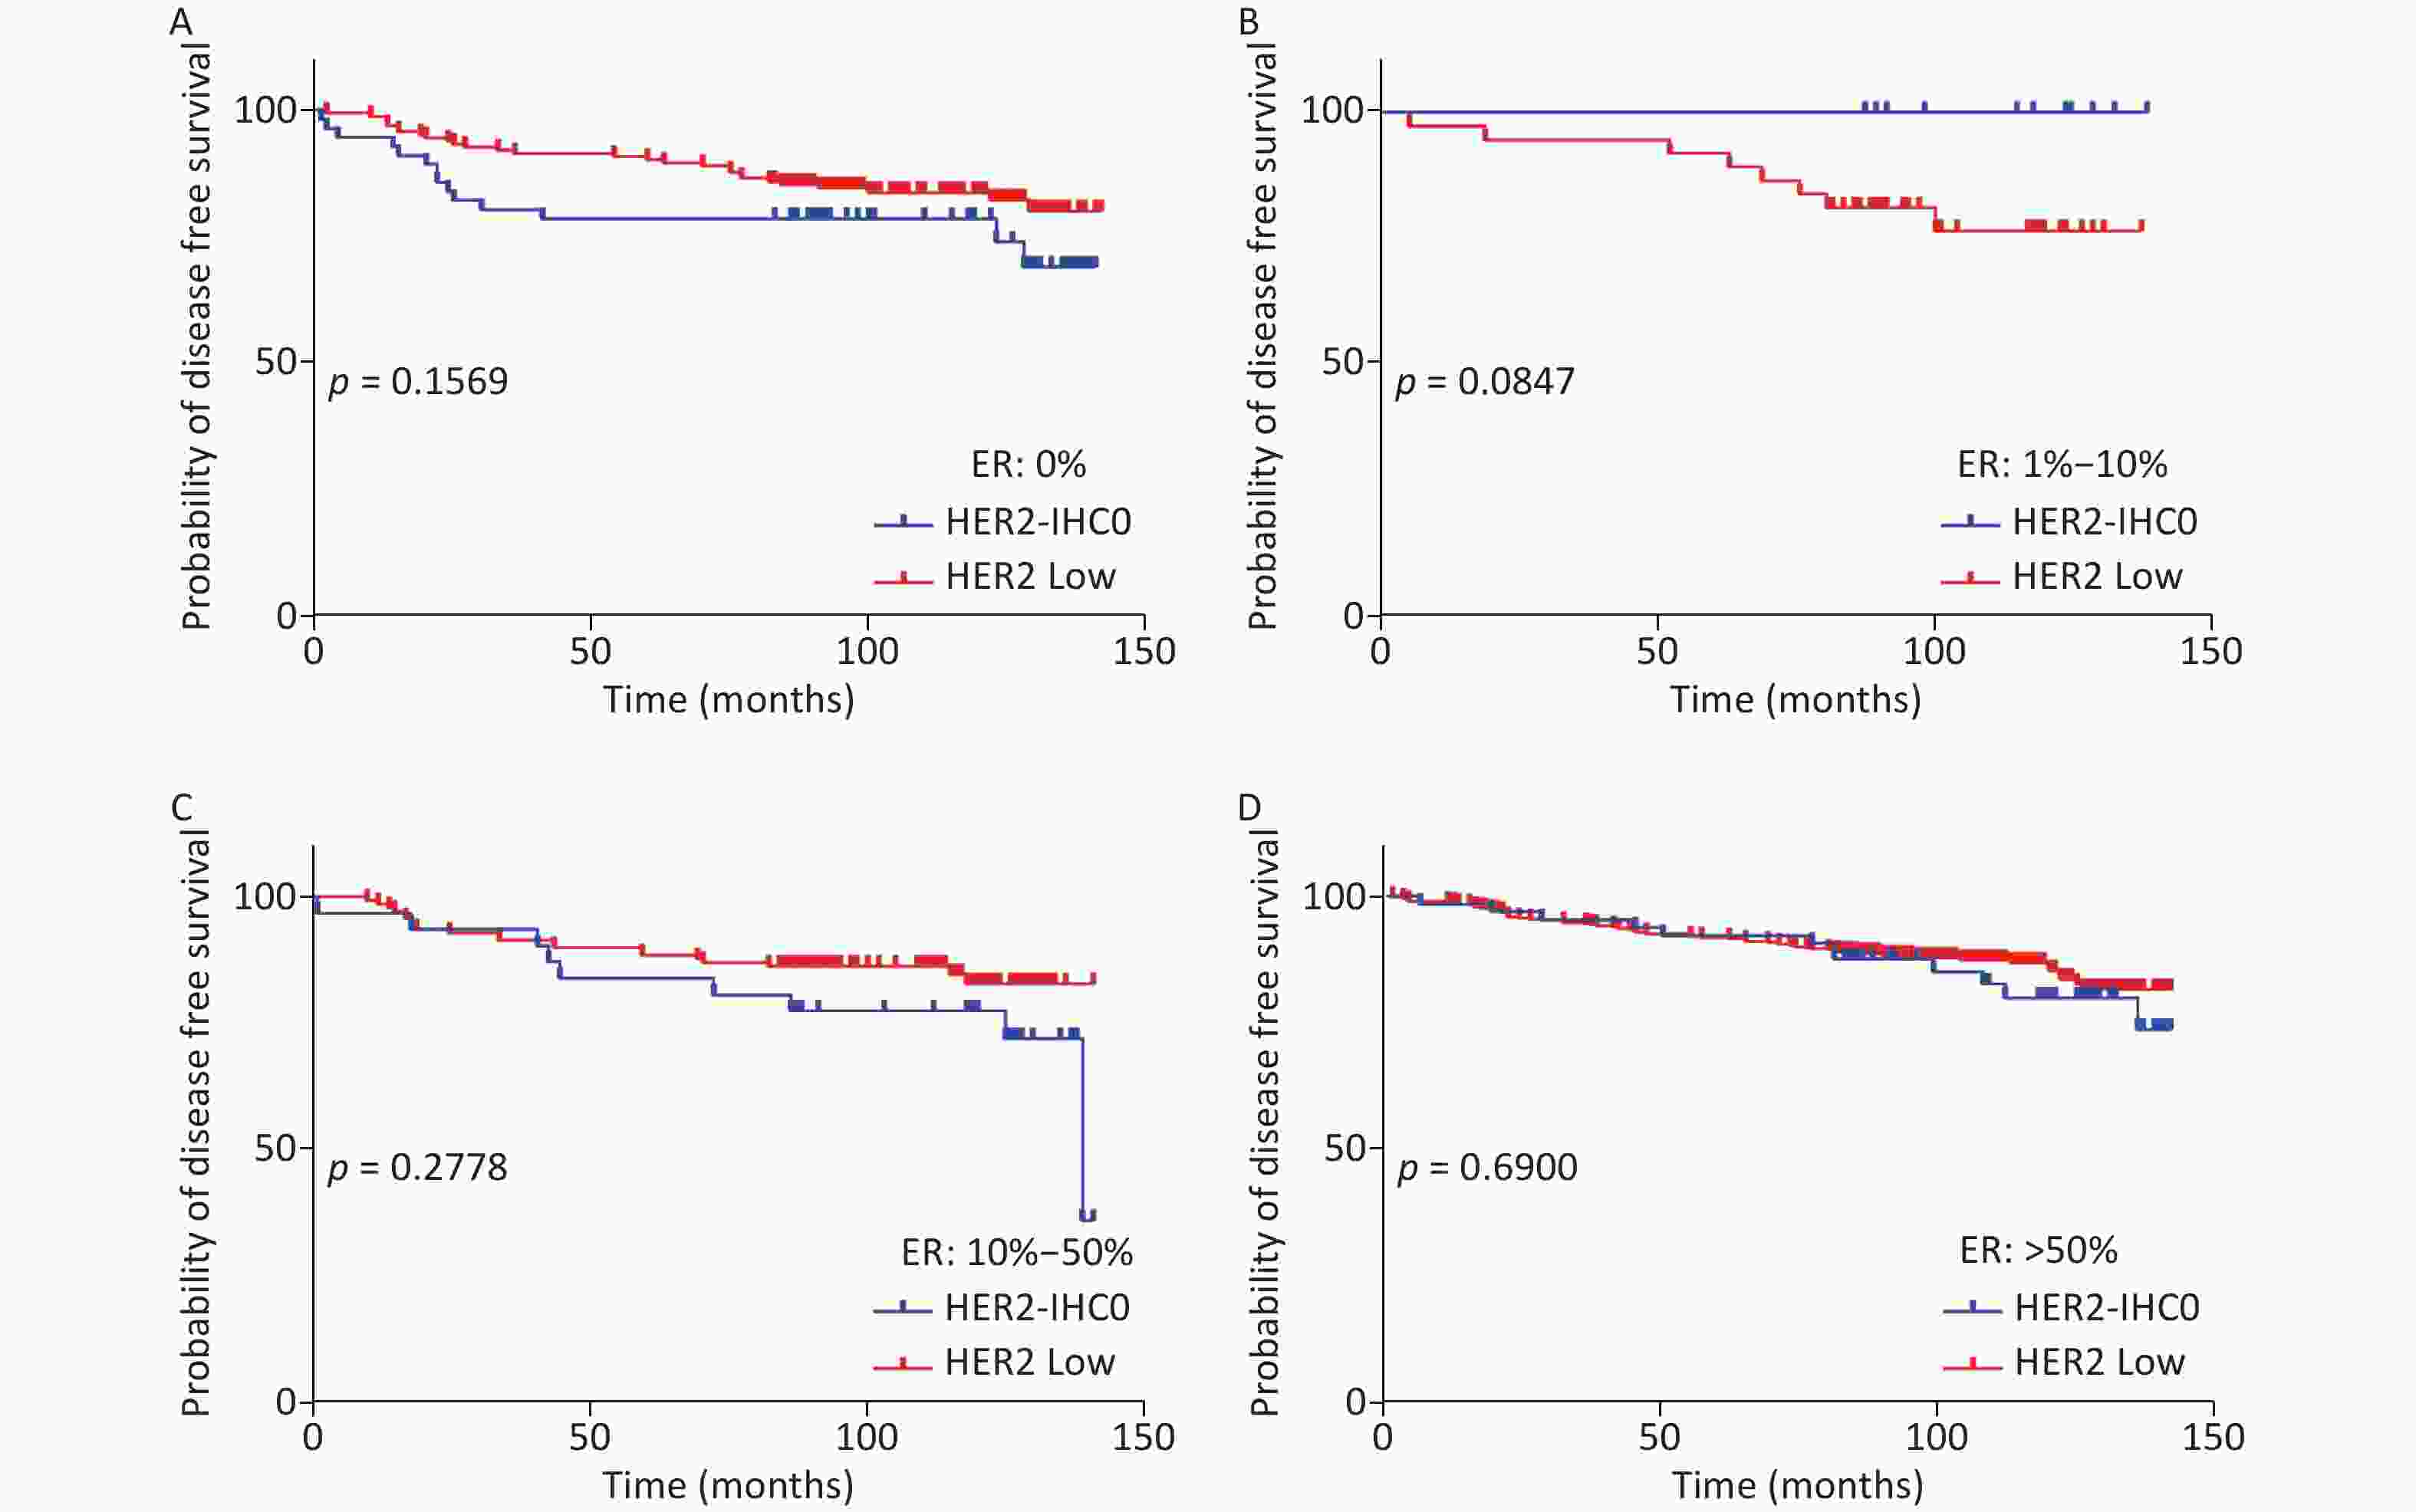
Figure S2. DFS for HER2 low and HER2-IHC0 in different ER levels. (A) ER: 0%; (B) ER: 1%–10%; (C) ER: 10%–50%; (D) ER > 50%. HER2 low group showed a longer OS than the ER 0 and ER 10%–50% groups. No significant differences were found between the HER2-IHC0 and HER2 low groups. P-values were calculated using the stratified log-rank test.
-
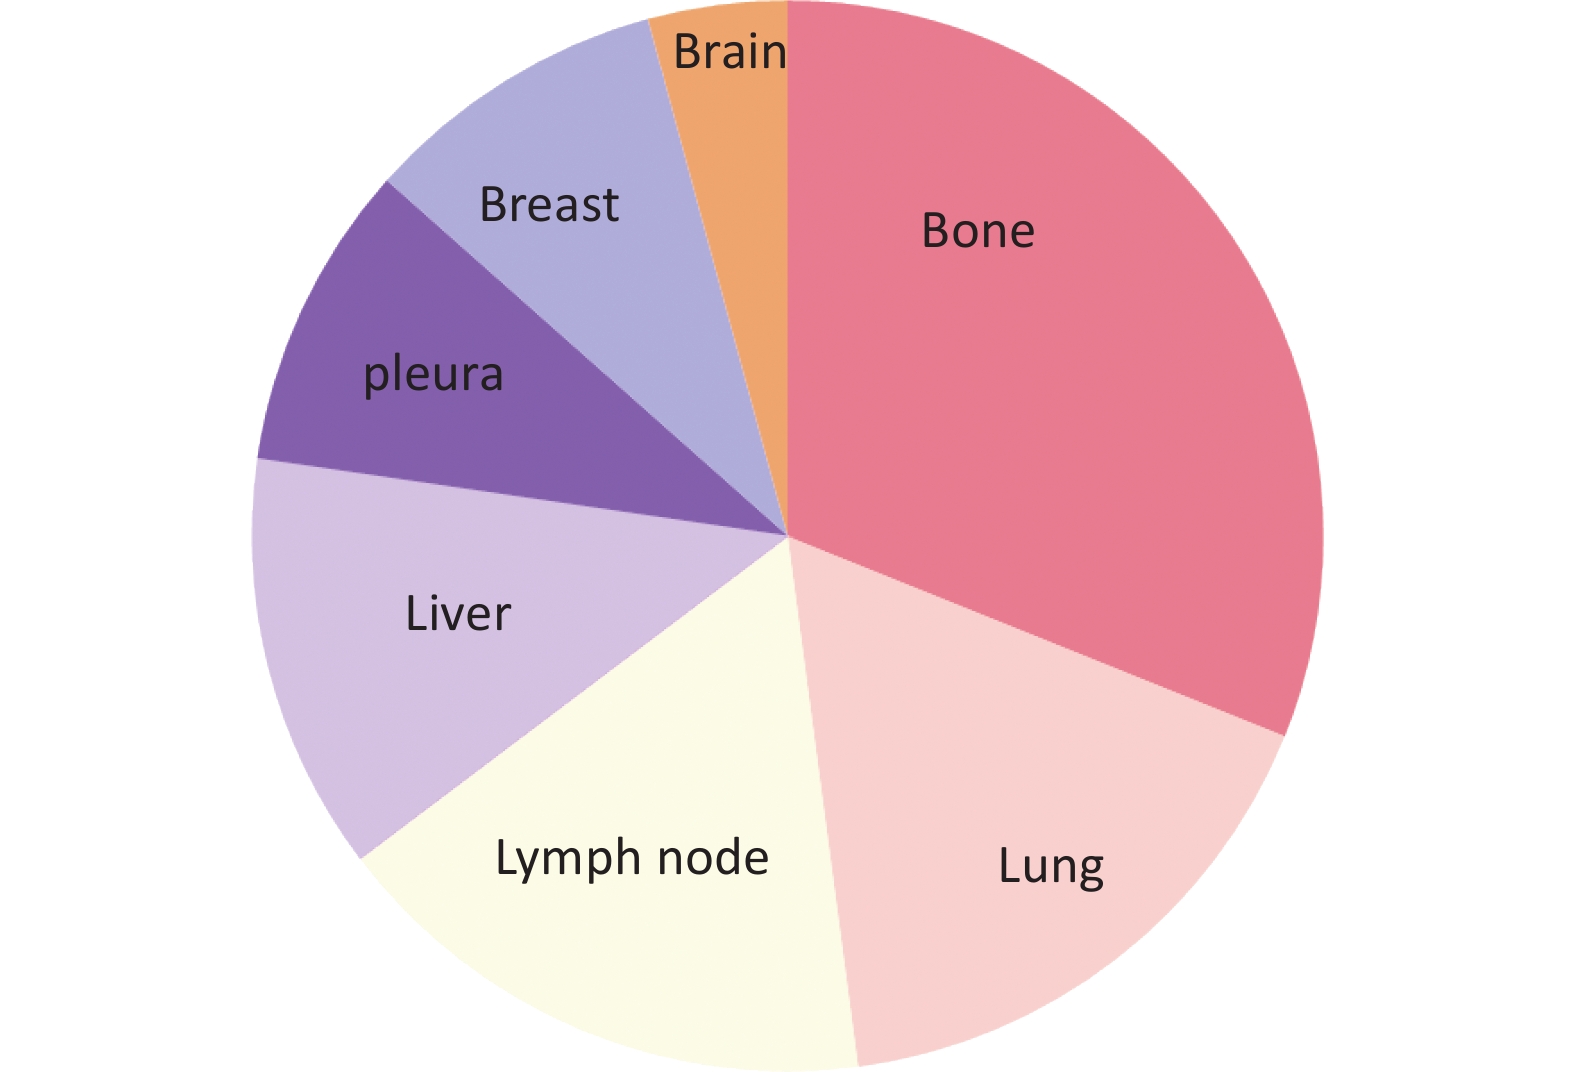
During the follow-up period, 119 (11.9%) patients developed relapse or metastatic disease, of whom 57 (47.89%) had matched biopsy samples. The most advanced settings were: bone (37/119, 31.1%), lungs (20/119, 16.80%), lymph nodes (17/119, 14.3%), liver (15/119, 12.6%), pleura (11/119, 9.24%), breast (7/119, 5.89% local recurrence and 4/119, 3.37% de novo metastasis), brain (5/119, 4.20%), and mediastinum (3/119, 2.52%). The differences in the distributions are shown in Figure 5.

Figure 5. Distribution of first-advanced settings including bone (37/119, 31.1%), lungs (20/119, 16.80%), lymph nodes (17/119, 14.28%), liver (15/119, 12.6%), pleura (11/119, 9.24%), breast (including 7/119, 5.89% local recurrence and 4/119, 3.37% de novo metastasis), brain (5/119, 4.20%), and mediastinum (3/119, 2.52%).
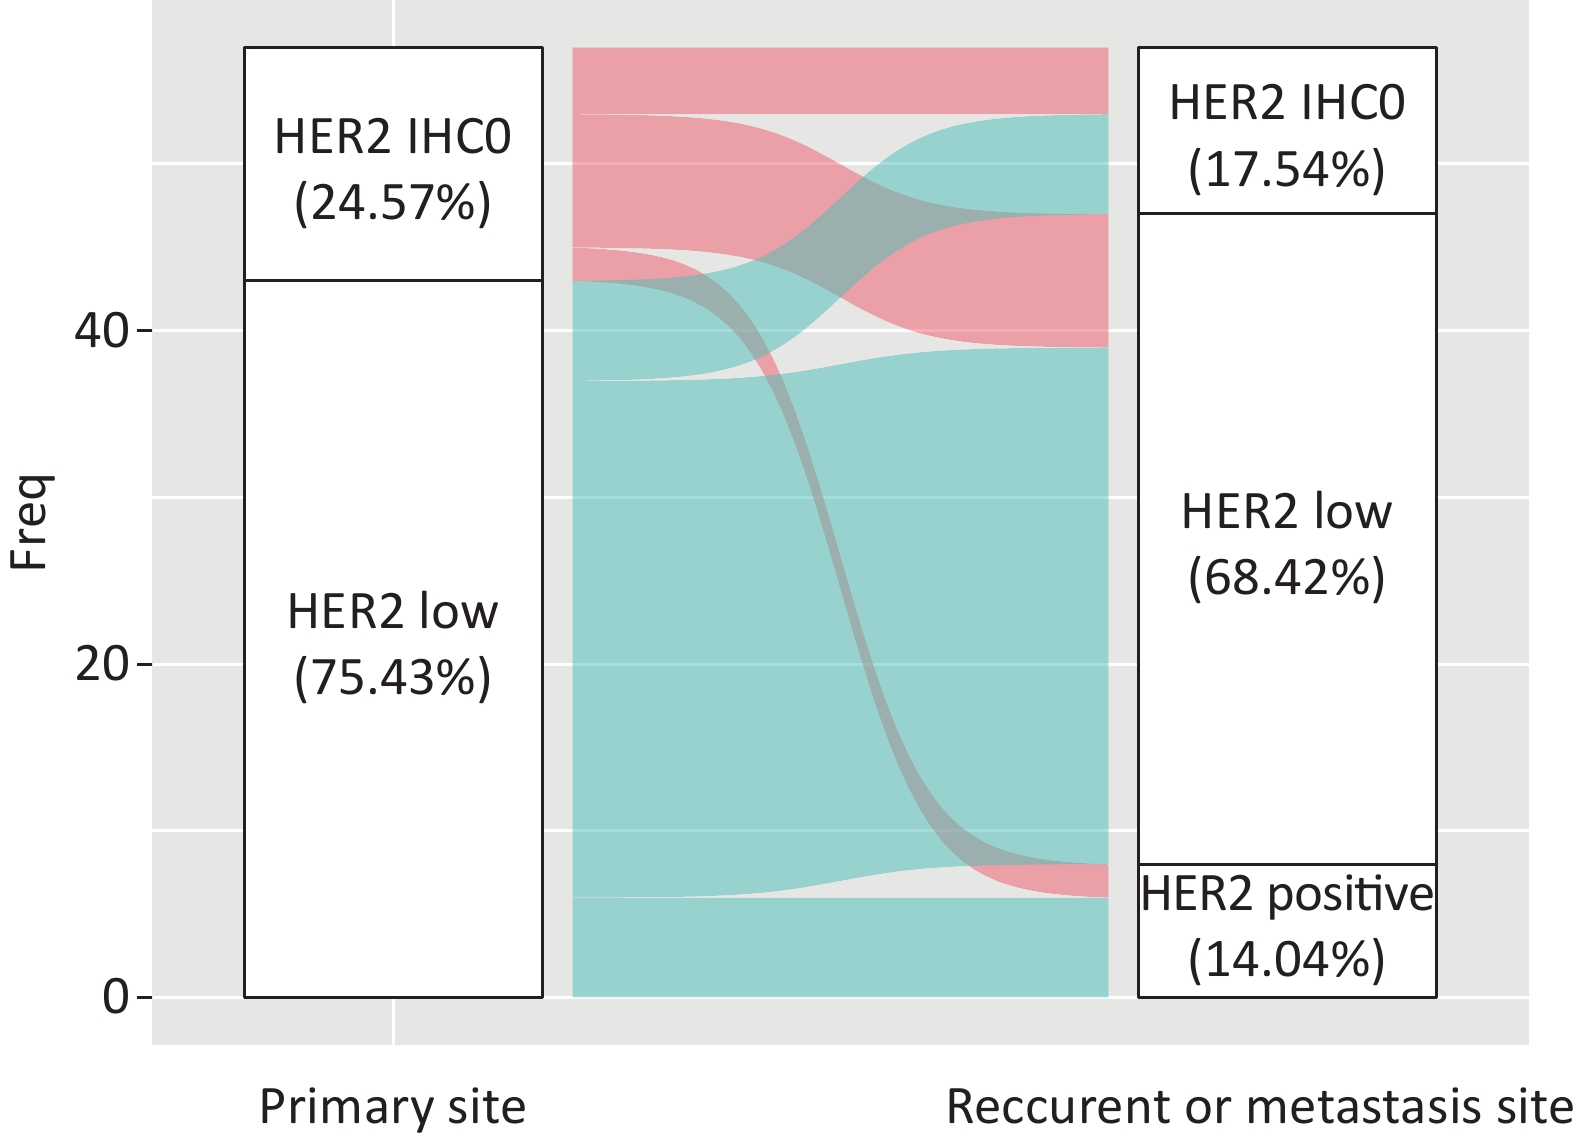
A total of 42.85% of the cases were visceral biopsies, while 57.15% were non-visceral. There was a significant difference between HER2-IHC0 and HER2-low cases, with a higher rate of visceral metastatic disease in HER2-low cases (38.1% vs. 13.6%, P = 0.028). Among the patients who underwent matched biopsy, 75.43% (43/57) of the primary tumors and 68.42% (39/57) of the relapsed and metastatic lesions were HER2-low BC. The discordance rate of HER2 IHC score was 38.59% (22/57) (K = 0.194, 95% CI: 0.168–0.219), including 45.45% HER2-IHC0 cases and 54.54% HER2-low cases. In the HER2-IHC0 group, 57.14% (8/14) of the cases showed a switch from HER2-IHC0 to HER2-low. On the other hand, in the HER2-low group, 13.95% (6/43) of patients showed an increasing trend. Figure 6 summarizes the dynamic evolution of HER2 IHC scores from primary sites to the matched relapsed and metastatic sites.
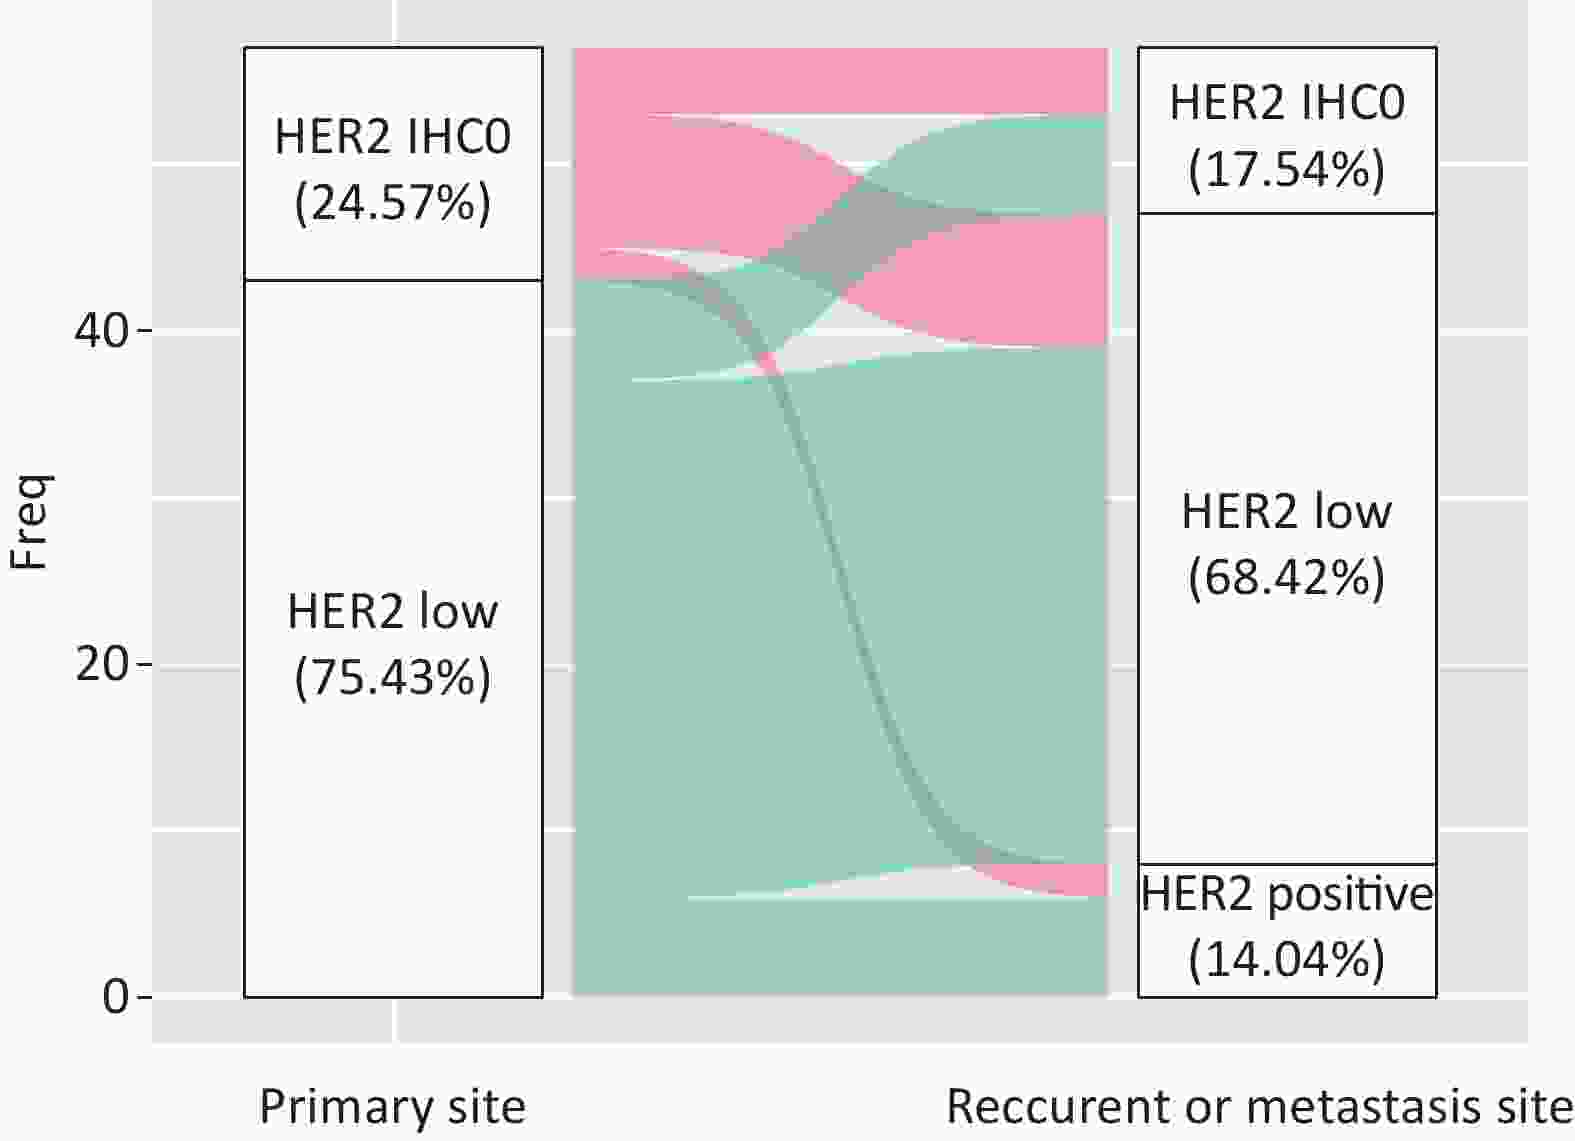
Figure 6. Dynamic change in HER2 IHC between primary and relapsed sites (K = 0.194, 95% CI: 0.168–0.219). HER2, human epidermal growth factor receptor-2; IHC, immunohistochemistry.
-
In traditional clinical practice, HER2-low BC is regarded as HER2-negative BC without any effective anti-HER2 targeted therapies. The results of the Destiny-Breast 04 trial illustrated that these patients could benefit from T-DXd, with considerably longer PFS and OS[11]. Subsequently, an increasing number of clinical trials focusing on the strategy of T-DXd use in HER2-low BC are being conducted[25]. Here, we conducted a long-term follow-up retrospective analysis of a large cohort of patients with early stage BC in the Chinese population (N = 999) to scrutinize the clinicopathological characteristics, prognostic differences, potential molecular mechanisms, and HER2 IHC evolution. We further provide evidence of crosstalk between HER2 and ER signaling pathways. Our data and findings add to the understanding of HER2-low in Chinese population, which may further guide personalized treatment of HER2 negative early BC.
To the best of our knowledge, this cohort study is one of the largest retrospective studies on HER2-low early stage BC in the Chinese population till date. In this single-institution study, 84.78% of the patients with HER2-negative diagnoses were defined as HER2-low. The proportions of HER2-low in HR-positive and HR-negative cases were 87.86% and 72.5%, respectively. The proportion of HER2-low in our cohort was slightly higher than the reported rate of 45%–65% by other studies[13]. Previous studies in the Chinese population reported rates ranging from 43.1%–75.9%[16,26]. However, recently, a team at the Department of Breast Surgery, Fudan University Shanghai Cancer Center, reported a higher proportion of HER2-low early BC cases[27]. According to their source data, 82.67% patients with HER2 negative early BC were HER2-low, and the proportions were 85.14% and 72.27% in the HR-positive and HR-negative groups, respectively, which is close to the results of our cohort. We believe that the discordance in HER2-low rates in different studies can be attributed to the following reasons. First, the patients in the previous pooled analysis were from several hospitals or clinical trials, and heterogeneity in HER2 evaluation among laboratories was inevitable. Second, the methodological limitations of IHC as the primary technique for identifying HER2-low population may be influenced by several factors, including pre-analytical and analytical factors[13]. To avoid the heterogeneity of HER2 IHC scores, the HER2 status was retested by a group of well-qualified pathologists at our institution in accordance with the 2018 ASCO/CAP guidelines. Third, it is rational to presume that the proportion of HER2-low was influenced by the stage of the disease due to temporal and spatial heterogeneity of the HER2 IHC score. HER2 IHC scores may change after treatment with neoadjuvant chemotherapy, adjuvant chemotherapy, radiotherapy, and endocrine therapy. Therefore, the proportion of HER2-low would vary among different stages or treatment regimens. Moreover, when patients with BC undergo neoadjuvant therapy, it is customary to perform a core needle biopsy or fine-needle aspiration to obtain tissue samples for pathological analysis. However, HER2 spatial heterogeneity may influence the concordance between biopsy results and actual HER2 expression status, thereby affecting the determination of final HER2 expression level. This heterogeneity introduces a degree of uncertainty, particularly in the identification of low HER2 expression levels among patients with BC diagnosed through pathological examination of biopsy specimens. IHC/ISH testing is currently the gold standard for assessing HER2 levels in clinical practice. However, these methods are influenced by various factors and increased HER2 heterogeneity complicates the evaluation of low HER2 expression, thereby posing challenges to its accurate interpretation. A recent study reported that current HER2 interpretation methods may struggle to precisely distinguish between patients with HER2-IHC0 and HER2 IHC1+[28], and that some of these patients may still benefit from T-DXd. Introducing new diagnostic methods with more precise thresholds is crucial to identify suitable targeted treatment candidates. Artificial intelligence and machine learning have shown promising results in terms of speed, accuracy, and cost-effectiveness, and would potentially play a more significant role in the future.
In the context of clinicopathological features, HER2-low was heterogeneous, and demonstrated mixed results associated with HR status[17,27,29,30]. In line with previous studies, HER2-low BC in our cohort was more often HR-positive than HER2-IHC0 BC in the entire cohort, with a higher proportion of ER level > 10% (76.1% vs. 60.1%, P < 0.001) and PgR-positivity (76.7% vs. 62.6%, P < 0.001). Moreover, it was noted that more number of patients with HER2-low BC received adjuvant endocrine therapy (52.0% vs. 33.3%, P = 0.002). However, subgroup analysis according to HR status was more complex. HER2-low BC showed clinicopathological characteristics similar to that of HER2-IHC0 in the HR-positive population. However, the HER2-low group tended to comprise more patients with invasive ductal type BC than the HER2-positive group (94.5% vs. 83.9%) in the HR-negative population. Nevertheless, other features were balanced between the HER2-IHC0 and HER2-low groups. Mutai et al. investigated 608 women with HER2-low HR-positive BC and found no differences in any of the prognostic pathological features between the HER2-0 and HER2-low groups, which is consistent with the findings of our HR-positive csubgroup[31]. However, a study that enrolled 777 patients with non-HER2-positive early BC in a Chinese institution indicated that the clinicopathological features of HER2-IHC0 and HER2-low were balanced in the HR-negative group, whereas the rate of PgR positivity in the HER2-low group was higher than that in the HER2-IHC0 group among the HR-positive cases. In the entire cohort, the Ki-67 index and TOP2A expression were lower in the HER2-low group; however, these differences disappeared when patients were divided according to the HR status[32]. A Korean study based on a national database reported greater differences in the clinicopathological features in their cohort[33]. HER2-low BC was more frequent in premenopausal patients and was associated with fewer T4 tumors, higher histological grade, and negative lymphatic invasion than HER2-IHC0 BC in the HR-positive group, whereas older patients with a higher lymph node ratio and positive lymphatic invasion were observed in the HR-negative group. The authors also reported a lower Ki-67 index in the HER2-low index. Taken together, although no clear conclusion can be drawn, one common finding was that HER2-low BC was more likely to be HR-positive and had a lower Ki-67 index compared with HER2-IHC0. Survival analysis in our study suggested that patients with HER2-low BC had a longer OS in the entire cohort. We further analyzed the results in terms of different HR statuses, and the results showed that OS improved in both HR-positive and HR-negative groups. Statistically better DFS was not observed between the HER2-low and HER2-IHC0 groups, regardless of the HR status. Although HER2 expression is a negative prognostic factor[2], the results in the field of survival of HER2-low BC compared to HER2-IHC0 BC are still disputable. Consistent with the results of the present study, Mutai et al. reported that, compared to HER2-IHC0 disease, HER2-low is associated with significantly improved OS and DFS [31]. Data from the United States National Cancer Database reported small improvements in the OS of patients with stage III HER2-low BC[15]. Several studies have reported no differences in OS or DFS [17,34]; however, a study in Japan showed that HER2-lowwas a negative prognostic factor for stage I triple-negative BC[35]. Another study enrolled 5907 primary non-metastatic invasive BC cases and reported that HER2-low may be a poor prognostic factor in the HR-positive group. Given the unignorable influence of treatment strategies on survival, a study enrolled 410 patients with systemic treatment-naïve node-negative BC with a long-term follow-up period of > 10 years and found substantially longer 3-year DFS (83.4% vs. 76.1%) and 3-year OS (91.6% vs. 85.8%) compared with HER2-IHC0 BC, proving the pure prognostic impact of HER2-low versus HER2 IHC0. Differences in OS and DFS were reportedly detected in the HR-positive group, whereas no significant differences in OS were detected in the HR-negative group[36]. Overall, despite the inconsistent prognostic results, majority of the studies reported an improved trend in both OS and DFS in the HER2-low group in both HR-positive and HR-negative groups, with or without statistical significance.
Consistent with prior reports[17], we found a positive correlation between ER status and HER2-low rate, which means that the rate of HER2-low increased with increasing ER levels. Schettini et al.[21] analyzed the PAM50 raw gene data of 1,320 patients with BC from several datasets and found that HER2-low tumors had higher expression of luminal- and proliferation-related genes, and that tyrosine kinase receptor genes were more highly expressed in HER2-IHC0 tumors than in HER2-low tumors[22,37], which can also explain the lower Ki-67 index in HER2-low BC. Agostinetto et al. evaluated ERBB2 and ESR1 expression, and their results were consistent with those reported by Schettini et al.[38]. Moreover, they reported a positive correlation between ERBB2 and ESR1 expression in both HER2-low and HER2-IHC0 groups[38]. These observations can be attributed to the bidirectional crosstalk between Estrogen receptor (ER) and growth factor-related signaling pathways. It has been confirmed that the sustained enhancement of HER2 signaling can potentiate the function of ERα[39]. We also explored the relationship between HER2-IHC0 and HER2-low BC at various ER levels. However, no such regularity was observed in this study.
Patients may experience a dynamic change in the HER2 IHC score during tumor progression. This type of HER2 heterogeneity has raised scientists’ interest and may be associated with resistance to anti-HER2 antibody-drug conjugates[40-42]. We explored and confirmed the instability of HER2 IHC status and described the HER2 IHC status from primary to the corresponding metastatic site. A total of 52 paired cases were analyzed in our study, with 28.84% of the cases showing a discordance in the HER2 IHC score between the primary and paired metastatic sites. As previous studies have demonstrated, the administration of endocrine therapy, chemotherapy, and radiotherapy may upregulate HER2 expression[43,44].
Our study had a few limitations that need consideration. First, since this was a single-institution retrospective study, our sample size was insufficient. Moreover, we only enrolled only the Chinese population. In addition, we failed to obtain all relapsed biopsies, which may have influenced the analysis of HER2 IHC evolution since HER2 spatiotemporal heterogeneity cannot be ignored. Second, the molecular characteristics were not described in this study, which are important for a better understanding of the HER2-low population. Further studies are required for molecular stratification of ERBB2 expression.
-
This study adds data and evidence to better understand HER2-low early BC in Chinese population. We observed similar clinicopathological features in both HR-positive and HER2-negative patients with HER2-low BC. Survival analysis indicated that HER2-low BC had a significantly longer OS than HER2-IHC0 in the whole cohort and HR-negative groups. Moreover, no significant improvement in OS was observed in the HR-positive group and HER2-low BC. In conclusion, our study did not support the notion that HER2-low BC is a distinct clinical subgroup.
HTML
Study Population and Data Collection
IHC
Objective
Statistical Analysis
Patient Characteristics
Survival Analysis
Association between HER2-low and ER Status
Evolution of HER2 IHC Status from Primary to Relapse and Metastatic Sites
COMPETING INTERESTS The authors have no relevant financial or non-financial interests to disclose.
ETHICS APPROVAL AND CONSENT TO PARTICIPATE This study was conducted in accordance with the Declaration of Helsinki and approved by the Medical Ethics Committee of the General Hospital of the Chinese People’s Liberation Army (hospital ethics no. S2023-307-1). The need for informed consent was waived by the Review Board due to the retrospective nature of the study.

 Quick Links
 DownLoad: