


-
Cardiovascular disease (CVD) is one of the leading causes of mortality worldwide[1,2], especially in China, where prevalent cases of cardiovascular diseases reached nearly 94 million in 2016[2], and accounts for more than 40% of all deaths in the country[1]. In the last few decades, the prevalence of cardiometabolic risk factors among Chinese children and adolescents has increased significantly, posing a threat to the health of children and adolescents in China[3,4]. In addition, cardiometabolic risk factors may be more significantly related to visceral adiposity compared with overall adiposity[5].
Some indicators which consider body fat distribution, such as waist-to-height ratio (WHtR), waist circumference (WC), and waist-to-hip ratio (WHR), have been shown to be associated with increased cardiovascular morbidity and mortality[6,7]. A cohort study in China found that the WC of elderly people aged over 65 years showed a significant increasing trend[8]. However, these measures of WC can only identify subcutaneous abdominal fat[9]. Some studies have demonstrated that visceral fat is more strongly associated with CVDs as well as metabolic risk factors than subcutaneous abdominal fat[10,11]. Compared with those without excess visceral fat, patients with excess visceral adiposity face significantly greater risks of metabolic abnormalities, coronary artery disease, and type 2 diabetes[12-14]. However, due to radiation exposure and high cost, measurements of visceral fat, such as Electronic Computed Tomography Instrument (CT) or Magnetic Resonance Imaging (MRI), are not widely available tools for health screening[9]. However, a previous study showed that triglyceride is significantly correlated with visceral fat, suggesting that it could be a good predictor of cardiovascular disease[15].
Several studies have shown that the hypertriglyceridemic waist (HW) phenotype is a cost-effective tool to identity visceral fat for people of all ages, and is associated with an elevated risk of coronary heart disease in youth[16-18]. However, compared with adults, the WC cutoffs are age- and sex-specific for children, and are less available or challenging to use non-professionally[19]. Therefore, a cross-sectional study of Han adolescents indicated that the hypertriglyceridemic waist-to-height ratio (HWHtR) phenotype could be used as a marker to identify the lipid profile of adolescent atherosclerosis[19]. However, it is not known whether the HWHtR phenotype can be used as an alternative to the HW phenotype for children in China. Previous studies on the associations between the WHR phenotype and cardiovascular risk factors clustering are limited, especially in children and adolescents. In addition, a previous study in adults indicated that WHR has a weaker association with cardiovascular risk factors than HW and HWHtR[19]. However, it is not clear whether WHR is a better marker than others among children and adolescents.
Therefore, the purpose of this study was to investigate the relationship between HW, HWHtR, and WHR and cardiovascular risk factors, as well as their potential or predictive ability as screening tools for cardiometabolic risk factor clustering in children and adolescents.
-
The study was a cross-sectional study which was embedded in the baseline survey of a national multicentered cluster randomized controlled trial (Trial registration date: January 22, 2015; Registration number: NCT02343588) involving about 70,000 Chinese participants aged 6–18 years from seven provinces (including Shanghai, Liaoning, Tianjin, Guangdong, Hunan, Chongqing, and Ningxia)[20]. The trial was approved by the Ethics Committee of Peking University (No. IRB0000105213034). With consent obtained from students, their parents, and the principals of their educational institutions, participants completed the questionnaires, physical examinations, and biochemical assessments. The details of the trial are available in the previously published protocol[21]. Participants who did not have complete baseline data and who were over the age of 18 years were excluded from this analysis. Finally, 62,168 children aged 6–17 years were selected for analysis.
-
Anthropometric parameters included weight, height, hip circumference (HC), WC, and body mass index (calculated using the formula of weight divided by square of height, kg/m2). Weight was measured to the nearest 0.1 kg on a calibrated level type weight scale (model RGT-140, China). Height was measured to an accuracy of 1 mm with Portable stadiometer (model TZG, China). Each participant was measured without shoes and in light clothing. HC and WC were measured using steel tape. HC was defined as the maximum extension of the hip, and WC was defined as the horizontal line between the upper border of the iliac crest and the lowest rib. WHtR was calculated by dividing WC by height, whereas WHR was calculated by dividing WC by HC. Blood pressure (BP) was measured using a mercury sphygmomanometer, (model XJ1ID, China) and a TZ-1 stethophone. Diastolic blood pressure (DBP) and systolic blood pressure (SBP) were recorded twice on the right arm. Potential covariates were investigated by questionnaires, including a children questionnaire and parent questionnaire. Age, sex, area (rural or urban), and family income (< 5,000 CNY, or ≥ 5,000 CNY) were included in the present study as covariates.
-
Biochemical variables included Triglycerides (TG), fasting plasma glucose (FPG), total cholesterol (TC), high-density lipoprotein cholesterol (HDL-C), and low-density lipoprotein cholesterol (LDL-C). Venous blood samples were taken and collected after a 12-h overnight fast. All biochemical analyses was performed at a biomedical analysis laboratory.
-
WC cut-off values ≥ 90th percentile for age and sex for children and adolescents were classified as high WC[22]. HC was defined as the dimension at the level of the maximum extension of the buttocks. WHR was calculated as WC (cm) divided by HC (cm)[19]. WHtR was calculated as WC (cm) divided by height (cm)[19]. According the National Cholesterol Education Program’s (NCEP) Pediatric Panel Report, elevated TG was defined as ≥ 1.24 mmol/L[23]. High SBP and DBP were classified as ≥ 90th percentile for age, sex according to published reference values[24]. Hypercholesterolemia was defined as TC ≥ 200 mg/dL[23]. Low HDL-C was defined as ≤ 1.03 mmol/L and high LDL-C as ≥ 130 mg/dL[25]. The HWHtR phenotype was defined as serum TG concentrations ≥ 1.24 mmol/L and WHtR ≥ 0.50[16]. The HW phenotype was defined as serum TG concentrations ≥ 1.24 mmol/L and WC ≥ 90th percentile for age and sex[23,26]. The WHR phenotype was defined as WHR threshold for age and sex according to lambda-mu-sigma (LMS) curve[27]. Cardiometabolic health risk factor clustering was defined as having at least two of the following cardiometabolic health risk factors: elevated TG, low HDL, elevated LDL, hypercholesterolemia, elevated BP, and impaired FPG[28,29].
-
We used SPSS version 26.0 for all statistical analyses, considering P < 0.05 as statistically significant. Comparisons were conducted based on sex using the ANOVA. Data are described as means ± standard deviation (SD). Chi-square analysis based on sex and category of the phenotype was conducted for categorical variables. Multiple logistic regression models were conducted for modeling relationships among HW, HWHtR, and WHR, and elevated TG, low HDL, elevated LDL, hypercholesterolemia, elevated BP, and impaired FPG. Logistic regression was also used to determine the risk (OR, 95% CI) of cardiometabolic health risk factor clustering. Participants without the HW and HWHtR phenotypes were considered as the reference groups. Two multivariable logistic regression models with different covariates were fitted for the analysis. Model 1 was adjusted for sex, age, and BMI. In addition to adjusting for the covariates in Model 1, Model 2 was adjusted for area and family income. The stratified analyses were performed by sex (boy and girl) and age (6–9, 10–12, 13–15, and 16–17 years)[30].
-
Of the 62,168 study participants, 17.5% individuals fulfilled the diagnosis for the cardiometabolic risk factors clustering (18.1% boys and 16.9% girls), and 8.3% were defined as having the HW phenotype, with 8.2% in boys and 8.5% in girls. A total of 6.6% of the participants were classified as having the HWHtR phenotype (8.0% in boys and 5.2% in girls), 34.3% of the participants had high WHR (32.8% in boys and 40.0% in girls). For different cardiometabolic risk factors, 25.7% had elevated BP, 0.3% had impaired FPG, 12.6% had low HDL, 3.0% had elevated LDL, 26.8% had elevated TG, and 5.4% had hypercholesterolemia. Boys had significantly higher SBP, DBP, and FPG than girls (P < 0.05). Girls had significantly higher TG, LDL, and TC than boys (P < 0.05) (Table 1 and Supplementary Table S1, available in www.besjournal.com).
Variables Total Boy (n = 32,064) Girl (n = 30,104) P N x ± s n x ± s n x ± s Age (years) 62,168 10.80 ± 3.30 32,064 10.72 ± 3.26 30,104 10.94 ± 3.34 < 0.001 BMI (kg/m2) 62,168 18.55 ± 3.75 32,064 18.84 ± 3.92 30,104 18.24 ± 3.54 < 0.001 WC (cm) 61,802 64.75 ± 10.79 31,858 65.85 ± 11.50 29,944 63.59 ± 9.86 < 0.001 Hipline (cm) 61,815 77.18 ± 12.00 31,882 77.07 ± 12.07 29,933 77.30 ± 11.92 0.018 CHRF clustering, n (%) < 2 13,195 82.5 6,675 81.9 6,520 83.1 0.056 ≥ 2 2,800 17.5 1,472 18.1 1,328 16.9 HW, n (%) 0 13,736 91.7 7,050 91.8 6,686 91.5 0.479 1 1,249 8.3 628 8.2 621 8.5 HWHtR, n (%) 0 9,079 93.4 4,587 92.0 4,492 94.8 < 0.001 1 644 6.6 397 8.0 247 5.2 WHR, n (%) 0 40,480 65.7 21,373 67.2 19,107 60.0 < 0.001 1 21,153 34.3 10,410 32.8 10,743 40.0 Note. BMI, body mass index; WC, waist circumference; HW, hypertriglyceridemic waist; HWHtR, hypertriglyceridemic waist-to-height ratio; WHR, waist-to-hip ratio; CHRF clustering, cardiometabolic health risk factors clustering. Table 1. General characteristics of the study population by sex
Comparisons were conducted between the participants with and without the HW, HWHtR, and WHR phenotypes. As the results in Supplementary Tables S2–S4 (available in www.besjournal.com) showed, the participants with the HW, HWHtR or WHR phenotypes had significantly higher levels of LDL, TG, TC, and BP, as well as higher cardiometabolic health risk. Moreover, the participants had lower HDL levels than those without these phenotypes. Additionally, the difference of the level of FPG between the participants with and without those phenotypes was insignificant.
Variables Category non-HW HW P N Freq. (%) N Freq. (%) Sex boy 7,050 51.3 628 50.3 0.479 girl 6,686 48.7 621 49.7 Area rural 4,946 41.7 385 36.4 < 0.001 urban 6,905 58.3 672 63.6 Family income
(CNY)< 5,000 3,756 64.3 357 62.9 0.494 ≥ 5,000 2,086 35.7 211 37.1 BP (mmHg) < P90 10,632 77.4 669 53.6 < 0.001 ≥ P90 3,104 22.6 580 46.4 FPG (mmol/L) < 6.1 13,696 99.7 1,242 99.7 0.739 ≥ 6.1 37 0.3 4 0.3 HDL (mmol/L) ≥ 1.03 12,235 89.1 839 67.2 < 0.001 < 1.03 1,501 10.9 410 32.8 LDL (mmol/L) < 3.37 13,384 97.4 1,159 92.8 < 0.001 ≥ 3.37 352 2.6 90 7.2 TG (mmol/L) < 1.24 10,845 79.0 0 0.0 < 0.001 ≥ 1.24 2,891 21.0 1,249 100.0 TC (mmol/L) < 5.17 13,075 95.2 1,098 87.9 < 0.001 ≥ 5.17 661 4.8 151 12.1 CHRF clustering < 2 11,851 86.3 395 31.6 < 0.001 ≥ 2 1,885 13.7 854 68.4 Note. BP, blood pressure; FPG, fasting plasma glucose; HDL, high-density lipoprotein; LDL, low-density lipoprotein; TG, triglyceride; TC, total cholesterol; CHRF clustering, cardiometabolic health risk factors clustering; HW, hypertriglyceridemic waist. Table S2. Comparisons of cardiometabolic health risk factors between subjects with and without HW phenotype
Variables Category non-WHR WHR P N Freq. (%) N Freq. (%) Sex boy 21,373 52.8 10,410 49.2 < 0.001 girl 19,107 47.2 10,743 50.8 Area rural 12,756 37.7 6,877 36.9 0.081 urban 21,124 62.3 11,770 63.1 Family income (CNY) < 5,000 10,914 63.5 5,612 63.9 0.494 ≥ 5,000 6,285 36.5 3,172 36.1 BP (mmHg) < P90 27,950 77.1 13,999 69.3 < 0.001 ≥ P90 8,316 22.9 6,206 30.7 FPG (mmol/L) < 6.1 10,166 99.7 5,641 99.7 0.683 ≥ 6.1 27 0.3 17 0.3 HDL (mmol/L) ≥ 1.03 9,131 89.6 4,744 83.8 < 0.001 < 1.03 1,064 10.4 920 16.2 LDL (mmol/L) < 3.37 9,979 97.9 5,408 95.5 < 0.001 ≥ 3.37 216 2.1 256 4.5 TG (mmol/L) < 1.24 7,592 74.5 4,013 70.9 < 0.001 ≥ 1.24 2,602 25.5 1,649 29.1 TC (mmol/L) < 5.17 9,745 95.6 5,254 92.8 < 0.001 ≥ 5.17 450 4.4 410 7.2 CHRF clustering < 2 8,715 85.5 4,372 77.2 < 0.001 ≥ 2 1,479 14.5 1,290 22.8 Note. BP, blood pressure; FPG, fasting plasma glucose; HDL, high-density lipoprotein; LDL, low-density lipoprotein; TG, triglyceride; TC, total cholesterol; CHRF clustering, cardiometabolic health risk factors clustering; WHR, waist-to-hip ratio. Table S4. Comparisons of cardiometabolic health risk factors between subjects with and without WHR phenotype
Multivariate adjusted ORs (95% CIs) for cardiometabolic health risk factors among the HW, HWHtR, and WHR phenotypes are presented in Table 2. With adjustment of age and sex, and BMI, the risk of cardiometabolic health risk factors in the HW or HWHtR phenotype was significantly higher than those without the phenotype among children (HW: OR = 10.79, 95% CI: 9.28–12.55; HWHtR: OR = 9.21, 95% CI: 7.45–11.39). The risks of low HDL, elevated LDL, elevated TC, and high BP were also significantly higher for children with these phenotypes compared with those for children without the HW, HWHtR or WHR phenotype. After adjusting for age, sex, BMI, area, and family income by multivariate logistic regression, the risk of cardiometabolic health risk factors clustering in the HW phenotype was 11.22-fold higher than that in the non-HW group (OR = 12.22, 95% CI: 9.54–15.67). The risk of cardiometabolic health risk factors clustering in the HWHtR phenotype was also higher that than in the non-HWHtR group (HW: OR = 9.70, 95% CI: 6.93–13.58). Those with the HW phenotype were more likely to have low HDL, elevated LDL, elevated TC, and high BP compared with non-HW group. Additionally, except for LDL and TC, there was no significant difference between the HWHtR and HW phenotypes in the OR of risk factors for cardiometabolic risk factors clustering after adjustment of the covariates. The risk of elevation of LDL with the HWHtR phenotype was significantly higher than that with the HW phenotype (HW: OR = 2.96, 95% CI: 1.84–4.75; HWHtR: OR = 6.87, 95% CI: 3.58–13.19). The OR(95%CI) for risk of elevated TC is 3.89 (95%CI: 2.65-5.73) and 4.94 (95%CI: 2.88-8.47) for HW and HWHtR phenotype, respectively. Compared with children with the HW or HWHtR phenotype, the risk of cardiometabolic risk factors clustering in the WHR phenotype was much lower and insignificant.
Models HW HWHtR WHR OR 95% CI P OR 95% CI P OR 95% CI P Model 1 Elevated TG NA NA NA NA NA NA 0.82 0.75–0.89 < 0.001 Low HDL 2.83 2.42–3.32 < 0.001 2.63 2.13–3.24 < 0.001 1.18 1.05–1.31 0.004 Elevated LDL 2.08 1.55–2.78 < 0.001 3.18 2.13–4.74 < 0.001 1.94 1.59–2.38 < 0.001 Elevated TC 2.58 2.05–3.25 < 0.001 2.85 2.04–3.98 < 0.001 1.64 1.41–1.91 < 0.001 Elevated BP 1.42 1.23–1.63 0.007 1.31 1.08–1.58 0.007 0.92 0.88–0.96 < 0.001 FPG 1.07 0.32–3.53 0.540 0.60 0.12–3.02 0.538 1.14 0.57–2.26 0.720 CHRF clustering 10.79 9.28–12.55 < 0.001 9.21 7.45–11.39 < 0.001 1.05 0.95–1.15 0.350 Model 2 Elevated TG NA NA NA NA NA NA 1.09 0.95–1.25 0.234 Low HDL 2.45 1.88–3.19 < 0.001 2.71 1.93–3.80 < 0.001 1.30 1.08–1.55 0.005 Elevated LDL 2.96 1.84–4.75 < 0.001 6.87 3.58–13.19 < 0.001 1.64 1.15–2.33 < 0.001 Elevated TC 3.89 2.65–5.73 < 0.001 4.94 2.88–8.47 < 0.001 1.51 1.15–1.98 0.003 Elevated BP 1.32 1.06–1.66 0.015 1.08 0.80–1.47 0.614 1.00 0.93–1.07 0.905 FPG 0.98 0.10–9.63 0.990 1.59 0.13–19.23 0.716 1.89 0.64–5.54 0.247 CHRF clustering 12.22 9.54–15.67 < 0.001 9.70 6.93–13.58 < 0.001 1.14 0.97–1.34 0.115 Note. BP, blood pressure; FPG, fasting plasma glucose; HDL, high-density lipoprotein; LDL, low-density lipoprotein; TG, triglyceride; TC, total cholesterol; CHRF clustering, cardiometabolic health risk factors clustering; HW, hypertriglyceridemic waist; HWHtR, hypertriglyceridemic waist-to-height ratio; WHR, waist-to-hip ratio; NA, data not available. Model 1: adjusted for sex (boy or girl), age (years) and BMI. Model 2: adjusted for variables from model 1, and additionally adjusted by area and family income. Table 2. OR (95% CI) of cardiometabolic health risk factors for the HW, HWHtR, and WHR phenotypes
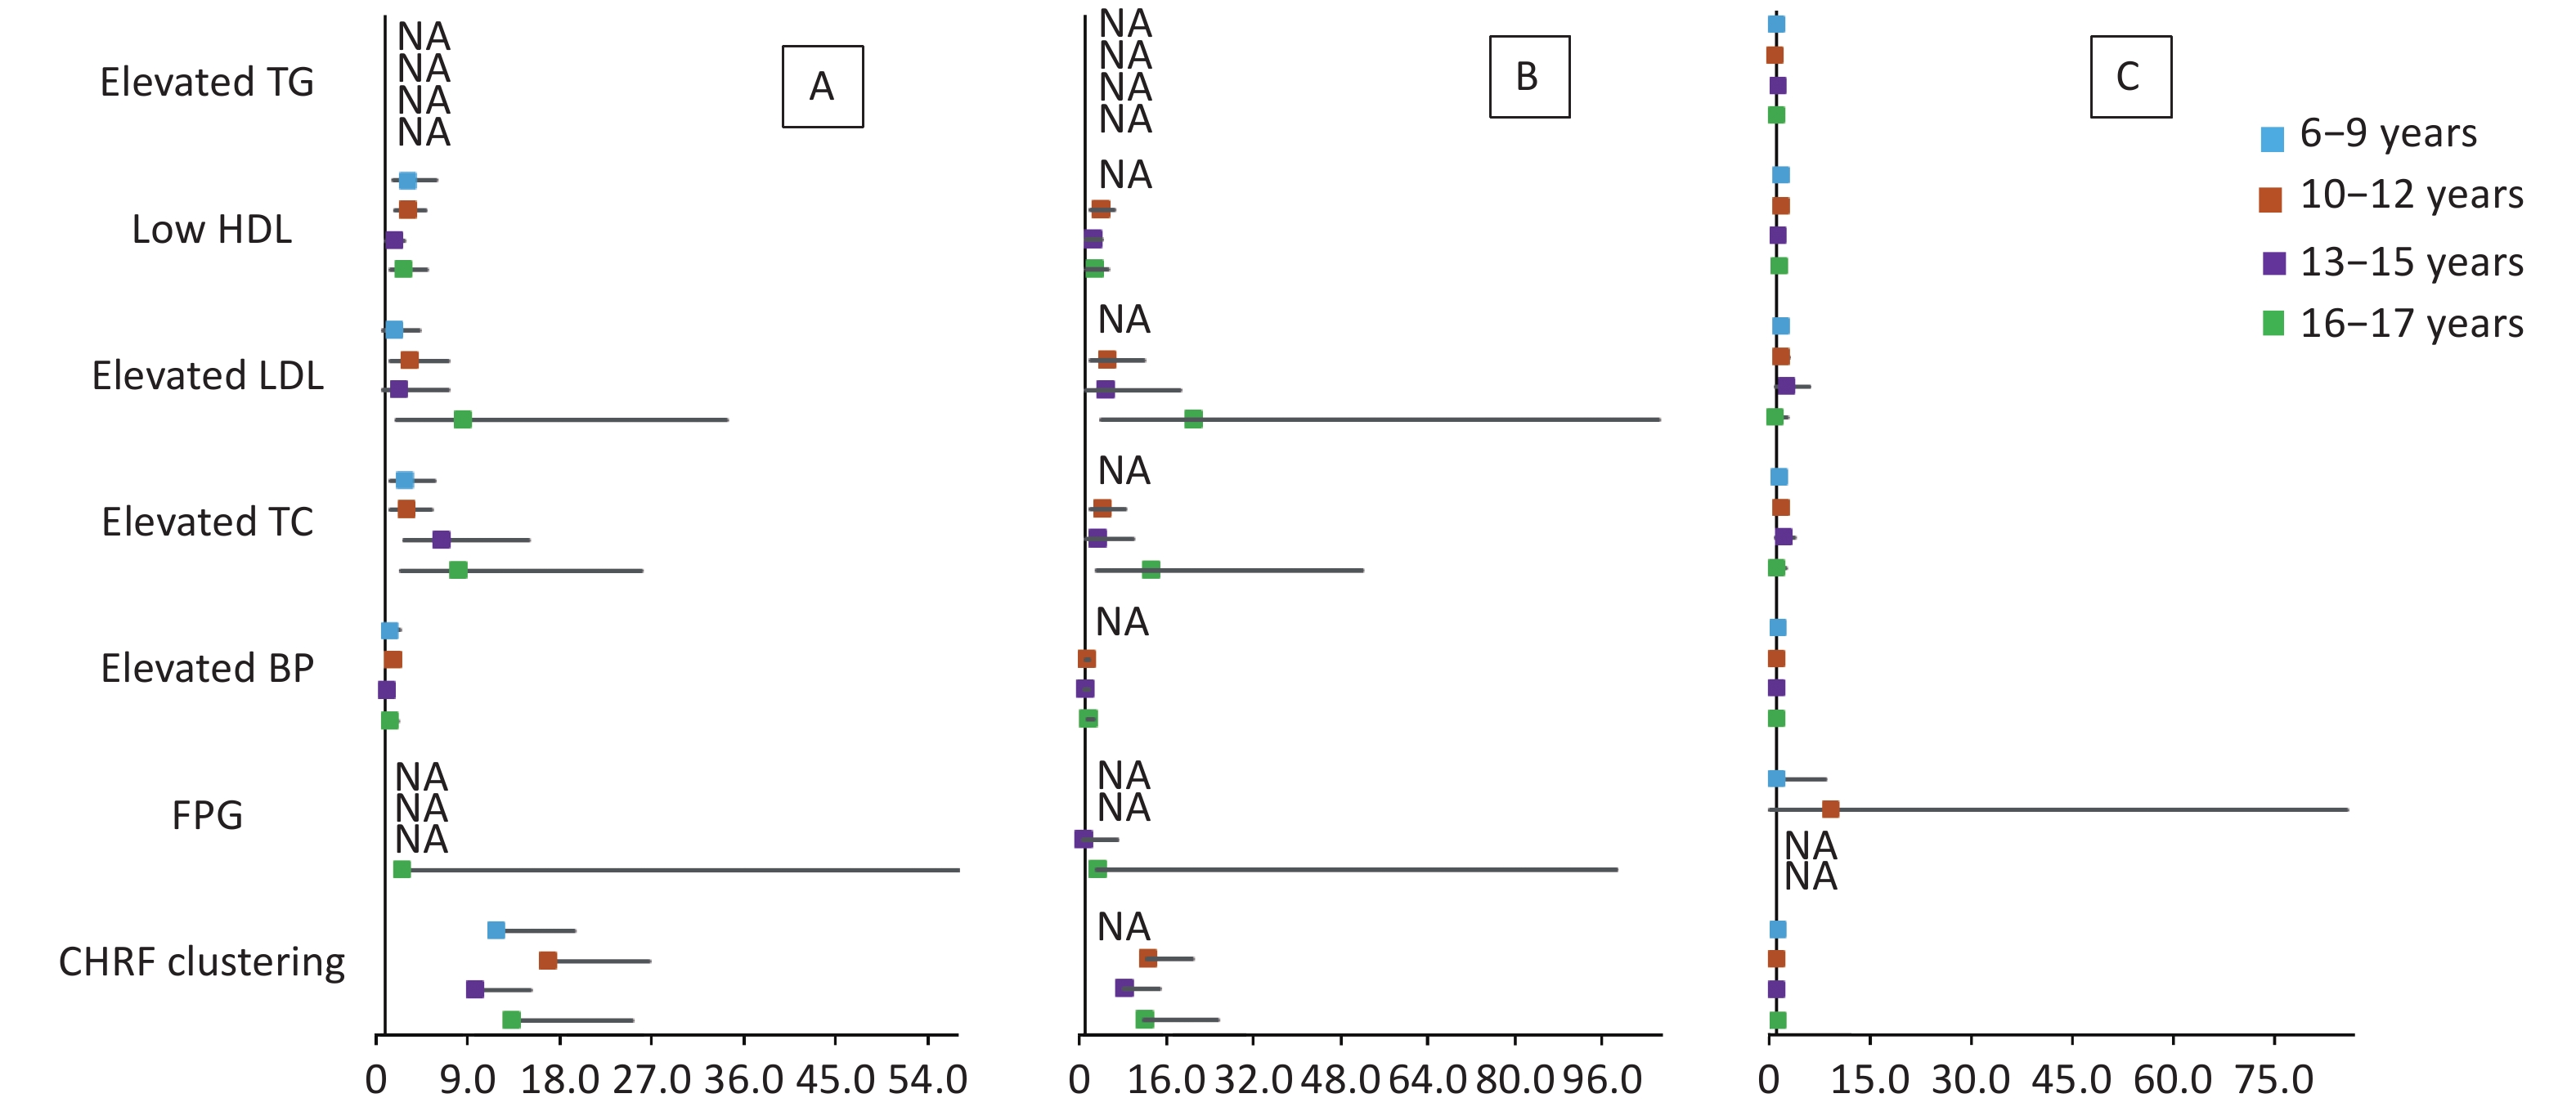
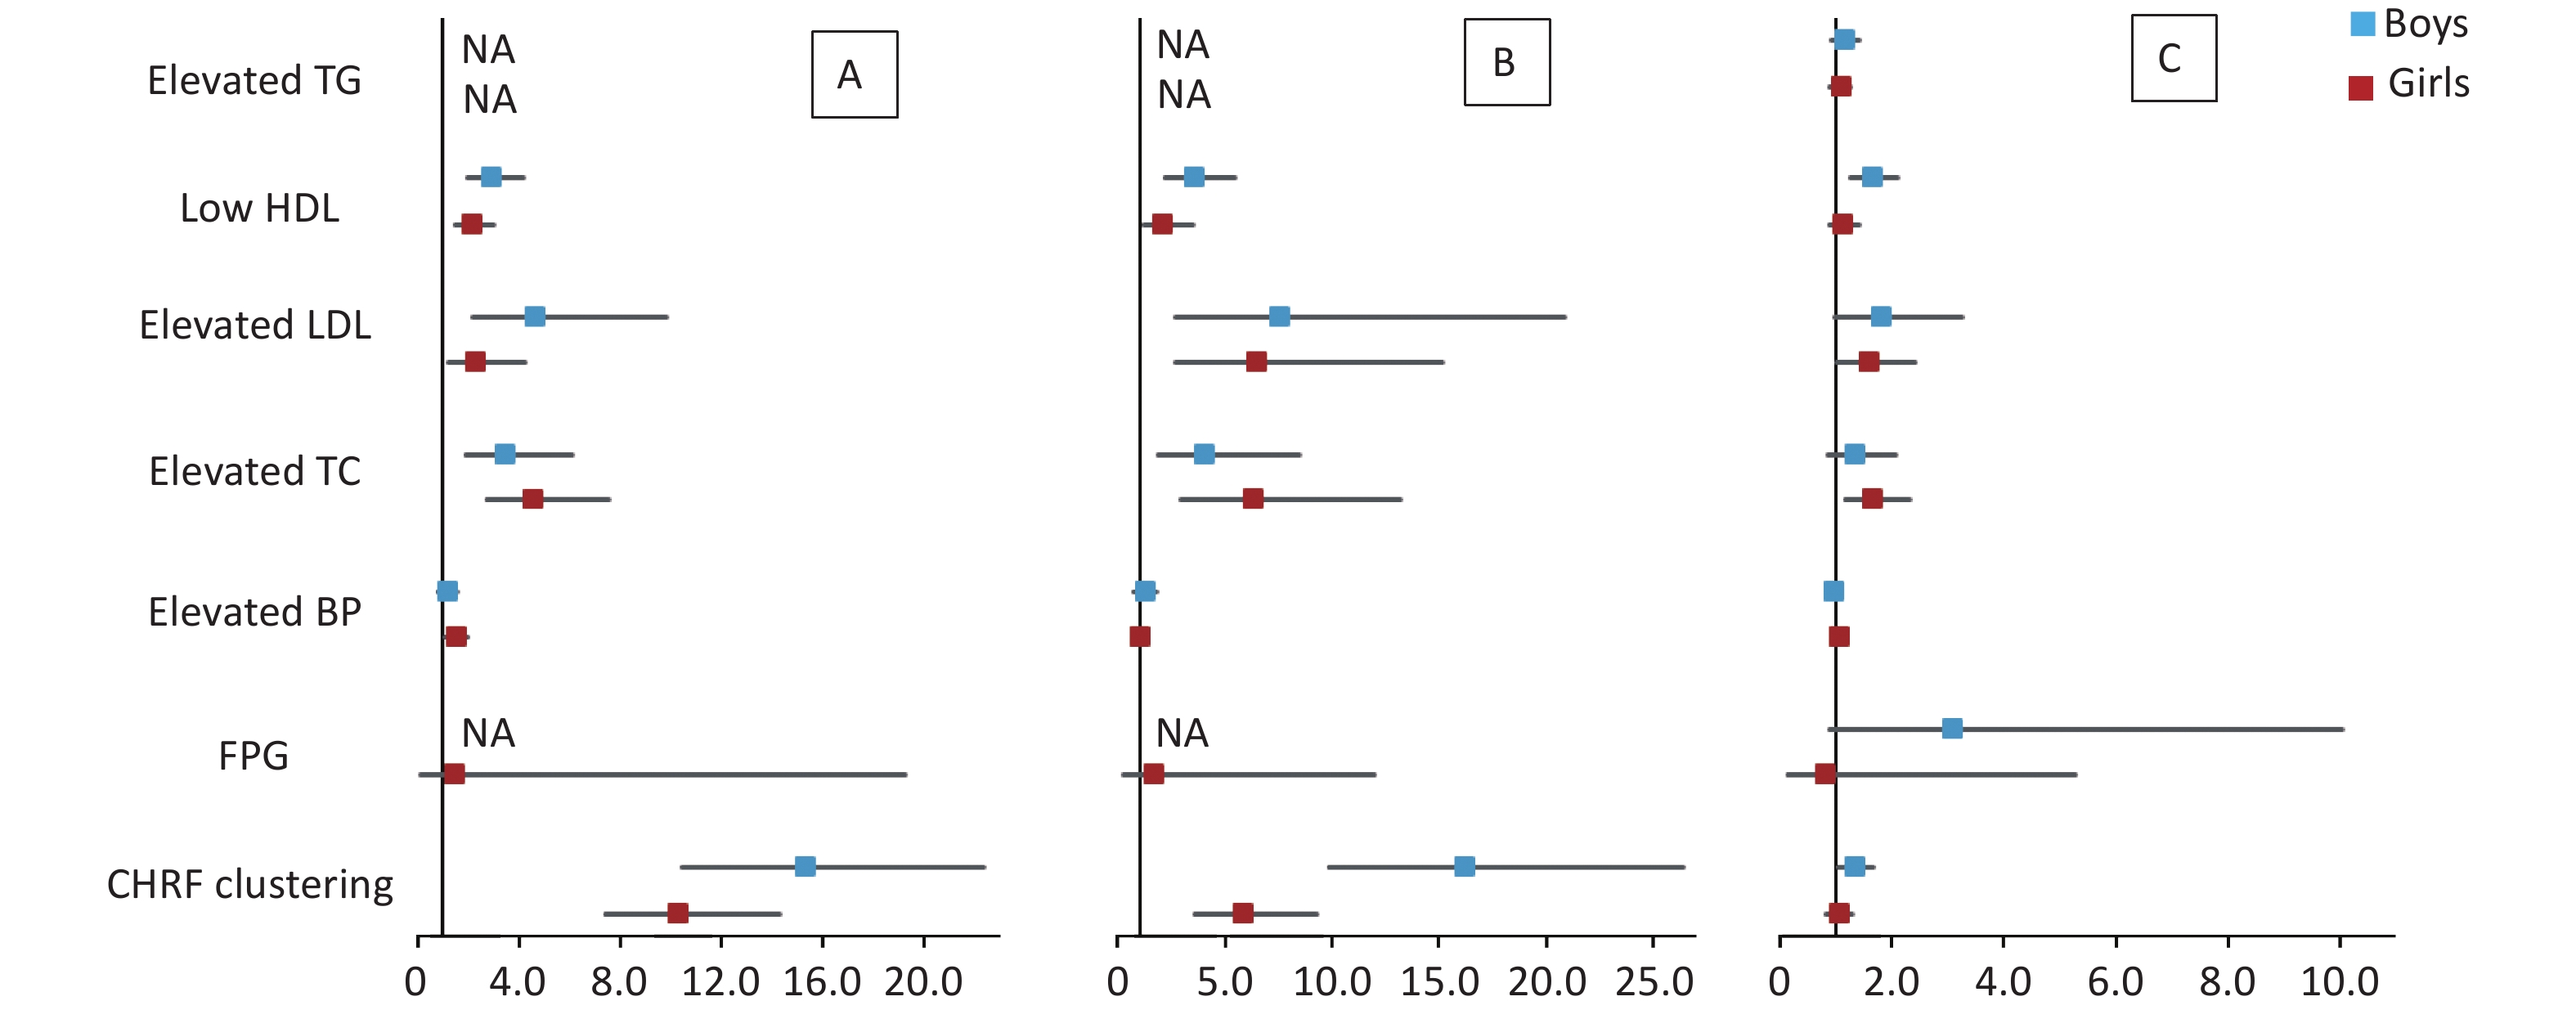
The results of multivariate logistic regression analysis of cardiometabolic health risk factors of the HW, HWHtR, and WHR phenotypes by sex and age stratified according to model 2 are shown in Supplementary Tables S5–S6 (available in www.besjournal.com) and Figures 1–2. The results after stratification by sex and age were similar to those without stratification. The WHR phenotype had a significantly lower and more insignificant risk of cardiometabolic risk factor aggregation than children with the HW or HWHtR phenotypes.
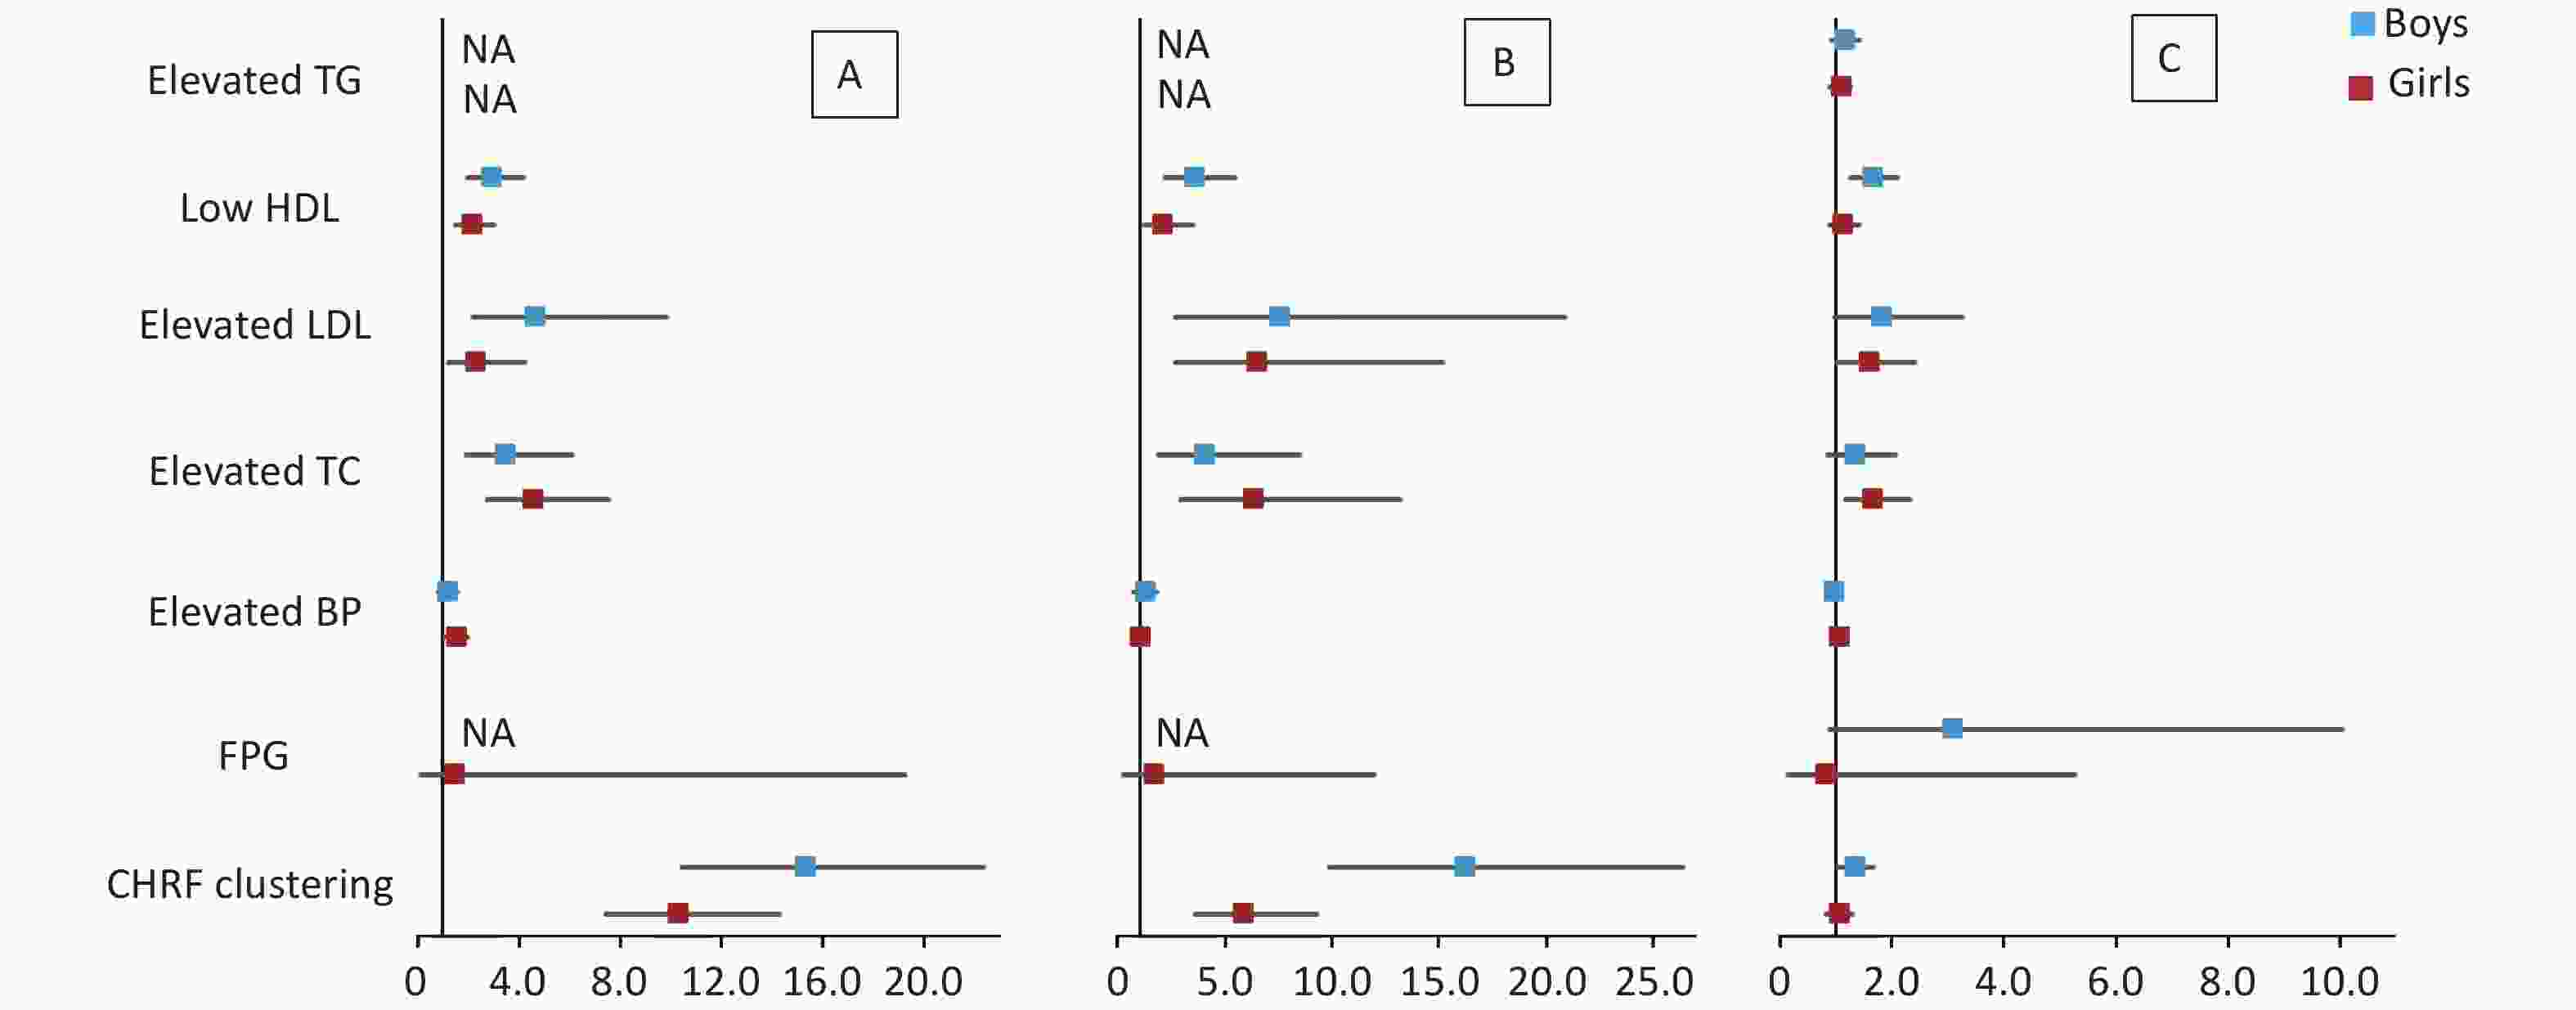
Figure 1. Forest plot of cardiometabolic health risk factors for HW (A), HWHtR (B), and WHR (C) phenotypes stratified by sex. BP, blood pressure; FPG, fasting plasma glucose; HDL, high-density lipoprotein; LDL, low-density lipoprotein; TG, triglyceride; TC, total cholesterol; NA, data not available. CHRF clustering: cardiometabolic health risk factors clustering. Model: adjusted for age (years), BMI, area and family income. HW, hypertriglyceridemic waist; HWHtR, hypertriglyceridemic waist-to-height ratio; WHR, waist-to-hip ratio.
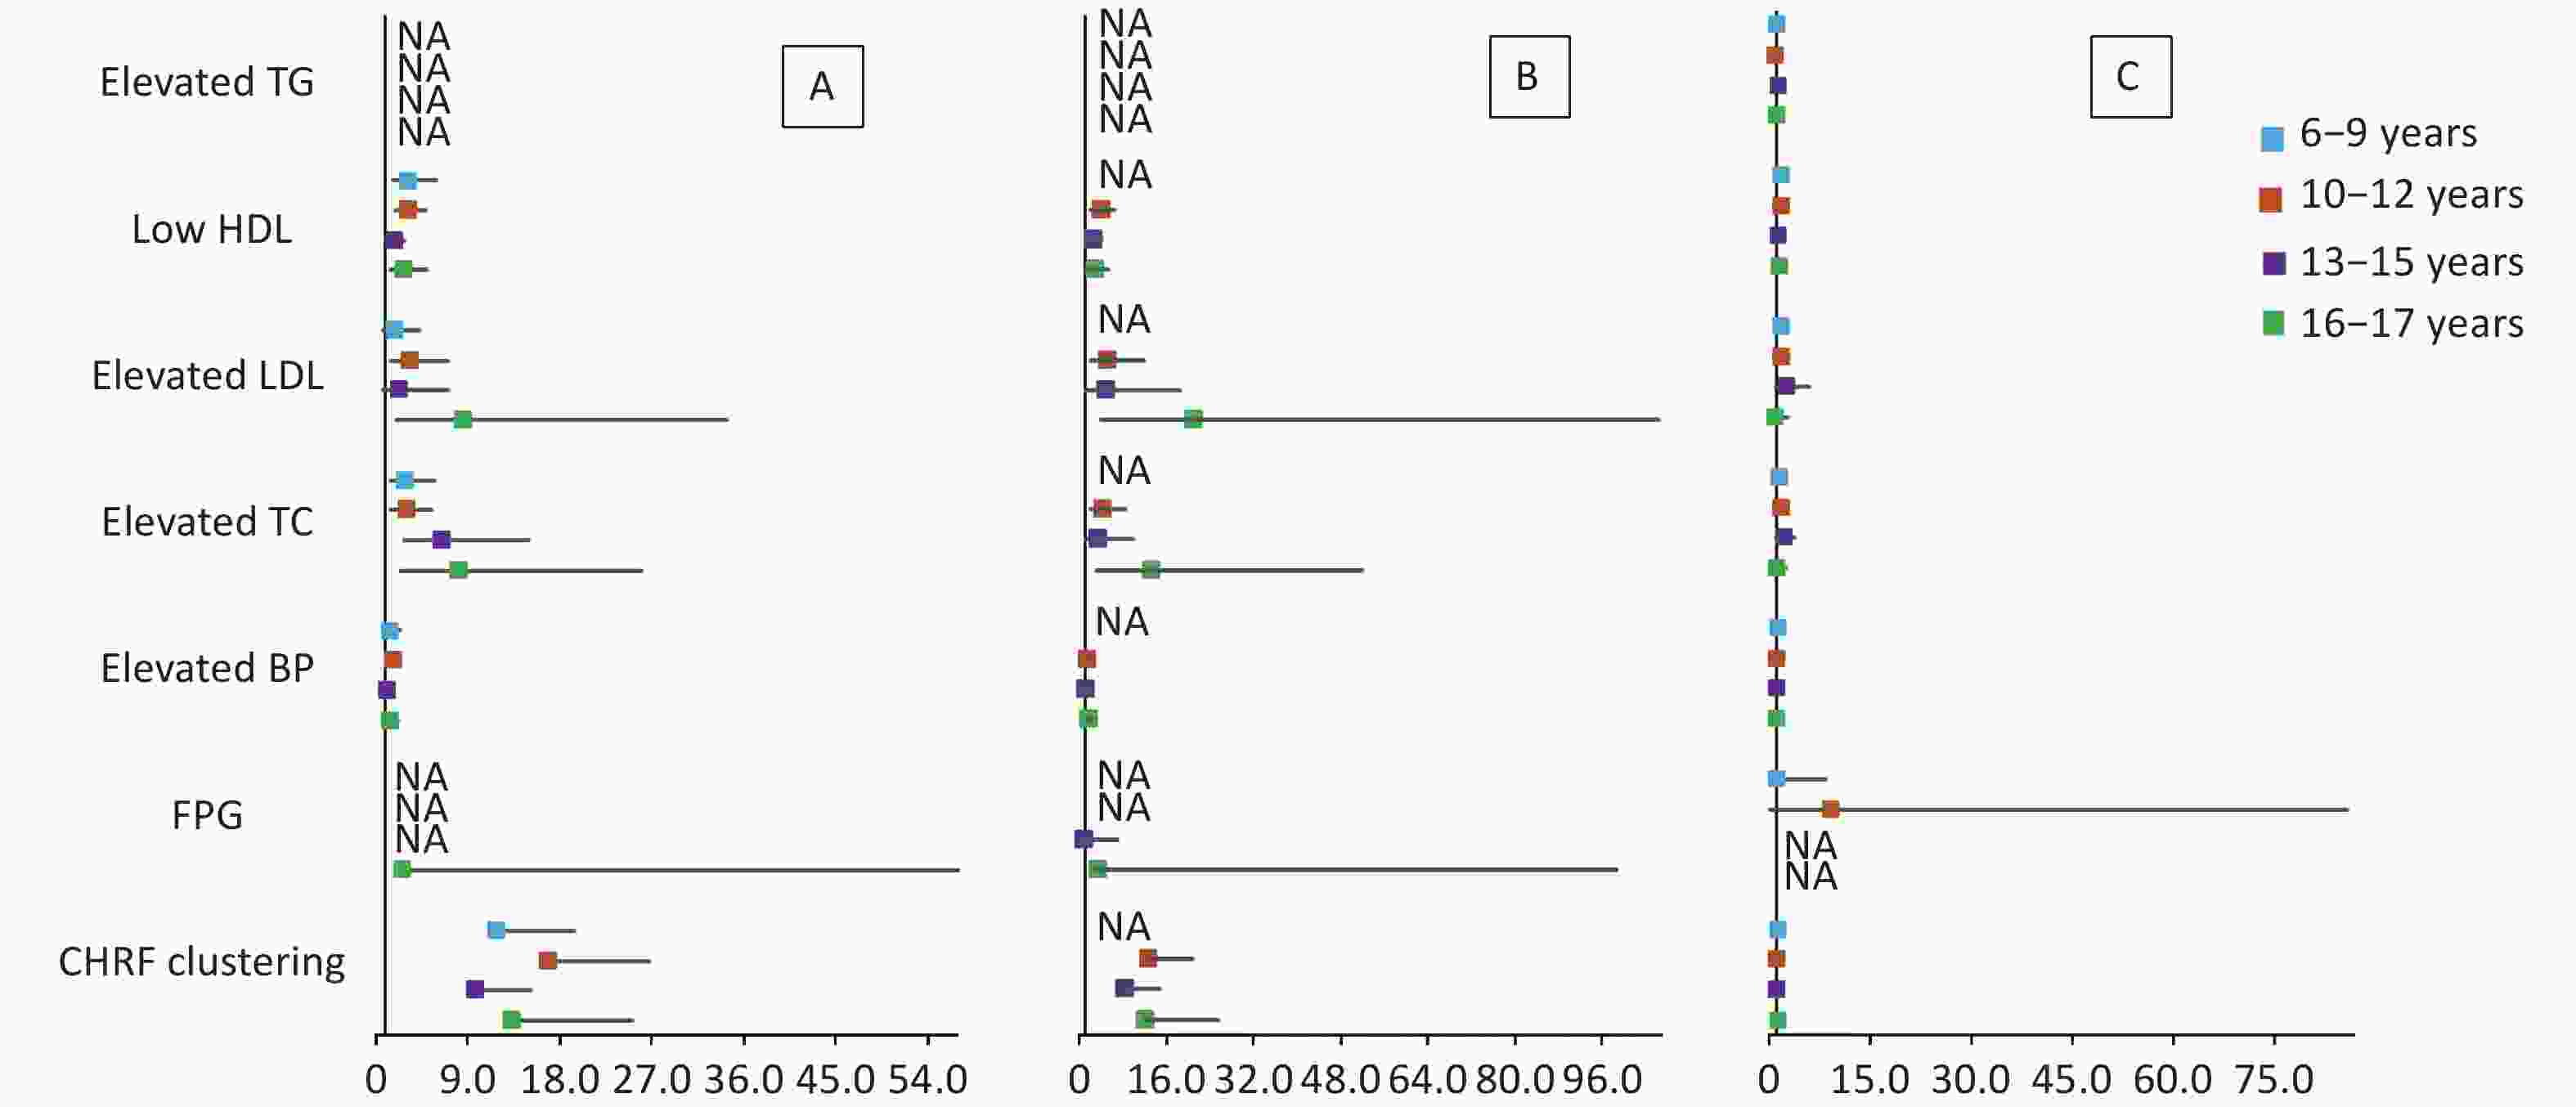
Figure 2. Forest plot of cardiometabolic health risk factors for HW (A), HWHtR (B), and WHR (C) phenotypes stratified by age. BP, blood pressure; FPG, fasting plasma glucose; HDL, high-density lipoprotein; LDL, low-density lipoprotein; TG, triglyceride; TC, total cholesterol; NA, data not available. CHRF clustering: cardiometabolic health risk factors clustering. Model: adjusted for sex, BMI, area and family income. HW, hypertriglyceridemic waist; HWHtR, hypertriglyceridemic waist-to-height ratio; WHR, waist-to-hip ratio.
Models HW HWHtR WHR OR 95% CI P OR 95% CI P OR 95% CI P Boys Model 1 Elevated TG NA NA NA NA NA NA 0.94 0.83−1.07 0.330 Low HDL 2.93 2.35−3.67 < 0.001 3.05 2.32−4.01 < 0.001 1.39 1.19−1.62 < 0.001 Elevated LDL 2.22 1.47−3.35 < 0.001 3.02 1.77−5.15 < 0.001 2.01 1.46−2.75 < 0.001 Elevated TC 2.48 1.78−3.46 < 0.001 2.59 1.67−4.02 < 0.001 1.54 1.22−1.96 < 0.001 Elevated BP 1.46 1.19−1.78 0.007 1.48 1.14−1.91 0.003 0.86 0.81−0.92 < 0.001 FPG NA NA NA NA NA NA 1.15 0.49−2.69 0.752 CHRF clustering 14.11 11.23−17.72 < 0.001 15.19 11.23−20.55 < 0.001 1.15 1.00−1.33 0.053 Model 2 Elevated TG NA NA NA NA NA NA 1.12 0.90−1.41 0.304 Low HDL 2.83 1.94−4.15 < 0.001 3.49 2.22−5.48 < 0.001 1.62 1.24−2.11 < 0.001 Elevated LDL 4.58 2.14−9.80 < 0.001 7.47 2.67−20.91 < 0.001 1.78 0.98−3.26 0.060 Elevated TC 3.38 1.88−6.07 < 0.001 3.97 1.85−8.52 < 0.001 1.33 0.86−2.05 0.197 Elevated BP 1.13 0.81−1.58 0.476 1.20 0.78−1.83 0.407 0.93 0.83−1.03 0.152 FPG NA NA NA NA NA NA 3.06 0.89−10.06 0.077 CHRF clustering 15.28 10.44−22.36 < 0.001 16.18 9.91−26.42 < 0.001 1.31 1.02−1.67 0.034 Girls Model 1 Elevated TG NA NA NA NA NA NA 0.73 0.65−0.82 < 0.001 Low HDL 2.68 2.14−3.36 < 0.001 2.16 1.54−3.02 < 0.001 1.04 0.89−1.21 0.646 Elevated LDL 2.00 1.32−3.04 0.001 3.37 1.86−6.14 < 0.001 1.84 1.41−2.41 < 0.001 Elevated TC 2.82 2.05−3.89 < 0.001 3.11 1.87−5.19 < 0.001 1.66 1.36−2.03 < 0.001 Elevated BP 1.34 1.10−1.64 0.004 1.10 0.81−1.49 0.531 0.96 0.90−1.023 0.205 FPG 2.95 0.70−12.47 0.140 2.18 0.29−16.15 0.447 1.43 0.46−4.47 0.542 CHRF clustering 8.84 7.20−10.85 < 0.001 5.33 3.91−7.26 < 0.001 0.96 0.84−1.09 0.498 Model 2 Elevated TG NA NA NA NA NA NA 1.05 0.88−1.26 0.568 Low HDL 2.10 1.45−3.03 < 0.001 2.07 1.22−3.49 0.007 1.11 0.87−1.42 0.413 Elevated LDL 2.26 1.21−4.22 0.010 6.44 2.74−15.15 < 0.001 1.56 1.01−2.42 0.045 Elevated TC 4.55 2.74−7.57 < 0.001 6.25 2.95−13.25 < 0.001 1.64 1.16−2.31 0.005 Elevated BP 1.46 1.07−1.98 0.017 0.98 0.78−1.23 0.858 1.03 0.94−1.14 0.506 FPG 1.43 0.11−19.29 0.786 1.63 0.22−11.96 0.631 0.78 0.12−5.28 0.799 CHRF clustering 10.26 7.38−14.27 < 0.001 5.76 3.57−9.29 < 0.001 1.02 0.83−1.27 0.825 Note. BP, blood pressure; FPG, fasting plasma glucose; HDL, high-density lipoprotein; LDL, low−density lipoprotein; TG, triglyceride; TC, total cholesterol. CHRF clustering, cardiometabolic health risk factors clustering; HW, hypertriglyceridemic waist; HWHtR, hypertriglyceridemic waist-to-height ratio; WHR, waist−to−hip ratio; NA, data not available. Model 1: adjusted for age (years) and BMI. Model 2: adjusted for variables from model 1, and additionally adjusted by area and family income. Table S5. OR (95% CI) of cardiometabolic health risk factors for HW, HWHtR and WHR phenotype stratified by sex
-
In this cross-sectional study of 62,168 participants, the HW, HWHtR, and WHR phenotypes were used as a marker for cardiometabolic risk factors and their clustering. We found that the HW phenotype was associated with a significantly increased risk of cardiometabolic risk factors clustering among children and adolescents. The increased risk of cardiometabolic risk factors clustering also exists in children and adolescents with the HWHtR phenotype compared with children and adolescents without an HWHtR phenotype. However, compared with the WHR phenotype, the HW and HWHtR phenotypes were superior as screening indicators for cardiometabolic health risk factor clustering.
When body fat capacity exceeds the normal load, the storage capacity of subcutaneous fat will significantly decrease and release excess free fatty acids in the body[15,31]. High concentrations of fatty acids will lead to excess visceral fat, accumulation of TG, and infiltration of inflammatory cells and fat tissues, leading to increased risk of brain disease[32,33]. Therefore, it is important to find cost-effective, simple, and convenient indexes that can measure subcutaneous and visceral fats for the prevention and control of clustering of cardiometabolic risk factors.
There is a known advantage in adults using the WHtR as a predictor of cardiometabolic risk factors clustering[34]. A previous study conducted in Singapore indicated that a combination of WHtR and BMI could be the best clinical marker in identifying adults with CVD risk factors[19]. Also, a study conducted in Columbia showed that high WHtR was a risk factor for dyslipidemia for children aged 6–10 years[35]. Similar results have also been reported in a study conducted in Chinese children and adolescents aged 6–17 years[36]. A meta-analysis suggests that WHtR has good and robust performance as a screening tool for identifying cardiometabolic risk in children[37].
The HW phenotype has also been used as a convenient tool to screen the population at high risk of cardiometabolic risk factors clustering. A transversal study including 976 middle-aged Brazilian adults reported that the HW phenotype predicted the incidence of cardiometabolic health risk factors[38]. Similarly, a cohort study including 95,015 Asian adults (18–98 years of age) found that the HW phenotype might be a simple and useful clinical tool to screen individuals who are at risk for future cardiometabolic health risk factors[9]. Among children and adolescents, the HW phenotype was also regarded as a significant marker for cardiometabolic health risk factors. A national study of adolescents in Iran showed that the HW phenotype was associated with cardiometabolic risk factors, particularly elevated cholesterol[39]. A cohort study conducted in Brazil indicated that the HW phenotype could be a good predictor for SBP and glycemia in children and adolescents[40]. Additionally, a study conducted among Chinese adolescents indicated that the HW phenotype was a useful marker for screening adolescents who are at high risk of metabolic syndrome[41]. Overall, the HW phenotype is a convenient and useful tool to identify groups with high risks of cardiometabolic risk factors clustering among both in adults and adolescents.
However, the HWHtR phenotype in children and adolescents has received limited attention. A previous study that enrolled 3,136 Han adolescents indicated that compared with the HW phenotype, the HWHtR phenotype is a better marker of atherogenic lipid profile for adolescents[41]. In addition, the results of the study showed that the HWHtR phenotype is a non-age-dependent index (P = 0.042). Therefore, this study supposed that the HWHtR phenotype is much more applicable for screening adolescents with higher cardiometabolic risk. However, whether the HWHtR phenotype applies to other ethnic groups is unclear[41]. In our study, except for LDL showing a stronger correlation with the HWHtR phenotype than the HW phenotype with the adjustment of potential covariates, there was no significant difference between the two phenotypes (HWHtR and HW) in the OR of other risk factors for cardiometabolic health risk factors clustering. In addition, the measurement of WC is more readily available than WHtR[16], and the HW phenotype showed a weaker association with sex than the HWHtR phenotype. Therefore, the HW phenotype may be a better marker than the HWHtR phenotype. Previous studies have indicated that the HW phenotype may be a better marker than WHtR for identifying children and adolescents who are at risk for cardiometabolic disorders[16,40], which is similar to the results of this study.
The majority of adults with high WHR have disproportionate amounts of visceral fat[15]. In a case-control study on acute myocardial infarction, elevated WHR was associated with a higher risk of myocardial infarction[42]. In Europe, it was confirmed that elevated WHR causes higher SBP, higher triglycerides, and two-hour glucose levels[43]. However, a previous study indicated that WHR is more weakly associated with cardiovascular risk factors than HW and HWHtR[19]. Moreover, a large representative observational study in the UK showed that a combination of BMI and the WHR phenotype is more effective in assessing the cardiovascular risk that is associated with obesity[44]. In our study, the WHR phenotype also showed a weak ability to predict cardiometabolic risk factors clustering. The present study did not find an association between the three phenotypes and the risk of hyperglycemia. Hyperglycemia and dyslipidemia are important components of metabolic syndrome and are closely related[45]. A cross-sectional study of a large sample in China (n = 105,922) showed an inverted U-shaped association between the primary glycemic indices and uric acid levels in adults[46]. However, elevated serum uric acid may be associated with the risk of hypertension and dyslipidemia, and the intermediate regulatory mechanism may involve the regulation of FPG[47-50].
Our study has significant strengths. Although it is not the first study to explore indicators for cardiometabolic risk factors clustering among Chinese children and adolescents, the sample size of this study was large and more than 60,000 children and adolescents from different provinces and ethnic groups in China, ranging in age from 6 to 17 years old. A previous study was conducted among Chinese children and adolescents, but only among Han Chinese aged 13 to 17, and the sample size was only approximately 3,000[41]. However, there were some limitations of this study. For example, it was a cross-sectional study, which limited our abilities to infer causality.
-
In conclusion, the HW phenotype is a better simple marker for identifying children and adolescents with cardiometabolic risk factors clustering. Compared with HWHtR and WHR, the HW phenotype is a non-sex-dependent indicator with higher applicability to screen children and adolescents for cardiovascular risk factors.
-
The study protocol was approved by the Medical Ethical Committee of Peking University (Number: IRB0000105213034). Informed consent was obtained from all participants and their parents involved in the study.
-
Variables Total Boy (n = 32,064) Girl (n = 30,104) P N x ± s (%) n x ± s (%) n x ± s (%) Height 62,168 145.86 ± 17.08 32,064 146.93 ± 18.44 30,104 144.72 ± 15.43 < 0.001 Weight 62,168 40.97 ± 15.53 32,064 42.35 ± 16.88 30,104 39.50 ± 13.79 < 0.001 SBP (mmHg) 62,168 104.33 ± 12.17 32,064 105.72 ± 12.5 30,104 102.85 ± 11.62 < 0.001 DBP (mmHg) 62,168 66.27 ± 8.84 32,064 66.8 ± 8.98 30,104 65.71 ± 8.64 < 0.001 TG (mmol/L) 15,995 1.14 ± 0.81 8,147 1.09 ± 0.80 7,848 1.19 ± 0.83 < 0.001 HDL (mmol/L) 15,998 1.89 ± 1.35 8,149 1.90 ± 1.38 7,849 1.88 ± 1.31 0.476 LDL (mmol/L) 15,998 1.97 ± 0.71 8,149 1.94 ± 0.70 7,849 1.99 ± 0.72 < 0.001 TC (mmol/L) 15,998 3.86 ± 0.90 8,149 3.81 ± 0.90 7,849 3.92 ± 0.90 < 0.001 FPG (mmol/L) 15,990 4.14 ± 1.28 8,143 4.19 ± 1.31 7,847 4.09 ± 1.25 < 0.001 Area rural 19,753 37.3 10,158 37.5 9,595 37.1 0.359 urban 33,221 62.7 16,947 62.5 16,274 62.9 Family income < 5,000 16,646 63.6 8,234 63.0 8,412 64.2 0.042 (CNY) ≥ 5,000 9529 36.4 4,838 37.0 4,691 35.8 BP (mmHg) < P90 42,292 74.3 20,716 70.6 21,576 78.2 < 0.001 ≥ P90 14,642 25.7 8,611 29.4 6,031 21.8 FPG (mmol/L) < 6.1 15,945 99.7 8,111 99.6 7,834 99.8 0.007 ≥ 6.1 45 0.3 32 0.4 13 0.2 HDL (mmol/L) ≥ 1.03 13,987 87.4 7,035 86.3 6,952 88.6 < 0.001 < 1.03 2,011 12.6 1,114 13.7 897 11.4 LDL (mmol/L) < 3.37 15,520 97.0 7,928 97.3 7,592 96.7 0.037 ≥ 3.37 478 3.0 221 2.7 257 3.3 TG (mmol/L) < 1.24 11,702 73.2 6,149 75.5 5,553 70.8 < 0.001 ≥ 1.24 4,293 26.8 1,998 24.5 2,295 29.2 TC (mmol/L) < 5.17 15,128 94.6 7,745 95.0 7,383 94.1 < 0.001 ≥ 5.17 870 5.4 404 5.0 466 5.9 Note. BMI, body mass index; WC, waist circumference; SBP, systolic blood pressure; DBP, diastolic blood pressure; BP, blood pressure; FPG, fasting plasma glucose; HDL, high-density lipoprotein; LDL, low-density lipoprotein; TG, triglyceride; TC, total cholesterol; HW, hypertriglyceridemic waist; HWHtR, hypertriglyceridemic waist-to-height ratio; WHR, waist-to-hip ratio; CHRF clustering, cardiometabolic health risk factors clustering. Table S1. General characteristics of the study population by sex
Variables Category non-HWHtR HWHtR P N Freq. (%) N Freq. (%) Sex boy 4,587 50.5 397 61.6 < 0.001 girl 4,492 49.5 247 38.4 Area rural 3,232 41.0 214 36.7 0.041 urban 4,646 59.0 369 63.3 Family income (CNY) < 5,000 2,534 65.4 182 64.3 < 0.001 ≥ 5,000 1,338 34.6 101 35.7 BP (mmHg) < P90 6,654 73.3 289 44.9 < 0.004 ≥ P90 2,425 26.7 355 55.1 FPG (mmol/L) < 6.1 9,051 99.7 639 99.7 0.907 ≥ 6.1 26 0.3 2 0.3 HDL (mmol/L) ≥ 1.03 7,857 86.5 398 61.8 < 0.001 < 1.03 1,222 13.5 246 38.2 LDL (mmol/L) < 3.37 8,883 97.8 586 91.0 < 0.001 ≥ 3.37 196 2.2 58 9.0 TG (mmol/L) < 1.24 6,617 72.9 0 0.0 < 0.001 ≥ 1.24 2,462 27.1 644 100.0 TC (mmol/L) < 5.17 8,700 95.8 567 88.0 < 0.001 ≥ 5.17 379 4.2 77 12.0 CHRF clustering < 2 7,481 82.4 165 25.6 < 0.001 ≥ 2 1,598 17.6 479 74.4 Note. BP, blood pressure; FPG, fasting plasma glucose; HDL, high-density lipoprotein; LDL, low-density lipoprotein; TG, triglyceride; TC, total cholesterol; CHRF clustering, cardiometabolic health risk factors clustering; HWHtR, hypertriglyceridemic waist-to-height ratio. Table S3. Comparisons of cardiometabolic health risk factors between subjects with and without HWHtR phenotype
Models HW HWHtR WHR OR 95% CI P OR 95% CI P OR 95% CI P 6–9 years Model 1 Elevated TG NA NA NA NA NA NA 0.70 0.59–0.82 < 0.001 Low HDL 2.97 2.14–4.14 < 0.001 NA NA NA 1.45 1.18–1.78 < 0.001 Elevated LDL 1.38 0.81–2.34 0.233 NA NA NA 1.94 1.44–2.62 < 0.001 Elevated TC 2.08 1.40–3.07 < 0.001 NA NA NA 1.48 1.17–1.86 0.001 Elevated BP 1.54 1.16–2.04 0.003 NA NA NA 0.97 0.89–1.05 0.428 FPG 3.11 0.28–34.78 0.356 NA NA NA 1.81 0.58–5.65 0.310 CHRF clustering 10.04 7.53–13.38 < 0.001 NA NA NA 1.38 1.15–1.66 0.001 Model 2 Elevated TG NA NA NA NA NA NA 1.10 0.83–1.47 0.508 Low HDL 3.23 1.79–5.85 < 0.001 NA NA NA 1.43 1.00–2.04 0.052 Elevated LDL 1.73 0.70–4.28 0.236 NA NA NA 1.49 0.86–2.57 0.155 Elevated TC 2.88 1.42–5.82 0.003 NA NA NA 1.31 0.87–1.98 0.192 Elevated BP 1.40 0.86–2.28 0.172 NA NA NA 1.17 1.03–1.34 0.017 FPG NA NA NA NA NA NA 0.94 0.10–8.86 0.955 CHRF clustering 11.77 7.13−19.44 < 0.001 NA NA NA 1.33 0.96–1.85 0.091 10–12 years Model 1 Elevated TG NA NA NA NA NA NA 0.63 0.54−0.73 < 0.001 Low HDL 3.11 2.32−4.16 < 0.001 3.28 2.37−4.55 < 0.001 1.17 0.93−1.46 0.174 Elevated LDL 2.83 1.73−4.62 < 0.001 3.82 2.25−6.50 < 0.001 2.07 1.42−3.02 < 0.001 Elevated TC 2.91 1.94−4.38 < 0.001 3.56 2.28−5.56 < 0.001 1.83 1.37−2.44 < 0.001 Elevated BP 1.54 1.20−1.98 0.001 1.51 1.14−2.01 0.004 0.87 0.79−0.94 0.001 FPG 1.10 0.11−11.32 0.937 NA NA NA 1.59 0.51−4.96 0.428 CHRF clustering 13.00 9.81−17.22 < 0.001 12.36 8.98−17.03 < 0.001 0.01 0.68−0.97 0.022 Model 2 Elevated TG NA NA NA NA NA NA 0.81 0.64−1.04 0.104 Low HDL 2.85 1.78−4.57 < 0.001 3.50 2.08−5.88 < 0.001 1.57 1.09−2.26 0.016 Elevated LDL 3.71 1.69−8.18 0.001 5.87 2.45−14.02 < 0.001 1.70 0.89−3.25 0.110 Elevated TC 3.37 1.74−6.52 < 0.001 4.84 2.34−10.01 < 0.001 1.87 1.10−3.18 0.021 Elevated BP 1.59 1.07−2.36 0.022 1.12 0.71−1.76 0.634 0.86 0.75−0.99 0.037 FPG NA NA NA NA NA NA 9.05 0.95−85.90 0.055 CHRF clustering 16.73 10.54−26.55 < 0.001 12.69 7.61−21.16 < 0.001 0.96 0.71−1.29 0.776 13−15 years Model 1 Elevated TG NA NA NA NA NA NA 0.88 0.75−1.03 0.109 Low HDL 2.55 1.92−3.38 < 0.001 2.19 1.55−3.10 < 0.001 1.03 0.85−1.25 0.746 Elevated LDL 1.48 0.73−3.01 0.275 1.95 0.86−4.40 0.109 1.28 0.75−2.18 0.361 Elevated TC 2.64 1.58−4.41 < 0.001 1.57 0.80−3.09 0.195 1.57 1.09−2.26 0.016 Elevated BP 1.30 0.99−1.69 0.057 1.47 1.05−2.05 0.025 0.90 0.83−0.98 0.019 FPG NA NA NA NA NA NA 0.31 0.05−2.04 0.222 CHRF clustering 10.06 7.55−13.39 < 0.001 8.07 5.62−11.58 < 0.001 0.86 0.72−1.03 0.095 Model 2 Elevated TG NA NA NA NA NA NA 1.22 0.94−1.57 0.132 Low HDL 1.72 1.08−2.75 0.023 2.29 1.31−4.01 0.004 1.10 0.80−1.51 0.550 Elevated LDL 2.04 0.66−6.35 0.217 4.14 1.07−16.08 0.040 2.46 0.99−6.07 0.052 Elevated TC 5.64 2.45−12.99 < 0.001 3.01 1.02−8.85 0.045 1.94 1.00−3.77 0.050 Elevated BP 1.06 0.69−1.62 0.789 1.03 0.61−1.77 0.903 0.97 0.84−1.11 0.628 FPG NA NA NA NA NA NA NA NA NA CHRF clustering 9.79 6.21−15.44 < 0.001 8.17 4.60−14.53 < 0.001 1.07 0.80−1.42 0.654 16−17 years Model 1 Elevated TG NA NA NA NA NA NA 0.98 0.77−1.24 0.839 Low HDL 2.57 1.76−3.75 < 0.001 2.52 1.61−3.93 < 0.001 1.22 0.91−1.63 0.184 Elevated LDL 4.50 1.97−10.28 < 0.001 3.83 1.48−9.92 0.006 1.81 0.82−3.97 0.140 Elevated TC 4.26 2.17−8.38 < 0.001 4.01 1.79−9.00 0.001 1.37 0.76−2.44 0.295 Elevated BP 1.20 0.84−1.73 0.322 0.94 0.60−1.45 0.768 0.95 0.83−1.08 0.428 FPG 1.39 0.16−11.81 0.763 1.85 0.19−18.26 0.601 0.59 0.06−5.64 0.644 CHRF clustering 10.02 6.79−14.78 < 0.001 8.77 5.45−14.11 < 0.001 1.23 0.94−1.61 0.124 Model 2 Elevated TG NA NA NA NA NA NA 0.93 0.63−1.38 0.712 Low HDL 2.56 1.36−4.81 0.004 2.48 1.19−5.14 0.012 1.32 0.80−2.16 0.275 Elevated LDL 8.62 2.17−34.23 0.002 20.95 4.12−106.44 < 0.001 0.70 0.19−2.64 0.597 Elevated TC 7.85 2.45−25.12 0.001 12.90 3.26−51.15 < 0.001 0.83 0.29−2.35 0.723 Elevated BP 1.25 0.70−2.23 0.453 1.34 0.67−2.68 0.408 0.96 0.78−1.19 0.694 FPG 2.56 0.11−60.52 0.561 3.24 0.11−96.18 0.497 NA NA NA CHRF clustering 12.22 6.48−23.04 < 0.001 11.23 5.31−23.76 < 0.001 1.15 0.74−1.81 0.533 Note. BP, blood pressure; FPG, fasting plasma glucose; HDL, high−density lipoprotein; LDL, low−density lipoprotein; TG, triglyceride; TC, total cholesterol; CHRF clustering, cardiometabolic health risk factors clustering; HW, hypertriglyceridemic waist; HWHtR, hypertriglyceridemic waist−to−height ratio; WHR, waist−to−hip ratio. Model 1: adjusted for sex (boy or girl) and BMI. Model 2: adjusted for variables from model 1, and additionally adjusted by area and family income. Table S6. OR (95% CI) of cardiometabolic health risk factors for HW, HWHtR and WHR phenotype stratified by age
HTML
Study Population
Anthropometric Measurements and Covariates
Biomedical Assessments
Definitions
Statistical Analysis
CONFLICT OF INTEREST The authors declare that the research was conducted in the absence of any commercial or financial relationships that could be construed as a potential conflict of interest.
&These authors contributed equally to this work.
 23144+Supplementary Materials.pdf
|

|

 Quick Links
 DownLoad: