


-
Drug-induced liver injury (DILI) is induced by various biological agents, Chinese herbal medicine, chemical drugs, dietary supplements, etc. It has high morbidity and mortality and is regard as one of the common adverse drug reactions (ADRs). Because DILI will cause liver damage and endanger people's lives, and make drugs stay in the research and development stage. Therefore, it is a major challenge to public health and drug development[1]. According to rough statistics, the annual incidence rate of DILI is 19.1 per 100000 people every year. Among all patients hospitalized for jaundice, the proportion of DILI is 2%–5%, accounting for 10% of all patients hospitalized for liver disease[2]. In China, about 50.65% of patients with DILI are clinically cured, and 0.39%–1.60% of DILI patients die[3,4]. The occurrence of severe ADRs increases with age[5], and it has been comfirmed that venerable age is the risk factor for DILI[5]. Generally speaking, women have a higher risk to develop severe ADRs, meawhile, women with DILI more easily develop into autoimmune hepatitis (AIH) and primary biliary cholangitis (PBC), while men suffering from DILI more easily develop into hepatocellular carcinoma (HCC) and primary sclerosing cholangitis (PSC)[6].
Presently, the pathogenic mechanism of DILI is complex and has not yet been fully elucidated. The immunological mechanism of DILI involves a variety of specific immune reactions. Kupffer cells as the main members of liver defense system contribute significantly to the induction and development of various liver diseases[7,8]. When it comes into contact with drug particles, it will trigger inflammatory reaction and activate other macrophages, natural killer cells (NK cells), T lymphocytes (T cells), and B lymphocytes (B cells)[7,8]. The main characteristic of DILI caused by most drugs is the activation of adaptive immune response system[9-11]. The cytokines, which are produced by cell damage, necrosis, and apoptosis, can result in the activation of antigen presenting cells and trigger the cellular immune response system; meanwhile, intermediate products of drug metabolism may bind with host proteins as haptens to form new antigens[5]. Immune response is the main characteristic of DILI. Research studies has shown that they can isolate specific T cells from DILI patients’ blood[12-14]. In adaptive immunity, T helper (Th) cells play an important regulatory role. Th cells exert their effects by secreting cytokines which act on immune cells[15]. Th cells can be segmented into multiple subpopulations including T helper 1 (Th1), T helper 2 (Th2), T helper 17 (Th17), Regulatory T cells (Tregs), T helper 22 (Th22), etc[16]. Th1 cells mainly mediate cytotoxicity and local inflammation related immune responses, participate in cellular immunity, and secrete Interferon-γ (IFN-γ), which can enhance the activities of antigen presenting macrophages and promote inflammatory response[16]. Interleukin (IL)-17 produced by Th17 has cytotoxic effects and can cause tissue damage[17]; Tregs contribute to the maintenance of host immune tolerance and the production of Interleukin-10 (IL-10) and transforming growth factor-β (TGF-β) exerting the immunosuppressive effects[17]. In acute liver injury, elevated serum IL-17 levels can be used to estimate the severity of acute hepatic injury. Transduction of Tregs into drug induced liver damage mice induced by concanavalin A can decrease the production of inflammatory cytokines such as TNF-α secreted by T lymphocytes[17]. The interleukin-22 (IL-22) secreted by Th22 cells has a protective effect on organs and tissues from inflammatory damage, and if the level of IL-22 decreases, liver damage will worsen[17]. In addition, in the acetaminophen injury model, interferon gamma (IFN-γ) and TNF-α contribute to the inflammatory injury[18].
The research is aim to analyze cytokine characteristics of patients suffering from DILI caused by different drugs and their correlation with clinical inflammatory indicators, providing a basis for clinical diagnosis and treatment.
-
This study is prospective. The patients included five groups: Chinese herbal medicine group (group A), cardiovascular drugs group (group B), NSAIDs group (group C), anti-infective drugs group (group D), and other drugs group (group E). The inclusion criteria: 1) First visit to our hospital; 2) Having a clear medication history (Chinese herbal medicine, dietary supplements, cardiovascular drugs, anti-infective drugs, anti-tuberculosis drugs, hormone drugs, NSAIDs and others); 3) Patients enrolled into the study were diagnosed with DILI using liver biopsy, and they were clinically diagnosed as DILI patients by RUCAM scoring criteria. The exclusion criteria: 1) Merging with multiple liver diseases, including non-alcoholic fatty liver disease, viral hepatitis, metabolic hepatitis, alcoholic hepatitis, autoimmune hepatitis, and cancer of the liver; 2) Patients is co infected with other viruses which may damage the function of liver, including Cytomegalovirus (CMV), Human Immunodeficiency Virus (AIDS), Epstein Barr Virus (EBV), etc; 3) Mental and psychological disorders. This research was reviewed by Ethics Committee of Beijing Ditan Hospital (Ethics number: 2019-12-01). All patients signed the written informed consents. Meanwhile, the registration of this research was at the clinicaltrials.gov (ID: NCT04302506).
-
Biochemical indicators were detected by the Hitachi 7600 full-automatic biochemical analyzer from Japan. The normal upper limit for detecting ALT and AST is 40 U/L, the normal upper limit for detecting Total bilirubin (TBil) is 18.8 μmol/L, the normal upper limit for detecting Direct bilirubin (DBil) is 6.8 μmol/L, the normal upper limit for detecting glutamyl transferase (GGT) is 60 U/L, the normal upper limit for detecting alkaline phosphatase (ALP) is 125 U/L, and the normal upper limit for detecting albumin (ALB) is 40 g/L.
-
Interferon alpha 2 (IFN-α2), IL-10, IFN-γ, IL-6, interleukin-17A (IL-17A), TNF-α, interleukin-2 (IL-2), and transforming growth factor-β1 (TGF-β1) were quantitatively tested by the Luminex technique. The flexmap 3D analyzer was used to analyze the Data.
-
Statistical data were processed by SPSS 26 (SPSS Inc., Chicago, USA). Chi square test or Fisher’s exact test was used to analyze the comparison of categorical data between groups. Mean ± standard deviation (SD) was used to express the measurement data which were in accord with normal distribution, and the comparison of those data between two groups was presented using independent sample T test. Data which didn’t correspond to Non-normal distribution were presented by median and quartile counts (median, Q1Q3) and the comparison among groups was analysed by Man Whitney U test. Pearson correlation or Spearman correlation was used to analyze the correlations between clinical indicators and cytokine levels. In the statistical analysis of the study, P < 0.05 was regarded as statistical significance.
-
In this study, 73 patients (19 males, 26.03%; 54 females, 73.97%) were enrolled, consisiting of 36 with Chinese herbal medicine (group A), 6 with cardiovascular drugs (group B), 10 with NSAIDs (group C), 7 with anti-infective drugs (group D), and 14 with other drugs (group E). The basic demographic characteristics and clinical parameters (sex, age, ALT level, TBil level, AST level, DBIL level, GGT level, Total bile acids (TBA) level, ALP level and ALB level) of these patients are discribed in Table 1. The age among five groups was statistically different (P = 0.032; H = 10.567), and the age in patients with Chinese herbal medicine (P = 0.032), NSAIDs group (P = 0.002), and anti-infective drug group (P = 0.008) was dramatically lower than that in patients with cardiovascular drug. The ALT levels and AST levels in patients with Chinese herbal medicine (ALT: P = 0.033, Z = −2.130; AST: P = 0.007, Z = −2.663) were markedly lower than those in patients with NSAIDs. The TBiL and DBiL levels in patients with Chinese herbal medicine (TBIL: P = 0.002, Z = −3.131; DBIL: P = 0.001, Z = −3.143) and cardiovascular medicine (TBIL: P = 0.003, Z = −2.820; DBIL: P = 0.005, Z = −2.712) were markedly lower than those in patients with NSAIDs. The ALP and TBA levels in patients with Chinese herbal medicine (ALP: P = 0.005, Z = −2.770; TBA: P = 0.010, Z = −2.539) were markedly lower than those in patients with NSAIDs. There was no significant statistical differences in GGT and ALB among five groups. IL-6 (P < 0.001; H = 23.937) and TNF-α (P < 0.001; H = 24.417) among five groups were statistically different, and the levels of IL-6 and TNF-α in patients with Chinese herbal medicine (IL-6: P < 0.001, Z = −3.937; TNF-α: P < 0.001, Z = −4.407) and cardiovascular medicine (IL-6: P = 0.020, Z = −2.321; TNF-α: P = 0.001, Z = −3.497) were markedly lower than those in patients with NSAIDs.
Cytokines Group A
(n = 36)Group B
(n = 6)Group C
(n = 10)Group D
(n = 7)Group E
(n = 14)P1 (group A vs. group B) P2 (group A vs. group C) P3 (group A vs. group D) P4 (group B vs. group C) P5 (group B vs. group D) P6 (group C vs. group D) P Age (years) 50.00
(38.25, 57.00)61.00
(51.50, 67.50)46.00
(33.50, 54.25)44.00
(20.00, 49.00)39.00
(27.00, 48.00)Z = −2.141;
P = 0.032Z = −0.960;
P = 0.350Z = −2.009;
P = 0.045Z = −2.288;
P = 0.002Z = −2.571;
P = 0.008Z = −0.980;
P = 0.364H = 10.567;
P = 0.032Male (%) 6/36
(16.67)1/6
(16.67)2/10
(20.00)5/7
(71.43)5/14
(35.71)/ χ2 = 1.061;
P = 0.808χ2 = 9.232;
P = 0.000χ2 = 1.027;
P = 0.869χ2 = 3.899;
P = 0.078χ2 = 4.651;
P = 0.031χ2 = 8.980;
P = 0.034ALT
(U/L)277.50
(102.50, 604.00)94.00
(68.18, 585.90)537.50
(373.75, 921.25)453.00
(169.00, 1189.30)173.00
(139.70, 620.00)Z = −0.935;
P = 0.350Z = −2.130;
P = 0.033Z = −0.773;
P = 0.448Z = −1.844;
P = 0.073Z = −1.429;
P = 0.181Z = −0.488;
P = 0.669H = 4.921;
P = 0.296AST
(U/L)182.50
(79.35,327.00)130.35
(49.78, 468.18)592.00
(273.75,1002.00)252.00
(132.00, 312.00)167.00
(80.00,225.00)Z = −0.539;
P = 0.611Z = −2.663;
P = 0.007Z = −0.504;
P=0.636Z = −1.735;
P = 0.093Z = −0.571;
P = 0.628Z = −1.561;
P = 0.133H = 6.076;
P = 0.194TBiL (μmol/L) 19.00
(13.93,54.25)23.00
(8.48,31.78)96.00
(42.25,207.00)29.00
(25.30,63.00)18.00
(11.00,62.00)Z = −0.611;
P = 0.562Z = −3.131;
P = 0.002Z = −1.48;
P = 0.146Z = −2.820;
P = 0.003Z = −1.574;
P = 0.138Z = −1.465;
P = 0.161H = 107.616;
P = 0.001DBiL (μmol/L) 8.85
(5.08, 40.25)11.45
(2.63, 20.25)66
(25.25, 138.00)16.40
(12.00,43.00)5.10
(3.60, 48.00)Z = −0.413;
P = 0.687Z = −3.143;
P = 0.001Z = −1.629;
P = 0.104Z = −2.712;
P = 0.005Z = −1.429;
P = 0.181Z = −1.466;
P = 0.161H = 11.017;
P = 0.026GGT (U/L) 113.25
(58.60, 274.75)214.00
(157.25, 540.48)170.00
(104.50, 230.25)178.00
(147.00, 212.00)141.00
(93.00,271.00)Z = −1.833;
P = 0.069Z = −0.812;
P = 0.423Z = −1.119;
P = 0.277Z = −1.193;
P = 0.263Z = −1.143;
P = 0.295Z = −0.293;
P = 0.813H = 4.223;
P = 0.377ALP
(U/L)103.00
(85.00, 162.00)158.00
(101.03,282.63)171.00
(136.75,205.50)173.00
(88.80, 953.00)127.00
(94.40,196.00)Z = −1.474;
P = 0.149Z = −2.770;
P = 0.005Z = −1.513;
P = 0.137Z = −0.108;
P = 0.958Z = −0.143;
P = 0.945Z = −0.098;
P = 0.962H = 9.249;
P = 0.055TBA
(umol/L)16.00
(7.10,75.80)35.10
(10.33, 139.00)165.00
(19.75, 204.50)109.60
(8.00,202.00)16.00
(6.80,66.00)Z = −0.719;
P = 0.482Z = −2.539;
P = 0.010Z = −0.911;
P = 0.370Z = −1.519;
P = 0.147Z = −0.571;
P = 0.628Z = −0.781;
P = 0.475H = 6.694;
P = 0.153ALB
(g/L)38.00
(35.05, 41.65)36.00
(33.98, 40.73)36.50
(30.20,40.00)40.00
(38.00, 45.30)39.00
(38.00,44.00)Z = −0.612;
P = 0.562Z = −1.242;
P = 0.219Z = −1.238;
P = 0.223Z = −0.489;
P = 0.635Z = −1.363;
P = 0.181Z = −1.625;
P = 0.109H = 7.516;
P = 0.111IFN-α2 (pg/mL) 85.20
(64.27, 169.06)26.76
(13.49, 89.13)76.08
(32.13, 133.99)59.16
(48.38, 119.63)65.75
(23.09, 125.92)Z = 1.993;
P = 0.053Z = 0.862;
P = 0.394Z = 1.015;
P = 0.316Z = −1.309;
P = 0.212Z = −1.134;
P = 0.281Z = 0.250;
P = 0.806H = 6.919;
P = 0.140IFN-γ (pg/mL) 12.96
(8.15, 35.72)4.74
(3.10, 13.71)12.59
(6.71, 20.70)11.90
(8.15, 27.13)9.86
(5.64, 23.93)Z = 1.576;
P = 0.123Z = 0.928;
P = 0.358Z = 0.959;
P = 0.343Z = −1.246;
P = 0.233Z = −1.356;
P = 0.202Z = 0.227;
P = 0.823H = 5.719;
P = 0.221IL-10 (pg/mL) 19.57
(5.56, 46.05)1.86
(1.10, 11.50)11.27
(3.50, 34.59)25.80
(4.94, 34.02)7.16
(1.97, 21.56)Z = 0.728;
P = 0.471Z = 0.747;
P = 0.459Z = 0.522;
P = 0.604Z = −1.700;
P = 0.111Z = −1.770;
P = 0.104Z = −0.730;
P = 0.476H = 11.340;
P = 0.023IL-17A (pg/mL) 8.15
(4.12, 19.58)2.83
(1.55, 9.87)6.49
(3.11, 14.05)9.17
(4.27, 12,94)6.19
(2.56, 12.88)Z = 1.526;
P = 0.135Z = 0.952;
P = 0.346Z = 0.791;
P = 0.433Z = −0.896;
P = 0.386Z = −1.044;
P = 0.319Z = −0.043;
P = 0.966H = 5.400;
P = 0.249IL-2 (pg/mL) 1.74
(1.45, 2.80)0.96
(0.81, 1.72)1.84
(1.21, 2.36)1.49
(1.33, 2.00)1.46
(1.15, 2.43)Z = 2.004;
P = 0.052Z = −0.402;
P = 0.690Z = 0.827;
P = 0.413Z = −1.488;
P = 0.159Z = −1.446;
P = 0.176Z = 0.765;
P = 0.456H = 6.531;
P = 0.163IL-6 (pg/mL) 0.34
(0.21, 0.53)0.45
(0.21, 1.09)1.56
(1.02, 2.45)0.33
(0.15, 0.45)0.14
(0.12, 0.38)Z = −0.474;
P = 0.636Z = −3.973;
P = 0.000Z = −0.458;
P = 0.647Z = −2.321;
P = 0.020Z = −0.715;
P = 0.474Z = 3.239;
P = 0.001H = 23.937;
P = 0.000TNF-α (pg/mL) 30.58
(20.07, 42.66)23.35
(16.20, 46.01)93.06
(78.01, 100.32)23.93
(19.45, 33.29)25.64
(20.06, 44.86)Z = 0.523;
P = 0.601Z = −4.407;
P = 0.000Z = 0.770;
P = 0.441Z = −3.497;
P = 0.001Z = −0.157;
P = 0.875Z = 3.845;
P = 0.000H = 24.417;
P = 0.000TGF-β1 (pg/mL) 7230.50
(3774.25,
24424.75)4568.00
(1973.50,
8217.750)6978.50
(3209.50,
18378.25)8881.00
(2036.00,
16644.00)6198.50
(2571.00,
20192.00)Z = 1.380;
P = 0.175Z = 0.653;
P = 0.517Z = 0.630;
P = 0.532Z = −1.303;
P = 0.214Z = −1.270;
P = 0.230Z = 0.095;
P = 0.925H = 2.344;
P = 0.673Note. Data with non-normal distribution is described by median and quartile counts (meadian, Q1, Q3); group A: chinese herbal medicine group; group B: cardiovascular drugs group; group C: NSAIDs group; group D: anti infective drugs group; and group E: other drugs group. P1: The contrast between group A and group B; P2: The contrast between group A and group C; P3: The contrast between group A and group D; P4: The contrast between group B and group C; P5: The contrast between group B and group D; P6: The contrast between group C and group D; P: Comparison among five groups. P < 0.05 was regarded as statistical significance. NSAIDs: non-steroidal anti-inflammatory drugs; ALT: Alanine aminotransferase, AST: aspartate aminotransferase, TBIL: Total bilirubin, DBIL: Direct bilirubin, GGT: glutamine transferase, ALP: alkaline phosphatase, TBA: Total bile acid, ALB: albumin, IFN-α2: interferon-alpha2, IFN-γ: interferon-gamma, IL-10: Interleukin-10, IL-17A: Interleukin-17A, IL-2: Interleukin-2, IL-6: Interleukin-6, TNF-α: tumor necrosis factor alpha, TGF-β1: transforming growth factor-beta1. Table 1. Comparison of cytokine levels and clinical indicators among five groups
-
The Correlation of Clinical Indicators and Cytokine Levels In Chinese Herbal Medicine Group In patients treated with Chinese herbal medicine, data showed that TBIL was positively correlated with IL-17A (r = 0.355, P = 0.034), but our results indicated that there were no significant correlations between other cytokines and clinincal indexes in Table 2.
Cytokines ALT (U/L) AST (U/L) TBiL (μmol/L) DBiL (μmol/L) GGT (U/L) ALP (U/L) TBA (μmol/L) ALB (g/L) IFN-α2 (pg/mL) r = 0.070;
P = 0.549r = 0.013;
P = 0.913r = −0.169;
P = 0.152r = −0.139;
P = 0.236r = 0.081;
P = 0.487r = 0.005;
P = 0.967r = −0.038;
P = 0.744r = −0.161;
P = 0.176IFN-γ (pg/mL) r = −0.062;
P = 0.595r = -0.053;
P = 0.653r = −0.197;
P = 0.096r = −0.119;
P = 0.313r = 0.058;
P = 0.623r = −0.029;
P = 0.806r = −0.021;
P = 0.859r = −0.046;
P = 0.702IL-10 (pg/mL) r = −0.139;
P = 0.236r = −0.065;
P = 0.576r = −0.199;
P = 0.091r = −0.105;
P = 0.368r = −0.006;
P = 0.957r = −0.013;
P = 0.913r = −0.014;
P = 0.902r = −0.075;
P = 0.529IL-17A (pg/mL) r = 0.133;
P = 0.257r = −0.111;
P = 0.346r = 0.355;
P = 0.034*r = −0.203;
P = 0.086r = 0.058;
P = 0.623r = −0.045;
P = 0.702r = −0.014;
P = 0.902r = −0.085;
P = 0.474IL-2 (pg/mL) r = −0.099;
P = 0.398r = −0.131;
P = 0.264r = −0.208;
P = 0.078r = −0.187;
P = 0.111r = −0.024;
P = 0.838r = −0.059;
P = 0.614r = −0.042;
P = 0.723r = −0.023;
P = 0.848IL-6 (pg/mL) r = −0.014;
P = 0.902r = 0.075;
P = 0.522r = −0.083;
P = 0.478r = 0.006;
P = 0.957r = 0.096;
P = 0.414r = 0.038;
P = 0.744r = 0.104;
P = 0.376r = 0.020;
P = 0.870TNF-α2 (pg/mL) r = 0.026;
P = 0.827r = 0.051;
P = 0.663r = −0.155;
P = 0.190r = −0.130;
P = 0.269r = 0.014;
P = 0.902r = 0.046;
P = 0.692r = −0.013;
P = 0.913r = −0.085;
P = 0.477TGF-β1 (pg/mL) r = −0.107;
P = 0.361r = −0.094;
P = 0.421r = −0.039;
P = 0.743r = −0.006;
P = 0.957r = 0.083;
P = 0.479r = 0.131;
P = 0.264r = 0.080;
P = 0.496r = −0.229;
P = 0.054Note. ALT: Alanine aminotransferase, AST: aspartate aminotransferase, TBiL: Total bilirubin, DBiL: Direct bilirubin, GGT: glutamine transferase, ALP: alkaline phosphatase, TBA: Total bile acid, ALB: albumin, IFN-α2: interferon-alpha2, IFN-γ: interferon-gamma, IL-10: Interleukin-10, IL-17A: Interleukin-17A, IL-2: Interleukin-2, IL-6: Interleukin-6, TNF-α: tumor necrosis factor alpha, TGF-β1: transforming growth factor-beta1. *: P < 0.05. Table 2. The correlation between clinical indicators and cytokines in chinese herbal medicine group
The Correlation of Clinical Indicators and Cytokine Levels In Cardiovascular Medicine Group In patients with cardiovascular medicine, our results indicated that there were no significant correlations between other cytokines and clinincal indexes in Table 3.
Cytokines ALT (U/L) AST (U/L) TBiL (μmol/L) DBiL (μmol/L) GGT (U/L) ALP (U/L) TBA (μmol/L) ALB (g/L) IFN-α2 (pg/mL) r = −0.086;
P = 0.872r = −0.029;
P = 0.957r = 0.600;
P = 0.208r = 0.468;
P = 0.329r = −0.314;
P = 0.544r = 0.486;
P = 0.329r = 0.829;
P = 0.051r = −0.429;
P = 0.397IFN-γ (pg/mL) r = −0.371;
P = 0.468r = −0.543;
P = 0.266r = 0.314;
P = 0.544r = 0.086;
P = 0.872r = −0.257;
P = 0.623r = 0.086;
P = 0.872r = 0.314;
P = 0.544r = −0.029;
P = 0.957IL-10 (pg/mL) r = −0.543;
P = 0.266r = −0.371;
P = 0.468r = 0.486;
P = 0.329r = 0.257;
P = 0.623r = 0.257;
P = 0.623r = 0.600;
P = 0.208r = 0.486;
P = 0.329r = 0.143;
P = 0.787IL-17A (pg/mL) r = −0.058;
P = 0.913r = −0.116;
P = 0.827r = 0.638;
P = 0.173r = 0.493;
P = 0.321r = −0.377;
P = 0.461r = 0.232;
P = 0.658r = 0.725;
P = 0.103r = −0.464;
P = 0.354IL-2 (pg/mL) r = −0.486;
P = 0.329r = −0.600;
P = 0.208r = −0.086;
P = 0.872r = −0.257;
P = 0.623r = −0.429;
P = 0.397r = 0.486;
P = 0.329r = 0.371;
P = 0.468r = 0.143;
P = 0.787IL-6 (pg/mL) r = −0.828;
P = 0.054r = −0.812;
P = 0.051r = −0.406;
P = 0.425r = −0.638;
P = 0.173r = 0.754;
P = 0.084r = 0.493;
P = 0.321r = −0.580;
P = 0.228r = 0.828;
P = 0.054TNF-α2 (pg/mL) r = −0.657;
P = 0.156r = −0.429;
P = 0.397r = 0.314;
P = 0.544r = 0.086;
P = 0.872r = 0.486;
P = 0.329r = 0.714;
P = 0.111r = 0.257;
P = 0.623r = 0.314;
P = 0.544TGF-β1 (pg/mL) r = −0.714;
P = 0.111r = −0.600;
P = 0.208r = 0.371;
P = 0.468r = 0.086;
P = 0.872r = 0.371;
P = 0.468r = 0.486;
P = 0.329r = 0.257;
P = 0.623r = 0.371;
P = 0.468Note. ALT: Alanine aminotransferase, AST: aspartate aminotransferase, TBiL: Total bilirubin, DBiL: Direct bilirubin, GGT: glutamine transferase, ALP: alkaline phosphatase, TBA: Total bile acid, ALB: albumin, IFN-α2: interferon-alpha2, IFN-γ: interferon-gamma, IL-10: Interleukin-10, IL-17A: Interleukin-17A, IL-2: Interleukin-2, IL-6: Interleukin-6, TNF-α: tumor necrosis factor alpha, TGF-β1: transforming growth factor-beta1. NSAIDs: non-steroidal anti-inflammatory drugs. Table 3. The correlation between clinical indicators and cytokines in cardiovascular drugs group
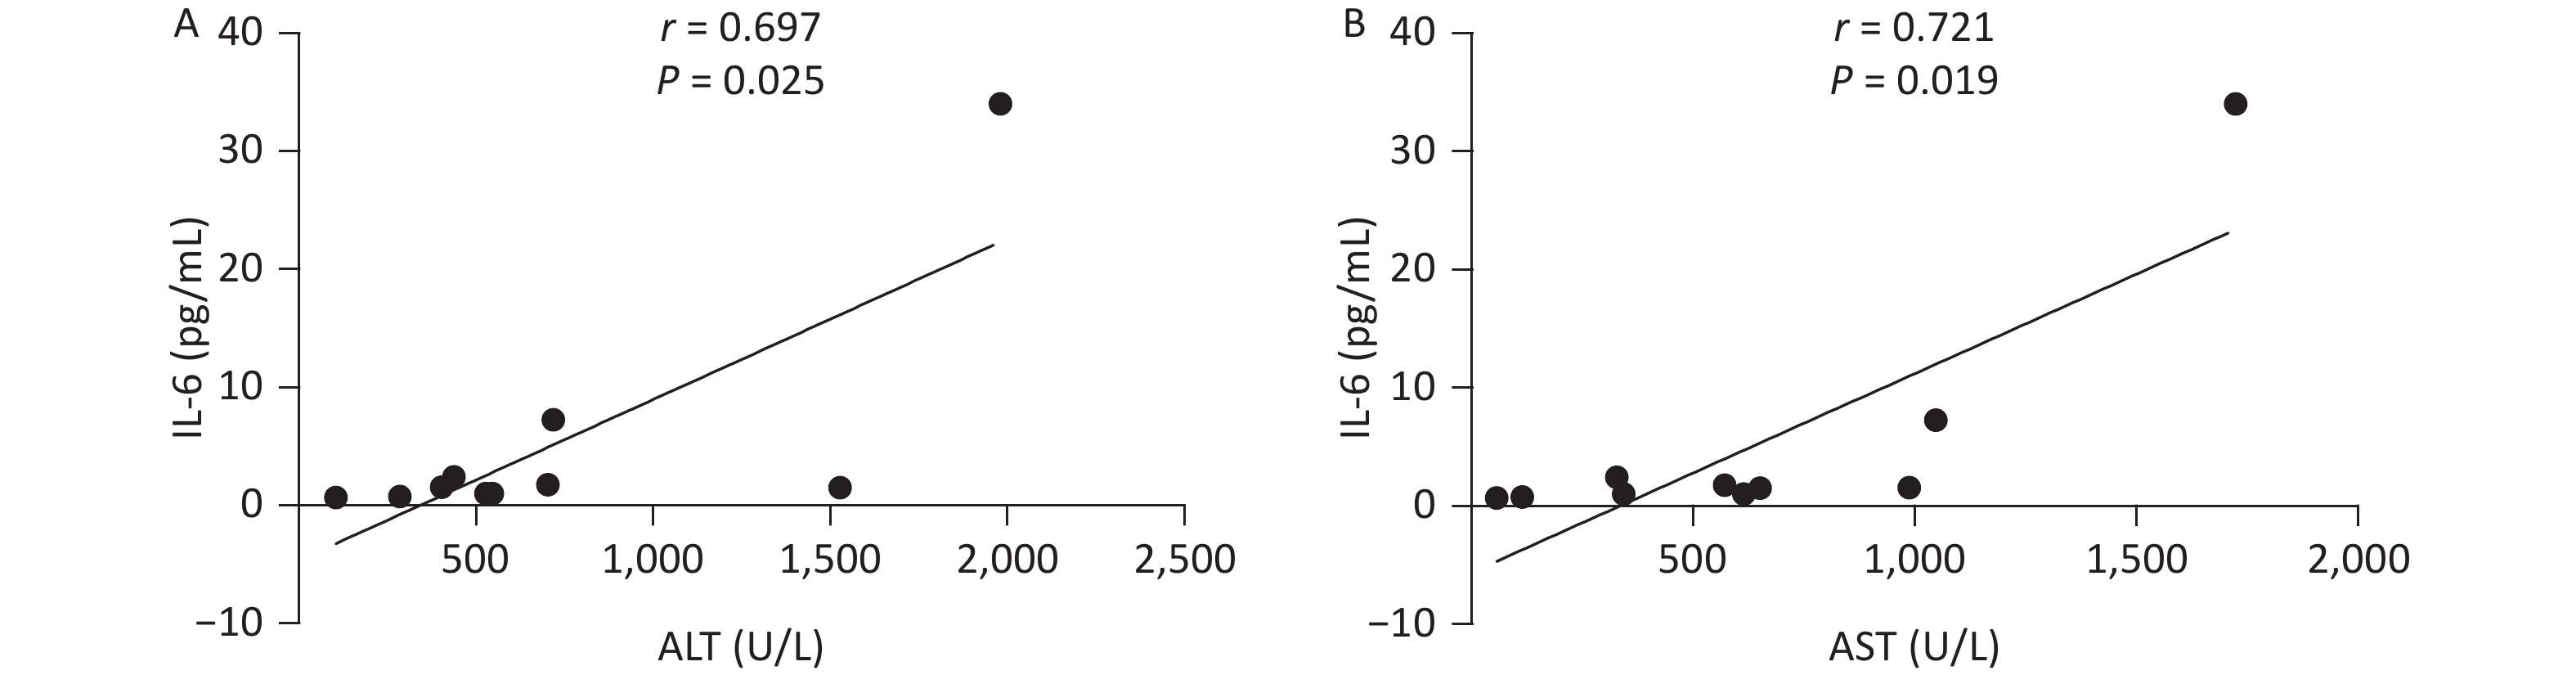
The Correlation of Clinical Indicators and Cytokine Levels In NSAIDs Group In patients with NSAIDs, IL-6 level and ALT level presented a positive correlation (r = 0.697, P = 0.025), meanwhile, IL-6 was positively correlated to AST (r = 0.721, P = 0.019) in Figure 1. However, our results indicated that there were no significant correlations between other cytokines and clinical indexes.

Figure 1. The correlation between clinical indicators and cytokines in NSAIDs group. NSAIDs, non-steroidal anti-inflammatory drugs; ALT, Alanine aminotransferase, AST, aspartate aminotransferase; IL-6, Interleukin-6
The Correlation Of Cytokine Levels And Clinical Indicators In Anti-infective Drugs Group And Other Drugs Group In patients who received anti-infective drugs or other drugs, we didn’t find that cytokines were correlated with clinical indexes in Table 4 and Table 5.
Cytokines ALT (U/L) AST (U/L) TBiL (μmol/L) DBiL (μmol/L) GGT (U/L) ALP (U/L) TBA (μmol/L) ALB (g/L) IFN-α2 (pg/mL) r = −0.036;
P = 0.939r = −0.143;
P = 0.760r = −0.694;
P = 0.115r = −0.714;
P = 0.071r = −0.464;
P = 0.294r = −0.821;
P = 0.021r = −0.571;
P = 0.180r = 0.805;
P = 0.051IFN-γ (pg/mL) r = −0.396;
P = 0.379r = −0.378;
P = 0.403r = 0.173;
P = 0.711r = 0.108;
P = 0.818r = −0.270;
P = 0.558r = −0.523;
P = 0.229r = 0.162;
P = 0.728r = 0.569;
P = 0.183IL-10 (pg/mL) r = −0.143;
P = 0.760r = 0.179;
P = 0.702r = 0.613;
P = 0.144r = 0.536;
P = 0.215r = −0.214;
P = 0.645r = −0.071;
P = 0.879r = 0.500;
P = 0.253r = 0.018;
P = 0.969IL-17A (pg/mL) r = −0.468;
P = 0.289r = −0.342;
P = −0.452r = 0.218;
P = 0.487r = 0.180;
P = 0.699r = −0.162;
P = 0.728r = −0.414;
P = 0.355r = 0.198;
P = 0.670r = 0.440;
P = 0.323IL-2 (pg/mL) r = −0.750;
P = 0.052r = −0.750;
P = 0.052r = 0.180;
P = 0.699r = 0.001;
P = 0.999r = −0.286;
P = 0.535r = −0.571;
P = 0.180r = −0.107;
P = 0.819r = 0.582;
P = 0.170IL-6 (pg/mL) r = −0.714;
P = 0.071r = −0.393;
P = 0.383r = 0.342;
P = 0.452r = 0.979;
P = 0.702r = −0.286;
P = 0.535r = −0.321;
P = 0.482r = −0.214;
P = 0.645r = 0.200;
P = 0.667TNF-α2 (pg/mL) r = 0.464;
P = 0.294r = 0.429;
P = 0.337r = −0.505;
P = 0.248r = −0.357;
P = 0.432r = −0.750;
P = 0.052r = −0.643;
P = 0.119r = −0.214;
P = 0.645r = 0.618;
P = 0.139TGF-β1 (pg/mL) r = −0.214;
P = 0.645r = −0.179;
P = 0.702r = 0.198;
P = 0.670r = 0.429;
P = 0.337r = −0.321;
P = 0.482r = −0.321;
P = 0.482r = 0.286;
P = 0.535r = 0.327;
P = 0.474Note. ALT: Alanine aminotransferase, AST: aspartate aminotransferase, TBiL: Total bilirubin, DBiL: Direct bilirubin, GGT: glutamine transferase, ALP: alkaline phosphatase, TBA: Total bile acid, ALB: albumin, IFN-α2: interferon-alpha2, IFN-γ: interferon-gamma, IL-10: Interleukin-10, IL-17A: Interleukin-17A, IL-2: Interleukin-2, IL-6: Interleukin-6, TNF-α: tumor necrosis factor alpha, TGF-β1: transforming growth factor-beta1. Table 4. The correlation between clinical indicators and cytokines in anti infective drugs group
cytokines ALT (U/L) AST (U/L) TBiL (μmol/L) DBiL (μmol/L) GGT (U/L) ALP (U/L) TBA (μmol/L) ALB (g/L) IFN-α2 (pg/mL) r = 0.092;
P = 0.753r = 0.297;
P = 0.303r = 0.297;
P = 0.302r = 0.414;
P = 0.142r = −0.077;
P = 0.794r = 0.051;
P = 0.864r = 0.566;
P = 0.055r = −0.067;
P = 0.821IFN-γ (pg/mL) r = −0.004;
P = 0.988r = 0.106;
P = 0.719r = 0.252;
P = 0.384r = 0.363;
P = 0.202r = 0.079;
P = 0.788r = 0.264;
P = 0.361r = 0.435;
P = 0.120r = −0.154;
P = 0.600IL-10 (pg/mL) r = 0.301;
P = 0.295r = 0.424;
P = 0.131r = 0.436;
P = 0.119r = 0.541;
P = 0.056r = −0.103;
P = 0.725r = −0.015;
P = 0.958r = 0.641;
P = 0.054r = −0.202;
P = 0.488IL-17A (pg/mL) r = 0.051;
P = 0.864r = 0.112;
P = 0.703r = 0.163;
P = 0.578r = 0.191;
P = 0.512r = −0.029;
P = 0.923r = 0.029;
P = 0.923r = 0.330;
P = 0.249r = −0.269;
P = 0.353IL-2 (pg/mL) r = −0.110;
P = 0.708r = −0.121;
P = 0.680r = 0.242;
P = 0.404r = 0.209;
P = 0.473r = −0.046;
P = 0.875r = 0.119;
P = 0.686r = 0.222;
P = 0.446r = 0.133;
P = 0.649IL-6 (pg/mL) r = 0.084;
P = 0.775r = 0.190;
P = 0.515r = 0.425;
P = 0.130r = 0.449;
P = 0.107r = −0.113;
P = 0.701r = 0.080;
P = 0.787r = 0.390;
P = 0.168r = −0.345;
P = 0.227TNF-α2 (pg/mL) r = 0.211;
P = 0.469r = 0.222;
P = 0.446r = 0.299;
P = 0.299r = 0.352;
P = 0.217r = −0.182;
P = 0.533r = −0.270;
P = 0.350r = 0.355;
P = 0.242r = −0.171;
P = 0.559TGF-β1 (pg/mL) r = 0.272;
P = 0.347r = 0.286;
P = 0.322r = −0.226;
P = 0.438r = −0.058;
P = 0.843r = 0.224;
P = 0.441r = −0.211;
P = 0.469r = 0.053;
P = 0.857r = 0.071;
P = 0.809Note. ALT: Alanine aminotransferase, AST: aspartate aminotransferase, TBiL: Total bilirubin, DBiL: Direct bilirubin, GGT: glutamine transferase, ALP: alkaline phosphatase, TBA: Total bile acid, ALB: albumin, IFN-α2: interferon-alpha2, IFN-γ: interferon-gamma, IL-10: Interleukin-10, IL-17A: Interleukin-17A, IL-2: Interleukin-2, IL-6: Interleukin-6, TNF-α: tumor necrosis factor alpha, TGF-β1: transforming growth factor-beta1. Table 5. The correlation between clinical indicators and cytokines in other drugs group
-
DILI is the hepatitis caused by liver tissue damage which caused by drugs or their metabolites. The incidence rate of this disease has gradually increased in recent years, which has caused great social harm. Early diagnosis, timely screening of chronic DILI patients, and standardized treatment are particularly important. The incidence of severe ADRs increases with age[5], and advanced age is identified as the risk factor for patients with DILI, which is consistent with our data. Meanwhile, our research suggested that ALT, AST, TBIL, DBIL, ALP, and TBA levels in patients with NSAIDs were markedly higher than those in patients with Chinese herbal medicine, cardiovascular drugs and other drugs, which indicated that NSAIDs might lead to more severe liver damage.
Currently, the pathogenesis of DILI remains unclear. The inflammatory response is mainly an integration of the activation of immune response and a range of relevant cellular and molecular events, meanwhile, the interaction between inflammation and drug exposure is one of the crucial hypotheses in the pathogenesis of DILI. Exogenous inflammatory response is the susceptibility element to DILI and the crucial element in promoting the occurrence and development of DILI[19]; Drugs or their metabolites can also touch off an inflammatory response in the liver, which may promote the progression of DILI[19-21]. Immune response is the main characteristic of DILI. Multiple immune cells and cytokines participate in the pathogenic mechanism of DILI. The main characteristic of DILI caused by most drugs is the activation of adaptive immune response system[9-11]. The cytokines, which are produced by cell damage, necrosis, and apoptosis, can result in the activation of antigen presenting cells and tragger the cellular immune response system. Some pro-inflammatory factors, consisting of the pleiotropic tumor necrosis factor-alpha (TNF-α) and IL-6, are the capital participants of the acute phase response[22,23]. They actively pitch in the process of cell damage. The production of TNF-α is derived from a series of cell types such as T lymphocytes, Kupffer cells, NK cells, and other hepatic cell types[24]. TNF-α may contribute to regulating the inflammatory response and inducing host defense against microbial pathogens. Our data indicated that TNF-α levels were significantly different among the five groups, and the levels of TNF-α in patients with Chinese herbal medicine and patients with cardiovascular medicine were markedly lower than those in patients with NSAIDs, which indicate that TNF-α plays a crucial role in inflammatory effects caused by NSAIDs.
IL-6 is similar to TNF-α. The imbalance of IL-6 signal has been believed to be related to chronic inflammatory reaction, infectious diseases and even cancer, in which it is usually identified as the diadynamic criteria and predictive factor of the activity of disease and treatment responses[25,26]. IL-6 is identified as a crucial cytokine connecting inflammation with cancer[27]. The activation of circulating monocytes derived from bone marrow may induce the overexpression of IL-6 which may touch off the uncontrolled cytokine storm[28]. Studies have shown that in toxic liver damage models of monkey and mouse, if the monocytes activation and IL-6 secretion are suppressed, then liver damage can be effectively controlled[29,30]. Our results presented that there were significant statistical differences among five groups of IL-6, and IL-6 levels in patients with Chinese herbal medicine and patients with cardiovascular medicine were markedly lower than those in patients with NSAIDs; meanwhile, our data suggested that ALT and AST levels was positively correlated to the levels of IL-6 in patients with NSAIDs, which may demonstrate that IL-6 may partake the inflammatory process of DILI and increased IL-6 exacerbates the inflammatory response in patients with NSAIDs.
In summary, remarkable differences in ALT, AST, TBIL, DBIL, GGT and TBA levels were showed in our research, meanwhile, some cytokines also exhibit significant differences in people received different drugs. Older age may be more prone to DILI. Patients treated with NSAIDs have more severe liver damage in early stages of DILI, with more significant increases in levels of ALT, AST, TBIL, and DBIL. IL-6 and TNF-α may partake the inflammatory process of DILI, which can lay the foundation for the onset and treatment of DILI.
There are still some shortcomings in this research. The sample size of our research is relatively small and the number of cases in the prospective validation of the study is insufficient, which may cause some deviation in the results. Further validation can be carried out by expanding the sample size in the future. At present, the pathogenesis of DILI mainly involves genetics and immune mechanisms. Due to the epidemic and the testing reagents cannot be imported, our study has only collected baseline plasma from 73 patients, and immune cell function and cytokine testing cannot be conducted, and immune cells and their functional molecules have not been studied. Therefore, we cannot clarify the correlation between immune cell function and changes in treatment and the onset and progression of DILI, further research will be conducted in the future.
Association of Cytokines with Clinical Indicators in Patients with Drug-Induced Liver Injury
doi: 10.3967/bes2024.054
Funds:
This research was funded by The National Key Research and Development Program (2022YFC2603500, 2022YFC2603505); Beijing Municipal Health Commission high-level public health technical personnel construction project, discipline leader -03-26; Beijing Hospitals Authority Clinical medicine Development of special funding support (XMLX 202127); The Digestive Medical Coordinated Development Center of Beijing Hospitals Authority (XXZ0302); The capital health research and development of special (2022-1-2172).
- Received Date: 2023-11-08
- Accepted Date: 2024-03-05
-
Key words:
- Drug-induced liver injury /
- Cytokines /
- Non-steroidal anti-inflammatory drugs /
- Inflammation
Abstract:
All authors declare that there is no potential commercial and financial interest in this research.
&These authors contributed equally to this work.
| Citation: | CAO Wei Hua, JIANG Ting Ting, SHEN Ge, DENG Wen, WANG Shi Yu, ZHANG Zi Yu, LI Xin Xin, LU Yao, ZHANG Lu, LIU Ru Yu, CHANG Min, WU Shu Ling, GAO Yuan Jiao, HAO Hong Xiao, CHEN Xiao Xue, HU Lei Ping, XU Meng Jiao, YI Wei, XIE Yao, LI Ming Hui. Association of Cytokines with Clinical Indicators in Patients with Drug-Induced Liver Injury[J]. Biomedical and Environmental Sciences, 2024, 37(5): 494-502. doi: 10.3967/bes2024.054

|

 Quick Links
 DownLoad: