


-
The coronavirus disease 2019 (COVID-19) outbreak in late 2019 significantly impacted global health. The virus’s rapid spread, with its long incubation period and high infection level, caused substantial disruption to regular social frameworks, production, and lifestyles[1]. COVID-19 is primarily transmitted through close contact, long-range contaminants, and airborne routes. The emergence of new variants, such as the Omicron variant, has made the epidemic more serious, raising concerns about the effectiveness of existing prevention measures[2].
Laboratory studies and epidemiological research pointed out the sensitivity of SARS-CoV-2's stability to various environmental conditions, including humidity and temperature. One laboratory study demonstrated that SARS-CoV-2 decay became significantly faster as temperature increased for all humidity, with the virus's decay at 27 °C being approximately five to ten times faster than that at 10 °C. Across all temperatures, virus decay was relatively rapid at 65% relative humidity and tended to be slower at lower (40%) or higher (85%) humidity[3]. Epidemiological research reported a significant negative correlation between ambient temperature and diurnal temperature range (DTR) with COVID-19, with relative risks of 0.80 (95% CI: 0.75, 0.85) and 0.90 (95% CI: 0.86, 0.95), respectively[4]. Furthermore, a multi-country study revealed that high relative humidity would promote COVID-19 transmission when the temperature was low, but it would be detrimental to the transmission when the temperature was high[5].
This study seeks to investigate the non-linear lag relationship between meteorological elements and the risk of COVID-19 during three pandemics in Lanzhou. This analysis will adequately evaluate the risk and severity of COVID-19 transmission within specific environmental conditions, facilitating informed decision-making and developing targeted disease prevention and control strategies.
As the capital city of Gansu Province in northwestern China, Lanzhou has a resident population of 4.3 million people and exhibits significant arid and semi-arid climatic characteristics. Lanzhou experienced three COVID-19 pandemics from Oct 2021, Mar 2022, and Jul 2022. The three COVID-19 pandemics in Lanzhou occurred within one year (Oct 2021 to Jul 2022), with unchanged social elements such as population density, age structure, and road traffic. Forming control groups for each outbreak would better understand the association between meteorological elements and the spread of COVID-19.
The Health Commission of Gansu Province provided the daily numbers of confirmed and asymptomatic cases during three COVID-19 pandemics (http://wsjk.gansu.gov.cn/, accessed on Sep. 1, 2022). The Health Commission of Gansu Province performed data quality control, ensuring the data source's credibility. The meteorological data (daily average temperature, daily maximum temperature, daily minimum temperature, and daily average humidity) were obtained from the Lanzhou Meteorological Bureau. These data were collected from the national-level surface meteorological stations in Lanzhou, ensuring their high quality and reliability.
The formula for Diurnal temperature range (DTR) is as follows:
$$ \mathrm{D}{\mathrm{T}\mathrm{R}=\mathrm{T}}_{\mathrm{m}\mathrm{a}\mathrm{x}}-{\mathrm{T}}_{\mathrm{m}\mathrm{i}\mathrm{n}} $$ (1) Tmax is the daily maximum temperature, and Tmin is the daily minimum temperature.
The generalized additive model (GAM) is a widely accepted method to model the smoothing relationship between response and predictor variables. As a semiparametric model, GAM provides a more accurate nonparametric fit to the actual association between meteorological elements and COVID-19 risks compared with the parametric model. The basic model formula of the GAM is as follows:
$$ \mathrm{Log}({E}{({Y}}_{{t}}\left)\right)=\alpha +\beta {{X}}_{\text{t}}+s\left(time,df\right) $$ (2) $ {E(}{{Y}}_{{t}}{)} $ is the predictive number of daily confirmed COVID-19 cases on day t followed by Quasi Poisson distribution; α is the intercept; β represents the regression coefficient; $ {{X}}_{{t}} $ indicates the daily level of studied meteorological elements on day t. The exposure-response curve could be obtained by replacing $ {{X}}_{{t}} $ with $ s\left({X}_{t},df\right) $. The time trend was modeled using a smoother denoted by $ s\left(time,df\right) $; The degrees of freedom are selected as shown in Supplementary Table S1 (available in www.besjournal.com). GAM has the function of automatically selecting the degrees of freedom to balance the flexibility of the model and the risk of overfitting, and the degrees of freedom that are not directly written in Supplementary Figure S1 (available in www.besjournal.com) are all automatically selected by the GAM model, it is suitable for effective model fitting in the case of a small amount of data.
Time Exposure-response relationship Model parameters P value Oct. 18 to Nov. 8, 2021 Temperature and COVID-19 risk s (time) 0.0109* s (temperature) 0.0352* Humidity and COVID-19 risk s (time) 0.1348 s (humidity, df = 3) 0.0311* DTR and COVID-19 risk s (DTR) 0.0041** Mar. 6 to Mar. 27, 2022 Temperature and COVID-19 risk s (time) 0.0084** s (temperature) 0.0023** Humidity and COVID-19 risk s (time) <0.0001*** s (humidity, df = 3) 0.0139* DTR and COVID-19 risk s (DTR) 0.0157* Jul. 8 to Aug. 2, 2022 (confirmed) Temperature and COVID-19 risk s (temperature) <0.0001*** Humidity and COVID-19 risk s (humidity) 0.0133* DTR and COVID-19 risk s (DTR) <0.0001*** Jul. 8 to Aug. 2, 2022 (asymptomatic) Temperature and COVID-19 risk s (temperature) <0.0001*** Humidity and COVID-19 risk s (humidity) 0.0142* DTR and COVID-19 risk s (DTR) <0.0001*** Note. *P value < 0.05; **P value < 0.01; ***P value < 0.001. Table S1. Model parameter selection and its significance in fitting exposure-response relationship using GAM model during three COVID-19 epidemics in Lanzhou
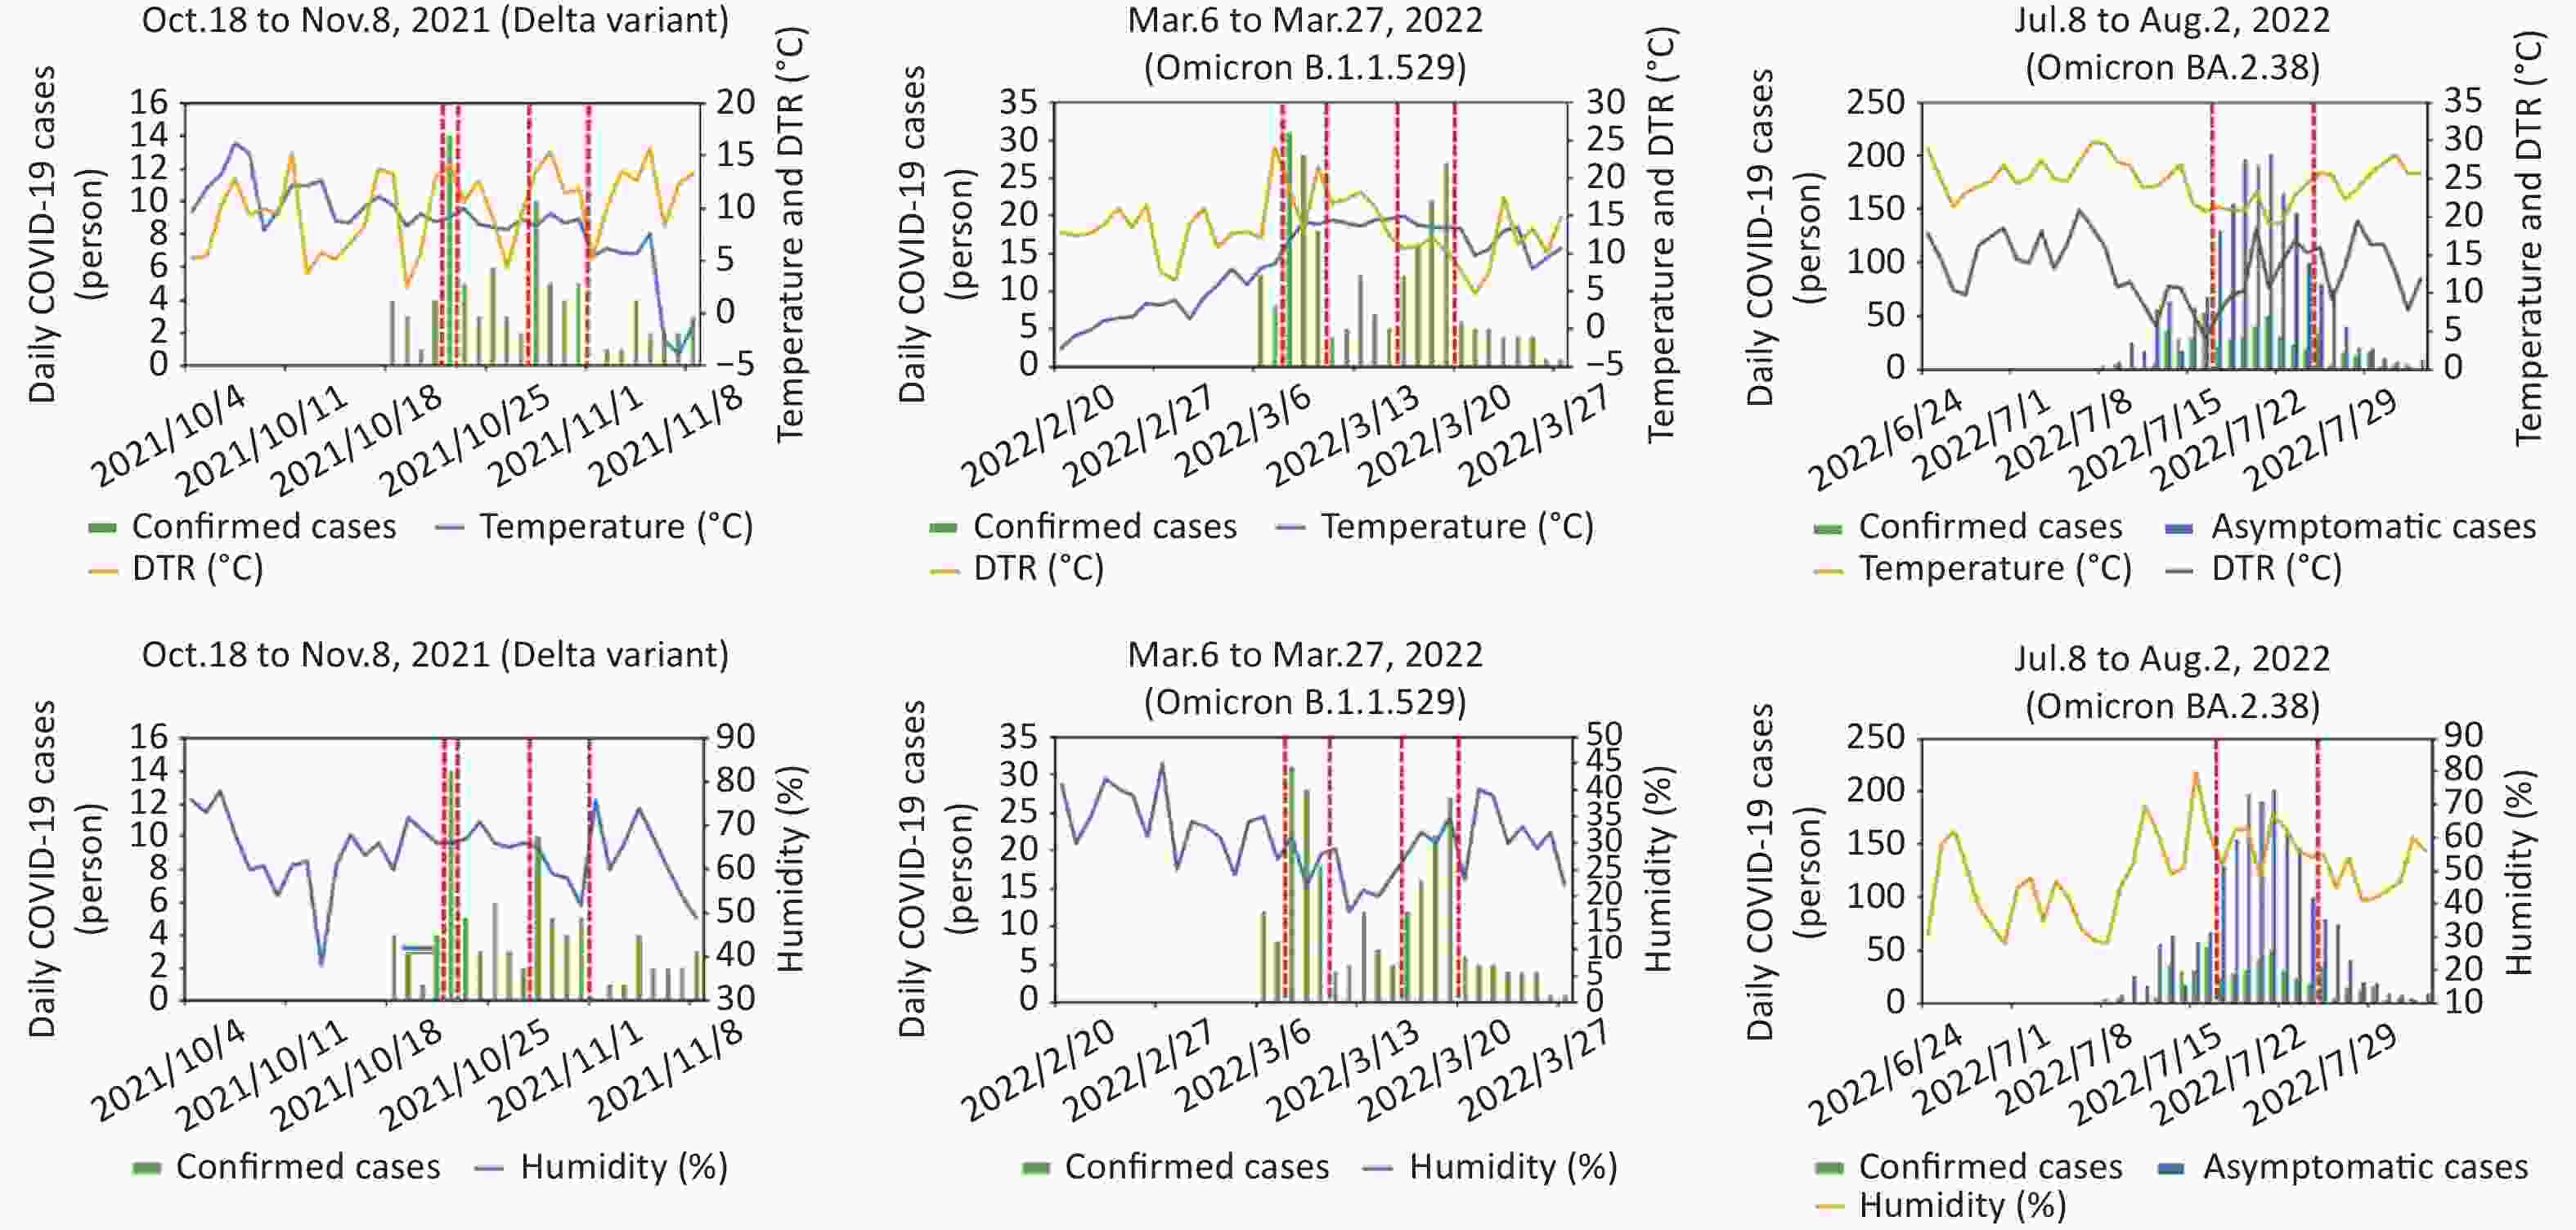
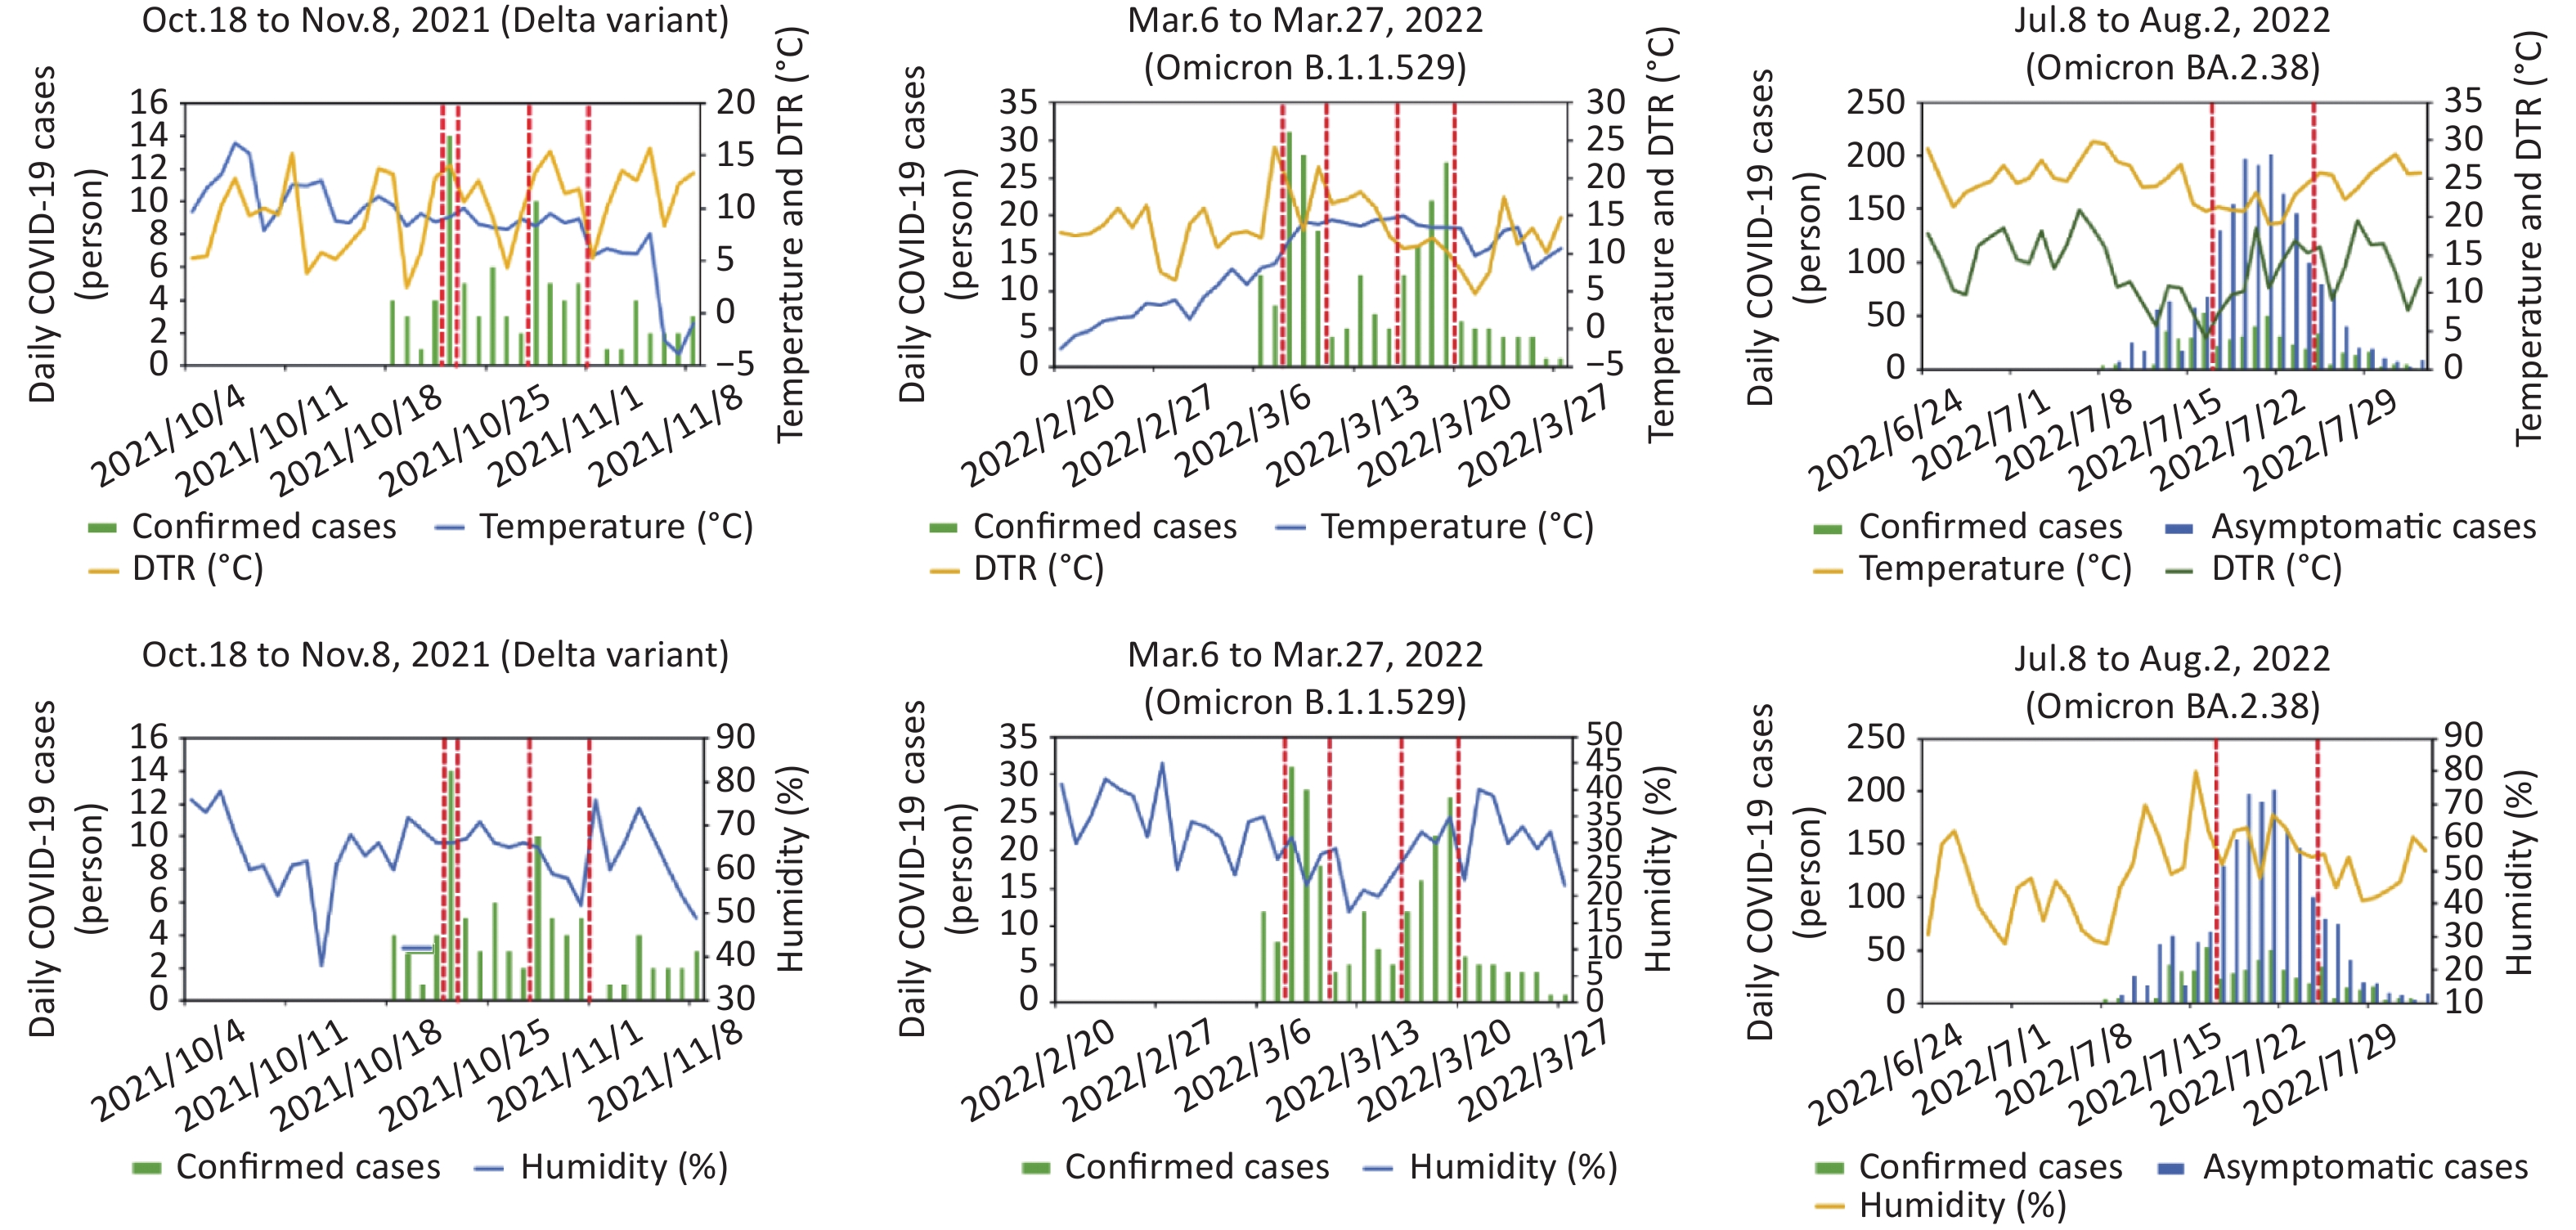
Figure S1. Time series analysis of daily COVID-19 cases and meteorological elements during three COVID-19 pandemics in Lanzhou. The red dotted line emphasized the peak area for daily COVID-19 cases.
The relative risk (RR) and 95% confidence intervals (CIs) were used to assess the association between meteorological elements and COVID-19 risk. The formulas of the RR and 95% CIs were as follows:
$$ {RR}={\mathrm{e}}^{\mathrm{\beta }\mathrm{*}\Delta \mathrm{x}} $$ (3) $$ RR\left(95\mathrm{\%}{CI}\right)={\mathrm{e}}^{(\mathrm{\beta }\pm 1.96\mathrm{S}\mathrm{E})\mathrm{*}\Delta \mathrm{x}} $$ (4) For each unit increase (∆x = 1) in meteorological elements, the risk of COVID-19 is expected to change by (RR −1) ×100(%) percentage, where RR represents the relative risk. SE is the standard error of regression coefficient β.
The study utilizes the lag effects of meteorological elements to assess the relative risk of COVID-19 within 14 days. Specifically, an increase in meteorological elements in one day is expected to contribute to the change in COVID-19 risk over the following 14 days. If the maximum percentage change in COVID-19 risk is observed on a specific lag day, that day is considered to have the most significant lag effect.
We observed three COVID-19 pandemics, and the duration between the emergence of COVID-19 cases and the clearance of COVID-19 cases lasted for 22, 22, and 26 days, respectively (Supplementary Figure S1). The total number of confirmed COVID-19 cases reported during these pandemics was 84, 237, and 505, respectively, while the third outbreak also reported a total of 1,861 asymptomatic COVID-19 cases (Table 1). The importation of different mutant types of COVID-19 caused these three pandemics. They were the Delta variant in autumn 2021, the Omicron variant B.1.1.529 in spring 2022, and the Omicron variant BA.2.38 in summer 2022, respectively. The COVID-19 virus has undergone several mutations, significantly strengthening COVID-19 infectivity. Since Nov 2021, the Omicron variant has been globally identified as the dominant circulating COVID-19 strain[2]. The Omicron variant was found to cause a more significant escape from immune protection obtained from prior infection. Compared to the Delta variant, the Omicron variant possessed up to 37 mutations in its spike protein, involving 26 unique mutations, which gave it a stronger ability to bind to the ACE2 receptor and significantly increased its infectivity[6].
Time Variables Mean ± SD Min P25 P50 P75 Max Autumn outbreak
(Oct. 18 to Nov. 8, 2021,
lasted 22 days)Temperature (°C) 6.7 ± 4.0 −3.9 5.8 8.3 9.1 10.4 Relative humidity (%) 64 ± 6.9 49.0 59.8 66.0 67.5 76.0 DTR (°C) 10.8 ± 3.6 3.0 8.9 12.1 13.4 16.0 Daily confirmed COVID-19 cases
(Total: 84)3.8 ± 3.1 0.0 2.0 3.0 5.0 14.0 Spring outbreak
(Mar. 6 to Mar. 27, 2022, lasted 22 days)Temperature (°C) 12.3 ± 2.3 8.1 10.5 13.5 14.0 15.0 Relative humidity (%) 28.5 ± 6.1 17.0 22.8 29.0 32.3 40.0 DTR (°C) 13.7 ± 4.7 4.7 10.6 12.6 17.3 24.1 Daily confirmed COVID-19 cases
(Total: 237)11 ± 9 1 4 7 17 31 Summer outbreak
(Jul. 8 to Aug. 2, 2022,
lasted 26 days)Temperature (°C) 24.1 ± 2.8 19.1 21.6 24.2 26.0 29.6 Relative humidity (%) 54.1 ± 10.7 28.0 46.5 54.0 62.0 80.0 DTR (°C) 12.0 ± 4.0 4.1 9.1 11.2 16.1 19.5 Daily confirmed COVID-19 cases
(Total: 505)19 ± 16 0.0 5.0 17.5 31.0 53.0 Daily asymptomatic COVID-19 cases
(Total: 1861)72.0 ± 67.0 1.0 15.3 57.0 134.0 201.0 Note. SD, standard deviation; DTR, diurnal temperature range. Table 1. Descriptive statistics of meteorological elements and COVID-19 cases during three COVID-19 pandemics in Lanzhou, China
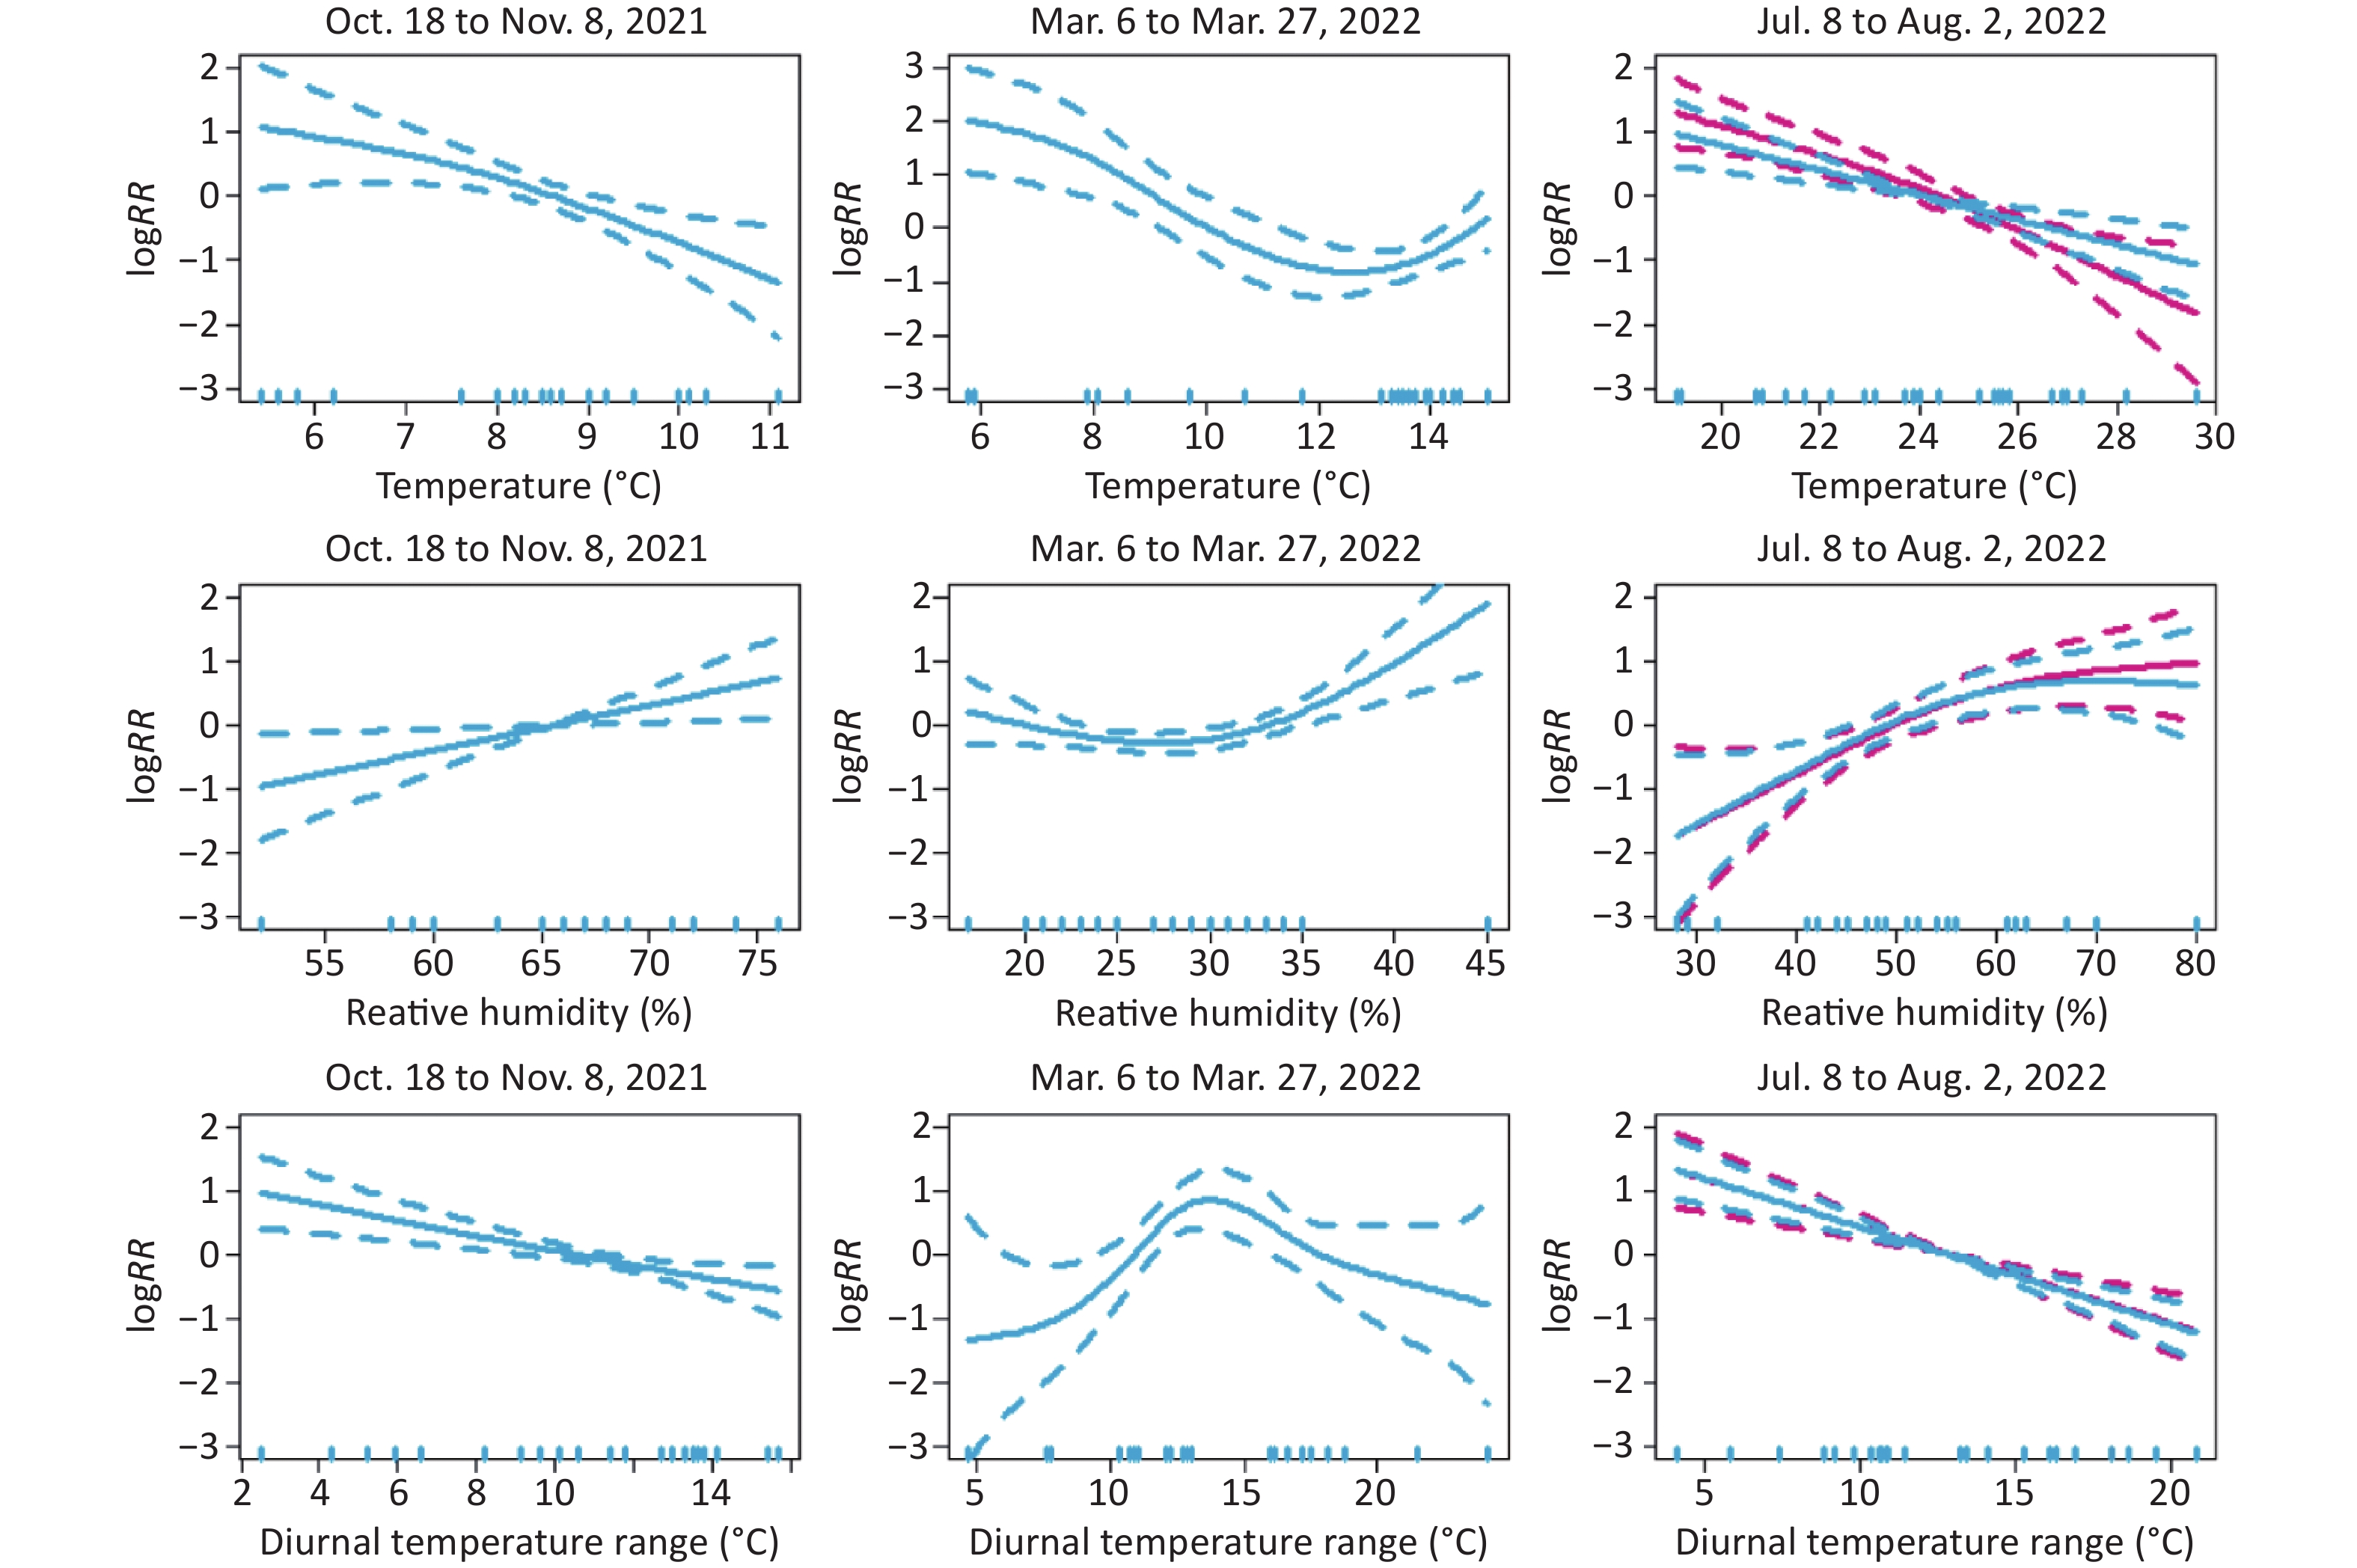
The autumn outbreak (Oct. 18 to Nov. 8, 2021) demonstrated that a decrease in temperature in the range of 6–11 °C was associated with a rapid increase in COVID-19 risk. Similarly, increased humidity within 50%–76% contributed to COVID-19 risk. Furthermore, when DTR was 2–16 °C, a decrease in DTR was observed to promote an increase in COVID-19 risk. In contrast, the spring outbreak (Mar. 6 to Mar. 27, 2022) suggested that a temperature decrease in the 6–11 °C range corresponded to an increase in COVID-19 risk, while a temperature increase in the 12.5–15.0 °C range corresponded to an increase in COVID-19 risk. In addition, a decrease in humidity within 15%–27% was associated with an increase in COVID-19 risk, while an increase in humidity within 27%–45% was observed to increase COVID-19 risk. Additionally, when DTR was 0–13.6 °C, an increase in DTR promoted an increase in COVID-19 risk. However, when DTR was 13.6–25.0 °C, a decrease in DTR was associated with increased COVID-19 risk. The summer outbreak (Jul. 8 to Aug. 2, 2022) revealed that a temperature rise at 20.5–30.0 °C was found to reduce the risk of COVID-19. Furthermore, at 20.5–25.0 °C, the asymptomatic COVID-19 risk was higher than the confirmed risk. However, at 25–30 °C, the asymptomatic risk was lower than the confirmed risk. Additionally, an increase in humidity within 30%–80% was observed to increase COVID-19 risk. When humidity ranged from 30% to 67%, atmospheric humidity had the same effect on asymptomatic and confirmed COVID-19 risks, while at 67%–80% atmospheric humidity, the asymptomatic risk was higher than the confirmed COVID-19 risk. When the DTR was 4–21 °C, a decrease in DTR promoted an increase in COVID-19 risk, with DTR having the same effects on confirmed and asymptomatic COVID-19 risks (Figure 1).
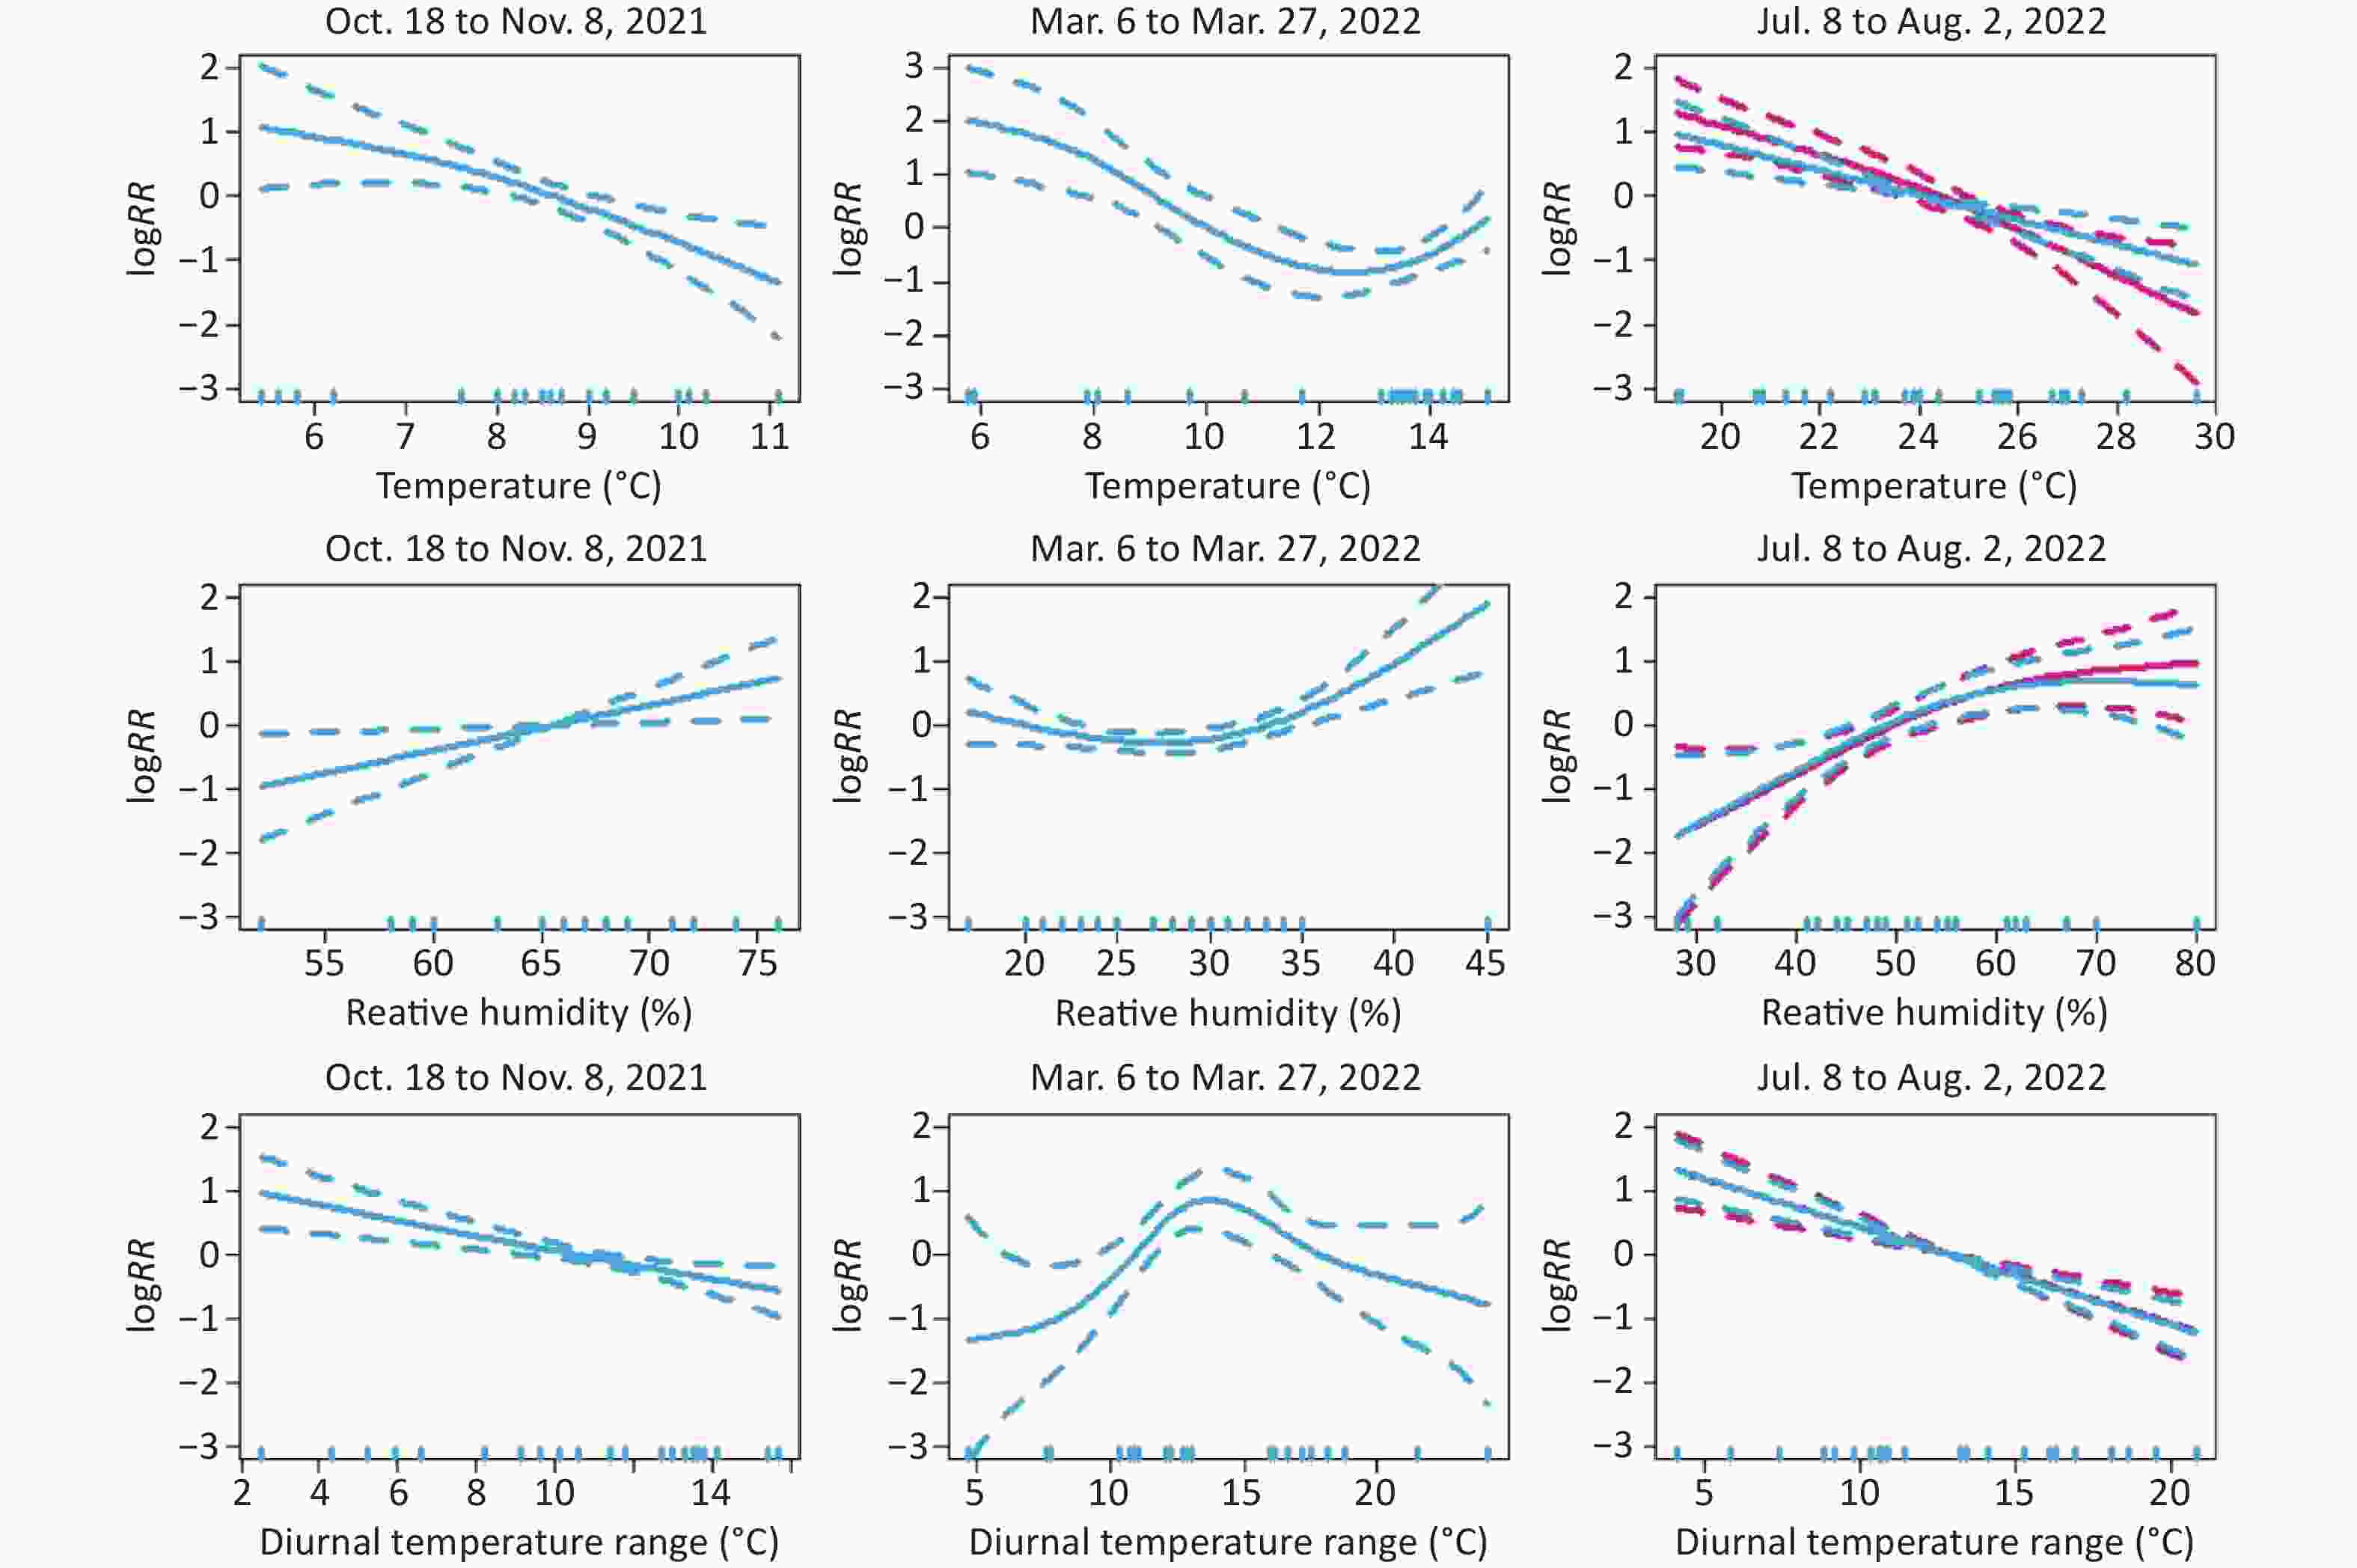
Figure 1. Exposure–response relationships between temperature, humidity, diurnal temperature range (DTR), and COVID-19 risk during three COVID-19 pandemics in Lanzhou, China. The blue line is the RR of confirmed cases, and the red line is the RR of asymptomatic cases.
The human body’s immune response was suppressed at low temperatures. A toxicology study suggested that phagocytosis of alveolar macrophages was depressed in a lower temperature environment, leading to declined phagocytosis function and cell viability[7]. The survival of viruses in the air would be prolonged in higher humidity environments. A laboratory study found that virus decay was relatively rapid at 65% relative humidity and tended to be slower at lower (40%) or higher (85%) humidity, which was similar to the exposure-response relationship in the spring outbreak[3]. Lower DTR indicated a more stable atmosphere, characterized by lower wind velocity, cloudy weather, less atmospheric upward movement, and more severe air pollution. Lower wind speeds and less atmospheric upward motion could inhibit the dispersion of atmospheric pollutants. As airborne virus carriers, accumulating atmospheric pollutants would result in higher virus concentrations in the air. An epidemiologic study in Seoul, Korea, indicated that higher DTR significantly contributed to asthma exacerbations in different age groups[8].
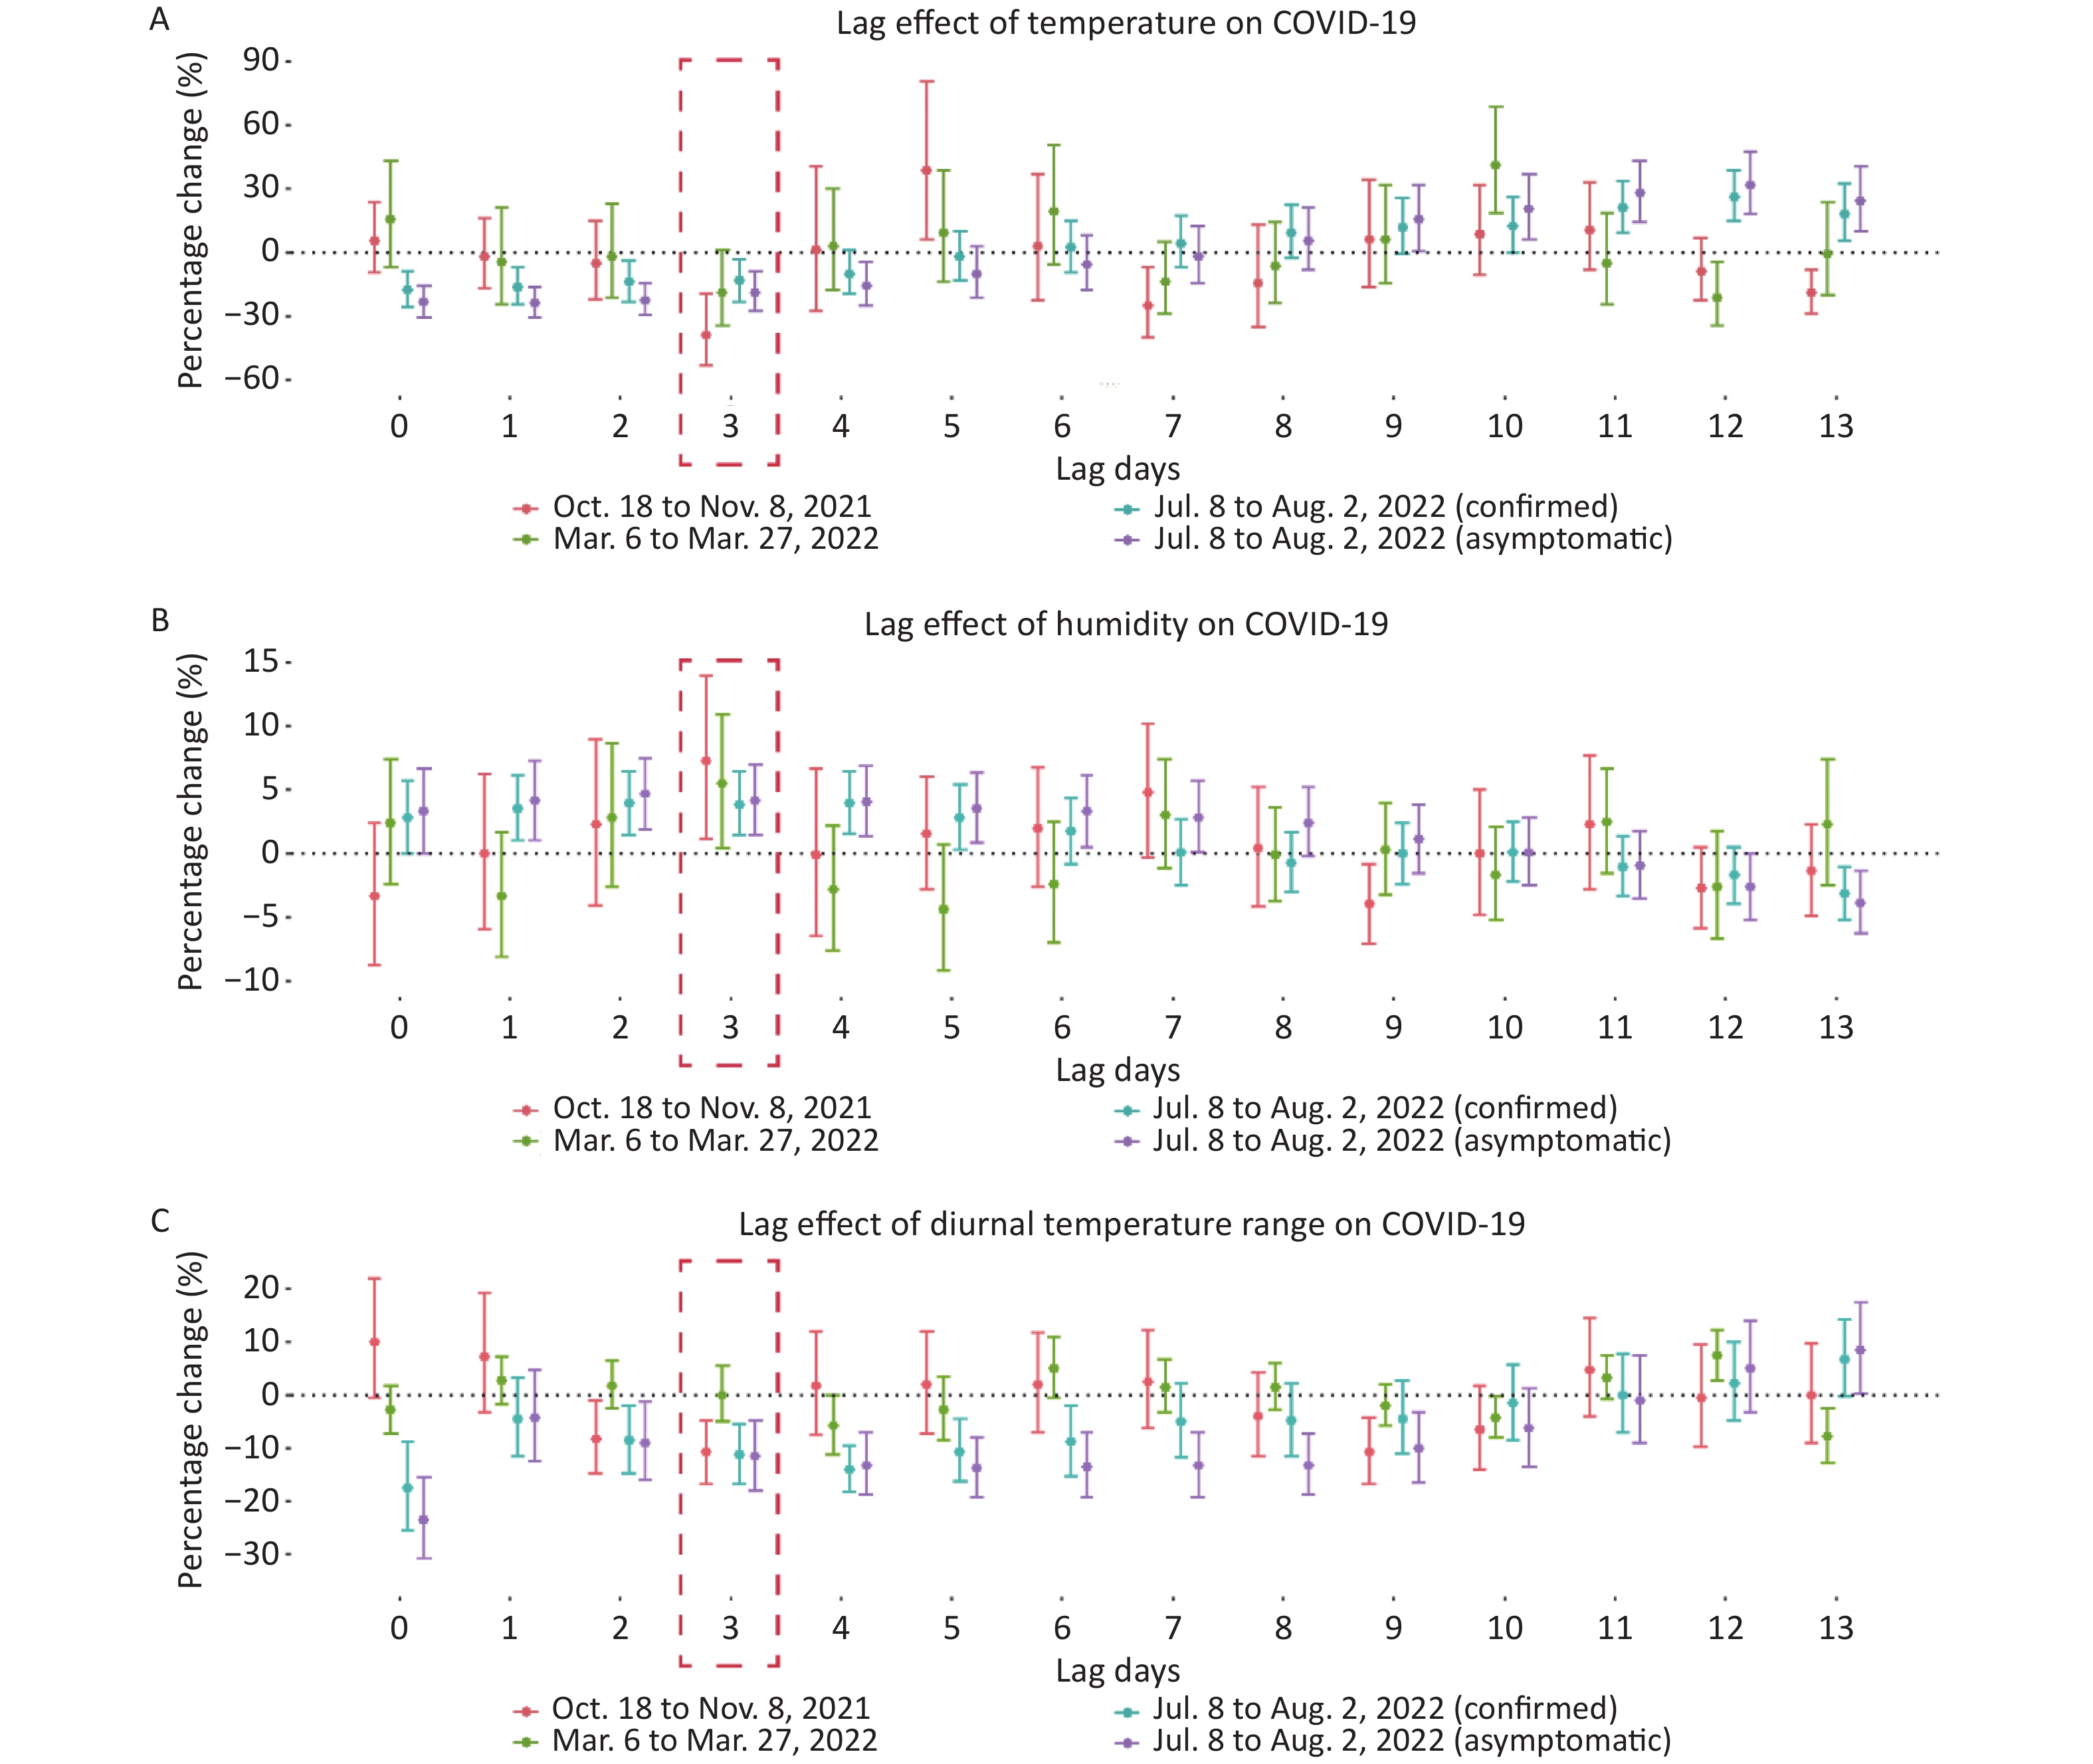
During the autumn outbreak, the most significant lag effect of temperature, humidity, and DTR was observed at lag 3 days. Specifically, each 1 °C decrease in air temperature was associated with a 38.8% (19.5%–53.5%) increase in COVID-19 risk at lag 3 days. In contrast, each 1% increase in relative humidity was associated with a 7.3% (1.1%–13.9%) increase in COVID-19 risk at lag 3 days. Furthermore, each 1 °C decrease in DTR was associated with a 10.9% (4.8%–16.7%) increase in COVID-19 risk at lag 3 days. During the spring outbreak, each 1 °C decrease in air temperature was associated with an 18.9% (-0.9%–34.8%) increase in COVID-19 risk at lag 3 days. Each 1% increase in relative humidity was associated with a 5.5% (0.4%–10.9%) increase in COVID-19 risk at lag 3 days. Moreover, each 1 °C decrease in DTR was associated with a 5.8% (0.1%–11.2%) increase in COVID-19 risk at lag 4 days. During the summer outbreak, each 1°C decrease in air temperature was associated with a 17.6% (8.9%–25.5%) increase in COVID-19 risk and a 23.5% (15.5%–30.7%) increase in asymptomatic COVID-19 risk at lag 0 days. At lag 3 days, each 1 °C decrease in air temperature was associated with a 13.5% (2.9%–23.0%) increase in COVID-19 risk and an 18.8% (8.9%–27.6%) increase in asymptomatic COVID-19 risk. Additionally, each 1% increase in relative humidity was associated with a 3.9% (1.4%–6.4%) increase in confirmed COVID-19 risk and a 4.2% (1.4%–6.9%) increase in asymptomatic COVID-19 risk at lag 3 days. At lag 3 days, each 1 °C decrease in DTR was associated with an 11.4% (5.6%–16.8%) increase in confirmed COVID-19 risk and an 11.6% (4.7%–18.0%) increase in asymptomatic COVID-19 risk, respectively (Figure 2).
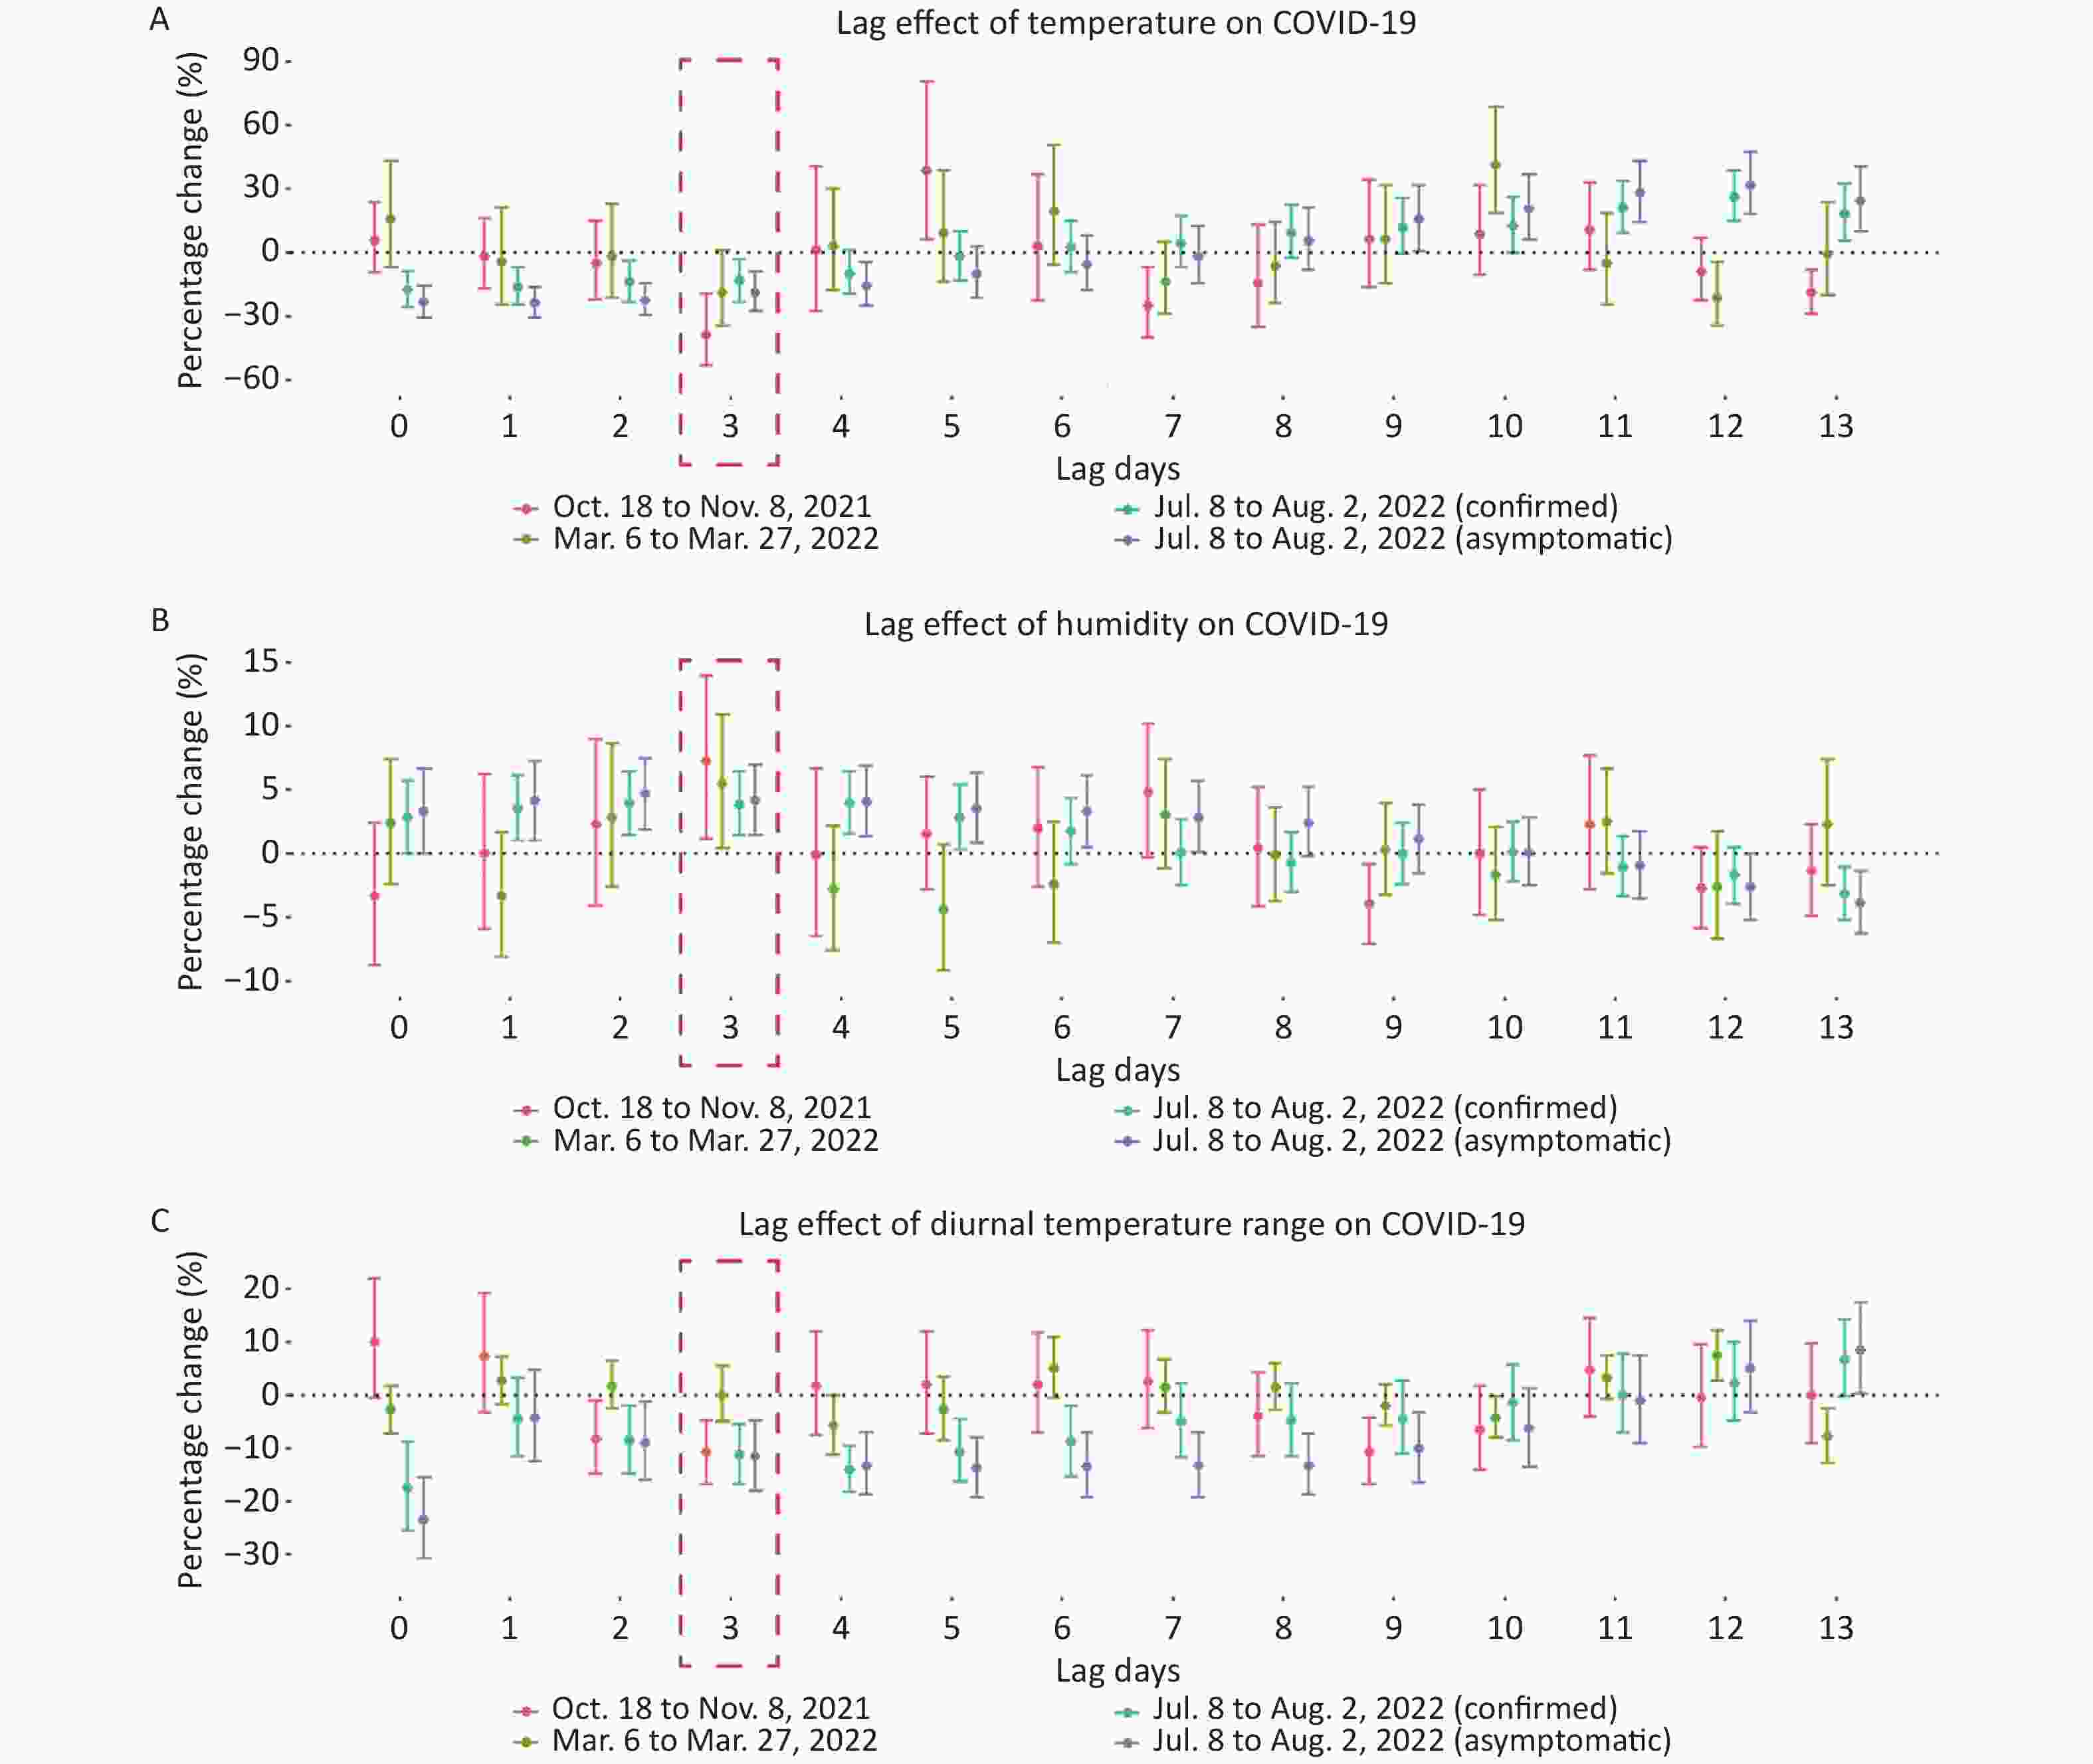
Figure 2. Percentage change in COVID-19 risk for each 1 °C temperature, diurnal temperature range (DTR), and 1% increase in humidity up to 14 days during three COVID-19 pandemics in Lanzhou, China. The red box outlined the most significant lag days.
Several studies concluded that the lag effect of temperature on COVID-19 was at 3 lag days. One case study in the USA demonstrated that temperature was negatively associated with COVID-19 cases with 2 lag days[9]. A study in Bangladesh demonstrated that relative humidity enhanced the incidence of COVID-19, with the highest increase [19.92% (95% CI: 25.71%, 14.13%)] at lag 4 days[10]. A multi-city study in China showed that each 1 °C increase in DTR was associated with a decrease in COVID-19 cases with a pooled risk of 0.90 (95% CI: 0.86, 0.95) at lag 0–3 days[4].
There are several limitations in this study. Firstly, due to the government's policy of not recording asymptomatic COVID-19 cases during the autumn and spring pandemics, this study only includes asymptomatic COVID-19 cases caused by the Omicron variant BA.2.38 during the summer outbreak. In future studies, it is important to conduct a more comprehensive comparative analysis of asymptomatic and confirmed COVID-19 risk by incorporating a larger number of COVID-19 cases. Secondly, the sample size of confirmed cases is relatively small due to the government's centralized control and isolation of COVID-19 cases. Data with larger samples would be used in future studies for more accurate research.
HTML
Conflicts of interest No potential conflicts of interest were disclosed.
&These authors contributed equally to this work.
Reference
 23453-S.pdf
|

|

 Quick Links
 DownLoad: