


-
Nitrates, thiocyanates, and perchlorates are ubiquitous in the environment and can be introduced to the public through various dietary and environmental sources. Nitrates, thiocyanates, and perchlorates mainly affect health via the same mechanism. These toxins may act as endocrine disrupters and can result in decreased levels of thyroid hormones[1]. Animal studies have shown that exposure to nitrate alters the circulating concentrations of sex steroids; however, these studies are equivocal and contradictory. In rats, nitrite decreases serum testosterone levels[2], while in alligators, nitrate has been found to increase plasma testosterone levels[3]. Nevertheless, only few studies have evaluated whether exposure to these chemicals is associated with altered sex hormone levels in humans. The role of sex hormones in development and physical growth is critical in children and adolescents, as they are indispensable for the maintenance of muscle, bone, and metabolic homeostasis. Children may be vulnerable to environmental endocrine-disrupting chemicals, particularly because of developmentally appropriate discrepancies in toxicokinetics, behavior, anatomy, and physiology. Hence, the present study aimed to estimate the relationship between nitrate, thiocyanate, perchlorate, and sex hormones in children aged 6–19 years from the U.S. National Health and Nutrition Examination Study (NHANES) and to examine whether puberty- and age-sex differences, as well as body mass index (BMI), would modify these relationships.
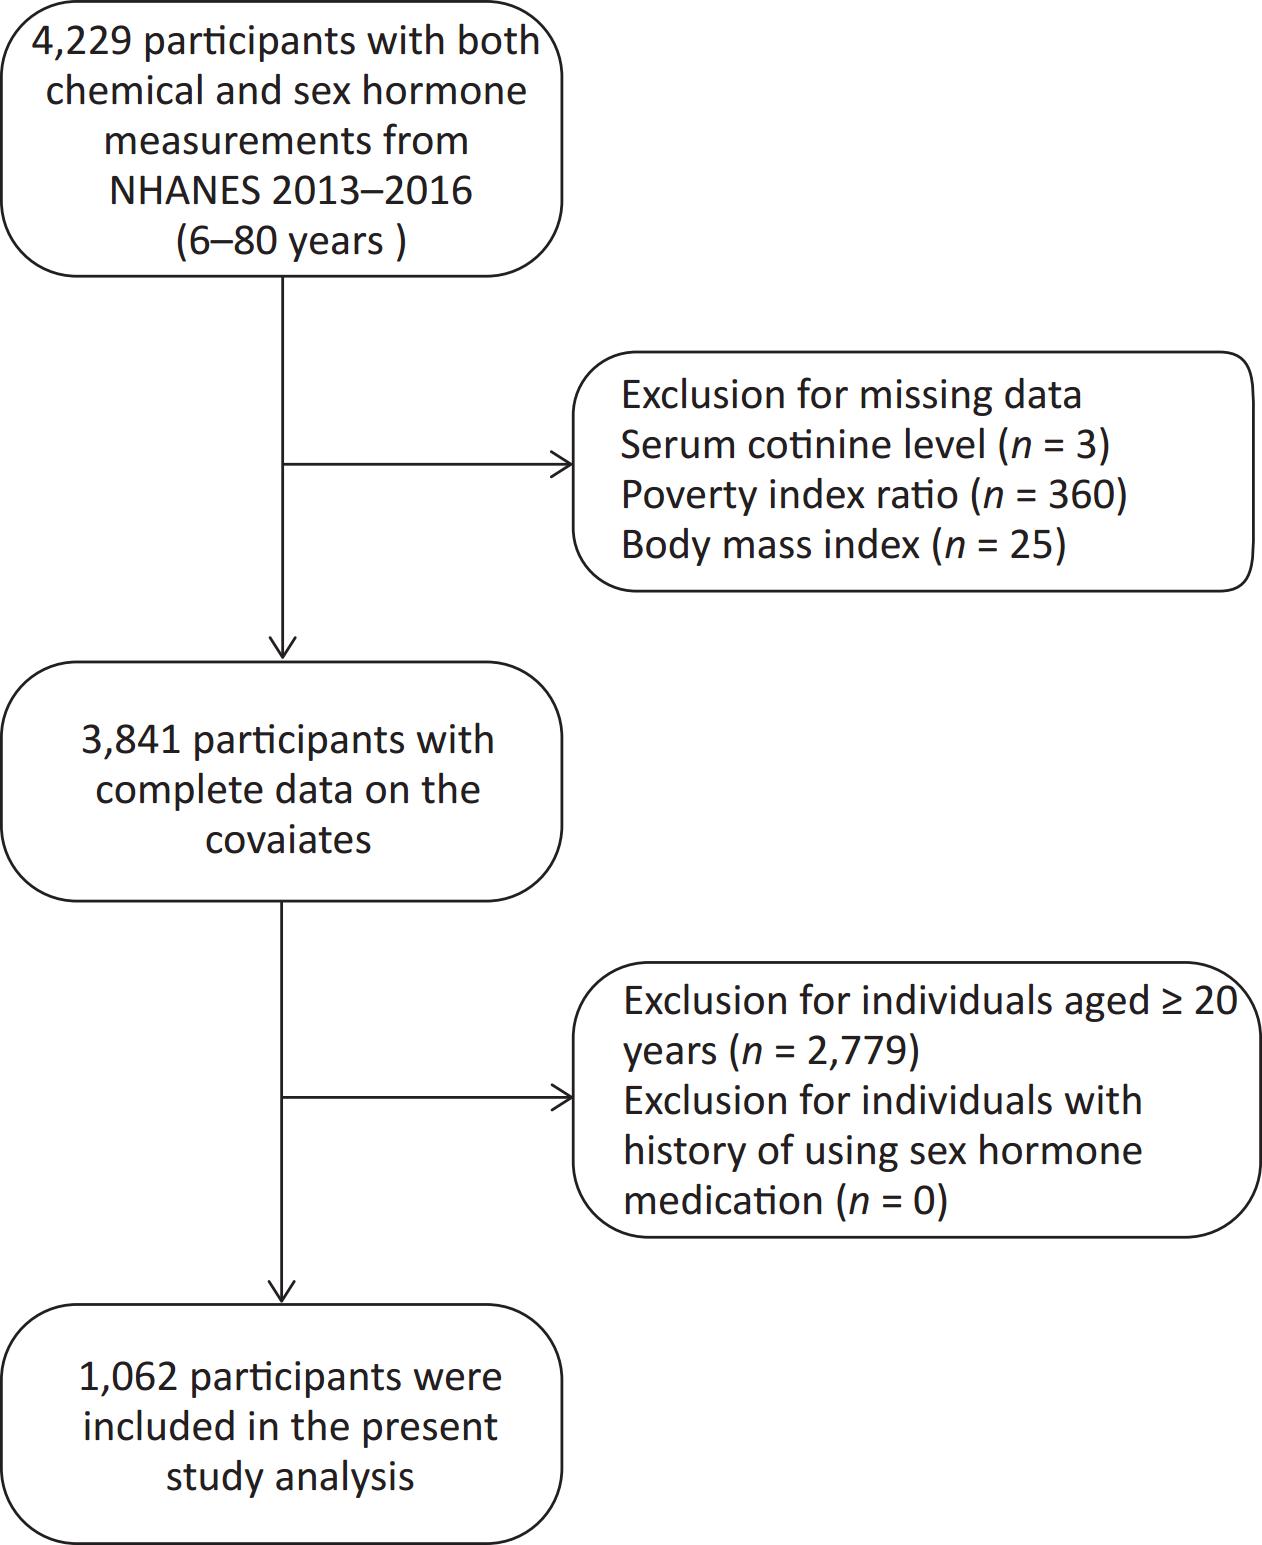
The U.S. NHANES comprises a series of nationally representative cross-sectional studies. The National Center for Health Statistics (NCHS) sponsored and approved NHANES. Detailed descriptions and protocols of the NHANES are available online at http://www.cdc.gov/nchs/nhanes.htm. All participants provided written informed consent and all procedures were approved by the Institutional Ethics Review Board of the NCHS. As the data were publicly available and anonymized, the Ethical Committee and Institutional Review Board Committee of Xinhua Hospital considered the study exempt from ethics review. The study conformed to the principles outlined in the Declaration of Helsinki. Data from individuals recruited between 2013 and 2016 were analyzed. Levels of nitrate, perchlorate, and thiocyanate in urine were quantified in a randomly selected one-third subset of NHANES participants aged ≥ 6 years. A total of 4,229 individuals aged 6–80 years had information about sex hormones and the concentrations of perchlorate, nitrate, and thiocyanate in their urine. We excluded individuals with missing data on covariates, including BMI, poverty index ratio, and serum cotinine levels (n = 388). We further excluded 2,779 individuals aged ≥ 20 years, leaving 1,062 individuals aged 6–19 years with complete information about the covariates for the final analysis (Supplementary Figure S1, available in www.besjournal.com). None of the participants reported using sex hormone medications, such as estrogen, progesterone, testosterone, “other sex hormones”, or drugs that had an effect on sex hormone levels.
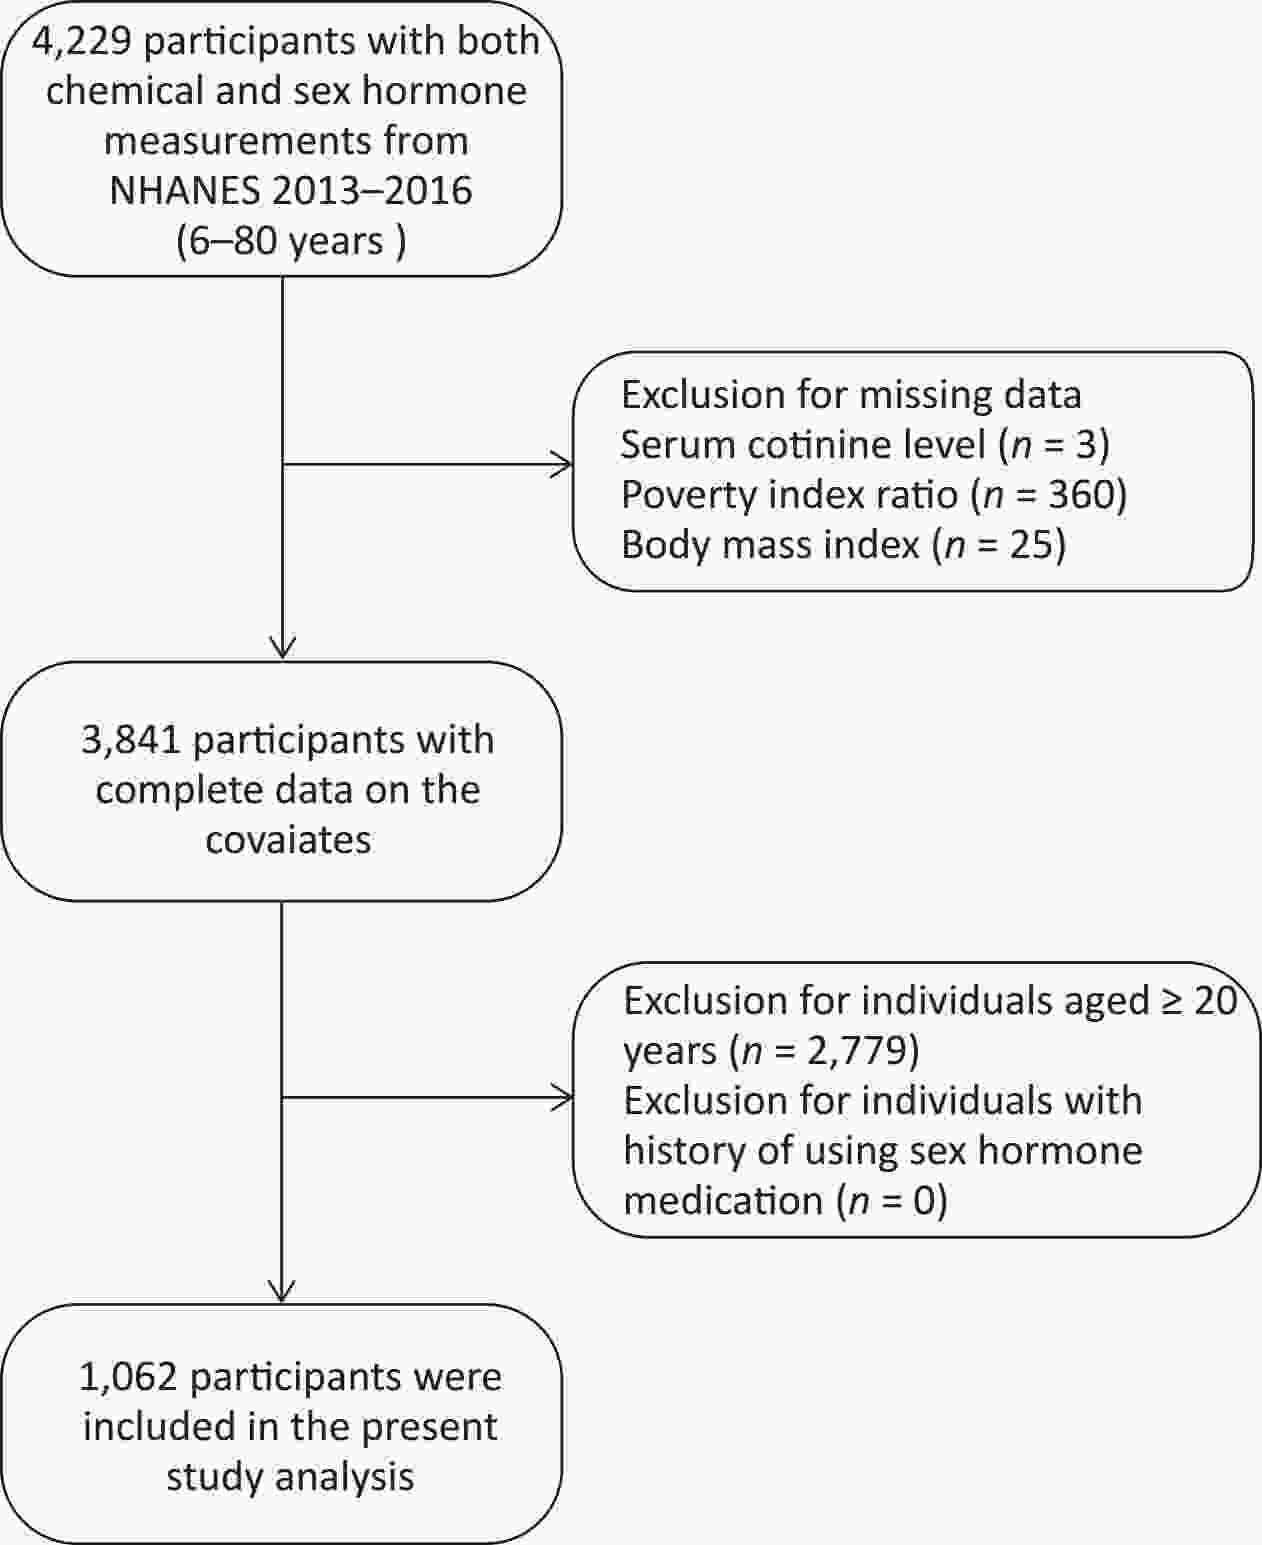
Figure S1. Flow chart.
Trained interviewers collected demographic information regarding poverty status, sex, race/ethnicity, and age. Sex- and age-specific growth charts were used to calculate BMI, which was classified as underweight (BMI < 5th percentile), normal weight (BMI 5th to < 85th percentile), overweight (BMI 85th to < 95th percentile), or obese (BMI 95th percentile). The sample collection season and the time of blood collection were adjusted for seasonal, weekly, and diurnal fluctuations in sex hormone concentrations.
Urinary thiocyanate, nitrate, and perchlorate levels were measured using ion chromatography coupled with electrospray tandem mass spectrometry. The LODs (limits of detection) for urinary perchlorate, nitrate, and thiocyanate were 0.05, 700, and 20 ng/mL, respectively. Levels below the LOD were assigned a value equal to the LOD divided by the square root of the two. The metabolite concentrations were adjusted using creatinine levels to correct for urine dilution in spot urine specimens. More details on laboratory materials and methods are available online at https://wwwn.cdc.gov/nchs/nhanes/continuousnhanes/default.aspx.
Total testosterone (TT) and estradiol (E2) levels were quantified using isotope dilution liquid chromatography tandem mass spectrometry (ID–LC–MS/MS). Sex hormone-binding globulin (SHBG) level was measured based on the reaction of SHBG with immunoantibodies and chemiluminescence of the reaction products. The LODs for E2, TT, and SHBG were 2.994 pg/mL, 0.75 ng/mL, and 0.800 nmol/L, respectively. The free androgen index (FAI) was calculated using the following formula: FAI = (TT × 100)/SHBG. The TT:E2 ratio was calculated to indirectly estimate the level of circulating free testosterone.
Descriptive statistics were used to show demographic characteristics by age groups (6–11 years and 12–19 years) for boys and girls. We used selected percentiles and means to show the distributions of chemical and sex hormone concentrations. Demographic characteristics were stratified by sex and age using the Mann–Whitney U test, chi-square test, or one-way ANOVA for categorical and continuous variables. Spearman’s rank correlation analysis was used to assess correlation coefficients. Due to the non-normal distribution of sex steroid hormones and chemicals, the data were log10-transformed to achieve a normal distribution.
We set the levels of the chemicals as categorical variables in quartiles and used the low-exposure group as the reference group to analyze the data using generalized linear regression models. Tests for trends (p-trends) were performed across quartiles using the median thiocyanate, nitrate, and perchlorate levels in each quartile as linear variables in the regression models. Linear regression models were also used to analyze the associations between the urinary concentrations of nitrate, thiocyanate, and perchlorate as continuous variables and sex hormones.
In view of the modification effects of sex at puberty and age, we further conducted a stratified analysis. Notably, the population of 12–19-year-old boys and girls in this study may have comprised a mix of pubescent and prepubescent children. Endocrine-disrupting chemicals might have different effects on sex hormones, depending on the pubertal status. Therefore, the participants were classified into prepubertal and pubertal groups based on their sex hormone concentrations. We classified participants as pubertal if their E2 level was ≥ 20 pg/mL for girls or if their TT levels was ≥ 50 ng/dL for boys. Otherwise, the participants were classified as prepubescent. Furthermore, to explore the effects of BMI modifications, we conducted a stratified analysis. Participants were classified as BMI-for age underweight or normal weight and BMI-for age overweight or obese groups. We selected potential confounders consistent with previous studies examining chemical exposure and sex hormones: BMI, race, age, poverty income ratio, serum cotinine concentrations, sex, NHANES cycles, session of blood sample collection, and the 6-month time period when surveyed. All statistical analyses were conducted using the SPSS software (version 22.0; IBM, Somers, NY, USA). Statistical significance was set at P < 0.05 (two-tailed).
The sociodemographic characteristics of the 1,062 participants stratified by sex and age are shown in Table 1. The mean BMI was 22.02 ± 6.12 kg/m2. The differences in poverty income ratio, race/ethnicity, NHANES cycles, session of blood sample collection, and 6-month time period when surveyed were not significant between the age- and sex- stratified groups (P > 0.05). The detection frequencies of nitrate, thiocyanate, and perchlorate exposure were 100% (Supplementary Table S1, available in www.besjournal.com). The median concentrations of thiocyanate, nitrate, and perchlorate were 1,030, 53,150, and 3.04 ng/mL, respectively. Supplementary Table S2 (available in www.besjournal.com) shows the Spearman’s rank correlation coefficients for the three chemical levels. The correlation coefficients ranged from 0.298 to 0.492, and correlations were found among all three chemicals (all P < 0.05).
Characteristics Total 6–11 years 12–19 years P values Mean ± SD or n (%) Boys Girls Boys Girls (n = 238) (n = 225) (n = 291) (n = 308) Age (years) 12.36 (3.88) 8.57 (1.64) 8.63 (1.83) 15.27 (2.26) 15.28 (2.19) < 0.001a BMI (kg/m2) 22.02 (6.12) 19.03 (4.54) 19.17 (4.59) 23.71 (5.93) 24.83 (6.44) < 0.001a Race/ethnicity Non-Hispanic White 284 (26.7) 70 (29.4) 50 (22.2) 93 (32.0) 71 (23.1) 0.080b Non-Hispanic Black 215 (20.2) 48 (20.2) 48 (21.3) 66 (22.7) 53 (17.2) Mexican American 253 (23.8) 51 (21.4) 64 (28.4) 59 (20.3) 79 (25.6) Other Hispanic 134 (12.6) 28 (11.8) 31 (13.8) 30 (10.3) 45 (14.6) Other Race-including multi-Racia 176 (16.6) 41 (17.2) 32 (14.2) 43 (14.8) 60 (19.5) Poverty index ratio Below poverty level (≤ 1) 345 (32.5) 78 (32.8) 85 (37.8) 88 (30.2) 94 (30.5) 0.252c Above poverty level (> 1) 717 (67.5) 160 (67.2) 140 (62.2) 203 (69.8) 214 (69.5) Serum cotinine level < LOD 380 (35.8) 83 (34.9) 87 (38.7) 78 (26.8) 132 (42.9) < 0.001b ≥ LOD 682 (64.2) 155 (65.1) 138 (61.3) 213 (73.2) 176 (57.1) 6-month time period when surveyed November 1 through April 30 546 (51.4) 121 (50.8) 115 (51.1) 164 (56.4) 146 (47.4) 0.182b May 1 through October 31 516 (48.6) 117 (49.2) 110 (48.9) 127 (43.6) 162 (52.6) Session of blood sample collection Morning 447 (42.1) 88 (37.0) 85 (37.8) 136 (46.7) 138 (44.8) 0.095b Afternoon 395 (37.2) 99 (41.6) 83 (36.9) 106 (36.4) 107 (34.7) Evening 220 (20.7) 51 (21.4) 57 (25.3) 49 (16.8) 63 (20.5) NHANES cycles 2013–2014 529 (49.8) 115 (48.3) 106 (47.1) 150 (51.5) 158 (51.3) 0.684b 2015–2016 533 (50.2) 123 (51.7) 119 (52.9) 141 (48.5) 150 (48.7) Note. BMI: body mass index; LOD: limits of detection; NHANES, the U.S. National Health and Nutrition Examination Study; aMeans were compared using one-way ANOVA; bProportions were compared by Pearson chi-square test; cProportions were compared by Nonparametric Tests. Table 1. Characteristics stratified by gender among children aged 6–11 years and 12–19 years, NHANES 2013–2016 (n = 1,062)
Chemical exposure was generally inversely related to FAI, TT, and E2, but positively related to SHBG and TT/E2 (Table 2). Negative relationships were found between perchlorate [β: −0.138, 95% confidence interval (CI): −0.205 to −0.070)], nitrate (β: −0.218, 95% CI: −0.330 to −0.105), thiocyanate (β: −0.084, 95% CI: −0.143 to −0.024), and E2; between perchlorate (β: −0.175, 95% CI: −0.264 to −0.085), nitrate (β: −0.287, 95% CI: −0.436 to −0.138), and TT; and between perchlorate (β: −0.223, 95% CI: −0.331 to −0.115), nitrate (β: −0.335, 95% CI: −0.514 to −0.155), and FAI. Nevertheless, the concentration of perchlorate was positively associated with SHBG (β: 0.048, 95% CI: 0.007 to 0.089), and the concentration of thiocyanate was positively associated with TT/E2 (β: 0.114, 95% CI: 0.032 to 0.197). Moreover, relationships between chemicals and sex hormones were also found across the quartiles of exposure using the low-exposure group as the reference group (Supplementary Table S3, available in www.besjournal.com). Perchlorate and nitrate levels were significantly and negatively correlated with E2, TT, and FAI (P < 0.001 for the trend). Perchlorate (P = 0.013 for the trend) and nitrate (P = 0.016 for the trend) levels were significantly and positively associated with SHBG levels. A possible mechanism for the reproductive disruption effects of perchlorate might be the adverse effects on the gonads, including DNA damage, resulting from reactive oxygen species in the testicular tissues and a decreased number of preantral and antral follicles[4,5]. Moreover, thyroid and estrogen receptors can bind to identical half-sites of their respective hormone response elements, suggesting that thyroid and estrogen receptors may interact to modify the expression of estrogen-sensitive genes[6]. The thyrotoxic effects of perchlorate have been determined in previous studies[1]. These findings indicate that the disruption of thyroid hormones resulting from perchlorate could interfere with the normal synthesis of estrogen, which might partly contribute to the inverse association between perchlorate and E2. Nitrate can be endogenously transformed into nitric oxide, and the mechanism underlying the inhibitory effects of nitrate is believed to be related to the action of nitric oxide, an inhibitor of steroid hormone synthesis[2]. The inverse correlation between thiocyanate and follicle-stimulating hormones[7], which can stimulate the growth of immature follicles to maturation, may partially account for the negative relationship between thiocyanate and E2 observed in our study. SHBG can bind to and control E2 and TT concentrations with high affinity, providing a circulating reservoir of hormones and regulating metabolic clearance, bioavailability, and access to target tissues for sex hormones. Hence, the concentration of SHBG affects the circulating concentrations of E2 and TT, particularly in the free form. In our study, the FAI, as a proxy for unbound TT levels in the serum, was inversely related to perchlorate, which is consistent with our SHBG findings, as high SHBG levels were related to low levels of free TT. All intrinsic links supported the finding that inverse relationships with FAI and TT were accompanied by a positive relationship with SHBG.
Exposure E2 TT SHBG FAI TT/E2 β (95% CI) a Perchlorate −0.138 (−0.205, −0.070)* −0.175 (−0.264, −0.085)* 0.048 (0.007, 0.089)* −0.223 (−0.331, −0.115)* −0.037 (−0.131, 0.057) Nitrate −0.218 (−0.330, −0.105)* −0.287 (−0.436, −0.138)* 0.048 (−0.020, 0.116) −0.335 (−0.514, −0.155)* −0.069 (−0.225, 0.087) Thiocyanate −0.084 (−0.143, −0.024)* 0.031 (−0.049, 0.110) 0.035 (−0.001, 0.072) −0.005 (−0.101, 0.091) 0.114 (0.032, 0.197)* Note. TT: total testosterone; E2: estradiol; SHBG: sex hormone-binding globulin; FAI: free androgen index; NHANES, the U.S. National Health and Nutrition Examination Study; aAdjusted for sex, age, family income to poverty ratio, body mass index, race, serum cotinine concentration, 6-month time period when surveyed, session of blood sample collection, and NHANES cycles; *P < 0.05. Table 2. Association between single exposure and sex hormones in the NHANES 2013–2016 (n = 1,062)
The relationship between chemicals and sex hormones was stronger in pubescent participants than in prepubertal participants in both boys and girls (Table 3). In pubertal boys, the levels of perchlorate (β: −0.100, 95% CI: −0.174 to −0.027) and nitrate (β: −0.183, 95% CI: −0.302 to −0.063) were inversely associated with E2; nitrate was negatively associated with TT (β: −0.123, 95% CI: −0.245 to −0.001); and perchlorate was negatively associated with FAI (β: −0.113, 95% CI: −0.207 to −0.018). However, thiocyanate was positively associated with SHBG (β: 0.068, 95% CI: 0.012 to 0.125). In pubertal girls, the concentration of perchlorate was negatively associated with E2 (β: −0.150, 95% CI: −0.270 to −0.031), and nitrate showed an inverse association with SHBG (β: −0.134, 95% CI: −0.257 to −0.011). The evidence of the impact modified by sex-age differences was similar (Supplementary Table S4, available in www.besjournal.com). Among boys aged 12–19 years, the concentration of perchlorate was negatively associated with E2 (β: -0.108, 95% CI: −0.192 to −0.024), and nitrate was inversely associated with E2 (β: −0.226, 95% CI: −0.365 to −0.087), TT (β: −0.230, 95% CI: −0.414 to −0.045), and FAI (β: −0.271, 95% CI: −0.489 to −0.052). However, thiocyanate was positively associated with SHBG (β: 0.062, 95% CI: 0.002 to 0.122). Similarly, phthalate, paraben, and phenol exposures were reported to be inversely related to TT and E2, with the relationships being stronger among pubertal children than among prepubescent children[8]. Dramatic changes in hormones during puberty have profound effects on reproductive development and sexual maturation; therefore, puberty may be a time window susceptible to the effects of endocrine-disrupting chemicals. Previous studies have also found that neuroendocrine processes are highly susceptible to endocrine-disrupting chemicals at the onset of puberty, leading to long-term deviation from the normal homeostatic control of the hypothalamic-pituitary-adrenal or hypothalamic-pituitary-gonadal axis[9].
Puberty status Gender Chemicals N E2 TT SHBG FAI TT/E2 β (95% CI)a Prepubertal Boys Perchlorate 236 0.004
(−0.019, 0.027)−0.006
(−0.117, 0.105)0.008
(−0.060, 0.077)−0.014
(−0.147, 0.118)−0.010
(−0.123, 0.103)Nitrate 236 0.008
(−0.032, 0.048)−0.053
(−0.247, 0.142)0.067
(−0.052, 0.187)−0.120
(−0.351, 0.112)−0.060
(−0.258, 0.137)Thiocyanate 236 0.011
(−0.011, 0.033)0.072
(−0.032, 0.176)0.015
(−0.050, 0.079)0.058
(−0.067, 0.182)0.061
(−0.045, 0.167)Girls Perchlorate 219 −0.051
(−0.161, 0.059)−0.077
(−0.176, 0.021)0.007
(−0.092, 0.105)−0.084
(−0.218, 0.050)−0.026
(−0.146, 0.093)Nitrate 219 −0.171
(−0.359, 0.018)−0.104
(−0.274, 0.067)0.083
(−0.085, 0.252)−0.187
(−0.417, 0.043)0.067
(−0.138, 0.273)Thiocyanate 219 −0.040
(−0.136, 0.056)0.048
(−0.038, 0.135)0.014
(−0.072, 0.100)0.034
(−0.083, 0.152)0.088
(−0.015, 0.191)Pubertal Boys Perchlorate 293 −0.100
(−0.174, -0.027)*−0.059
(−0.134, 0.016)0.054
(−0.008, 0.116)−0.113
(−0.207, -0.018)*0.042
(−0.013, 0.096)Nitrate 293 −0.183
(−0.302, -0.063)*−0.123
(−0.245, -0.001)*0.028
(−0.074, 0.130)−0.151
(−0.306, 0.004)0.060
(−0.029, 0.149)Thiocyanate 293 −0.013
(−0.082, 0.055)0.014
(−0.055, 0.083)0.068
(0.012, 0.125)*0.054
(−0.142, 0.033)0.028
(−0.023, 0.078)Girls Perchlorate 314 −0.150
(−0.270, -0.031)*−0.051
(−0.120, 0.019)−0.012
(−0.093, 0.069)−0.039
(−0.139, 0.061)0.100
(−0.015, 0.214)Nitrate 314 −0.136
(−0.321, 0.048)−0.102
(−0.208, 0.004)−0.134
(−0.257, -0.011)*0.032
(−0.121, 0.185)0.035
(−0.142, 0.211)Thiocyanate 314 −0.040
(−0.136, 0.056)0.048
(−0.007, 0.103)0.001
(−0.063, 0.066)0.046
(−0.033, 0.126)0.088
(−0.003, 0.179)Note. TT: total testosterone; E2: estradiol; SHBG: sex hormone-binding globulin; FAI: free androgen index; NHANES, the U.S. National Health and Nutrition Examination Study; aAdjusted for age, family income to poverty ratio, body mass index, race, serum cotinine, 6-month time period when surveyed, session of blood sample collection, and NHANES cycles; *P < 0.05. Table 3. Association between single urinary chemical concentration and sex hormones by sex-puberty status in NHANES 2013–2016
The association between chemicals and sex hormones was stronger in overweight or obese children than in underweight or normal weight children (Supplementary Table S5, available in www.besjournal.com). In overweight or obese children, the level of perchlorate was inversely related to E2 (β: −0.173, 95% CI: −0.272 to −0.074), TT (β: −0.323, 95% CI: −0.459 to −0.186), FAI (β: −0.400, 95% CI: −0.565 to −0.234), and TT/E2 (β: −0.150, 95% CI: −0.282 to −0.017) and was positively related to SHBG (β: 0.077, 95% CI: 0.009 to 0.145); while in underweight or normal weight children, the level of perchlorate was only inversely related to E2 (β: −0.094, 95% CI: −0.186 to −0.002). These findings indicate that being overweight or obese might increase susceptibility to the effects of chemicals on sex hormones. Similarly, bisphenols and phthalates have been reported to accumulate in the adipose tissue of obese populations and change chromatin organization and structure resulting in adverse effect[10].
Exposure E2 TT SHBG FAI TT/E2 β (95% CI)a BMI-for age underweight or normal weight Perchlorate −0.094
(−0.186, −0.002)*−0.051
(−0.169, 0.066)0.020
(−0.030, 0.069)−0.071
(−0.211, 0.069)0.043
(−0.089, 0.174)Nitrate −0.179
(−0.335, −0.023)*−0.214
(−0.413, −0.016)*0.094
(0.011, 0.178)*−0.309
(−0.545, −0.073)*−0.035
(−0.258, 0.187)Thiocyanate −0.044
(−0.129, 0.042)0.055
(−0.053, 0.164)0.038
(−0.008, 0.083)0.018
(−0.112, 0.147)0.099
(−0.022, 0.220)BMI-for age overweight or obese Perchlorate −0.173
(−0.272, −0.074)*−0.323
(−0.459, −0.186)*0.077
(0.009, 0.145)*−0.400
(−0.565, −0.234)*−0.150
(−0.282, −0.017)*Nitrate −0.260
(−0.419, −0.101)*−0.353
(−0.576, −0.131)*−0.028
(−0.138, 0.083)−0.326
(−0.597, −0.054)*−0.093
(−0.307, 0.120)Thiocyanate −0.133
(−0.216, −0.050)*−0.002
(−0.119, 0.114)0.031
(−0.026, 0.089)−0.034
(−0.175, 0.108)0.131
(0.021, 0.241)*Note. TT: total testosterone. E2: estradiol. SHBG: sex hormone-binding globulin. FAI: free androgen index. aAdjusted for gender, age, family income to poverty ratio, body mass index, race, serum cotinine concentrations, six-month time period when surveyed, session of blood sample collection, and NHANES cycles. *P < 0.05. Table S5. Association between single exposure and sex hormones by BMI for age in NHANES 2013–2016 (n = 1,062)
This study had several limitations. First, we acquired information from a single measurement of thiocyanate, nitrate, and perchlorate levels in urine specimens, which may not reflect long-term exposure due to within-individual variability. Second, we did not have accurate data on the pubertal stage, prohibiting us from adjusting for the effect of puberty status on the findings. Third, a causal relationship between exposure to nitrate, thiocyanate, and perchlorate, and sex hormones may not have been established owing to the observational nature of this study. Prospective cohort studies are required to provide further evidence regarding this matter.
In summary, we found that thiocyanate, nitrate, and perchlorate exposure was related to altered sex hormone levels among children, especially among pubertal and overweight or obese children. However, considering the cross-sectional design of this study, the findings should be interpreted with caution and require further validation.
-
Variables Detection rate LOD Mean Selected percentlies N (%) 25th 50th 75th 95th TT (ng/dL) 1,056 (99.4) 0.75 (ng/mL) 121.17 4.99 18.70 129.50 588.00 E2 (pg/mL) 713 (67.1) 2.994 (pg/mL) 33.56 2.12 14.70 33.50 152.85 SHBG (nmol/L) 1,062 (100) 0.800 (nmol/L) 68.35 33.20 55.08 92.98 157.54 FAI (TT/SHBG) − − 3.79 0.07 0.38 2.63 19.47 TT/E2 − − 7.52 0.56 1.42 12.91 31.38 Perchlorate (ng/mL) 1,062 (100) 0.05 (ng/mL) 4.60 1.63 3.04 5.19 11.76 Nitrate (ng/mL) 1,062 (100) 700 (ng/mL) 63,480.89 30,300.00 53,150.00 81,625.00 145,850.00 Thiocyanate (ng/mL) 1,062 (100) 20 (ng/mL) 1,374.79 529.25 1,030.00 1,720.00 3,577.00 Note. TT: total testosterone. E2: estradiol. SHBG: sex hormone-binding globulin. FAI: free androgen index. LOD: limit of detection. Table S1. Distribution of sex hormone levels and chemical exposure in NHANES 2013–2016 (N = 1062)
Variables Nitrate Thiocyanate Perchlorate 0.492* 0.298* Nitrate 0.311* Note. *P < 0.05. Table S2. Spearman correlation coefficients for perchlorate, nitrate, and thiocyanate in the NHANES 2013–2016 (n = 1,062)
Variables E2 TT SHBG FAI TT/E2 β (95% CI)a P trend β (95% CI)a P trend β (95% CI)a P trend β (95% CI)a P trend β (95% CI)a P trend Perchlorate Q1 Reference < 0.001 Reference < 0.001 Reference 0.013 Reference < 0.001 Reference 0.449 Q2 −0.053
(−0.115, 0.008)−0.067
(−0.148, 0.014)0.008
(−0.029, 0.044)−0.074
(−0.172, 0.023)−0.013
(−0.098, 0.072)Q3 −0.103
(−0.166, −0.041)*−0.101
(−0.184, −0.018)*0.040
(0.002, 0.077)*−0.141
(−0.241, −0.040)*0.002
(−0.085, 0.090)Q4 −0.141
(−0.208, −0.074)*−0.177
(−0.266, −0.087)*0.049
(0.008, 0.089)*−0.225
(−0.333, −0.117)*−0.036
(−0.129, 0.058)Nitrate Q1 Reference 0.001 Reference < 0.001 Reference 0.016 Reference < 0.001 Reference 0.240 Q2 −0.072
(−0.133, −0.010)*−0.056
(−0.138, 0.026)0.007
(−0.030, 0.044)−0.063
(−0.162, 0.036)0.016
(−0.070, 0.101)Q3 −0.103
(−0.168, −0.037)*−0.119
(−0.206, −0.032)*0.007
(−0.032, 0.046)−0.126
(−0.231, −0.022)*−0.017
(−0.108, 0.074)Q4 −0.130
(−0.201, −0.060)*−0.176
(−0.270, −0.082)*0.047
(0.005, 0.090)*−0.223
(−0.337, −0.110)*−0.046
(−0.144, 0.053)Thiocyanate Q1 Reference 0.083 Reference 0.556 Reference 0.227 Reference 0.969 Reference 0.068 Q2 −0.014
(−0.076, 0.047)0.076
(−0.005, 0.158)0.006
(−0.031, 0.042)0.071
(−0.027, 0.169)0.091
(0.006, 0.175)*Q3 −0.041
(−0.102, 0.020)0.053
(−0.029, 0.134)0.007
(−0.030, 0.043)0.046
(−0.052, 0.144)0.094
(0.009, 0.178)Q4 −0.054
(−0.117, 0.009)0.050
(−0.034, 0.133)0.022
(−0.015, 0.060)0.027
(−0.074, 0.128)0.103
(0.016, 0.190)*Note. TT: total testosterone. E2: estradiol. SHBG: sex hormone-binding globulin. FAI: free androgen index. aAdjusted for gender, age, family income to poverty ratio, body mass index, race, serum cotinine, six-month time period when surveyed, session of blood sample collection, and NHANES cycles. *P < 0.05. Table S3. Association between single exposure and sex hormones according to quartiles in NHANES 2013–2016 (n = 1,062)
Age Gender Chemicals N E2 TT SHBG FAI TT/E2 Β (95% CI)a 6-11 years Boys Perchlorate 238 −0.038
(−0.086, 0.011)−0.045
(−0.213, 0.122)0.028
(−0.038, 0.094)−0.074
(−0.259, 0.112)−0.008
(−0.151, 0.136)Nitrate 238 0.030
(−0.053, 0.114)0.133
(−0.153, 0.420)0.055
(−0.058, 0.168)0.078
(−0.240, 0.397)0.103
(−0.143, 0.349)Thiocyanate 236 0.033
(−0.011, 0.077)0.179
(0.029, 0.329)*0.019
(−0.041, 0.079)0.160
(−0.008, 0.328)0.146
(0.017, 0.275)*Girls Perchlorate 225 −0.161
(−0.317, −0.005)*−0.105
(−0.219, 0.009)−0.036
(−0.115, 0.043)−0.069
(−0.210, 0.072)0.056
(−0.074, 0.185)Nitrate 225 −0.113
(−0.369, 0.144)−0.102
(−0.288, 0.084)−0.048
(−0.176, 0.080)−0.054
(−0.284, 0.176)0.011
(−0.200, 0.222)Thiocyanate 225 −0.051
(−0.182, 0.079)0.070
(−0.024, 0.165)−0.023
(−0.089, 0.042)0.093
(−0.023, 0.210)0.121
(0.015, 0.228)*12–19 years Boys Perchlorate 291 −0.108
(−0.192, −0.024)*−0.084
(−0.195, 0.028)0.042
(−0.022, 0.106)−0.126
(−0.258, 0.006)0.024
(−0.045, 0.094)Nitrate 291 −0.226
(−0.365, −0.087)*−0.230
(−0.414, −0.045)*0.041
(−0.065, 0.147)−0.271
(−0.489, −0.052)*−0.003
(−0.119, 0.112)Thiocyanate 291 −0.032
(−0.112, 0.048)−0.018
(−0.123, 0.088)0.062
(0.002, 0.122)*−0.080
(−0.205, 0.045)0.014
(−0.051, 0.080)Girls Perchlorate 308 −0.055
(−0.215, 0.106)−0.040
(−0.113, 0.032)0.009
(−0.081, 0.099)−0.050
(−0.152, 0.053)0.014
(−0.128, 0.157)Nitrate 308 −0.146
(−0.406, 0.114)−0.073
(−0.190, 0.044)−0.081
(−0.227, 0.065)0.008
(−0.159, 0.176)0.073
(−0.159, 0.305)Thiocyanate 308 −0.055
(−0.215, 0.106)−0.040
(−0.113, 0.032)0.009
(−0.081, 0.099)−0.050
(−0.152, 0.053)0.014
(−0.128, 0.157)Note. TT: total testosterone. E2: estradiol. SHBG: sex hormone-binding globulin. FAI: free androgen index. aAdjusted for age, family income to poverty ratio, body mass index, race, serum cotinine, six-month time period when surveyed, session of blood sample collection, and NHANES cycles. *P < 0.05. Table S4. Association between single urinary chemical concentration and sex hormones by sex–age status in NHANES 2013–2016
HTML
Competing Interests All authors have no conflict of interest to disclose.
Ethics Approval and Consent to Participate All procedures were approved by the NCHS Institutional Ethics Review Board. All the participants signed an informed consent form. As the data were publicly available and anonymized, the Ethical Committee and Institutional Review Board of Xinhua Hospital considered the study exempt from ethics review. The study conformed to the principles outlined in the Declaration of Helsinki.
&These authors contributed equally to this work.
Reference

 Quick Links
 DownLoad: