


-
Climate change is the most significant threat to public health and exerts myriad influences on health, including the occurrence of extreme temperature events. Studies have demonstrated that populations will experience significantly severe cold waves in the future[1], increasing the risk of respiratory diseases. Previous studies revealed that the exposure-response curves between temperature and respiratory diseases exhibit a “U-,” “V-” or “J-” shape[2-4]. In London, Sangkharat et al. discovered that most respiratory conditions [asthma, dyspnea, and respiratory chest infection (RCI)] have significant relative risks (RRs) at low temperatures[2]. A study of health risks in China reported that the risk of respiratory mortality associated with cold spells increased by 21.0% [95% confidence interval (CI): 16.6%–25.6%] in northern China[5]. In Beijing[6], Song et al. identified that the maximum RR (1.885, 95% CI: 1.229–2.667) was observed in a mild cold spell with a threshold of less than P3, lasting 4 d. Although many studies have reported the effects of cold temperatures on respiratory health, the effects of extremely low temperatures and cold waves have yet to be researched in detail[5]. Most studies focused on developed regions[7]. Therefore, studying the influence of extremely low temperatures and cold waves on respiratory diseases in the northwestern areas is essential. In this study, we assessed the impact of extremely low temperatures and the primary as well as the additional impacts of cold waves on respiratory disease-related hospital visits in Lanzhou, the capital of Gansu Province using a distributed lag nonlinear model (DLNM). These findings will help develop relevant preventive policies and improve the accuracy of weather forecasts.
Daily meteorological data between January 1, 2012 and December 31, 2018, were supplied by the Meteorological Bureau of Gansu. Daily respiratory disease-related visit data were collected from Lanzhou General Hospital between January 1, 2012, and December 31, 2018, including date of the visit, sex, age, and diagnostic classification code (International Classification of Diseases, Tenth Series, ICD-10) (J00-J99).
A DLNM was used to evaluate the influence of extremely low temperatures and cold waves on respiratory diseases. The model can simultaneously consider the exposure-response relationship and the hysteresis effect. Given the relatively low frequency of daily respiratory-related hospital visits, it can be assumed that the visits followed a Poisson distribution. The model is expressed as follows:
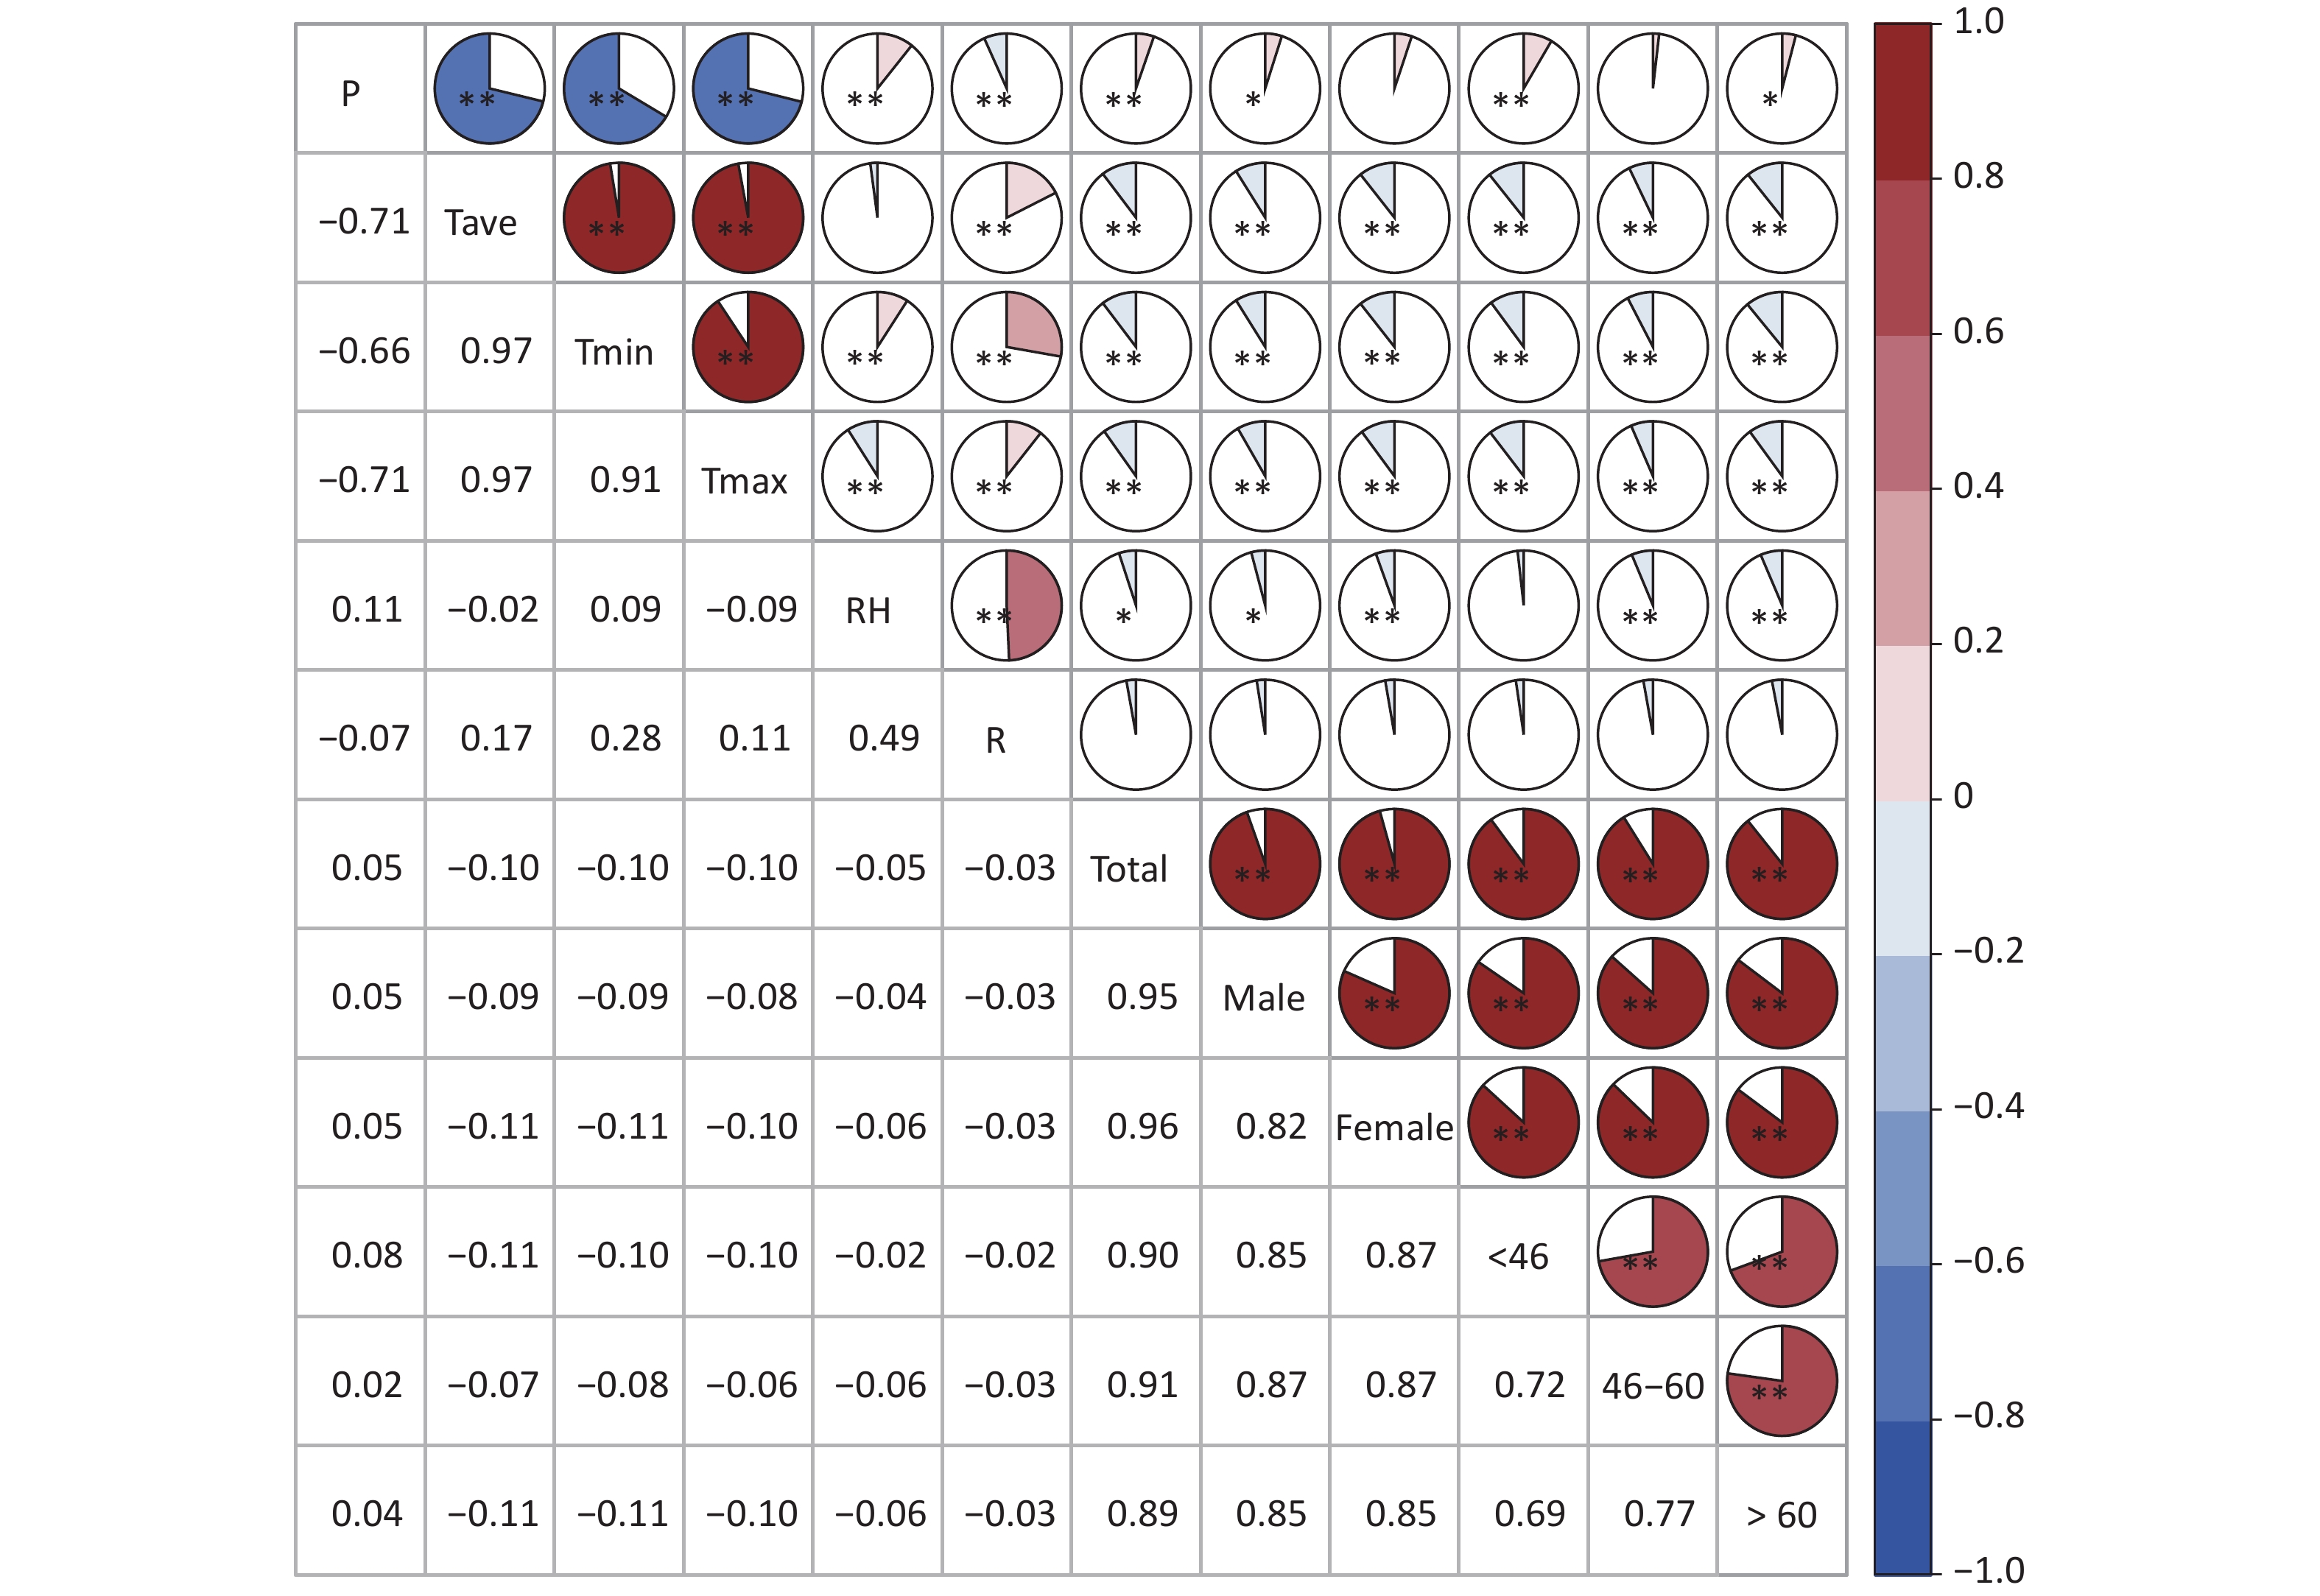
$$ {Y}_{{t}} = \text{Poisson}\;({μ}_{{t}}{)} $$ (1) $$ \begin{split} {\text{Log}}\; ( \mu_{t} )= \alpha + \beta T_{{t,l}} +{\text{NS}}\;({\text{Time}},\; 7/{\text{year}})+ \\ {\text{NS}}\;(P, df=3)+{\text{NS}}\;({\text{RH}},\; df=3) +\\{\text{NS}}\;({\text{R}}, df=3)+{\text{DOW}}+{\text{holiday}} \end{split} $$ (2) where the log function is used as a link function, t represents the observation day, Yt represents the number of respiratory disease-related visits on observation day t; α represents intercept; Tt,l represents the cross-basis matrix established by the temperature and the lag days, and β is a vector of coefficients for the Tt,l; NS (x, df) represents the natural spline cubic function for x with a certain degree of freedom (df). Variables in the study include time (date), air pressure (P), relative humidity (RH), precipitation (R), days of the week (DOW), and holidays. The Spearman correlation between meteorological elements and the number of visits of different subgroups is illustrated in Supplementary Figure S1 (available in www.besjournal.com); the daily mean temperature exhibited a significant negative correlation with all population groups. Based on the conclusions of previous studies, an empirical value of 7 degree of freedom (df) per year was chosen for smoothing the time trend, and the df for meteorological elements was set to 3. A lag time of up to 14 d was used to estimate the lag effect. The reference temperature value selected for the model was P50 when considering the overall influence of temperature, and P25 when considering the effect of extremely low temperatures. Moreover, RRs and 95% CIs were used to quantitatively assess the health risks. RR is calculated as:
Figure S1. Spearman correlation between the meteorological elements and the number of visits (*means P < 0.05; **means P < 0.01).
$$ {RR}={\text{exp}}\;({\text{β}}\times1) $$ (3) $$ CIs\;(95{\text{%}}) ={\text{exp}}\;[({\text{β}}\pm1.96{\text{se}})\times1] $$ (4) The higher the RR value, the more severe the impact of extremely low temperatures. When RR was greater than 1 and passed the statistical test (P < 0.05), it was considered that extremely low temperatures and cold waves posed respiratory risks, and the results were statistically significant.
We classified different low-temperature levels to evaluate the effect of cold on respiratory diseases using five percentiles of the daily average temperature. Based on the definition of extremely low temperatures, a cold wave is defined as a process based on temperature thresholds and the duration of cold days. For instance, if the daily temperature below P1 lasted for 2, 3, or 4 d, we recorded a cold wave (defined as P1 & 2 d, P1 & 3 d, or P1 & 4 d). In addition, the primary effect of cold wave referred to the direct effect of the cold, while the added effect represented the sustained influence of the cold. We assessed the stratification effects of sex and age to identify the subgroups vulnerable to low temperatures.
During the study period, the average daily mean temperature was 18.14 °C (Supplementary Table S1, available in www.besjournal.com), and the P, RH, R, and V were 848.02 hPa, 50.86%, 0.97 mm, and 1.15 m/s respectively. The mean number of daily respiratory disease-related visits to the hospital was 42. The number of visits was slightly higher for females than those for males. The analysis revealed a daily mean of 18 respiratory visits for those aged < 46 years, accounting for the maximum proportion of total visits. The daily mean of 11 visits for those aged > 60 years accounted for the minimal proportion.
Variable Mean Standard deviation Minimum value P25 P50 P75 Maximum value Meteorological elements P (hPa) 848.02 5.37 833.20 844.00 847.90 851.90 867.10 Tmax (°C) 18.14 10.47 −8.50 8.80 19.60 26.90 38.60 Tave (°C) 11.24 10.01 −13.30 2.40 12.80 19.80 30.40 Tmin (°C) 6.12 9.54 −17.10 −2.30 7.40 14.40 25.20 RH (%) 50.86 15.00 15.00 40.00 51.00 62.00 94.00 R (mm) 0.97 3.68 0.00 0.00 0.00 0.00 50.50 V (m/s) 1.15 0.34 0.10 0.90 1.10 1.30 2.70 Respiratory visits Total 42 22 0 27 42 57 108 Male 20 11 0 12 20 27 55 Female 22 12 0 14 22 30 67 < 46 yrs 18 9 0 12 19 25 67 46–60 yrs 12 8 0 6 12 17 42 > 60 yrs 11 7 0 6 11 16 38 Table S1. Descriptive statistics of meteorological elements and respiratory visits
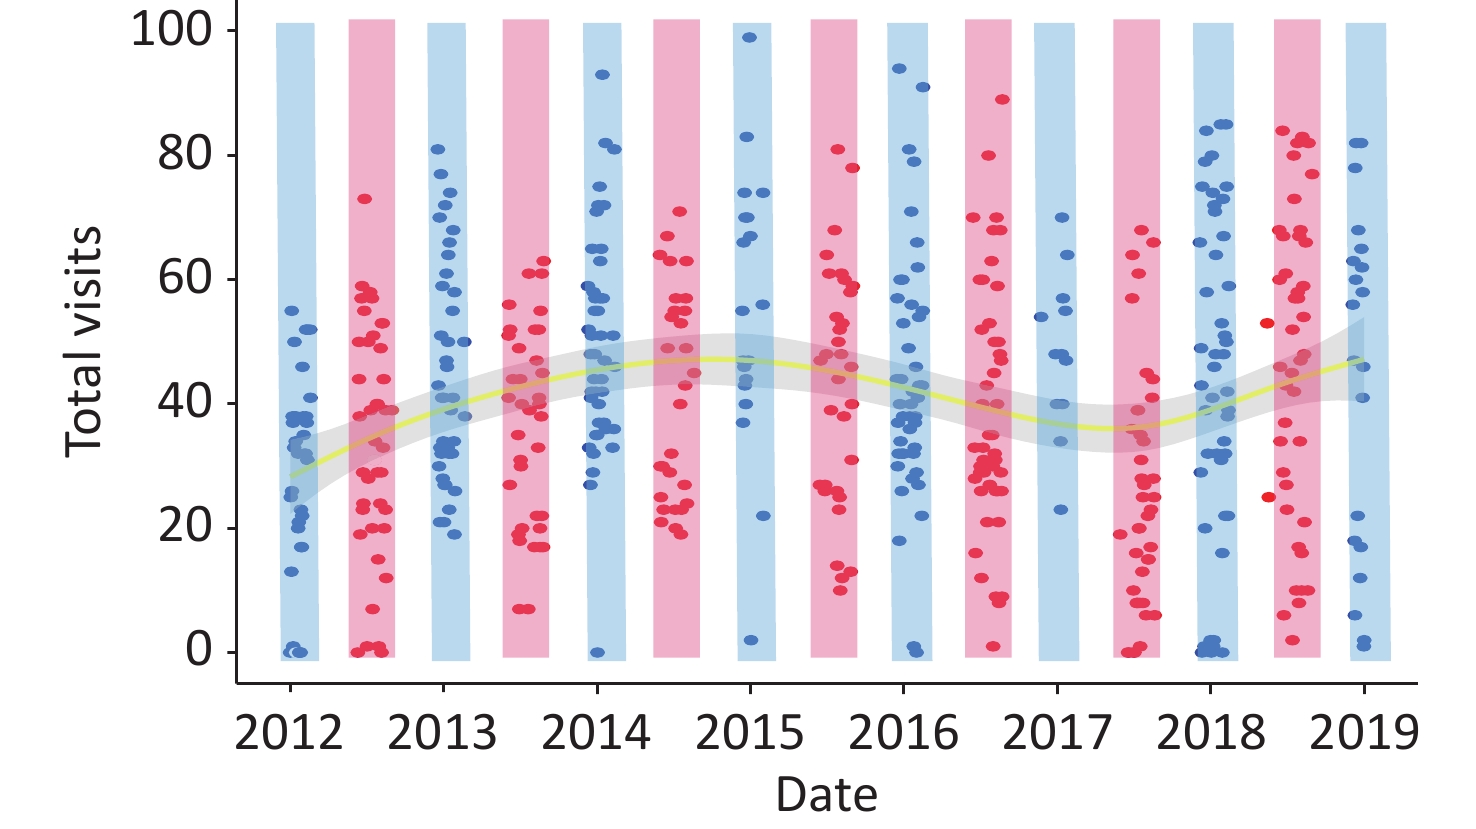
The scatter-fitting curve of the visits (Supplementary Figure S2, available in www.besjournal.com) was similar to a wave-like shape, increasing from 2012 to 2015, and then decreasing from 2015 to mid-2017, presenting an increasing trend. The highest values were located within the blue-shaded area and the lowest values were near the red-shaded area, indicating an association between low temperatures and respiratory visits.
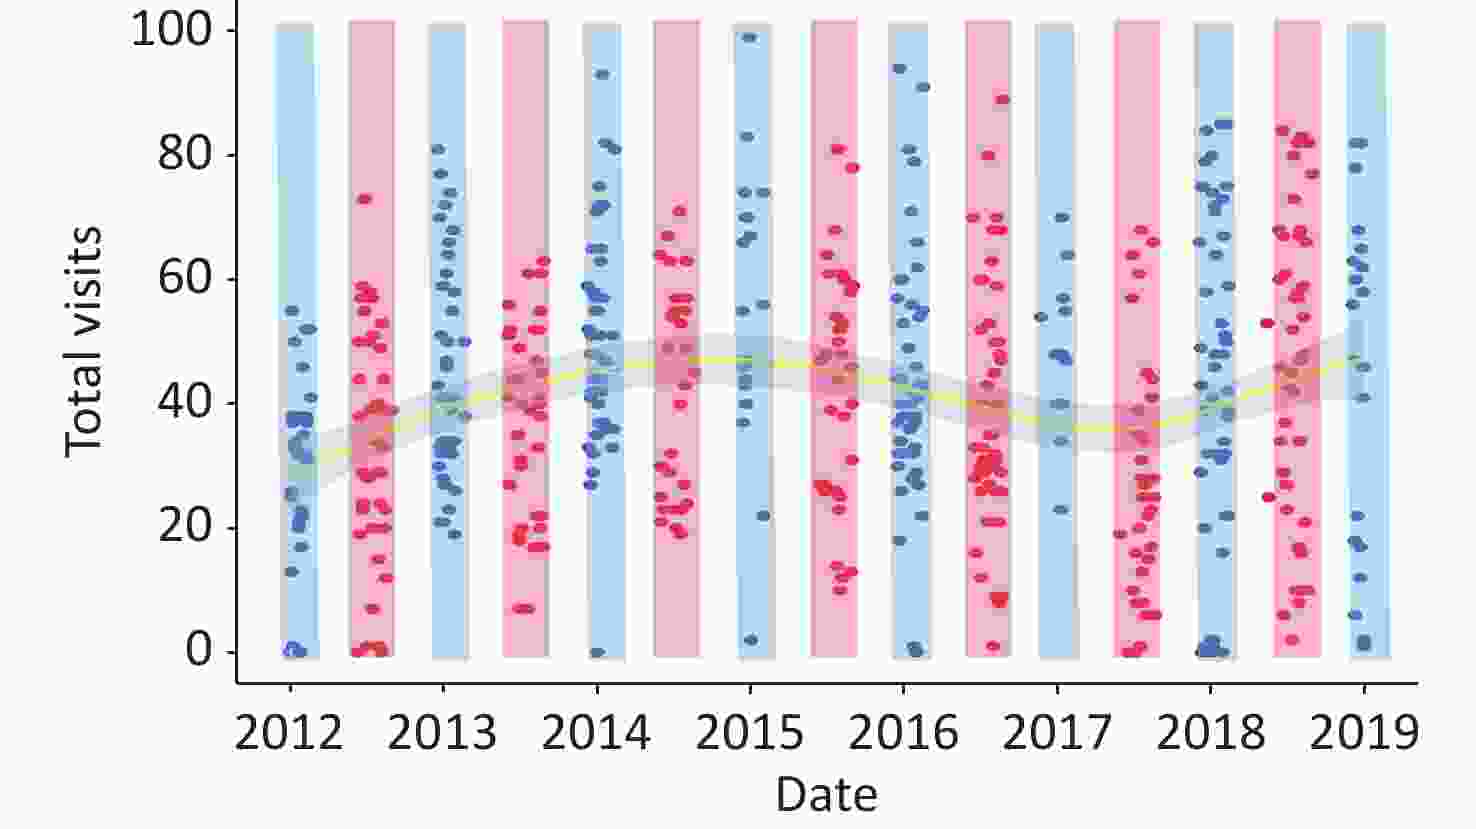
Figure S2. Characteristics of visits in extreme high and low temperatures (Blue and red scatters indicate the number of visits at temperatures below P10 and above P90, respectively; blue shading indicates extreme low-temperature areas, red indicates high-temperature areas, yellow curve is the fitted line and the grey areas are 95% CIs).
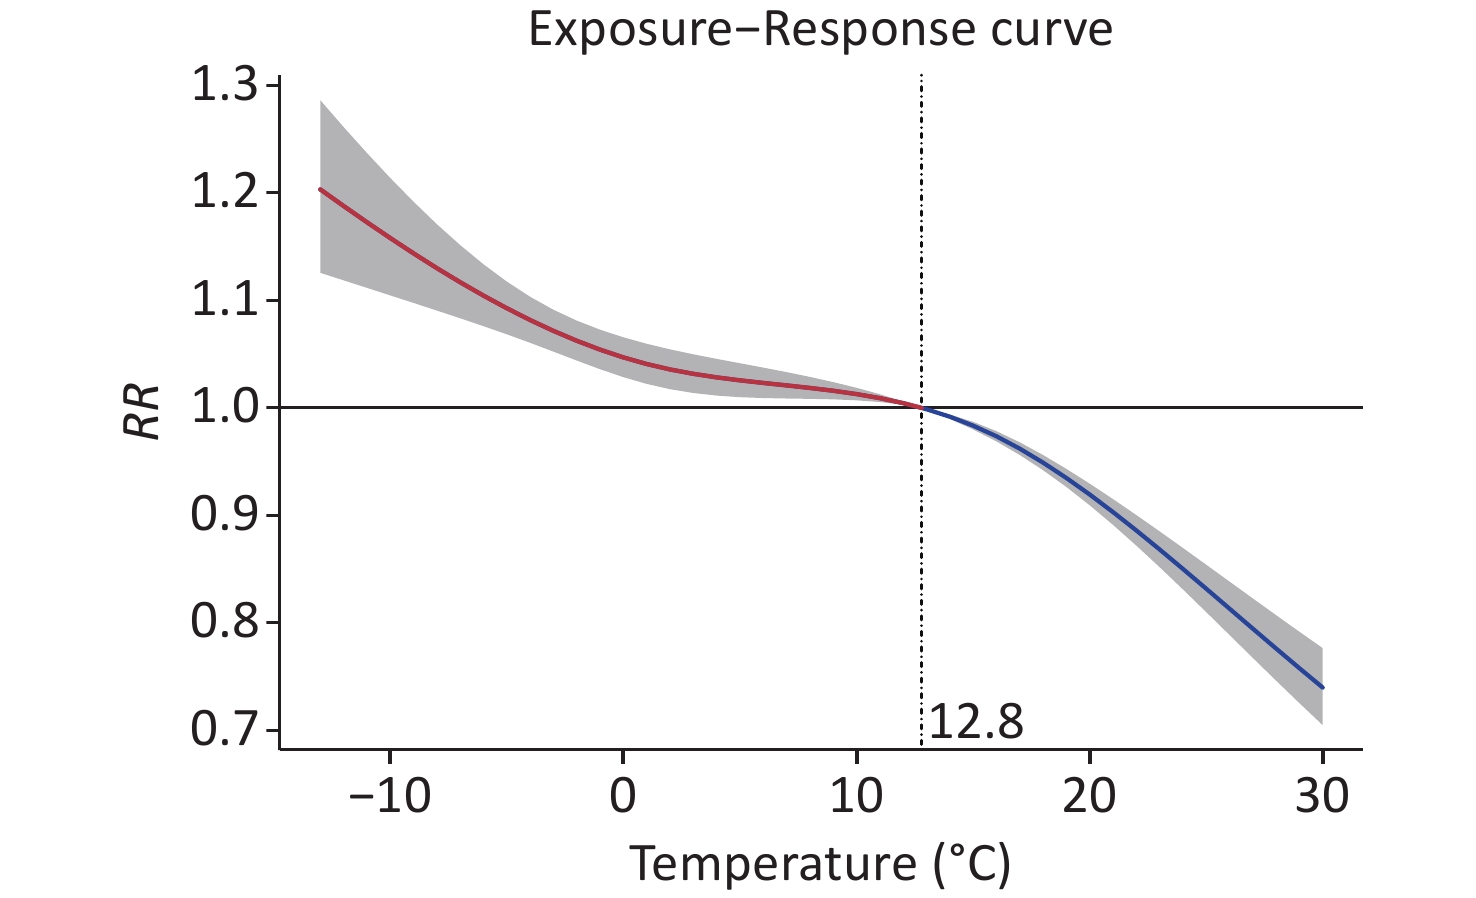
Figure 1 presents the exposure-response curve between the daily mean temperature and RR of respiratory diseases over 14 d. The curve resembled a “J-shape” and demonstrated a monotonically decreasing trend, with the highest RR value of 1.203 (95% CI: 1.126–1.286) observed at –13 °C. This result is consistent with those of studies conducted in Northwest[8] and Northeast China[4]. These areas all have a short summer, similar to Lanzhou, owing to climatic conditions or high latitudes.
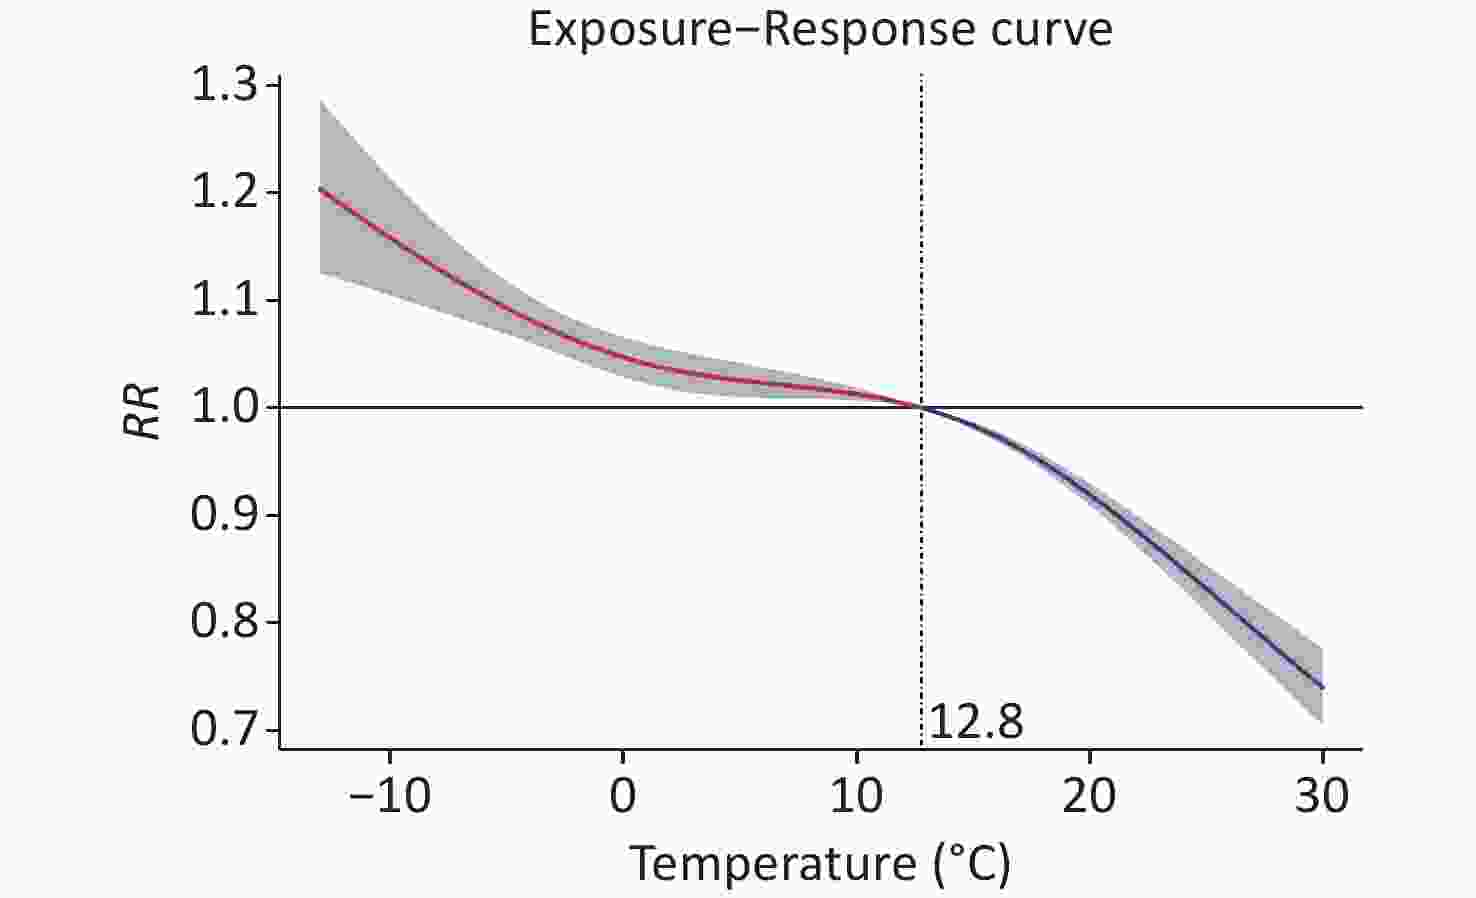
Figure 1. The exposure-response curve between the daily mean temperature and relative risk of respiratory diseases over 14 days. RR, relative risks.
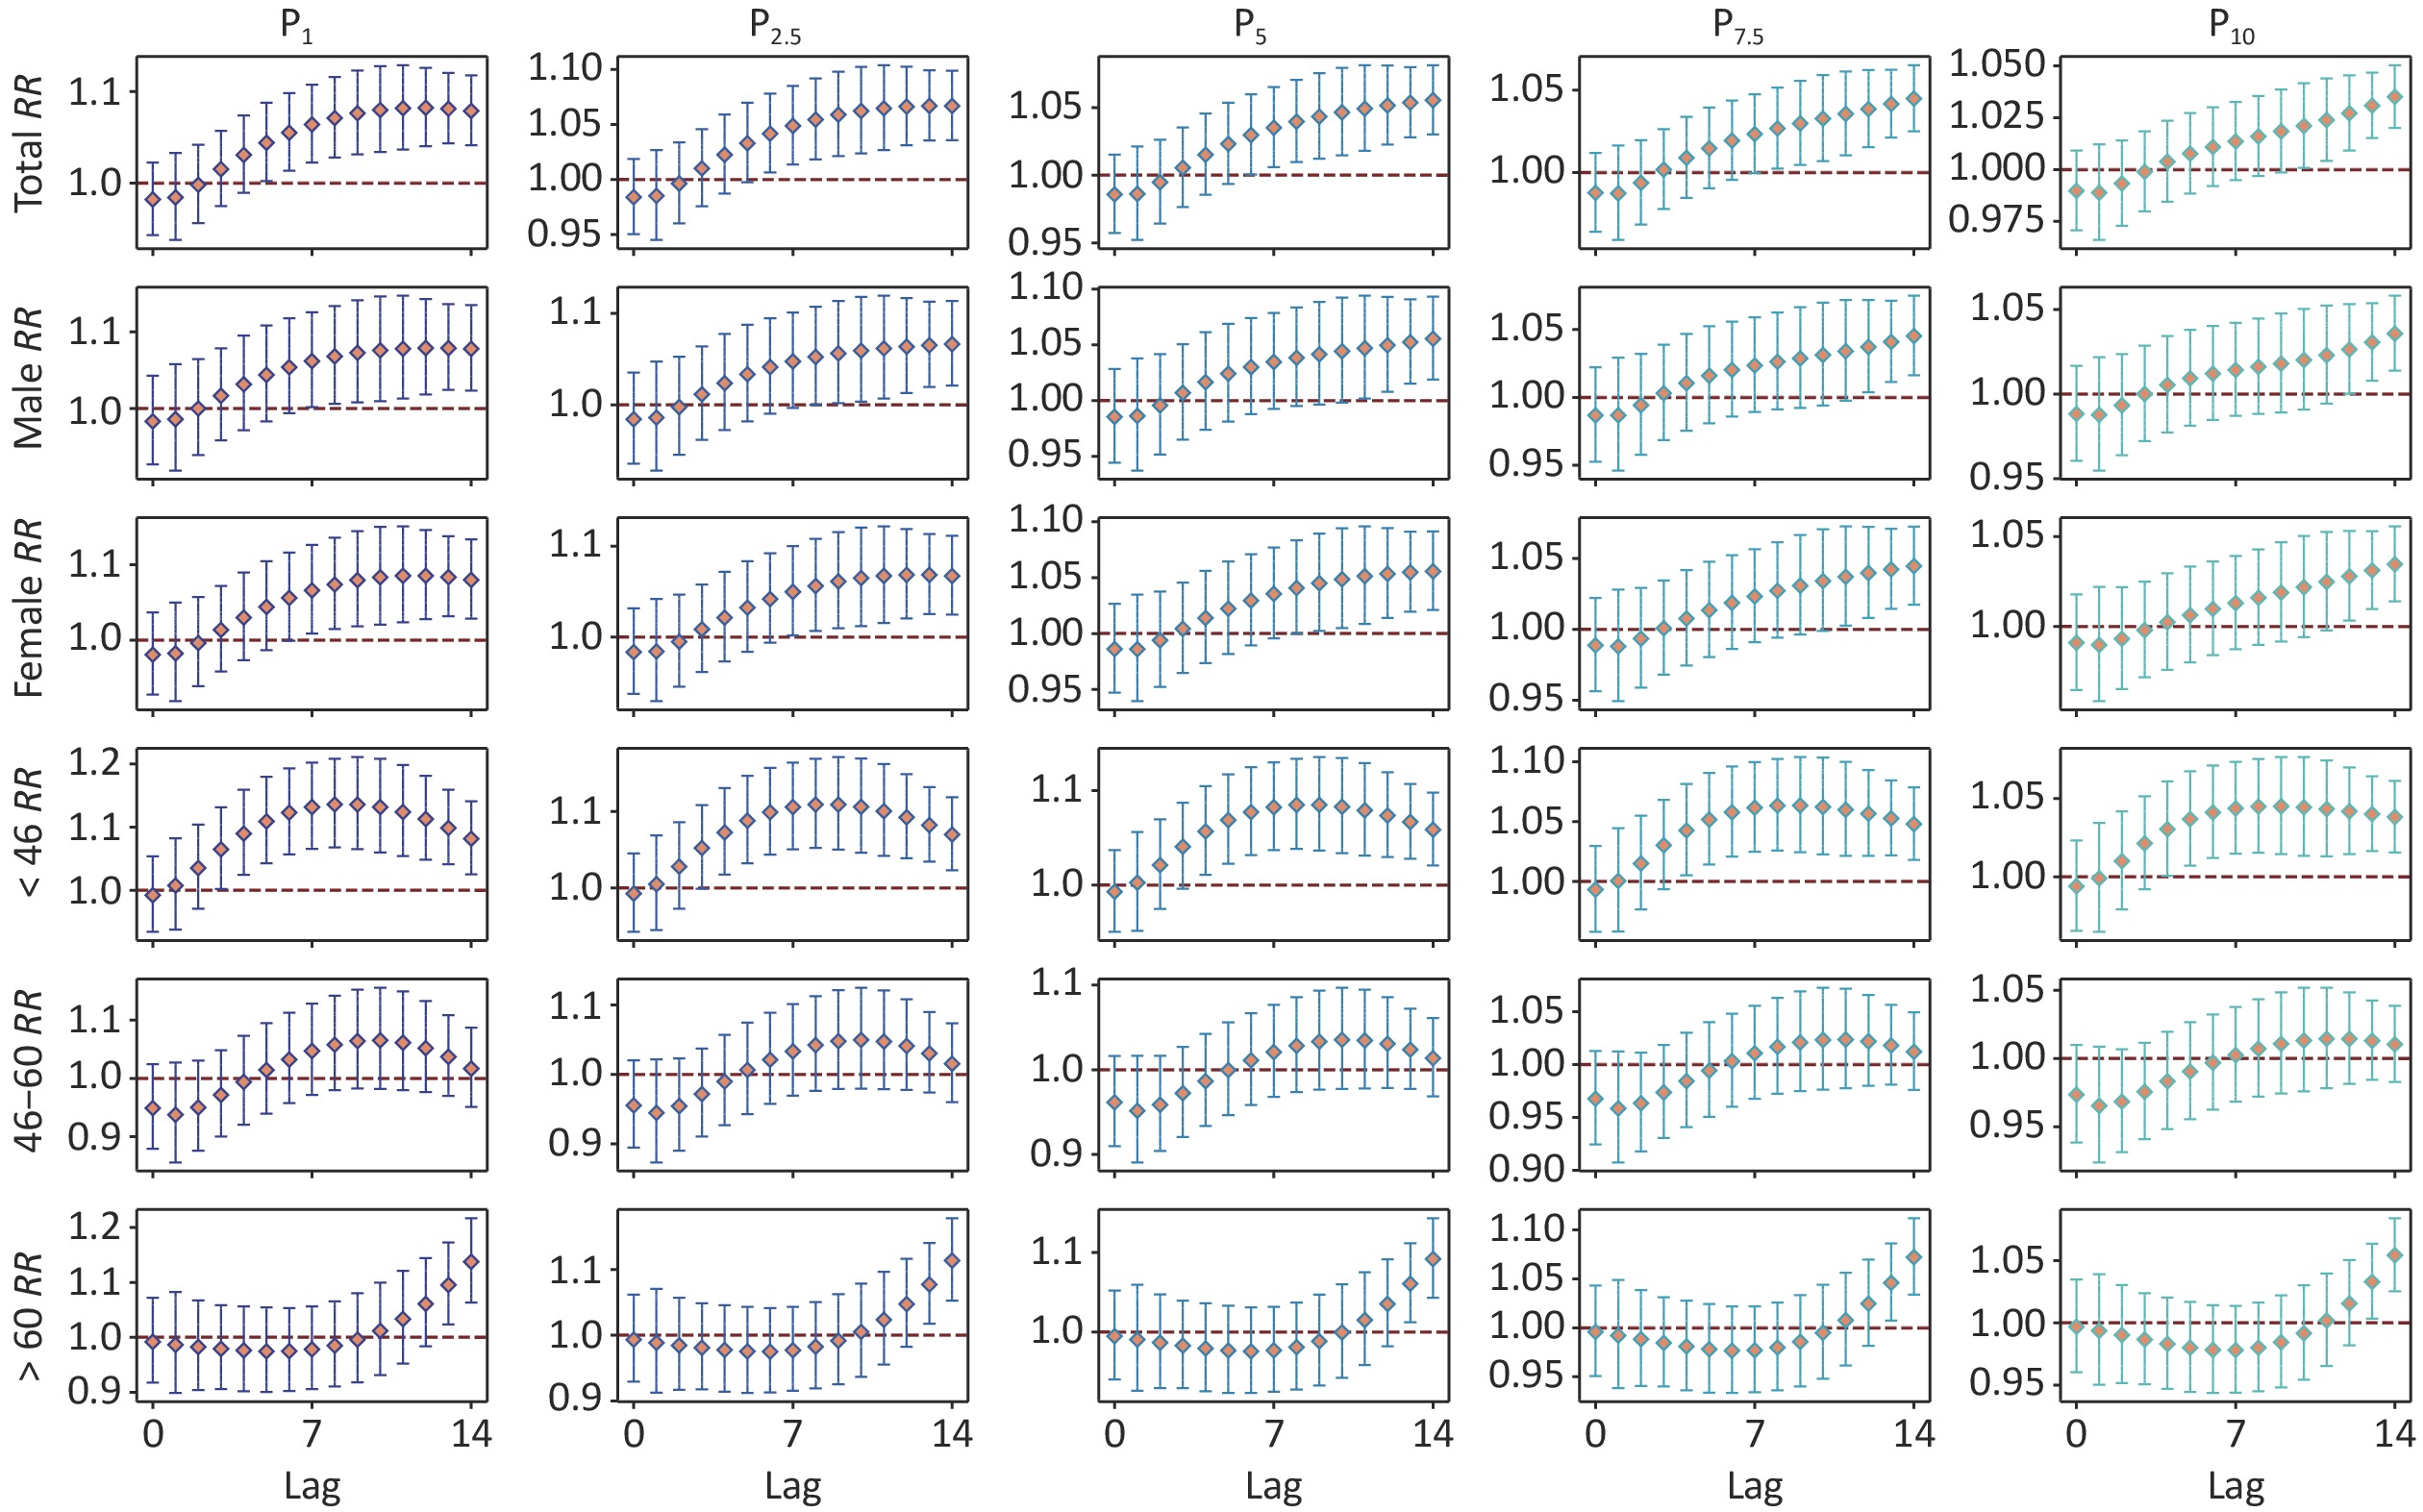
Figure 2 illustrates the cumulative RR of extremely low temperatures along the lag days for the different subgroups. For all groups, the RR values increased with a decrease in extremely low temperatures. Overall, the RR appeared extremum and presented a downward trend at P2.5 and P1, while exhibiting an upward trend at P10, P7.5, and P5. Among all extremely low temperatures, in comparison to males, females generally exhibited a higher RR and experienced more acute effects. In the age subgroups, people aged < 46 years and those aged > 60 years were significantly affected. Those below 46 years of age had an acute response to extremely low temperatures, whereas those over 60 years of age demonstrated significant hysteresis to low temperatures. No significant effect was identified for the subgroup of people aged 46–60 years. In Lanzhou, a high RR has been observed under extreme cold conditions due to frequent cold air activity and drastic cooling. Furthermore, individual differences in health risks due to extreme colds depend on psychological, occupational, and immune levels.
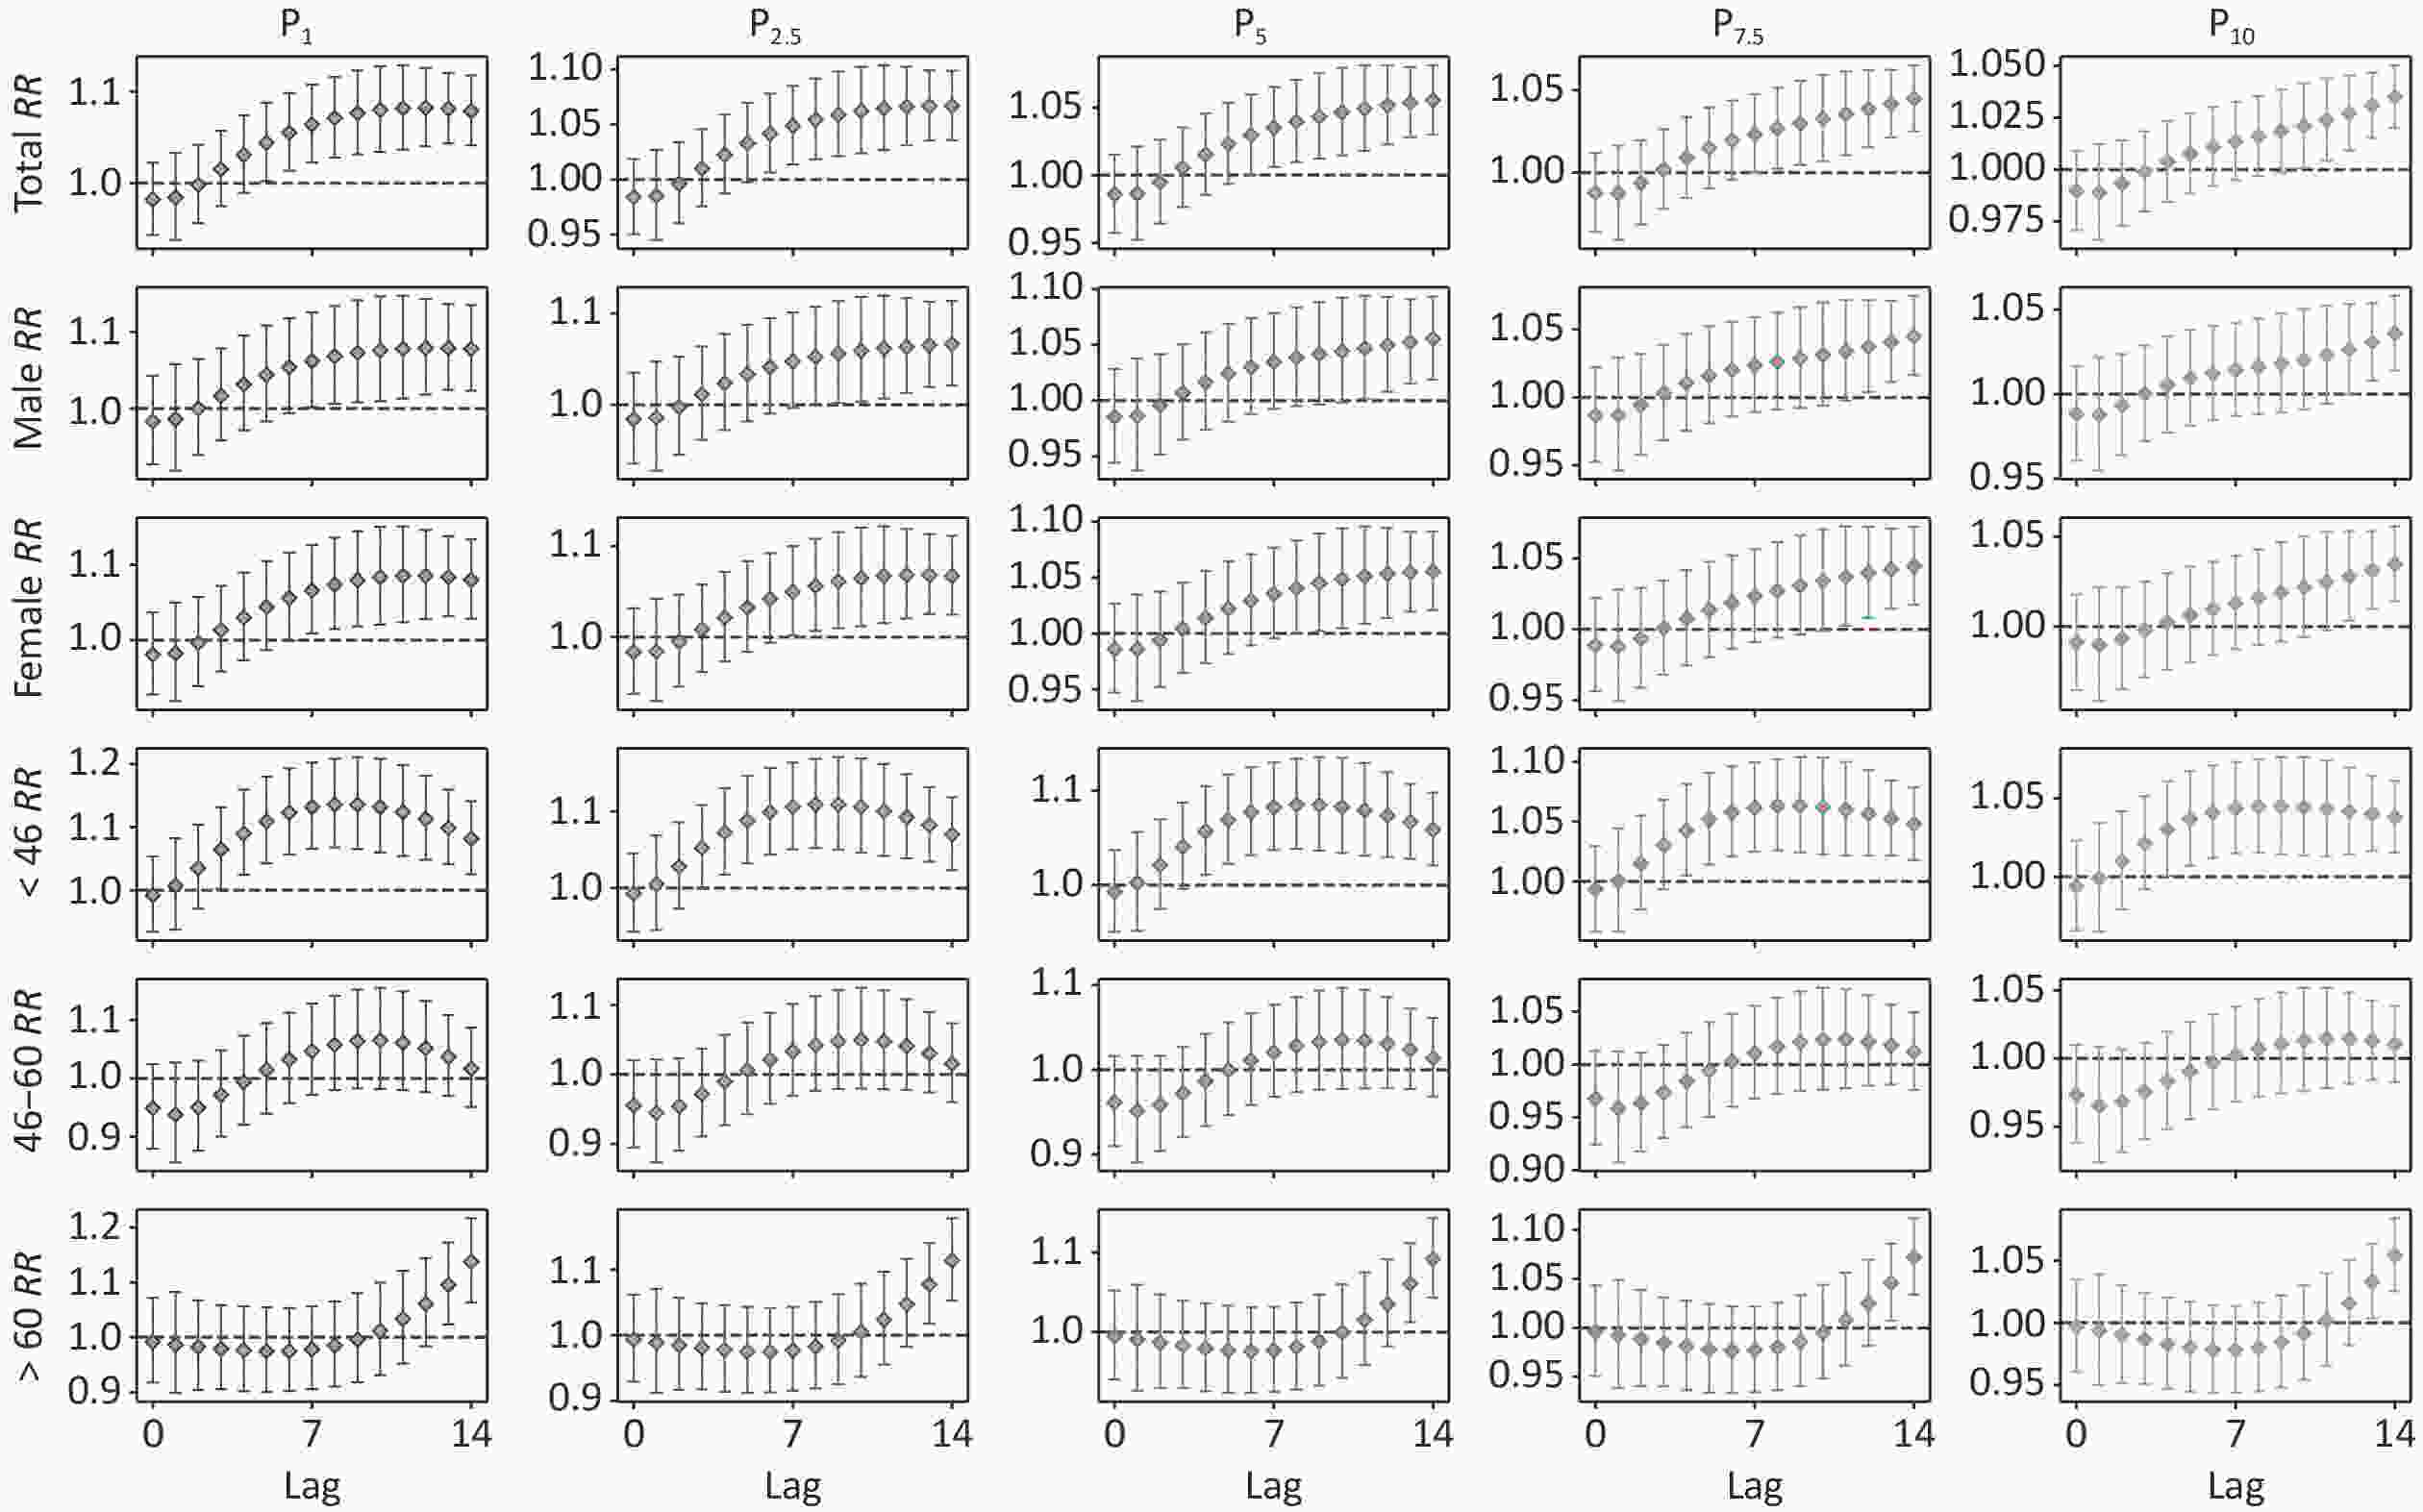
Figure 2. Effects of different extreme low temperatures on subgroups along 14 lags.
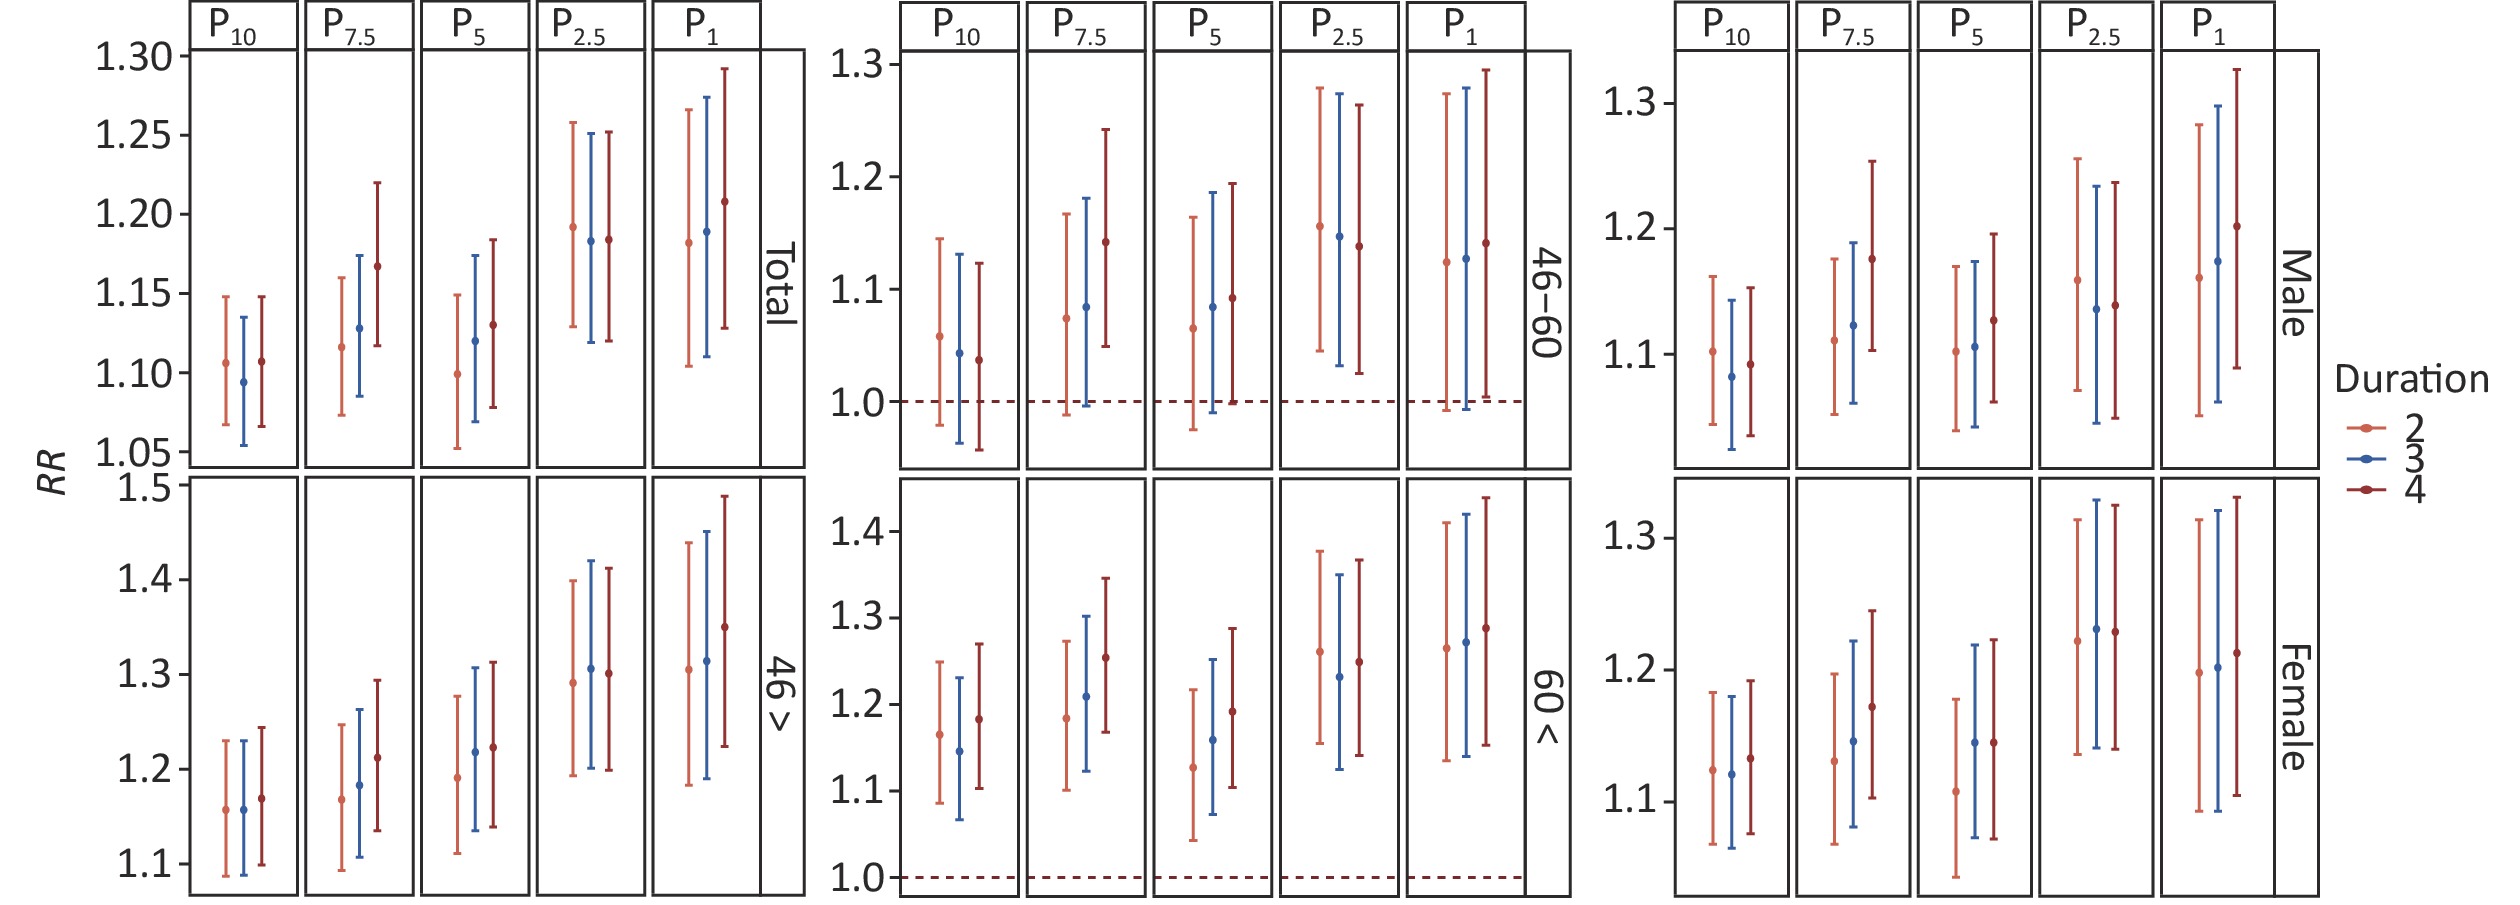
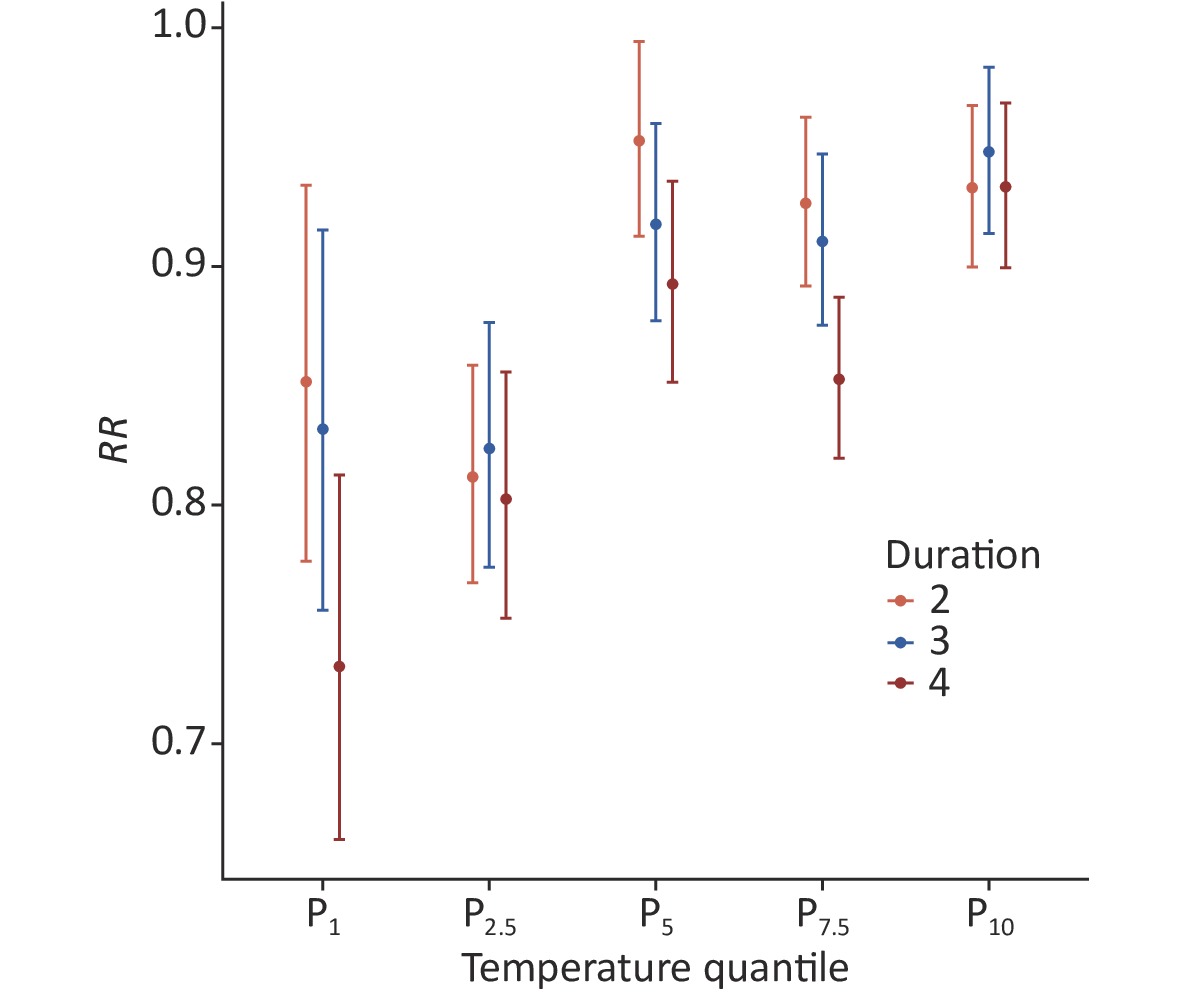
The statistical characteristics of the cold waves are listed in Supplementary Table S2 (available in www.besjournal.com), and Figure 3 illustrates the primary effects of cold waves. Overall, cold waves lasting for 4 d caused the highest risk under each threshold except P2.5, with a maximum RR of 1.208 (95% CI: 1.128–1.292) under P1 and 4 d. For males, cold waves lasting for 2 d had the highest risk under the thresholds of P10 and P2.5, whereas cold waves lasting for 4d caused the highest risk under the other thresholds. Cold waves of P1 & 4 d demonstrated the most significant risk, with an RR value of 1.202 (95% CI: 1.089–1.327). For females, cold waves lasting for 4 d had the strongest effect under all thresholds except P2.5. Furthermore, P2.5 & 3 d resulted in the most significant risk, with an RR value of 1.231 (95% CI: 1.141–1.329). Females are more sensitive to cold waves and have greater risks than males.
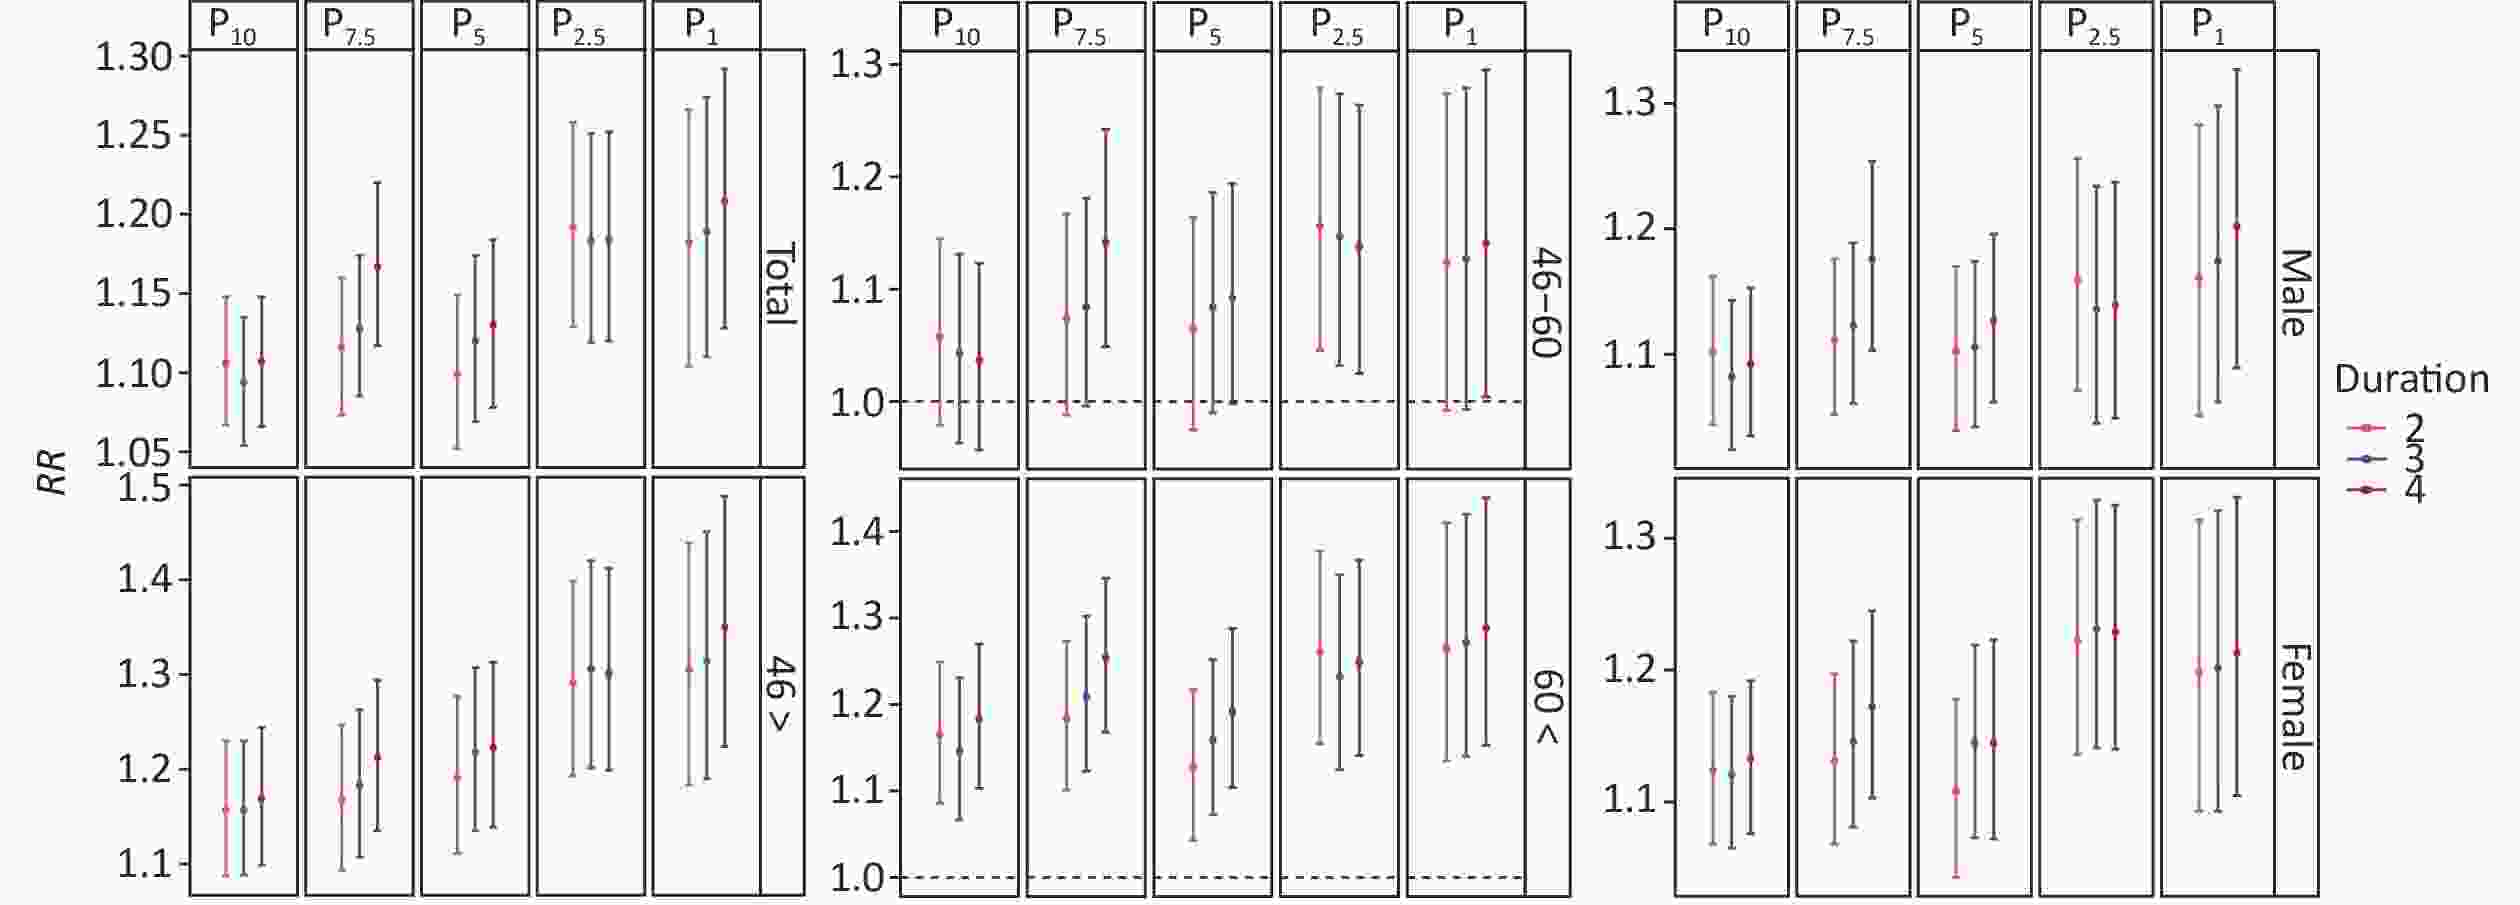
Figure 3. The primary effect of cold waves on different subgroups.
Threshold Duration Cold wave Days of cold wave Times of cold wave Average temperature (°C) 2 P1&2d 20 5 –10.11 P1 3 P1&3d 18 4 –10.16 4 P1&4d 15 3 –10.26 2 P2.5&2d 54 13 –8.03 P2.5 3 P2.5&3d 44 8 –8.39 4 P2.5&4d 38 6 –8.39 2 P5&2d 124 27 –6.62 P5 3 P5&3d 106 18 –6.82 4 P5&4d 94 14 –6.94 2 P7.5&2d 182 35 –5.87 P7.5 3 P7.5&3d 160 24 –6.11 4 P7.5&4d 139 21 –6.18 2 P10&2d 239 38 –5.33 P10 3 P10&3d 217 27 –5.47 4 P10&4d 208 20 –5.55 Table S2. The descriptive statistics of cold waves during 2012–2018
In the age subgroups, for individuals aged < 46 years, the RR values generally increased as the cold waves intensified, and the maximum RR was observed at P1 and 4 d, with a value of 1.350 (95% CI: 1.224–1.488). However, for those aged 46–60 years, the cold waves intensified the respiratory risk, making the primary effect (cold effect) significant, with P2.5 & 2 d displaying the highest impact with an RR of 1.156 (95% CI: 1.045–1.279). Among those aged > 60 years, P1 & 4 d had the most significant effect for individuals, with an RR of 1.288 (95% CI: 1.153–1.439). The RR of individuals aged > 60 years was generally higher than that of individuals aged < 46 years under P10 and P7.5, while the opposite was true under P5, P2.5, and P1. Therefore, indicating that strong cold waves were significantly pronounced for the younger individuals and mild cold waves had a great effect on the older adults. The added effect of cold waves was insignificant (Supplementary Figure S3, available in www.besjournal.com). The maximum RRs were not observed during the strongest cold wave for females and individuals aged 46–60 years. Similar results were reported in Beijing[6], possibly due to better protection against the cold and less outdoor activity. For an insignificant added effect, Song et al. determined that the RR of the cold period was primarily due to a drop in daily temperature[6].

Figure S3. The added effect of cold waves on the total respiratory visits.
Some mechanistic studies have indicated that both human metapneumovirus (hMPV) and respiratory syncytial virus (RSV) are negatively correlated with temperature, suggesting that an increased number of cases diagnosed with hMPV and RSV are detected when the temperature decreases. In addition to temperature, hMPV and RSV are also associated with wind speed and humidity[9]. Furthermore, cold exposure can weaken lung mechanisms, leading to a decline in immune function and resilience to pollutants, and can cause bronchoconstriction and congestion of airways, leading to the worsening of respiratory diseases, such as chronic obstructive pulmonary disease[10]. Additionally, large-scale population mixing can exacerbate the effects of the cold, leading to widespread disease transmission.
Our study has some limitations. First, we did not separately appraise the effect of cold air on people aged < 16 years due to the small sample size. Second, the meteorological data from the Meteorological Bureau may not represent personal exposure. Therefore, the results may have been biased.
Yuxia Ma designed and carried out the research; Zongrui Liu set up the models and analyzed the results; Yuhan Zhao and Pengpeng Qin analyzed the data; Wanci Wang, Haoran Jiao, and Bowen Cheng collected and assembled the data; and Yuhan Zhao and Yuxia Ma wrote and revised the manuscript.
The authors declare no conflict of interest. This article does not contain any studies with human participants or animals performed by any of the authors.
HTML
Reference

 Quick Links
 DownLoad: