


-
Water is essential for life and recreational activities, such as swimming and other water park activities. Different types of water sources, including municipal water supplies, well water, and surface water, undergo various treatments to remove impurities prior to use. In large amusement parks, the most common disinfection method for recreational water, such as fountain water and swimming pool water, is chlorination, which poses potential risks of disinfection by-products (DBPs) while cleaning water bodies[1,2]. Among the more than 700 DBPs identified to date, trihalomethanes (THMs) and haloacetic acids (HAAs) are carcinogens that may damage DNA, affect normal metabolism and cell division, and induce many types of tumors[3–5]. The International Agency for Research on Cancer (IARC) has not classified any individual DBPs as Group 1 human carcinogens, although several have been classified as possible (Group 2B; specifically, dichloroacetic acid, trichloroacetic acid, dibromoacetic acid, and bromochloroacetic acid) or probable (Group 2A; specifically, dichloromethane) human carcinogens[6,7].
Previous studies have shown that chronic exposure to or consumption of drinking water containing DBPs can cause adverse health outcomes such as respiratory, neurological, and reproductive disorders, but this association is sometimes insignificant[8–11]. Some studies have linked swimming in chlorinated treated water to DBP exposure and adverse health outcomes such as allergies and respiratory health effects[12–14]. However, further studies are needed to demonstrate the relationship between exposure to DBPs in reactional water and health outcomes for professional water personnel, including lifeguards, cleaning staff, and maintenance workers, despite their prolonged working hours and frequent contact with water.
This study aimed to quantitatively assess the health risks of DBP exposure to occupational populations in three large amusement parks in Shanghai (representatives of integrated parks, water parks, and amusement parks) through quantitative testing of typical DBPs and questionnaire surveys of key exposure parameters for employees of large amusement parks.
-
In this study, representatives were selected among the integrated parks, water parks, and amusement parks with recreational water rides in Shanghai, and they were referred to as Integrated Park A, Water Park B, and Amusement Park C, respectively. These three parks are among the top ten in Shanghai in terms of patronage and operate in a chain in China. To obtain accurate concentrations of DBPs in recreational water and spray, 25 landscape and recreational water sampling points and 114 spray sampling points in the three parks were sampled once a day for three consecutive days in October 2021, and the sampling time was chosen during the 13:00–14:00 hours of the day when the temperature was the highest. A total of 75 landscape and recreational water samples and 342 spray water samples were obtained from Integrated Park A (36 recreational water samples and 171 spray water samples), Water Park B (24 recreational water samples and 90 spray water samples), and Amusement Park C (15 recreational water samples and 81 spray water samples).
Seven typical DBPs were chosen for quantification, including five species of THMs—chloroform (TCM), bromodichloromethane (BDCM), dibromochloromethane (DBCM), bromoform (TBM), and dichloromethane (DCM)—and two species of HAAs—dichloroacetic acid (DCA) and trichloroacetic acid (TCA) (Supplementary Table S1, available in www.besjournal.com). The physicochemical information of the selected DBPs is provided in Supplementary Table S1.
The concentrations of the seven DBPs in the samples were determined according to standard examination methods for drinking water DBP parameters[15]. Filling column gas chromatography was used to determine the concentrations of TCM, TBM, BDCM, and DBCM; headspace gas chromatography to determine the concentration of DCM; and liquid-liquid extraction derivative gas chromatography to determine the concentrations of DCA and TCA.
Quality assurance/quality control (QA/QC) of water sample collection followed standard examination methods for drinking water: collection and preservation of water samples[16].
-
The health risk assessment of exposure to chlorinated DBPs in amusement parks refers to the method described in Technical Guidelines for Eco-Environmental Health Risk Assessment—General Principles, which includes four steps: Hazard identification, Exposure-response relationship evaluation, Exposure assessment, and Risk characterization[17].
-
According to the IARC of the World Health Organization, DCM is classified as group 2A (probably carcinogenic to humans) based on sufficient evidence of carcinogenicity in experimental animals and limited evidence of carcinogenicity in humans; TCM, DCM, and TCM are classified as group 2B[18,19]. In addition, DBCM, BDCM, and TBM, as typical DBPs, are similar in the exposure population and exposure pathways and are metabolized by cytochrome P450 in the liver, which could cause hepatotoxicity and nephrotoxicity when exposed to a high dose[19].
Therefore, DCM, TCM, DCM, TCM, DBCM, BDCM, and TBM were selected for subsequent quantitative risk assessment.
-
The carcinogenic and non-carcinogenic effects of the seven DBPs were identified, and their toxicological parameters were obtained by querying two toxicological databases, the Integrated Risk Information System (IRIS) and Regional Screening Levels (RSLs), which belong to the United States Environmental Protection Agency (EPA).
-
To accurately determine the exposure parameters of the occupational population exposed to water, a questionnaire was administered to occupational employees in three large amusement parks in Shanghai in October 2021. One hundred and twenty-nine questionnaires were sent out to all occupational water employees, which 126 were returned, with a recovery rate of 97.7%. The skin surface area of the study population was calculated according to the main water contact sites reported by the participants, and then the skin surface area of different locations was filled according to the Exposure Factors Handbook of the Chinese Population: Adults[20]. The physical activity scores of the participants were calculated and divided into three grades according to the International Physical Activity Questionnaire (IPAQ): light, medium, and heavy. The short-term respiratory volume was then filled according to the manual of exposure parameters for different sexes and physical activities in Shanghai. The skin surface area and short-term respiratory volume parameters of the different sexes in Shanghai are listed in Supplementary Table S2 (available in www.besjournal.com).
The exposure pathways include dermal contact, oral ingestion, and inhalation. The dermal contact frequency (Fdermal, h·d−1), ingestion contact frequency (Fingest, mL·d−1), and inhalation contact frequency (Finhale, L·d−1) were calculated using Eqs. (1), (2), and (3), respectively.
$$ \begin{array}{c}{F}_{dermal}={ET}_{d}\times {EF}_{d}\end{array} $$ (1) $$ \begin{array}{c}{F}_{ingest}=EV\times {EF}_{g}\end{array} $$ (2) $$ \begin{array}{c}{F}_{inhale}={ET}_{d}\times {EF}_{h}\times SRV\end{array} $$ (3) Where ETd is the average dermal contact time in slack and peak seasons (min), EFd is the intermediate dermal contact frequency in slack and peak seasons (d−1), EV is the average water swallowing volume in slack and peak seasons (mL), EFg is the intermediate swallowing frequency in slack and peak seasons (d−1), ETd is the average inhalation contact time in slack and peak seasons (min), EFg is the intermediate inhalation contact frequency in slack and peak seasons (d−1), and SRV is the short-term respiratory volume (L·min−1).
The concentrations of the seven typical DBPs in the samples were determined quantitatively and compared with the detection limits. The TBM and DCM concentrations were below the detection limit; therefore, they were not included in the subsequent analysis.
Daily exposure under the two scenarios of central tendency exposure (CTE) and reasonable maximum exposure (RME) was calculated according to the median and 95th percentile (P95) of each exposure parameter.
According to the questionnaire results, the employees’ working hours were 8 hours/day and 5 days/week. Therefore, the exposure time was taken as the statutory working hours of 250 days/year. The average life expectancy in Shanghai was 84.11 years, or 30,700.15 days, according to the latest announcement by the Shanghai Health Commission[21]. The skin surface areas and concentrations of the five DBPs were substituted into Eqs. (4), (5), and (6). Among the three exposure routes, landscape recreational water was used to detect the dermal contact concentration (ADDdermal, mg·kg−1·d−1) and the ingestion contact concentration (ADDingest, mg·kg−1·d−1), and spray was used to detect the inhalation contact concentration (ADDinhale, mg·kg−1·d−1).
$$ \begin{array}{c}{ADD}_{dermal}=\dfrac{C\times I\times SA\times {F}_{dermal}\times EF\times ED\times {f}_{1}}{BW\times AT}\end{array} $$ (4) $$ \begin{array}{c}{ADD}_{ingest}=\dfrac{C\times {F}_{ingest}\times EF\times ED\times {f}_{2}}{BW\times AT}\end{array} $$ (5) $$ \begin{array}{c}{ADD}_{inhale}=\dfrac{C\times {F}_{inhale}\times EF\times ED\times {V}_{a}}{BW\times AT}\end{array} $$ (6) Where C is the pollutant concentration in water (mg·L−1), I is the skin permeability coefficient (cm·h−1), SA is the skin surface area (cm2), EF is the exposure frequency (d·y−1), ED is the exposure duration (y), f1 is the conversion factor (10−3 L·cm−3), BW is the average weight of the population (kg), AT is the life expectancy (life expectancy in years × 365 d), f2 is the conversion factor (10−3 mL·L−1), and Va is the volume ratio by which a spray is converted from water (unitless), estimated as 3.2 × 10⁻⁵, as indicated in Supplementary Table S3 (available in www.besjournal.com).
The exposure concentration of each DBP was calculated according to the above three formulas, and then added to calculate the total daily average exposure.
-
According to the EPA recommendations, the calculation formulas for the carcinogenic and non-carcinogenic risks of a single substance are Eqs. (7) and (8), respectively.
$$ \begin{array}{c}HQc=ADD\times SF\end{array} $$ (7) $$ \begin{array}{c}HQn=\dfrac{ADD}{RfD}\end{array} $$ (8) Where HQc is the carcinogenic risk hazard quotient (unitless), HQn is the non-carcinogenic risk hazard quotient (unitless), ADD is the average daily exposure of pollutants (mg·kg−1·d−1), SF is the carcinogenic slope factor (unitless), and RfD is the reference dose (mg·kg−1·d−1).
To determine the carcinogenic risk of multiple pollutants, the carcinogenic risk of pollutants with the same outcome pathway (AOP) was calculated by grouping. The relative potency factor (RPF, unitless) was used to calculate the carcinogenic and non-carcinogenic risks of combined exposure to various DBPs, according to Eqs. (10) and (11).
$$ RPF=\frac{{PoD}_{index}}{{PoD}_{specific}} $$ (9) $$ HQc=\sum \left({RPF}_{i}\times {ADD}_{i}\times {SF}_{i}\right) $$ (10) $$ HQ=\sum {RPF}_{i}\times \frac{{ADD}_{i}}{{RfD}_{i}} $$ (11) Where PoDindex is the critical action starting point for the designated pollutant in this group, PoDspecific is the essential step starting point of a pollutant in this group, RPFi is the relative efficiency factor of the ith pollutant (unitless), ADDi is the average daily exposure of the ith adulteration (mg·kg−1·d−1), SFi is the carcinogenic slope factor of the ith pollutant (unitless), and RfDi is the reference dose of the ith pollutant (mg·kg−1·d−1). The risks of DBPs were weighted by choosing TCA as the designated pollutant, as SF of TCA among the five DBPs is relatively large; that is, the carcinogenic effect is relatively strong.
Monte Carlo simulation is a statistical method of probability sampling that is often used to evaluate uncertainty in risk assessment. In this study, iterative sampling (n = 10,000) was performed according to the distribution of exposure parameters obtained, and the probability distribution of exposure and health risks of the five DBPs among occupational water employees in the three large amusement parks in Shanghai was obtained. Uncertain variables and parameters were analyzed during the evaluation, and exposure was simulated by repeated sampling.
-
Crystal Ball 11.1.2.4.900 was used to perform the Monte Carlo probabilistic risk assessment. The possible distribution types of the exposure parameters were obtained by fitting the distribution of the exposure parameters. Custom distributions of skin surface area and respiration were obtained according to the Exposure Factors Handbook of the Chinese Population (Adults).
-
This study was approved by the Shanghai Municipal Center for Disease Control and Prevention Ethical Review Committee.
-
The primary characteristics of the study population, including 58 participants from Integrated Park A, 37 from Water Park B, and 31 from Amusement Park C, are shown in Table 1. The average age of employees was 32.93 ± 5.38 years old; 66.7% were male, 55.6% had a bachelor’s degree or above, and 9.5% were foreigners.
Characteristics Integrated Park A (n = 58) Water Park B (n = 37) Amusement Park C (n = 31) Total Population (n = 126) Age (years) 34.32 ± 6.35 31.76 ± 3.35 31.72 ± 4.86 32.93 ± 5.38 Height (cm) 171.38 ± 9.52 169.92 ± 6.87 173.71 ± 9.66 171.52 ± 8.90 Weight (kg) 69.40 ± 13.12 63.86 ± 12.78 76.74 ± 10.29 69.58 ± 13.17 Sex, n (%) Male 35 (60.3) 18 (48.6) 31 (100.0) 84 (66.7) Female 23 (39.7) 19 (51.4) 0 (0) 42 (33.3) Education level, n (%) High School and below 8 (13.8) 4 (10.8) 19 (61.3) 31 (24.6) Junior College 9 (15.5) 9 (24.3) 7 (22.6) 25 (19.8) Bachelor’s degree or above 41 (70.7) 24 (64.9) 5 (16.1) 70 (55.6) Nationality, n (%) China 50 (86.2) 33 (89.2) 31 (100.0) 114 (90.5) Foreign 8 (13.8) 4 (10.8) 0 (0) 12 (9.5) Table 1. Basic demographic characteristics of employees in the large amusement parks
-
The exposure parameters of employees in the amusement parks were calculated using a questionnaire, as shown in Table 2. The average body weight of employees was 69.58 ± 13.17 kg, and the medium duration of employment was 10.66 ± 5.47 years. More than half of the employees reported that they did not consume or swallow water from the digestive tract during landscape entertainment activities in the amusement parks.
Parameters Mean Standard deviation P5 P25 P50 P75 P95 Weight (kg) 69.58 13.17 49.25 60.25 68.50 79.00 91.00 Length of service (years) 10.66 5.47 2.25 6.00 10.00 14.00 19.75 The surface area of skin (m2) 0.32 0.25 0.08 0.12 0.13 0.63 0.65 Frequency of skin exposure (h/d) 0.94 1.13 0.04 0.25 0.38 1.09 3.33 Frequency of swallowing exposure (mL/d) 4.77 15.56 0.00 0.00 0.00 0.67 29.25 Frequency of respiratory exposure (L/D) 307.12 325.38 0.00 64.00 152.25 512.00 909.12 Table 2. Exposure parameters of employees in the large amusement parks
The detection rates and concentrations of the seven DBPs in the samples are listed in Table 3. The detected concentrations of TBM and DCM in all samples were below the limit of detection (LOD). The detection rate for TCA was 100%, and those of TCM, BDCM, DBCM, and DCA were 30.3%, 18.2%, 18.2%, and 54.5%, respectively. In landscape water of Park C, the detection rates of TCM, BDCM, and DBCM were all 12.5%, that for DCA was 100%, and that for all the four substances detected simultaneously was 80.0%. In spray water samples, these four substances were detected only in Integrated Park A, with a detection rate of 2.7%.
DBPs Integrated Park A Water Park B Amusement Park C Recreational water Spray Recreational water Spray Recreational water Spray Detection rate (%) TCM 30.3 2.7 12.5 0 80.0 0 BDCM 18.2 2.7 12.5 0 80.0 0 DBCM 18.2 2.7 12.5 0 80.0 0 TBM 0 0 0 0 0 0 DCM 0 0 0 0 0 0 DCA 54.5 2.7 100.0 0 80.0 0 TCA 100.0 100.0 100.0 100.0 100.0 100.0 Detection concentrations (μg/L) TCM 2.44 ± 1.81 5.30 ± 0.36 3.13 ± 0.15 — 3.61 ± 0.61 — BDCM 3.12 ± 1.42 4.67 ± 0.21 2.43 ± 0.23 — 2.90 ± 0.48 — DBCM 1.53 ± 0.59 2.20 ± 0.10 1.73 ± 0.35 — 1.86 ± 0.40 — TBM — — — — — — DCM — — — — — — DCA 24.65 ± 20.43 14.47 ± 0.15 19.65 ± 11.65 — 19.80 ± 9.13 — TCA 15.36 ± 18.79 4.97 ± 2.35 19.77 ± 11.43 5.17 ± 2.13 16.57 ± 12.11 4.99 ± 2.17 Note. DBPs, chlorination disinfection by-products; TCM, trihalomethanes chloroform; BDCM, bromodichloromethane; DBCM, dibromochloromethane; TBM, bromoform; DCM, dichloromethane; DCA, dichloroacetic acid; TCA, trichloroacetic acid. Table 3. The detection rate and concentrations of the seven typical DBPs in the water and spray samples
According to the Standard for Drinking Water (GB 5749-2022), the detected concentrations of the seven substances were below the concentration limits. The concentrations of DCA and TCA were the highest, whereas those of TCM, BDCM, and DBCM were the lowest. The concentrations of TBM and DCM were below the LOD.
The results of the total ADD for single pollutant exposure are shown in Table 4. The total ADD of the five DBPs was approximately 10−8 orders of magnitude in the CTE exposure scenario and 10−6 orders of magnitude in the RME exposure scenario. The total ADD to DBCM was the lowest, and that to DCA was the highest.
DBPs CTE scenario RME scenario Skin Digestive tract Respiratory tract Total exposure Skin Digestive tract Respiratory tract Total exposure TCM 1.20 × 10⁻⁸ 0 3.07 × 10⁻⁸ 4.27 × 10⁻⁸ 7.81 × 10⁻⁷ 7.83 × 10⁻⁹ 2.73 × 10⁻⁷ 1.06 × 10⁻⁶ BDCM 6.65 × 10⁻⁹ 0 2.70 × 10⁻⁸ 3.37 × 10⁻⁸ 4.33 × 10⁻⁷ 7.37 × 10⁻⁹ 2.40 × 10⁻⁷ 6.80 × 10⁻⁷ DBCM 2.90 × 10⁻⁹ 0 1.27 × 10⁻⁸ 1.56 × 10⁻⁸ 1.89 × 10⁻⁷ 4.47 × 10⁻⁹ 1.13 × 10⁻⁷ 3.06 × 10⁻⁷ DCA 1.52 × 10⁻⁸ 0 8.38 × 10⁻⁸ 9.90 × 10⁻⁸ 9.89 × 10⁻⁷ 5.59 × 10⁻⁸ 7.44 × 10⁻⁷ 1.79 × 10⁻⁶ TCA 1.47 × 10⁻⁸ 0 2.92 × 10⁻⁸ 4.39 × 10⁻⁸ 9.56 × 10⁻⁷ 4.51 × 10⁻⁸ 2.59 × 10⁻⁷ 1.26 × 10⁻⁶ Note. DBPs, chlorination disinfection by-products; TCM, trihalomethanes chloroform; BDCM, bromodichloromethane; DBCM, dibromochloromethane; DCA, dichloroacetic acid; TCA, trichloroacetic acid; CTE, central tendency exposure; RME, reasonablemaximum exposure. Table 4. Average daily soses of the five DBPs by different routes (mg·kg−1·d−1)
-
Of the seven toxic parameters, the main target organ, reference dose (RfD), reference concentration (RfC), and carcinogenic slope factor (SF) were referenced from the EPA IRIS, and the percutaneous absorption coefficient (Kp), regional screening levels (RSL), and critical role start points (PoD) were referenced from the EPA RSLs. The properties and toxicity parameters of the seven typical DBPs are listed in Table 5.
Abbreviation Main target organ RfD RfC SF (mg·kg−1·d−1) Kp (cm/hr) RSL (μg/L) PoD (mg·kg−1·d−1) PoD Limits* (mg/L) TBM Liver 0.010 0.0310 0.00683 0.221 1.00 BMD 0.06 BDCM Kidneys Liver 0.020 0.0620 0.00402 0.134 17.90 LOAEL 0.06 DBCM Liver 0.020 0.0840 0.00289 0.871 21.40 NOAEL 0.10 TBM Liver 0.020 0.0079 0.00235 3.290 17.90 NOAEL 0.10 DCM Liver 0.006 0.600 0.0020 0.00354 11.400 0.19 BMD 0.02 DCA Nervous System
Reproductive
system Liver0.004 0.0480 0.00121 1.530 12.5 LOAEL 0.05 TCA Liver 0.020 0.0670 0.00145 1.090 18.00 BMD 0.10 Note. *Refers to GB 5749-2022 Standards for drinking water quality. RfD, reference dose; RfC, reference concentration; SF, slope factor; Kp, percutaneous absorption coefficient; RSL, regional screening levels; PoD, critical role start points; TBM, bromoform; BDCM, bromodichloromethane; DBCM, dibromochloromethane; DCM, dichloromethane; DCA, dichloroacetic acid; TCA, trichloroacetic acid. Table 5. The properties and toxicity parameters of the seven typical DBPs
The results of the CTE and RME exposure scenarios are presented in Table 6. The HQc and HQn values of the five DBPs were below the cut-off values (10−6 and 1, respectively) in the CTE and RME exposure scenarios. The health risks associated with the two HAAs were slightly higher than those associated with the other three THMs.
DBPs HQc HQn CTE RME CTE RME TCM 1.32 × 10⁻⁹ 3.29 × 10⁻⁸ 4.27 × 10⁻⁶ 1.06 × 10⁻⁴ BDCM 2.09 × 10⁻⁹ 4.22 × 10⁻⁸ 1.68 × 10⁻⁶ 3.40 × 10⁻⁵ DBCM 1.31 × 10⁻⁹ 2.57 × 10⁻⁸ 7.82 × 10⁻⁷ 1.53 × 10⁻⁵ DCA 4.75 × 10⁻⁹ 8.59 × 10⁻⁸ 2.47 × 10⁻⁵ 4.47 × 10⁻⁴ TCA 2.94 × 10⁻⁹ 8.44 × 10⁻⁸ 2.19 × 10⁻⁶ 6.30 × 10⁻⁵ Note. DBPs, chlorination disinfection by-products; CTE, central tendency exposure; RME, reasonable maximum exposure; TCM, trihalomethanes chloroform; BDCM, bromodichloromethane; DBCM, dibromochloromethane; DCA, dichloroacetic acid; TCA, trichloroacetic acid. Table 6. HQc and HQn of single DBP
The HQc and HQn of TCM were magnified when TCA was used as the designated substance. The risks of the other four substances were weighed, and TCA was selected as the designated substance. The risks were calculated according to the two exposure scenarios, CTE and RME, and the results are shown in Table 7. The HQc and HQn of combined exposure to five DBPs were calculated and reported using TCA as the designated substance, which was 4.08 × 10⁻⁹ and 1.25 × 10⁻⁵ in the CTE scenario, respectively; and 1.44 × 10⁻⁷ and 4.37 × 10⁻⁴ in the RME scenario, respectively. When calculating the combined exposure risk, the HQc threshold can be relaxed to 10−4; therefore, the risks involved are acceptable.
DBPs PoD (mg·kg−1·d−1) Weighted HQc Weighted HQn CTE RME CTE RME TCM 1.0 2.38 × 10⁻⁸ 5.92 × 10⁻⁷ 7.68 × 10⁻⁵ 1.91 × 10⁻³ BDCM 17.9 2.10 × 10⁻⁹ 4.24 × 10⁻⁸ 1.69 × 10⁻⁶ 3.42 × 10⁻⁵ DBCM 21.4 1.11 × 10⁻⁹ 2.17 × 10⁻⁸ 6.58 × 10⁻⁷ 1.29 × 10⁻⁵ DCA 12.5 6.84 × 10⁻⁹ 1.24 × 10⁻⁷ 3.56 × 10⁻⁵ 6.44 × 10⁻⁴ TCA 18.0 2.94 × 10⁻⁹ 8.44 × 10⁻⁸ 2.19 × 10⁻⁶ 6.30 × 10⁻⁵ Total 3.68 × 10⁻⁸ 8.65 × 10⁻⁷ 1.17 × 10⁻⁴ 2.67 × 10⁻³ Note. DBPs, chlorination disinfection by-products; PoD, critical role start points; CTE, central tendency exposure; RME, reasonable maximum exposure; TCM, trihalomethanes chloroform; BDCM, bromodichloromethane; DBCM, dibromochloromethane; DCA, dichloroacetic acid; TCA, trichloroacetic acid. Table 7. HQc and HQn of multiple substances (TCA as the Designated Substance)
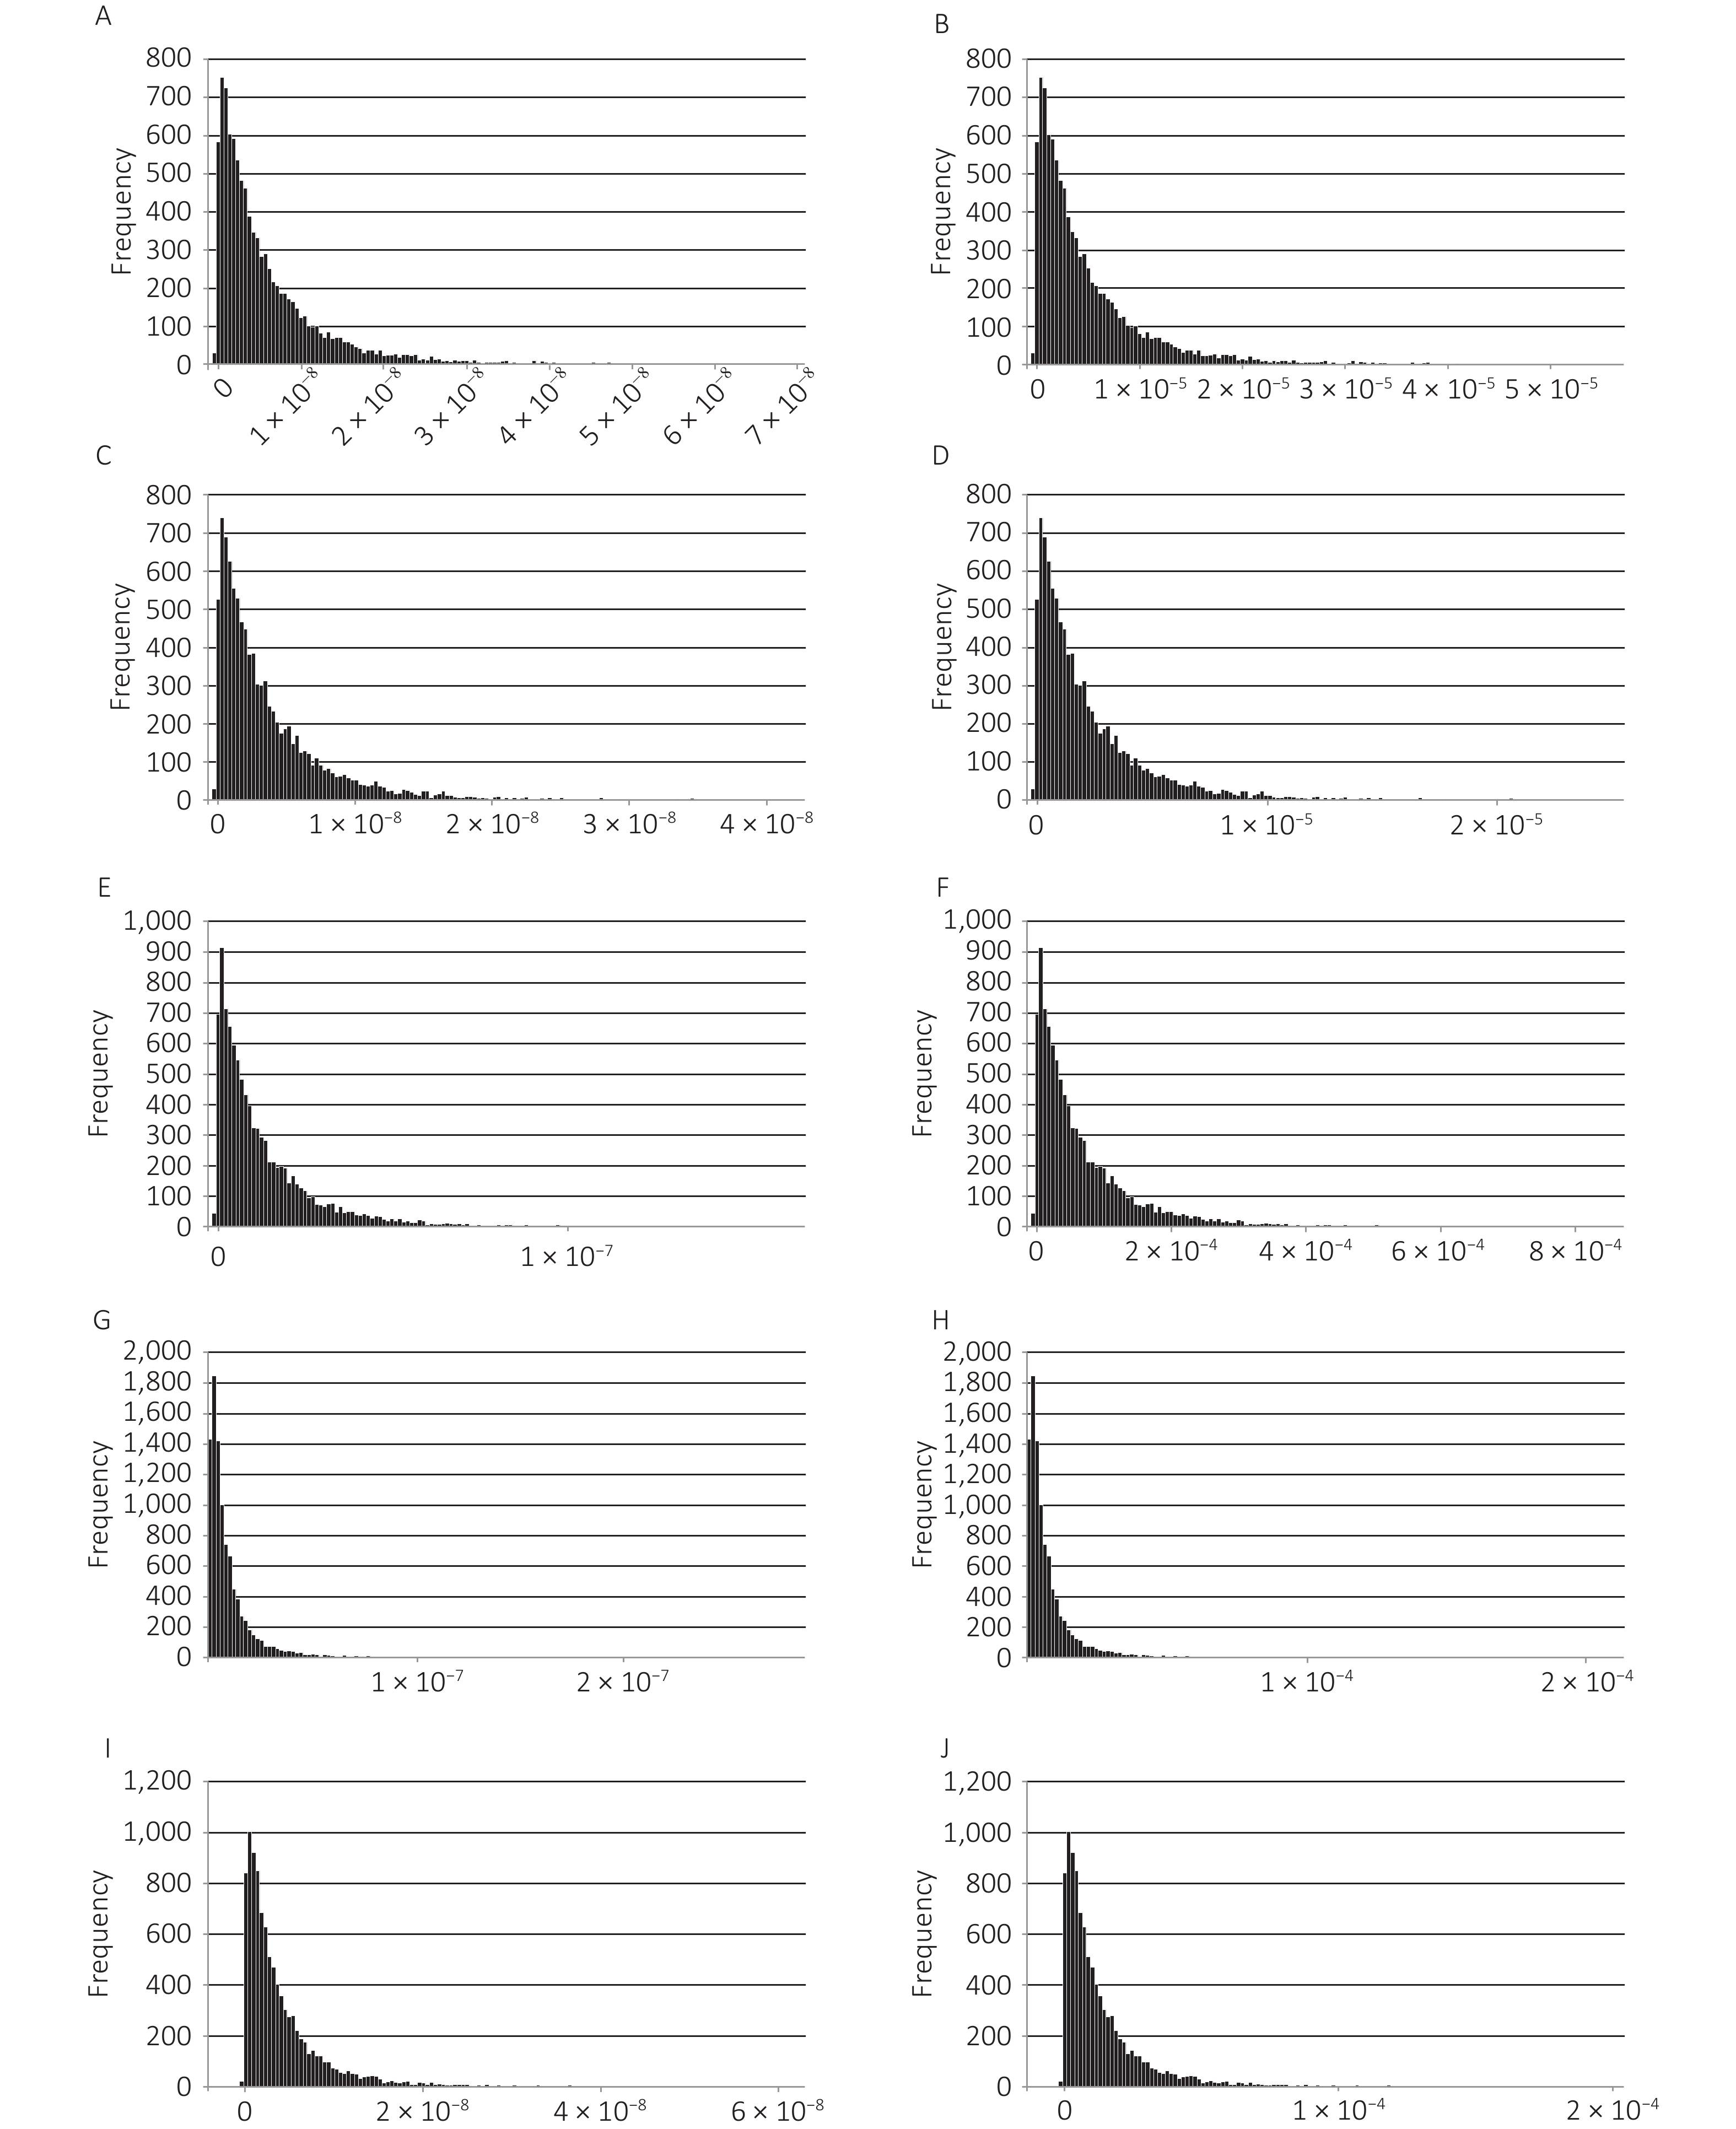
A Monte Carlo model was used to assess the carcinogenic and non-carcinogenic risks of the five DBPs. As shown in Figure 1, the distribution of the HQc was positively skewed, with the median carcinogenic risk being in the order of 10−9, and 95% of the quantiles of carcinogenic risk were in the order of 10−8. The HQn values of the five DBPs exhibited positively skewed distributions. The median HQn was in the order of 10−6, except for DCA.
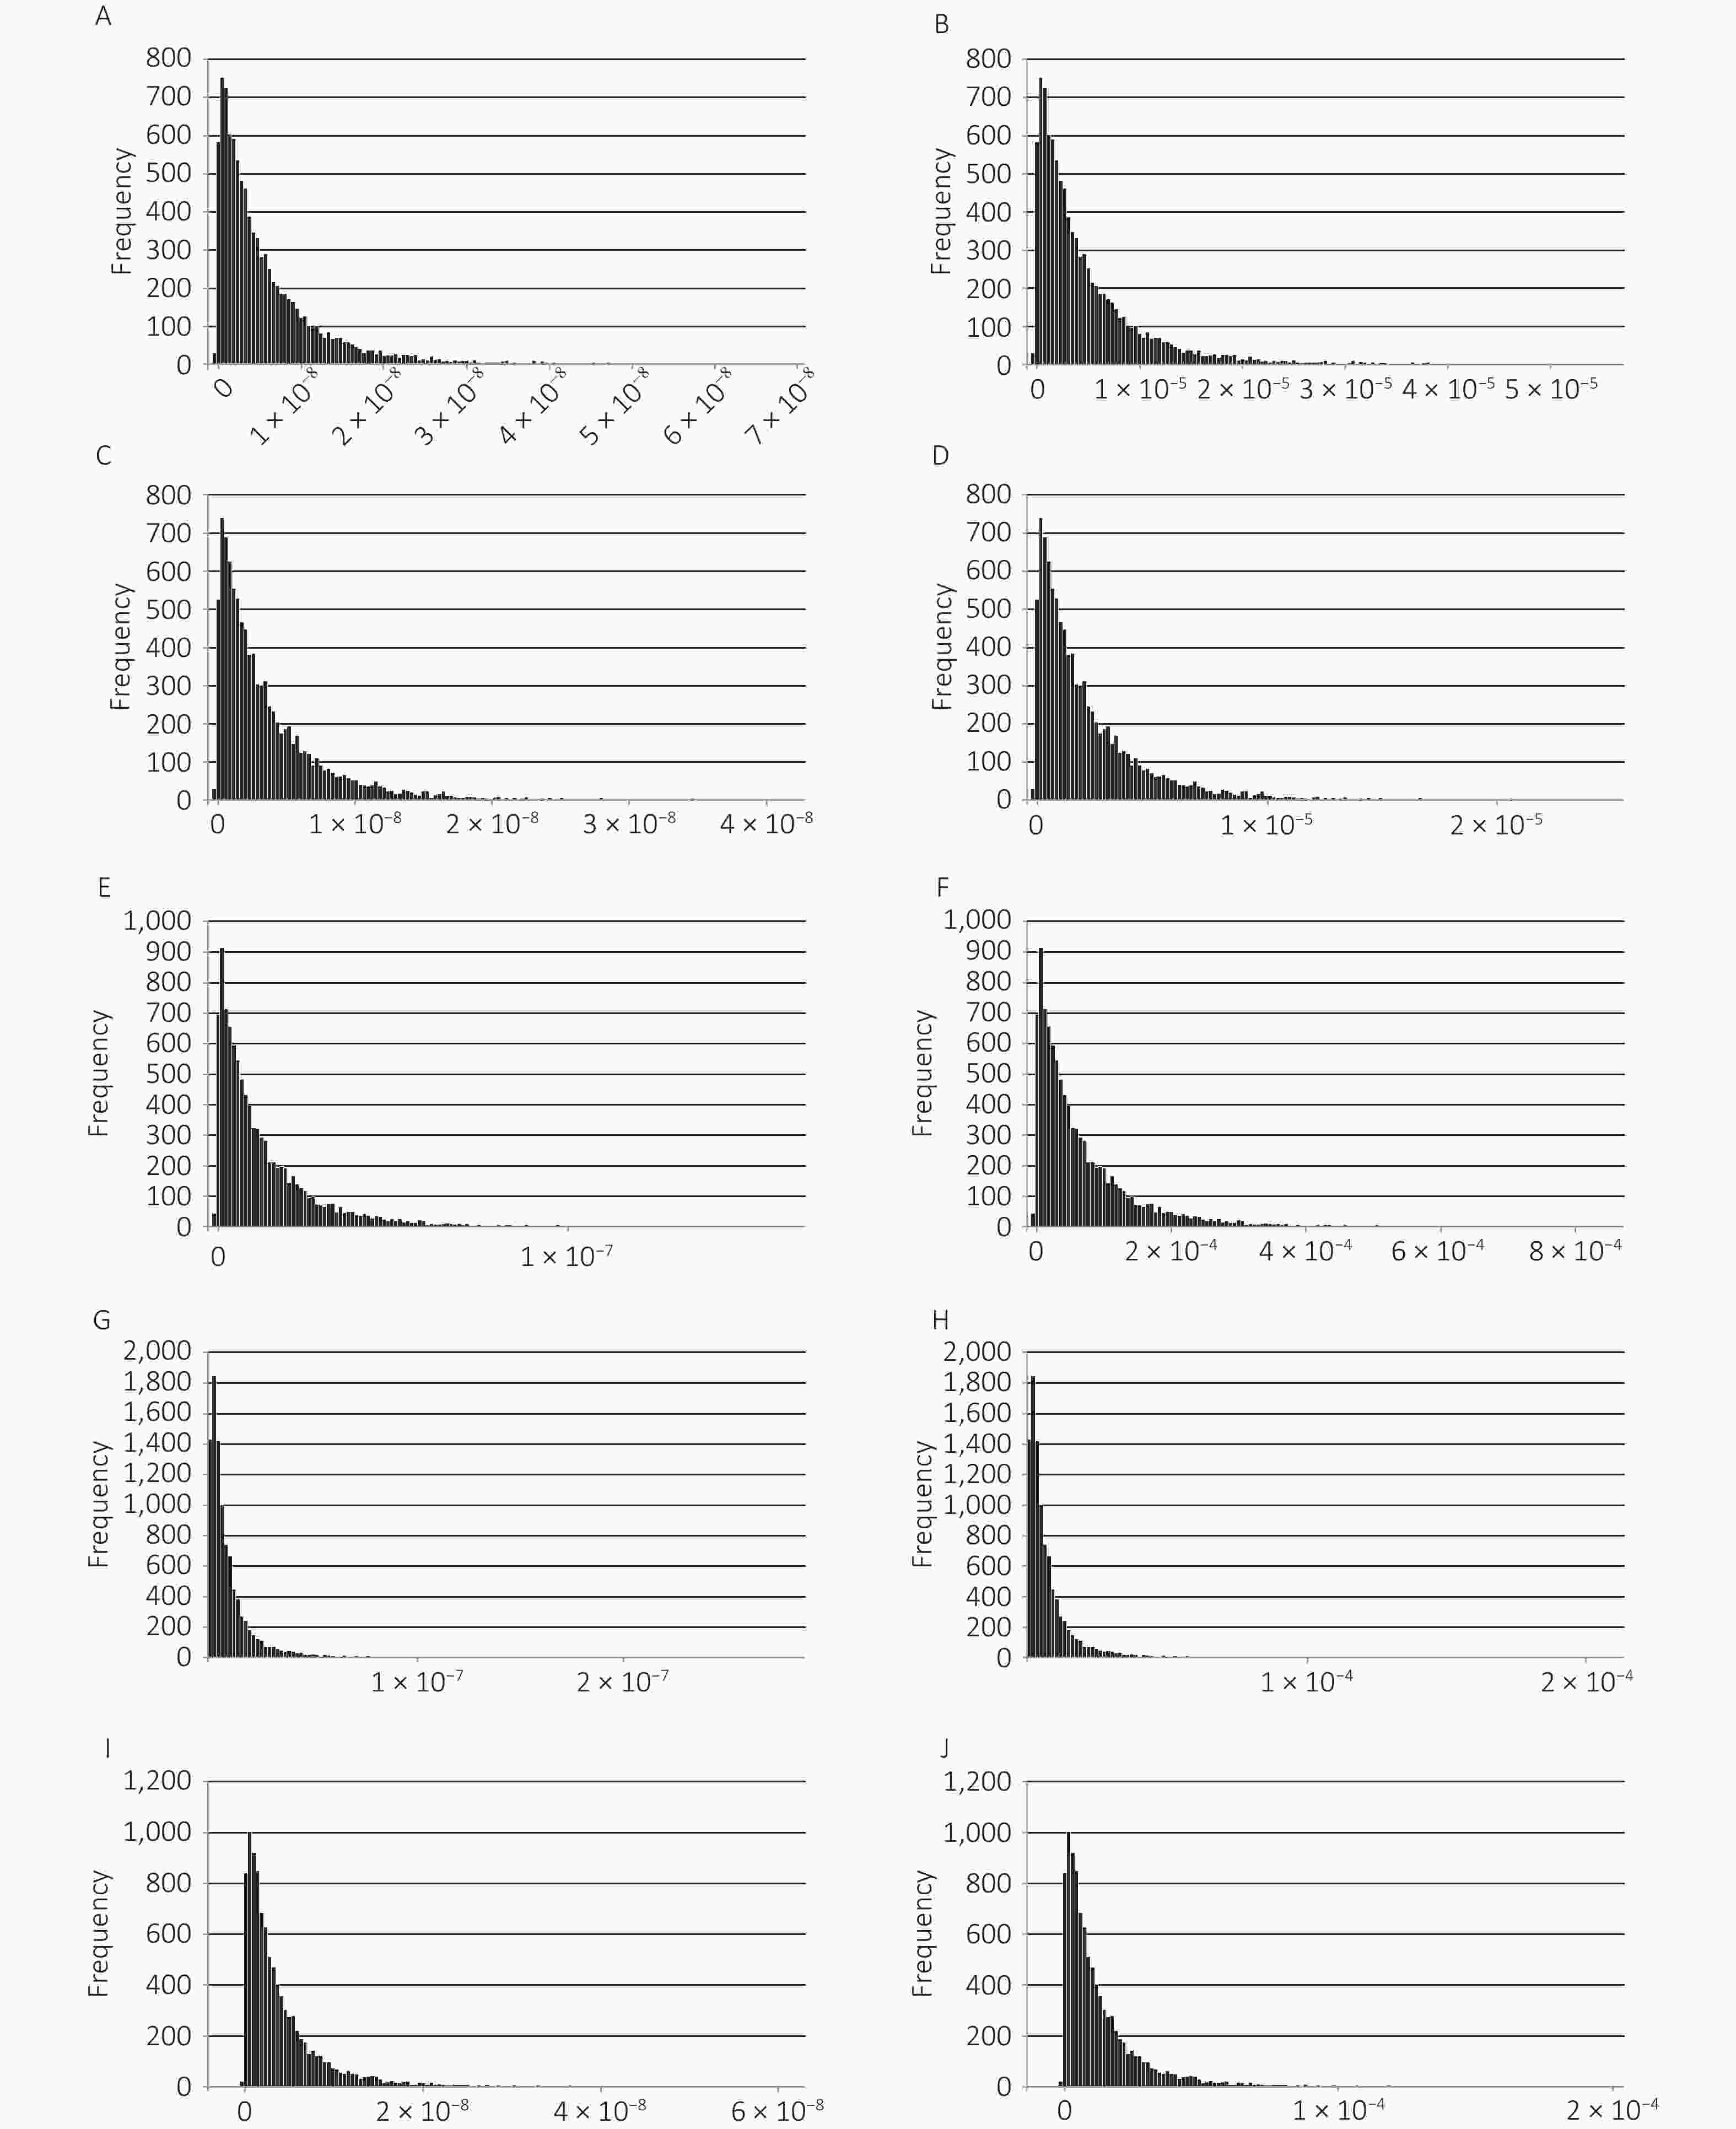
Figure 1. HQc and HQn probability distribution of the five DBPs.
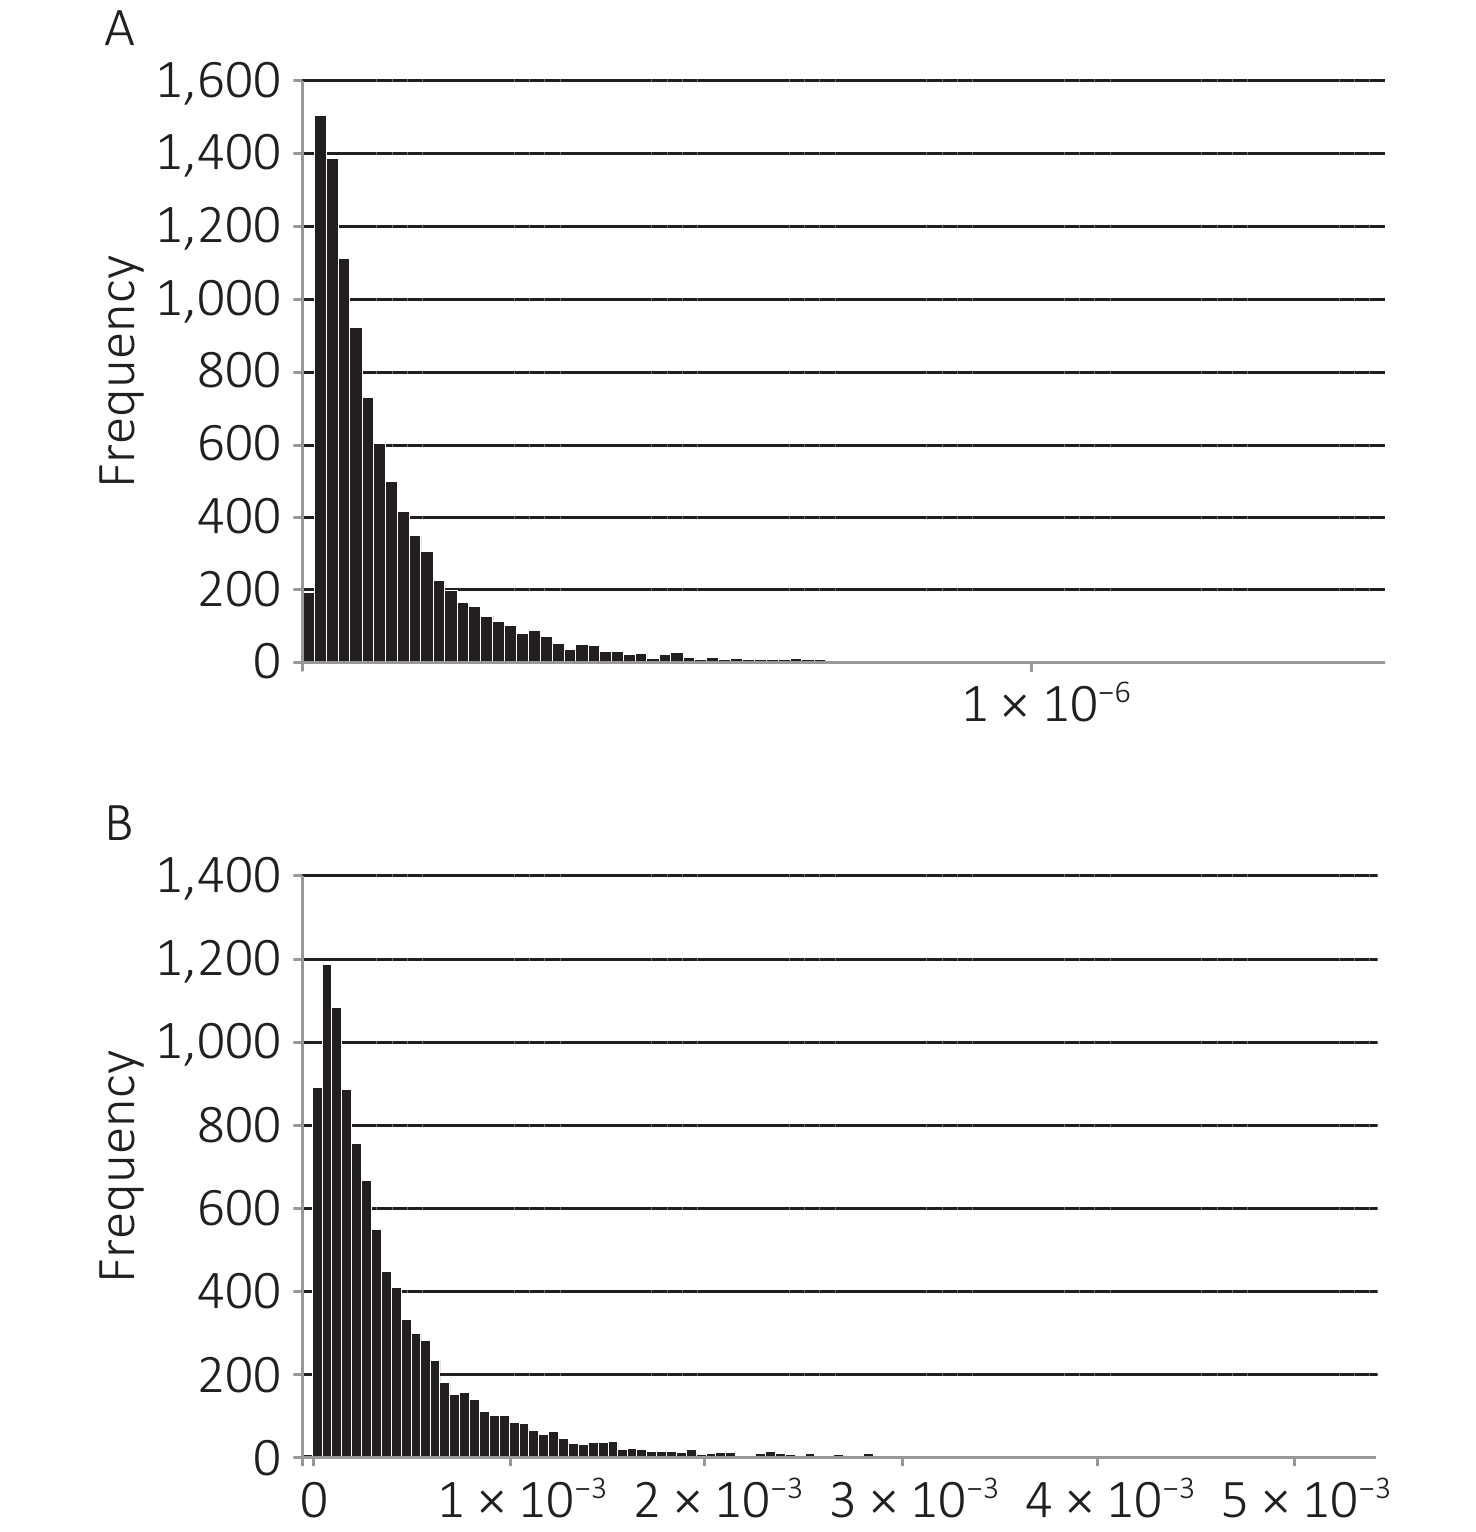
With TCA as the designated substance, the total HQc and HQn values after the weighted sum of the five DBPs are shown in Figure 2. The median total HQc was 7.32 × 10⁻⁸, and the 95% quantile was 4.41 × 10⁻⁷. The median total HQn was 2.35 × 10⁻⁴, and the 95% quantile was 1.36 × 10⁻³.

Figure 2. Probability distribution of total HQc and HQn of the five DBPs.
-
In this study, HAAs and THMs dominated the chlorinated by-products of recreational water disinfection in large parks in Shanghai, and the average daily exposure to DBCMs was the lowest and that to DCMs was the highest in the occupational population. The health risks of HAAs were slightly more significant than those of THMs. Under CTE-, RME-, and Monte Carlo simulation-based exposure conditions, the carcinogenic and non-carcinogenic risks of combined exposure to the five chlorinated DBPs did not exceed the cut-off values, and the risks were acceptable.
The concentrations of DBPs detected in the recreational and spray waters of the three large parks involved in this study were all lower than the LOD. The detection concentration of HAAs was higher than that of THMs. Previous studies have reported different results regarding the differences in the concentrations of these two substances[22,23]. This difference may be due to the amount and frequency of the chlorine-containing disinfectants used, water temperature, water quality, or other factors. The health risks associated with HAAs may be higher than those associated with THMs. Thus, it has been proposed that HAAs can be degraded into volatile THMs via decarboxylation reactions to reduce their toxicity[24].
Toxicological, epidemiological, and mechanistic studies have provided strong evidence for the carcinogenicity of DBPs. Individual DBPs differ in their carcinogenic potency and overall toxicity[25]. For example, the toxic effects of halogenated benzoquinones (HBQs) are 1000-fold greater than those of THMs and HAAs, including cytotoxicity, genotoxicity, and developmental toxicity[26–29]. Most nitrogen-containing DBPs (NAs, HNMs, and HANs) exhibit higher toxicity and health risks than carbon-containing DBPs (HAAs and THMs)[30]. The low or no detection rates of DBPs in the recreational water samples in this study, except for HAAs and THMs, indicated that the health risk of exposure to DBPs for the occupational population exposed to water in large amusement parks in Shanghai was low, and occupational exposure was within acceptable limits.
In terms of carcinogenic and non-carcinogenic risks, a health risk assessment of indoor swimming pools in Shanghai showed that the total risk of THMs and HAAs attributable to lifetime cancers exceeded 10−6, indicating a negligible risk level, which is consistent with the results of this study[31]. However, although the rate of ingestion of recreational water is generally considered relatively low, given the chronic exposure due to occupational exposure, long-term follow-up studies should be designed to determine the chronic carcinogenic and non-carcinogenic risks of these DBPs in occupational populations.
This study provides the first accurate exposure assessment and cancer risk characterization of DBPs in water from recreational water facilities in large amusement parks, based on exposure parameters obtained by quantitative measurements combined with questionnaires for the water-related occupational population in Shanghai. However, there is some uncertainty regarding the health risk assessment of the DBPs. First, the exposure parameters of the occupational population were mainly derived from the questionnaire and exposure parameter manual. The data in the exposure parameter manual may not accurately reflect the characteristics of the study population, and there may be some deviations. Second, the toxicity parameters mainly come from EPA-recommended values. The toxicity values differed for different research purposes and designs, and there was some uncertainty in the extrapolation data from animal experiments. Third, in the multipollutant risk assessment, the weighted sum was calculated according to the PoD of the substance. Using TCA as the designated substance, the health risks of other DBPs were overestimated, and the health risk of joint exposure was overestimated to a certain extent.
In conclusion, typical DBPs were detected in recreational water and spray samples collected from three large amusement parks in Shanghai. The health risks of DBPs and their mixtures were within acceptable limits. The results can provide a basis for preventing occupational exposure to health risks from chlorination and recreational water disinfection and for assessing the social benefits and burden of occupational exposure to DBPs in water-related occupational populations. Furthermore, the assessment method used in this study can provide a reference for assessing water pollution under specific scenarios. However, attention must be paid to model uncertainties and the variability of sensitive parameters.
HTML
Sample Collection and DBP Measurement
Health Risk Assessment
Hazard Identification
Exposure-Response Relationship Evaluation
Exposure Assessment
Risk Characterization
Statistical Analysis
Ethical Review Statement
Basic Demographic Characteristics of Employees
Exposure Assessment of Seven Typical DBPs in Recreational Water and Spray
Health Risk Assessment of DBPs in Employees in the Large Amusement Parks
COMPETING INTEREST The authors declare that they have no competing financial interests or personal relationships that may have influenced the work reported in this paper.
&These authors contributed equally to this work.
 23473+Supplementary Materials.pdf
|

|

 Quick Links
 DownLoad: