


-
Air pollution poses a significant global threat to public health and the environment, particularly due to contaminants such as particulate matter (PM), ground-level ozone (O3), carbon monoxide (CO), sulfur dioxide (SO2), and nitrogen dioxide (NO2)[1,2]. PM, which comprises solid and liquid particles suspended in the air, is commonly divided into three categories based on its aerodynamic diameter: coarse particles (PM2.5-10) with a diameter of 2.5-10 µm, fine particles (PM2.5) with a diameter less than or equal to 2.5 µm, and ultrafine particles with a diameter less than 0.1 µm[2,3]. The diverse sources and chemical compositions of PM contribute to varying health impacts. Substantial evidence links air pollution exposure, especially coarse and fine particulates, with increased morbidity and mortality[4]. The World Health Organization (WHO) estimates that air pollution causes 4.2 million deaths annually worldwide[5]. Respiratory effects of air pollution exposure include increased rates of lung cancer and exacerbation of chronic airway diseases such as asthma and chronic obstructive pulmonary disease[6]. Due to their small particle size and large surface area, PM2.5 particles readily absorb toxic substances, penetrate deep into the lungs, and can cause multiorgan damage through inhalation, deposition in the terminal bronchioles and alveoli, and transportation via the circulatory system[7,8]. Despite robust epidemiological evidence of adverse health outcomes from ambient air pollution, the underlying cellular mechanisms are poorly understood.
PM2.5 is the most common form of air pollution in developing countries and has been deemed a significant threat to human health. Long-term exposure to PM2.5 has been linked to the development and exacerbation of respiratory and cardiovascular diseases[9,10]. Chronic airway inflammation, characterized by a variety of inflammatory cells and cytokines, predominantly mast cells, eosinophils, and T cells, is thought to be the mechanism by which PM2.5 exposure increases the risk of asthma[11-14]. However, the exact mechanisms by which exposure to PM2.5 leads to asthma remain unclear.
Asthma is a complex disease characterized by chronic inflammation, reversible airflow limitations, and airway hyperresponsiveness[15,16]. It affects over 300 million individuals globally and contributes to over 1,000 deaths daily[17]. Its development is influenced by both genetic and environmental factors, with urbanization and increased outdoor air pollution emerging as significant influencers[18]. A pioneer study by Wang et al. found a prevalence rate of 4.2% for asthma among Chinese adults aged 20–80[19]. Growing evidence supports the association between air pollution and both development and exacerbation of asthma[20,21]. This association is underpinned by a link between ambient air pollution exposure and airway inflammation and inflammatory cell recruitment[22,23]. Nonetheless, the precise impact of short-term or long-term exposure to air pollution on asthma remains uncertain, and regional variations in air pollutant compositions have yet to be fully explored.
To address these knowledge gaps, the present study investigated the impact of air pollutants on asthma patients residing in Shanghai. The study endeavours to discern the principal component of ambient air pollution and to scrutinize its plausible mechanisms of action both in vivo and in vitro. We seek to deepen our understanding of how air pollution exacerbates asthma, thereby contributing to the development of targeted interventions and informed public health policies.
-
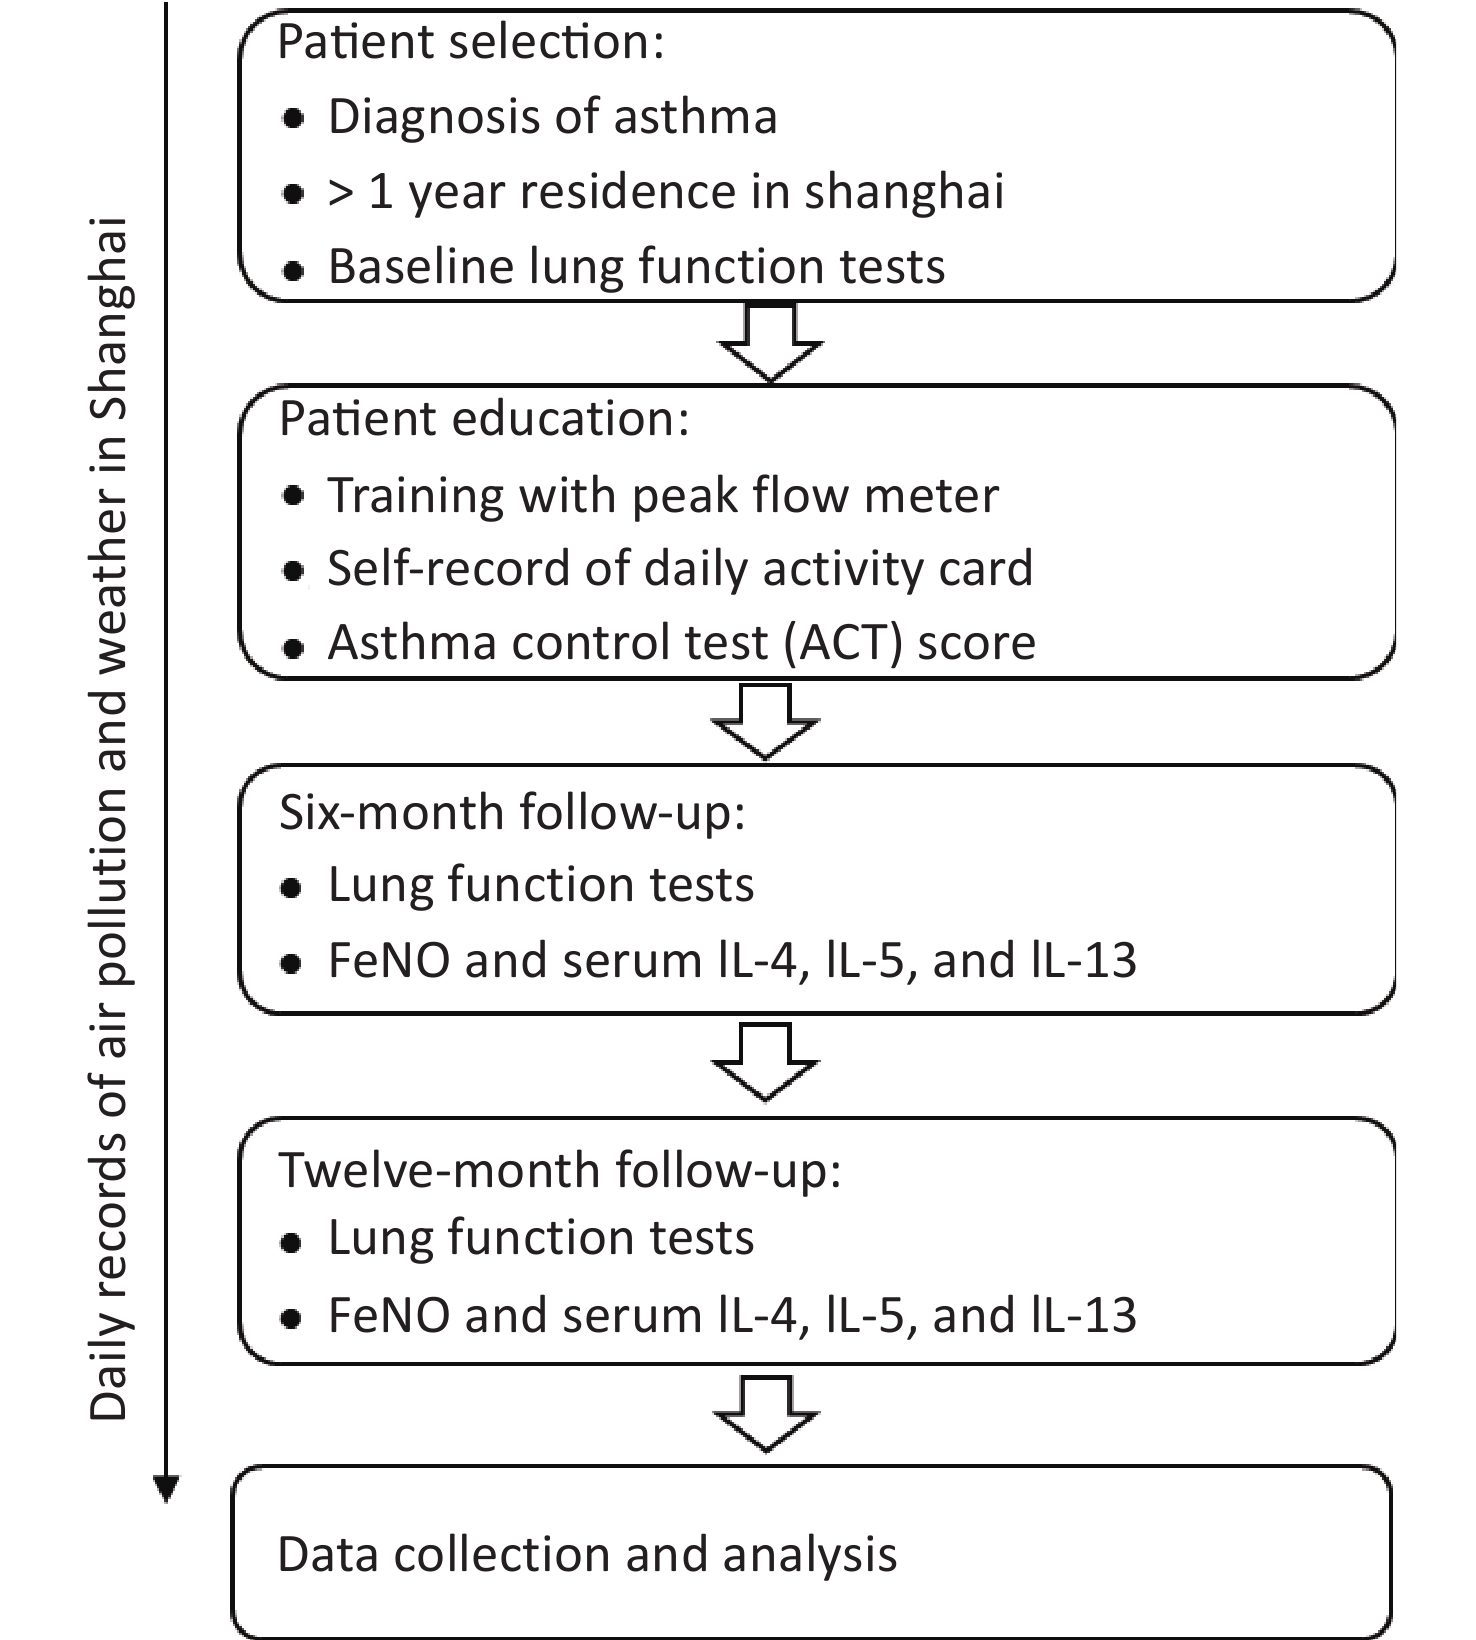
The acute effects of PM2.5 in this study are defined to evaluate the acute and chronic effects of air pollution. The observation time window for acute effects started on the day of pulmonary function measurement and lasted four days, and the observation period for chronic effects as one year. The distance between the residence of the research subject and the atmospheric observation point in Shanghai was ≤ 2 km. Meteorological data were recorded throughout the study period. All eligible patients underwent a full set of pulmonary function tests, blood inflammation index measurements, and symptom score assessment (ACT score) at baseline. Patients were also guided to fill in a diary card and record the peak flow meter data, which were monitored every six months during the follow-up period. At each follow-up visit, a full set of pulmonary function tests, blood inflammation index measurements, and FeNO measurements were repeated (Figure 1). This study was approved by the Institutional Review Board at the Huashan Hospital, Fudan University, Shanghai, China, with approval number KY-2014-276.
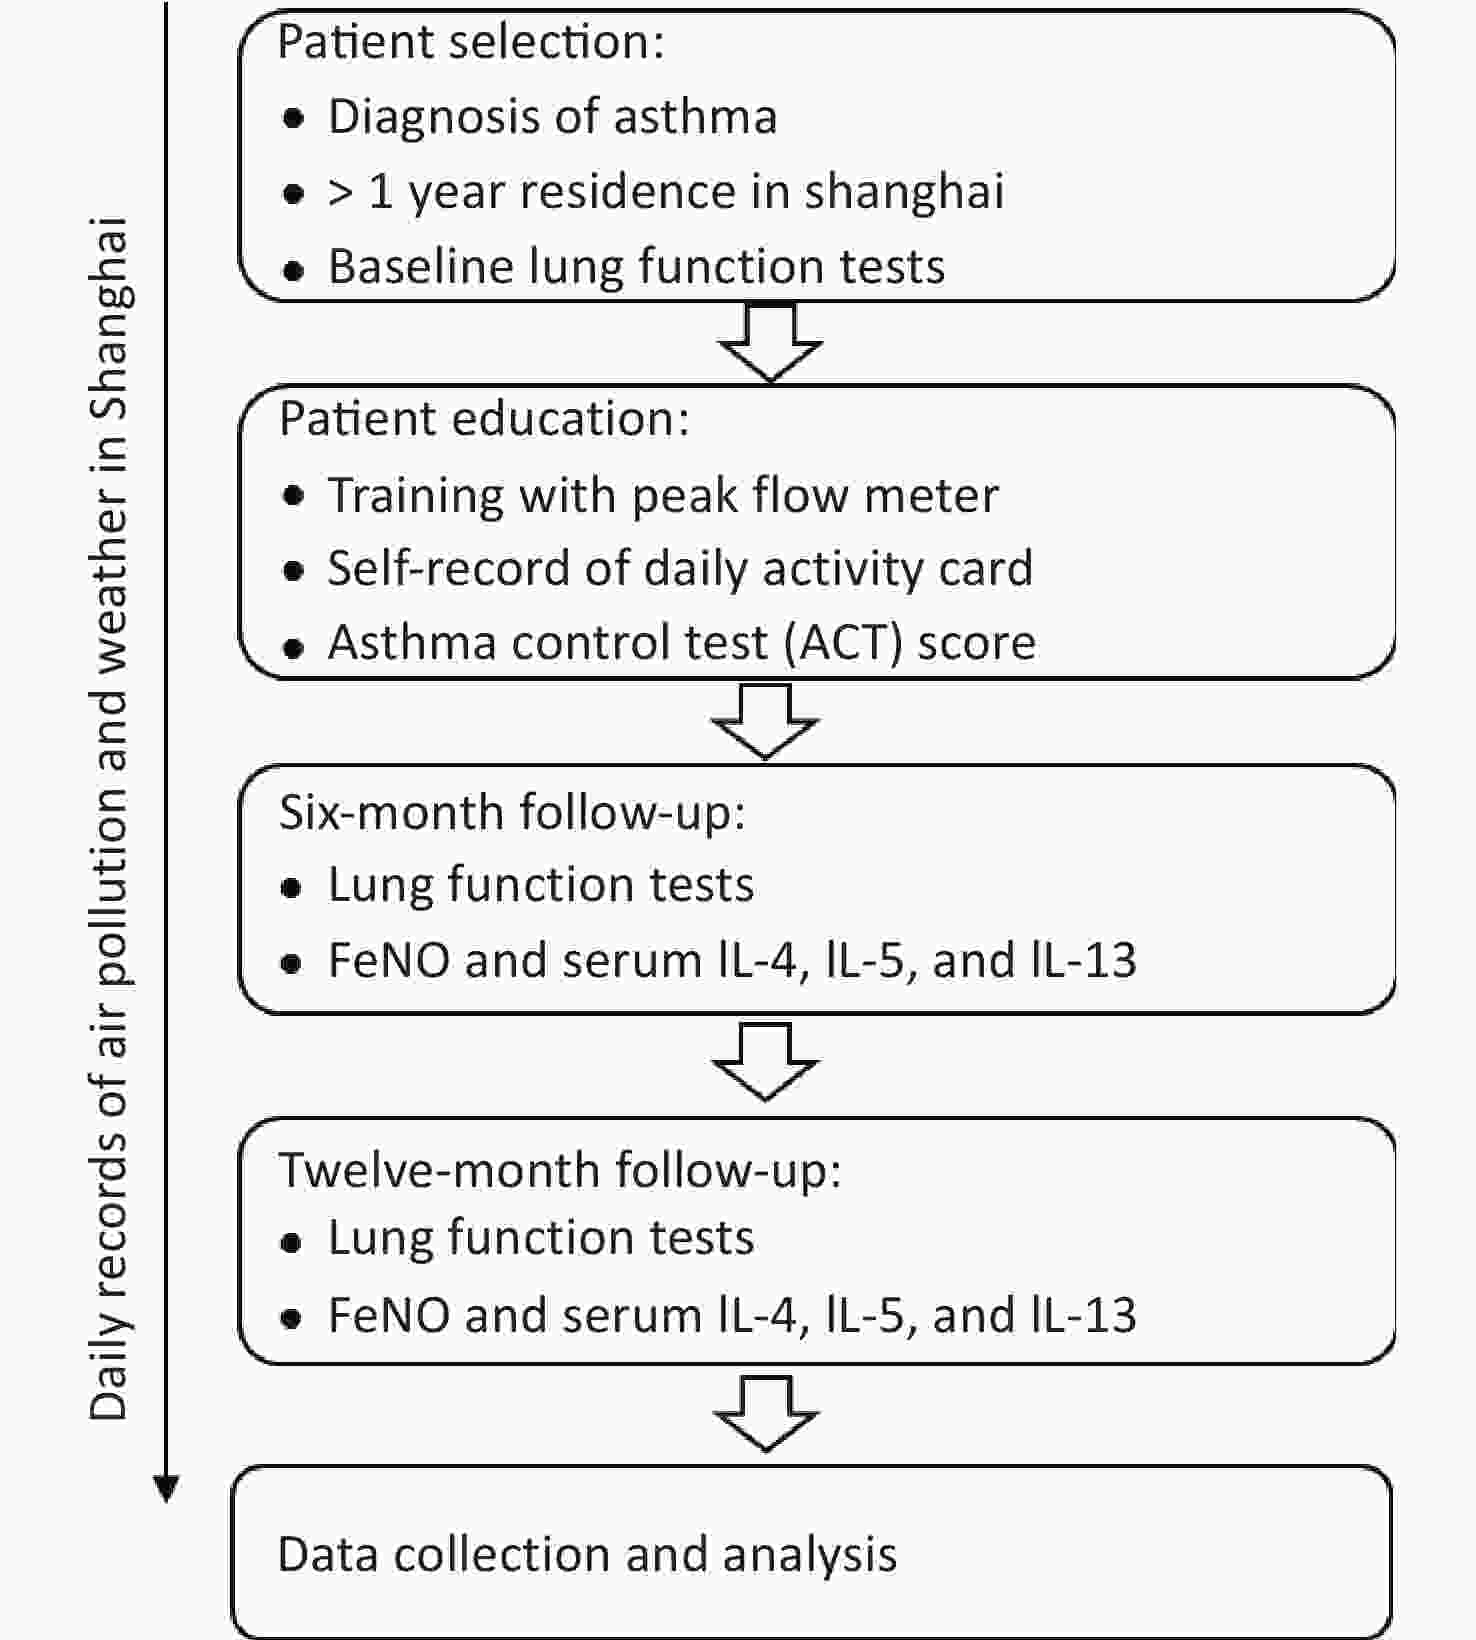
Figure 1. Research flow chart.
-
The meteorological data records on the wind direction, wind force, maximum temperature, minimum temperature and humidity in Shanghai on the day of enrolment and subsequent times of recruitment of every patient were obtained from the weather network of the Shanghai Meteorological Bureau (http://www.soweather.com/). The website of the data centre of the Ministry of Environmental Protection of the People’s Republic of China obtained Shanghai air quality daily to record yesterday’s AQI and major pollutants http://datacentre.mep.gov.cn/. The air quality index (AQI) is a dimensionless index that quantitatively describes air quality status. The reference standard for AQI classification calculation is the new ambient air quality standard (gb3095-2012), and the pollutants evaluated were SO2, NO2, PM10, PM2.5, O3, and CO. The concentrations of the main pollutants in the air are PM2.5, PM10, SO2, NO2, O3, and CO. The real-time air quality index was obtained by the Shanghai air quality real-time release system website of the environmental monitoring centre of the Shanghai Environmental Protection Bureau (http://www.semc.gov.cn/aqi/home/Index.aspx).
-
Female BALB/c mice (n = 32, with 8 for each group), aged 6 weeks were purchased from Shanghai SLAC Laboratory Animal Co., Ltd. (Shanghai, China) and then acclimated for 14 days before the experiment was conducted. All animal experiments were approved by the Fudan University Institutional Animal Care and Use Committee with approval number 202103022s. All rodent surgical procedures, detailed below, were carried out under full anaesthesia.
-
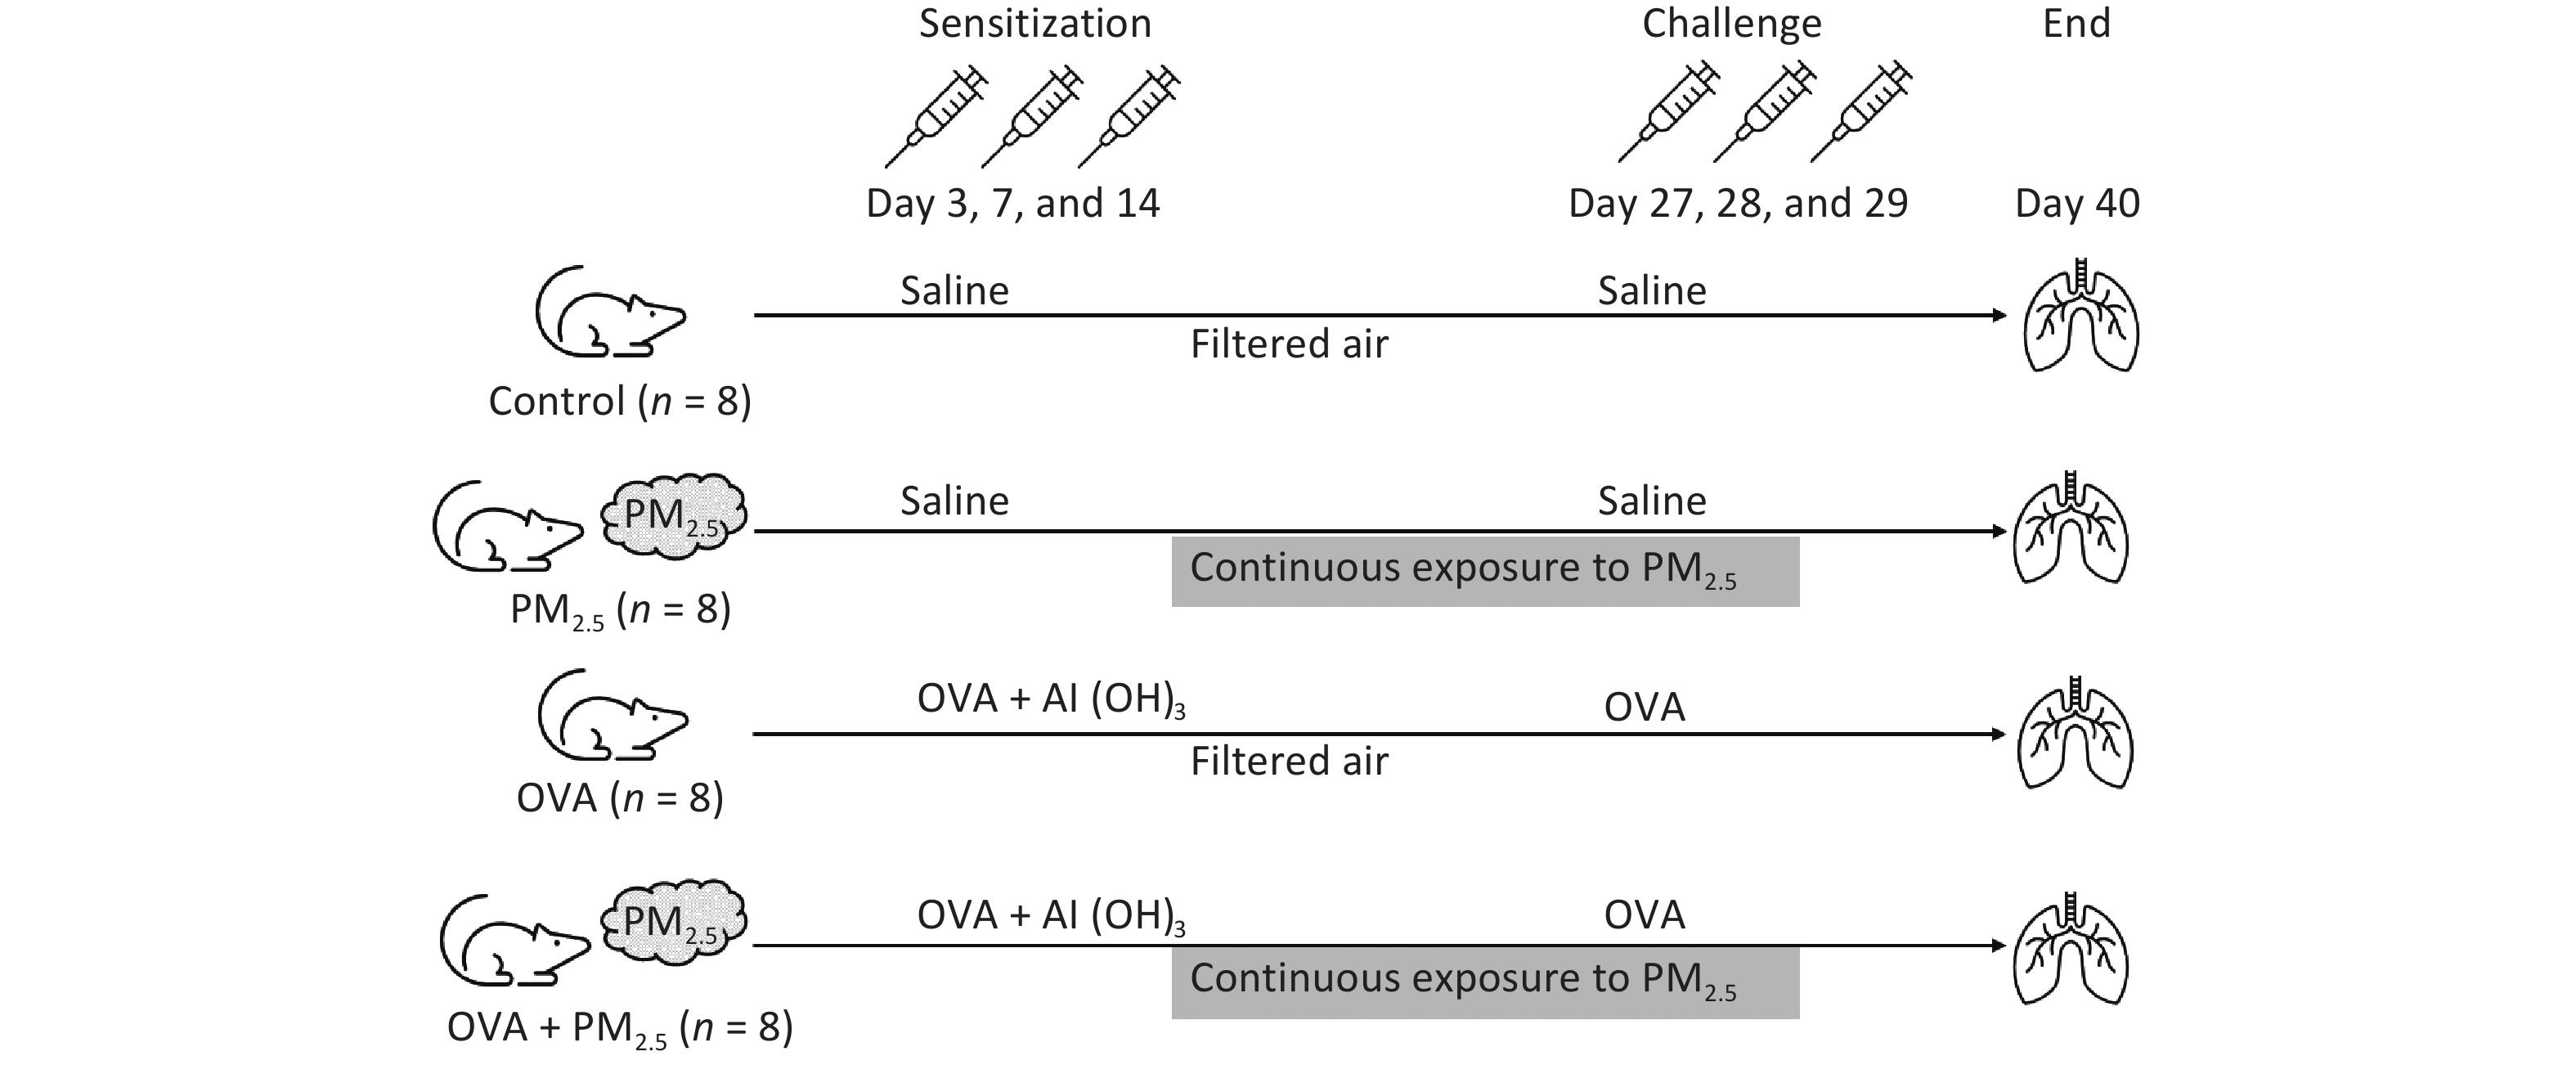
Mice were assigned to one of four groups (n = 8/group): the PBS-sensitized and -challenged control group (Control); the PM2.5 extract-exposed group (PM2.5); the OVA-sensitized and -challenged group (OVA); and the PM2.5 extract-exposed OVA group (OVA + PM2.5). All groups except for the control group were intraperitoneally injected with 2 mg/100 µL aluminium hydroxide (Al (OH)3) containing 10 μg of OVA (Sigma-Aldrich) on days 0, 7, and 14, while the control group received saline. On days 27, 28, and 29, the control group and the other groups were challenged with either 20 mL saline or the same dose of 2% OVA via atomization inhalation for 30 min. For the PM2.5 and OVA + PM2.5 groups, mice were given atomization inhalation of PM2.5 and aerosol (500 µg/m3) from days 1 to 29[24-29] (Figure 2).
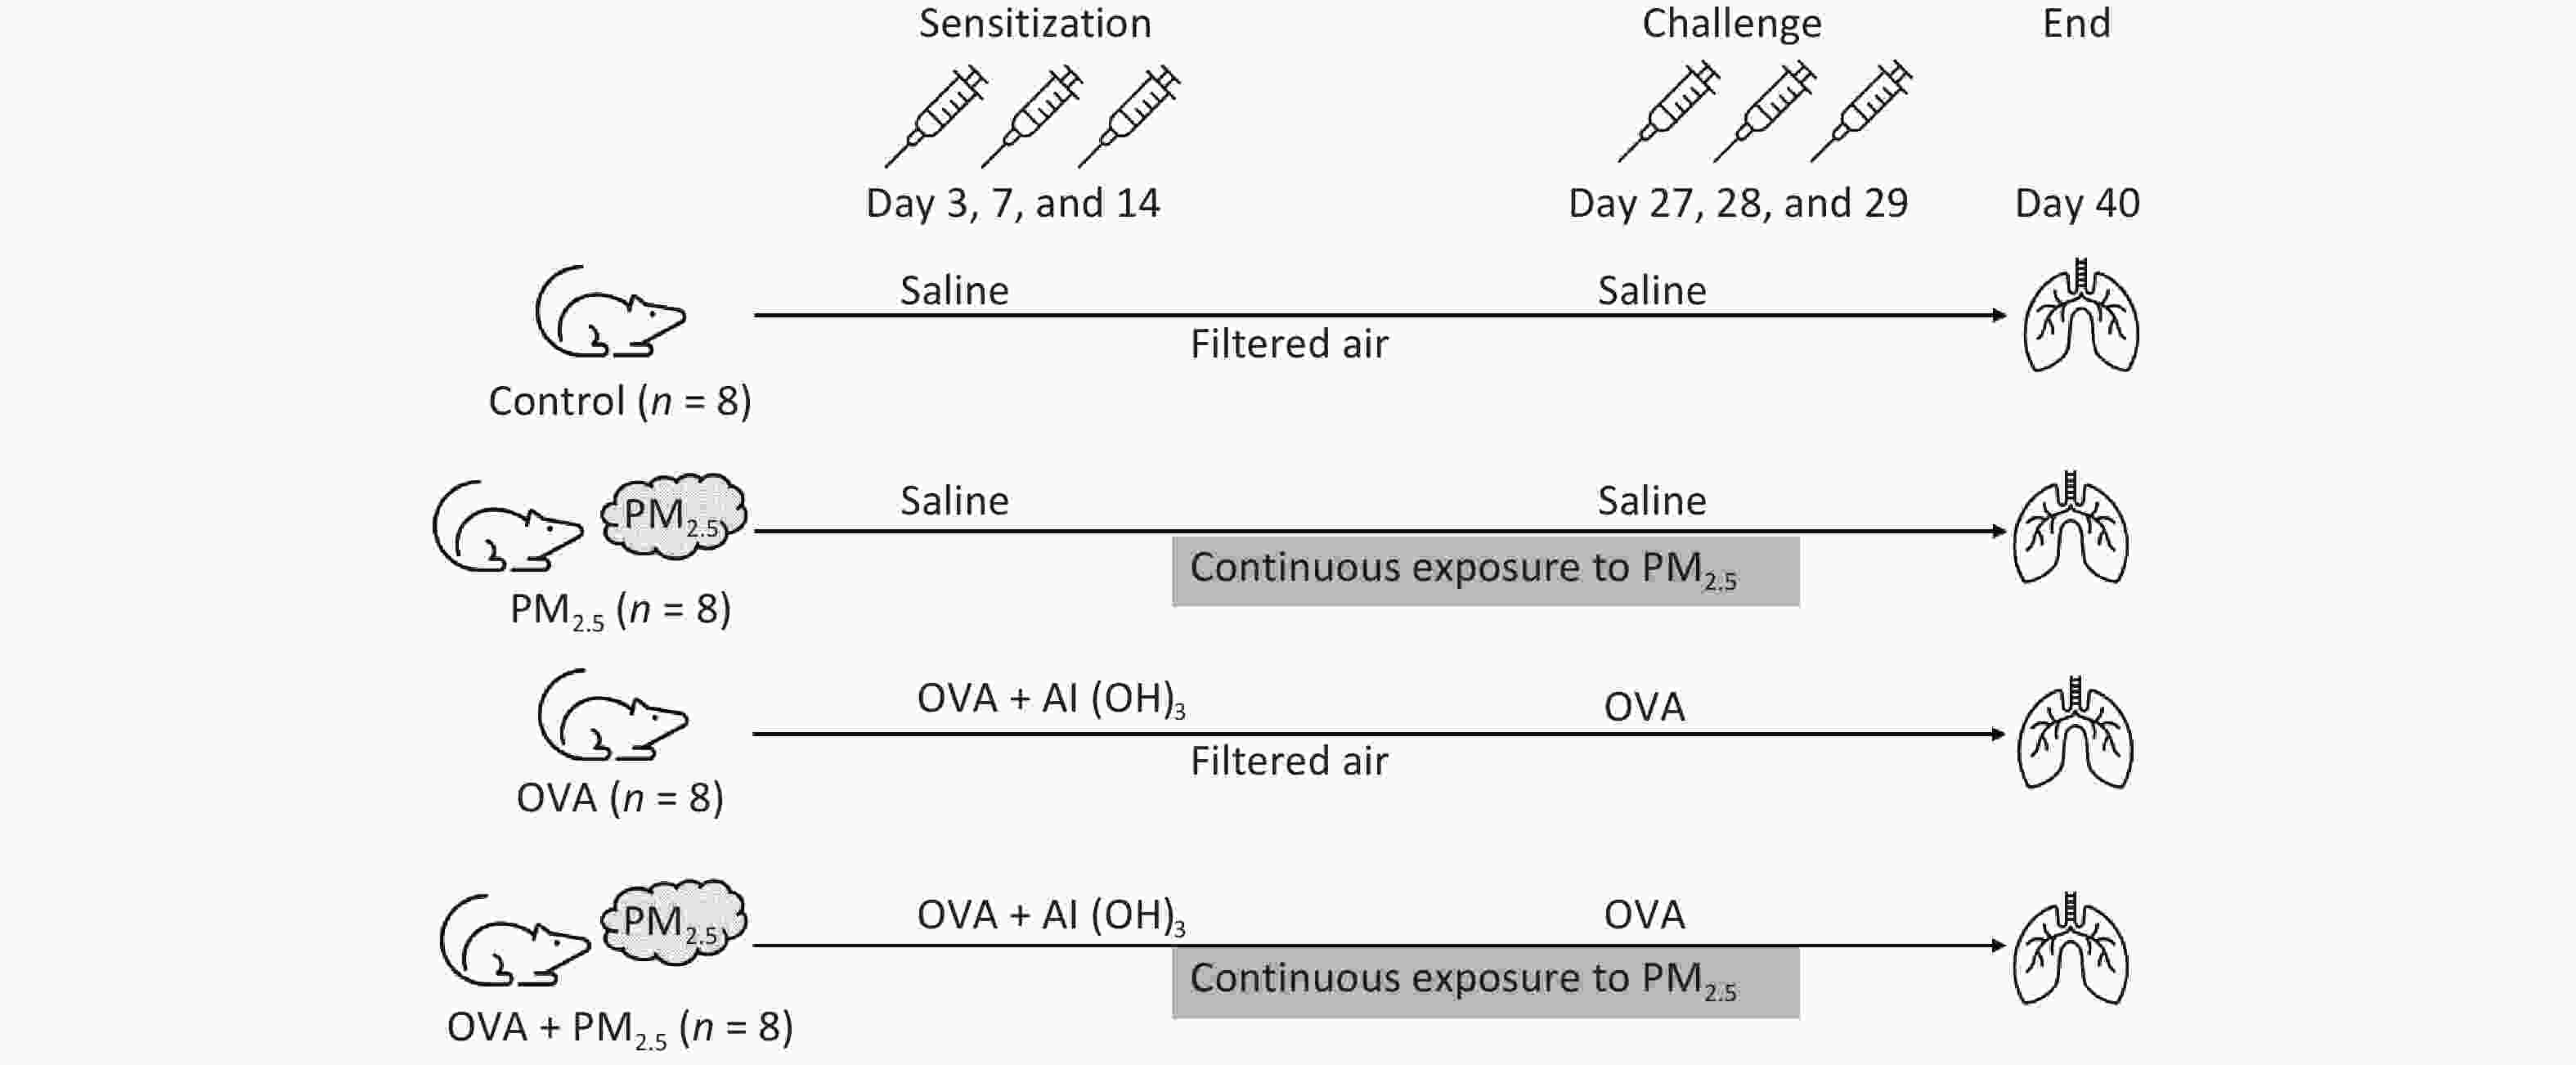
Figure 2. Experimental method of the PM2.5 exposure-enhanced mouse model of asthma. OVA, ovalbumin.
-
Non-invasive measurement of lung function in mice was done by whole-body plethysmography (WBP) (Produced by Shanghai TOW Intelligent Technology Co, Ltd, Production No. WBP-4MR). All of the mice were tested at 15 d and 30 d. Mid-expiratory flow (expiratory flow 50, EF50) and enhanced pause (Penh) are indicators of airway obstruction. EF50 refers to the expiratory flow rate when exhaling 50% of the tidal volume. Penh is an index of reactive airway resistance, which is numerically equal to (TE / TR-1) × (PEF / PIF), where TE = expiration time, the time from the beginning of expiration to the end of expiration; TR = relaxation time, the time required for an animal to exhale a certain amount of gas; PIF = peak inspiratory flow, the peak inspiratory flow rate during inspiration; and PEF = peak expiratory flow, the peak flow rate during expiration.
-
Human blood samples were drawn at every visit. Blood samples were taken twice for each participant. To determine the levels of circulating IL-4, IL-5, and IL-13. Prior to the blood draw, participants were asked to fast 8 h, avoid vigorous exercise for 12 h and alcohol for 24 h, and refrain from using tobacco products that morning. At the blood draw visit, a registered nurse completed a medical history and medication-use interview. Plasma samples were collected from citrated tubes and frozen at −80 °C for analysis in batches. IL-4, IL-5, and IL-13 levels were determined by ANOGEN Human ELISA Kits (IL-4 Catalogue Number: EL10026; IL-5 Catalogue Number: EL10035; IL-13 Catalogue Number: EL10054). Mouse blood and bronchoalveolar lavage fluid (BALF) samples were collected and serum was separated at 40 days. Mouse IL-5 and IL-13 levels were determined by ELISA (ANOGEN IL-5 Catalogue Number: MEC1007; R&D Systems IL-13 Catalogue Number: DY413-05).
-
C57 lung type II epithelial cells (from SHANGHAI DONGHUAN BIOTECH CO., LTD) and HBE cells (from National collection of Authenticated Cell Cultures) were cultured in DMEM (Gibco) supplemented with 10% foetal bovine serum (Biological Industries) and grown in room air at 37 °C with 5% CO2. First, cells were stimulated with 10 µg/mL PM2.5 for 48 h to perform a cell viability assay.
-
Cells were plated in a 96-well culture plate at a density of 2 × 10³/well and then treated with 10 µg/mL PM2.5 for 48 h. Cell viability was determined by a WST-1 cell proliferation and cytotoxicity assay kit (SHANGHAI DONGHUAN BIOTECH CO., LTD). Briefly, 5 mL of electronic coupling reagent was used to completely dissolve WST-1 powder and form the WST-1 solution. Then, 100 μL of solution containing 2,000 cells was added to each well, 10 μL of WST-1 solution was added, and the plate was incubated for 2 h. Optical density was measured by a microplate reader set at 450 nm.
-
HBE and C57 mouse lung type II alveolar epithelial cells were treated under different conditions, and total protein was extracted from the cells using RIPA buffer (Sangon Biotech (Shanghai) Co., Ltd. C500005-0050). The total protein (10–30 μg) was separated and transferred to membranes. The membranes were incubated with 5% nonfat milk and specific antibodies against ERK (abways CY5487), pERK (abways CY5277), NF-κB (abways CY5040) and β-actin (abcam ab8226). Finally, the proteins were visualized in a Tanon 4800 multi automatic chemiluminescence/fluorescence image analysis system.
-
All data were analysed by descriptive analysis and the Spearman rank sum test. For daytime differences, the relationship between air quality index (AQI), PM2.5 concentration, pulmonary function, blood inflammation index and symptom score during the follow-up period was statistically analysed by using generalized estimating equations, correlation analysis and multiple regression analysis. The medication situation was analysed as a synergistic variable. SPSS 18.0 (IBM spss, USA) and GraphPad Prism 5.0 (GraphPad Software, USA) were used for statistical analysis and graphs, respectively. Data were summarized as mean ± standard deviation. One-way ANOVA combined with Fisher's protected t-test was conducted to determine the significance of differences between groups. P < 0.05 was considered as statistical significance. The sections of pathological from lung tissues were photographed by a microscope.
-
The 27 subjects had an average BMI of 23.1 kg/m2. Among them, 17 (62.96%) were females. All subjects were tested for lung function and fractional exhaled nitric oxide (FeNO). The baseline characteristics of the study subjects are shown in Table 1.
Characteristics Result Age (y) 49.8 ± 16.18 BMI (kg/m2) 23.10 ± 3.18 Female 17 (62.96%) ACT score in baseline 17.14 ± 4.57 *FEV1 (L) 2.18 ± 0.91 **FVC (L) 2.82 ± 1.49 ***FEV1/FVC (%) 79.95 ± 13.91 FeNO (ppb) 48 ± 45 (Min 10, Max 238) Note. *FEV1 Forced vital capacity in 1 second; **FVC forced vital capacity; ***FEV1/FVC Ratio of forced vital capacity in 1 second to forced vital capacity. Table 1. Characteristics and baseline of the study subjects (n = 27)
-
We collected the PEF recorded by the peak flow metre and the meteorological data (AQI, air quality evaluation, PM2.5, PM10, O3, NO2, SO2, CO subindex and their daily mean concentrations) on the day of each follow-up and the three days after that of each subject. Spearman correlation analysis was carried out using these data. The PEF value was correlated with the O3 and NO2 subindexes and their daily mean values (O3 subindex P = 0.0009, O3 daily mean value P = 0.0012, NO2 subindex P = 0.0155, NO2 daily mean value P = 0.0215) (Table 2). Further multiple regression analysis of several meteorological indexes related to PEF found that when other factors remained unchanged, the PEF value decreased by 0.44 mL/min for every 1 μg/m3 increase in the daily mean value of O3 and by 2.02 mL/min for every 1 unit increase in the NO2 subindex (Table 2).
Ambient air pollutants PEF PM2.5 sub index P = 0.2270 PM10 sub index P = 0.3457 O3 sub index P = 0.0009* SO2 sub index P = 0.3585 NO2 sub index P = 0.0155* CO sub index P = 0.1223 AQI P = 0.7173 PM2.5 day average (μg/m3) P = 0.3480 PM10 day average (μg/m3) P = 0.2054 O3 daily maximum 8-hour mean (μg/m3) P = 0.0012* SO2 day average (μg/m3) P = 0.4499 NO2 day average (μg/m3) P = 0.0215* CO day average (μg/m3) P = 0.2347 Note. *P < 0.05. PEF, peak expiratory flow. Table 2. Acute effect of Ambient air pollutants on patients with asthma
-
The chronic effect had 6 months as the time interval. The mean value of each index of each component in ambient air pollutants during this period was compared with the patient’s pulmonary function, inflammatory index, ACT symptom score and FeNO by Spearman correlation analysis. There was no correlation between the pulmonary function index, ACT symptom score, FeNO and ambient air pollutants in patients with asthma (Table 3). However, IL-5 and IL-13 concentrations were correlated with some ambient air pollutants. IL-5 was correlated with the AQI, PM2.5 index, PM10 index, PM2.5 daily average concentration and PM10 daily average concentration. IL-13 was correlated with the PM2.5 index, PM10 index and their daily average concentration (P < 0.05) (Table 4). Multiple regression analysis of individual inflammation indexes on several meteorological indexes related to inflammation index found that when other factors remained unchanged, IL-5 increased by 2.25 pg/mL for every 1-unit increase in the PM2.5 index and increased by 2.06 pg/mL for every 1-unit increase in the PM10 index.
Ambient air pollutants FEV1 FeNO ACT PM2.5 sub index P = 0.6036 P = 0.4658 P = 0.5521 PM10 sub index P = 0.4194 P = 0.9978 P = 0.5440 O3 sub index P = 0.5153 P = 0.1185 P = 0.3486 SO2 sub index P = 0.4600 P = 0.1548 P = 0.1848 NO2 sub index P = 0.7375 P = 0.2967 P = 0.7345 CO sub index P = 0.8859 P = 0.1502 P = 0.5727 AQI P = 0.8059 P = 0.3967 P = 0.4221 PM2.5 day average (μg/m3) P = 0.4352 P = 0.6364 P = 0.6118 PM10 day average (μg/m3) P = 0.4623 P = 0.9405 P = 0.4724 O3 daily maximum 8-hour mean (μg/m3) P = 0.2652 P = 0.2269 P = 0.2830 SO2 day average (μg/m3) P = 0.3499 P = 0.2165 P = 0.1596 NO2 day average (μg/m3) P = 0.4259 P = 0.4303 P = 0.6470 CO day average (μg/m3) P = 0.5849 P = 0.3686 P = 0.3909 Table 3. Chronic effect of Ambient air pollutants on asthma patients’ symptoms and lung function
Ambient air pollutants IL-4 (pg/mL) IL-5 (pg/mL) IL-13 (pg/mL) PM2.5 sub index P = 0.3565 P = 0.0355* P = 0.0342* PM10 sub index P = 0.3022 P = 0.0323* P = 0.0272* O3 sub index P = 0.9688 P = 0.6440 P = 0.7883 SO2 sub index P = 0.5094 P = 0.1616 P = 0.1499 NO2 sub index P = 0.4865 P = 0.1538 P = 0.5207 CO sub index P = 0.3754 P = 0.0983 P = 0.1330 AQI P = 0.1236 P = 0.0231* P = 0.0719 PM2.5 day average (μg/m3) P = 0.3279 P = 0.0362* P = 0.0275* PM10 day average (μg/m3) P = 0.3459 P = 0.0361* P = 0.0269* O3 daily maximum 8-hour mean (μg/m3) P = 0.8507 P = 0.6926 P = 0.6804 SO2 day average( μg/m3) P = 0.5094 P = 0.1719 P = 0.1168 NO2 day average (μg/m3) P = 0.5874 P = 0.2046 P = 0.4847 CO day average (μg/m3) P = 0.3824 P = 0.0937 P = 0.0969 Note. *P < 0.05. Table 4. Chronic effect of Ambient air pollutants on asthma patients’ cytokine inflammation
-
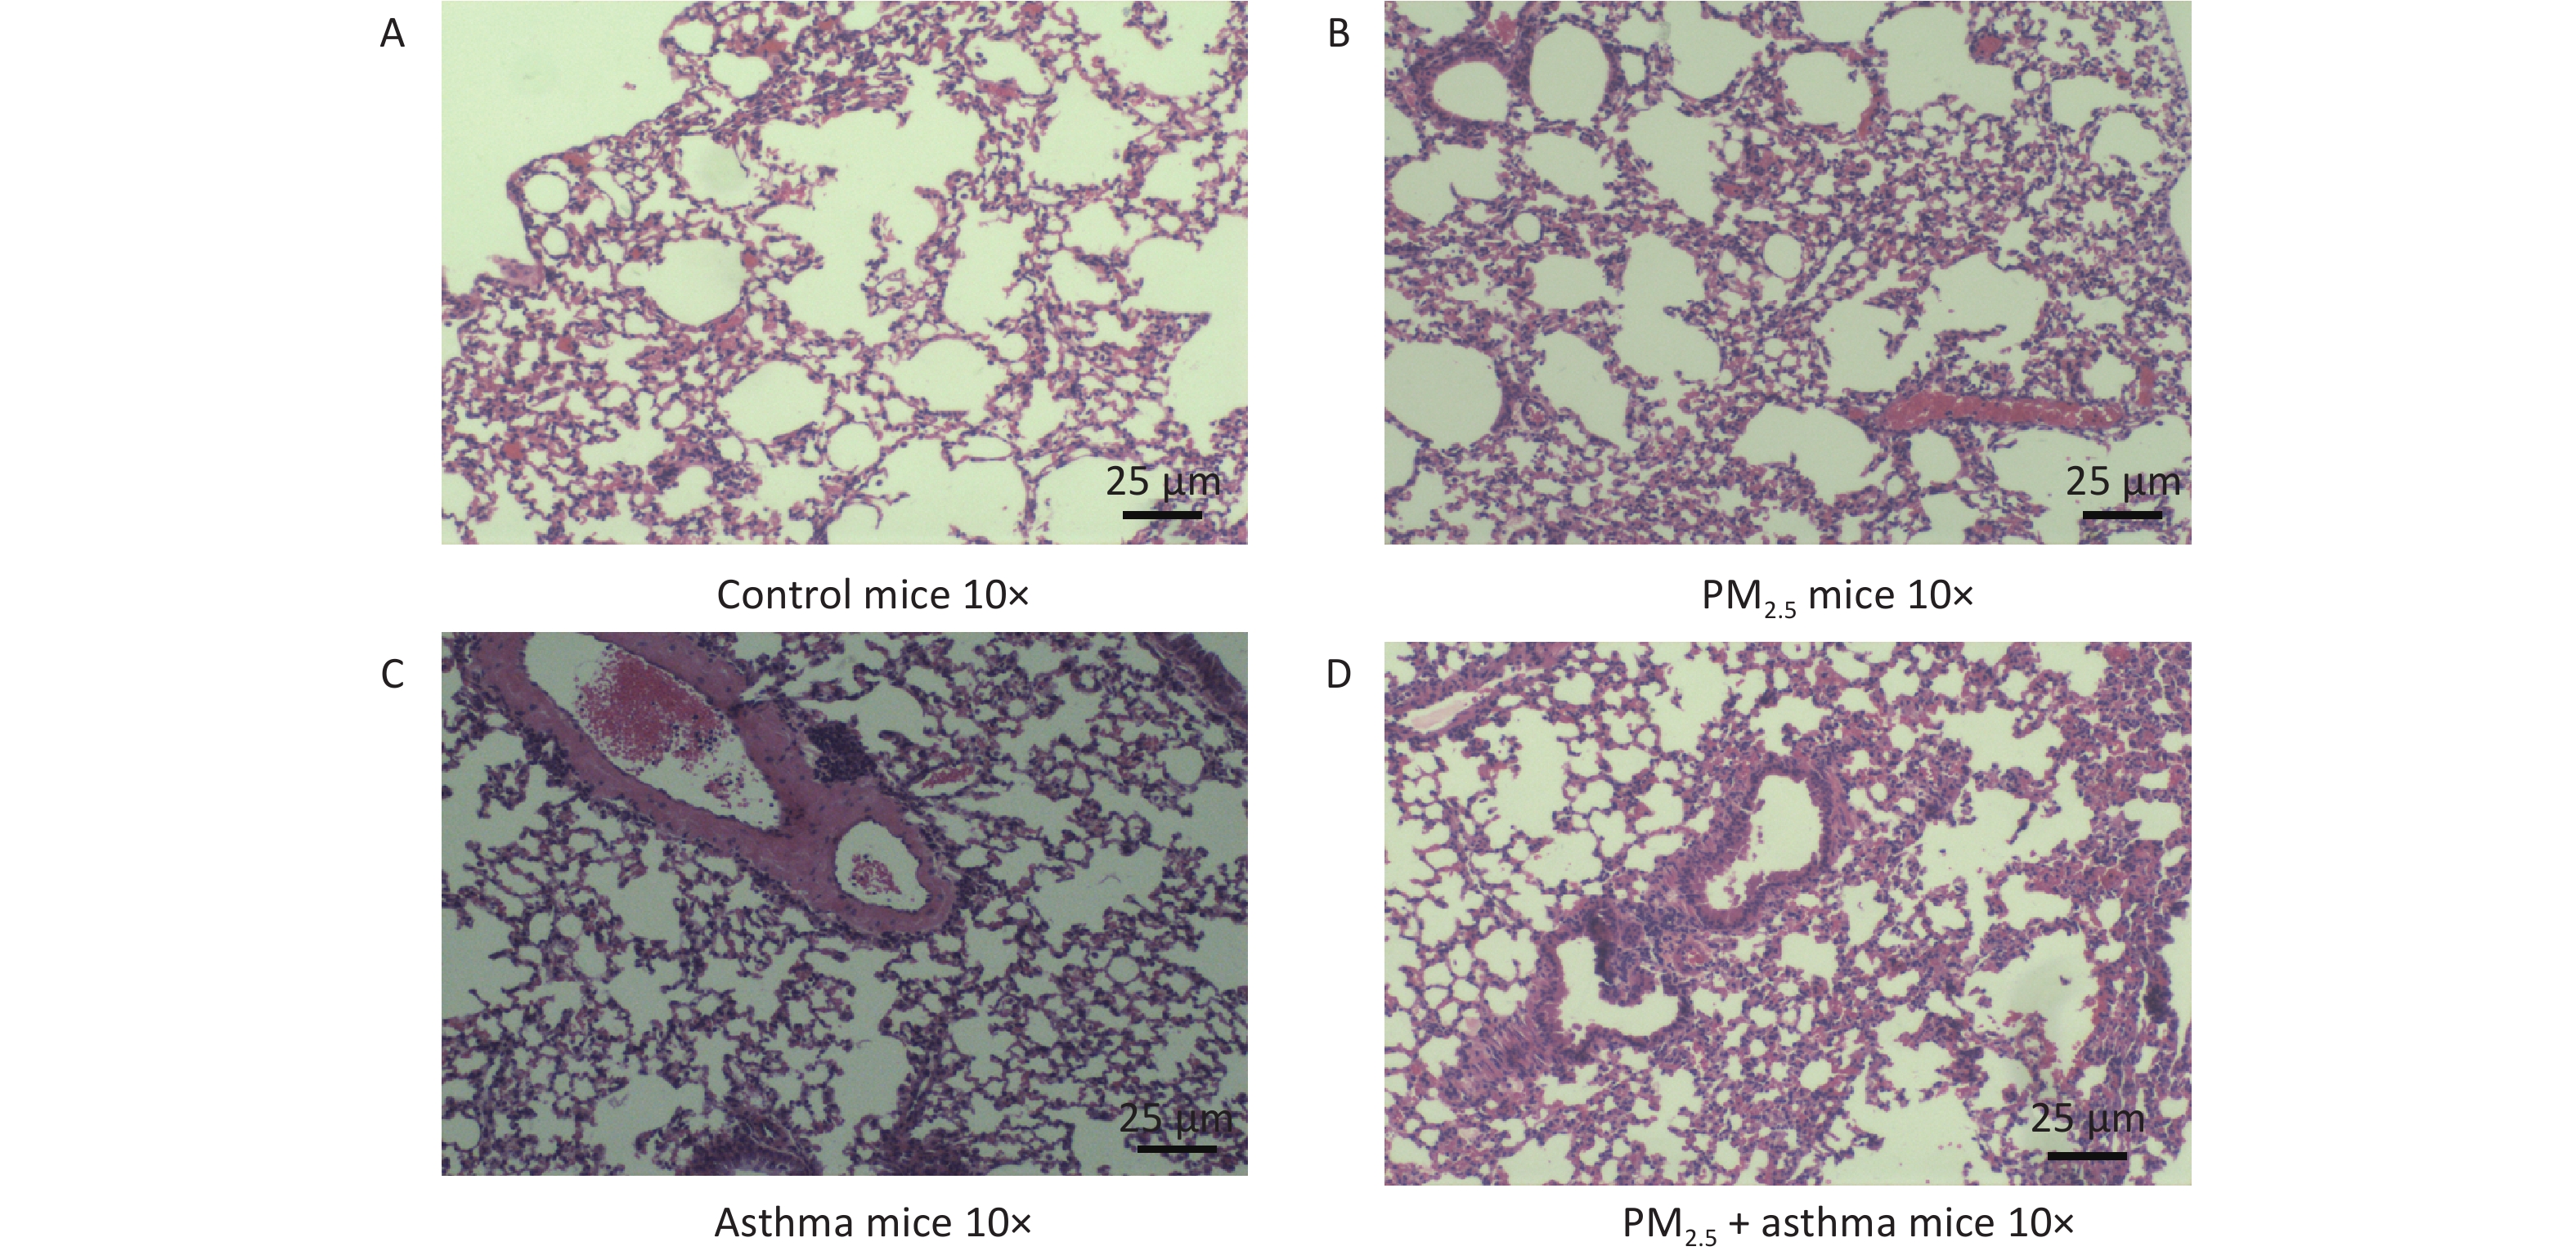
Figure 3 depicts the variations of histopathological lung among each group, containing the H&E (Figure 3). In the OVA-sensitized group, PM2.5 and OVA-sensitized + PM2.5 groups all showed the characteristics of airway remodeling. The thickening of the airway wall and the infiltration of inflammatory cells were significantly higher than those of the normal saline control group. (Figure 3).
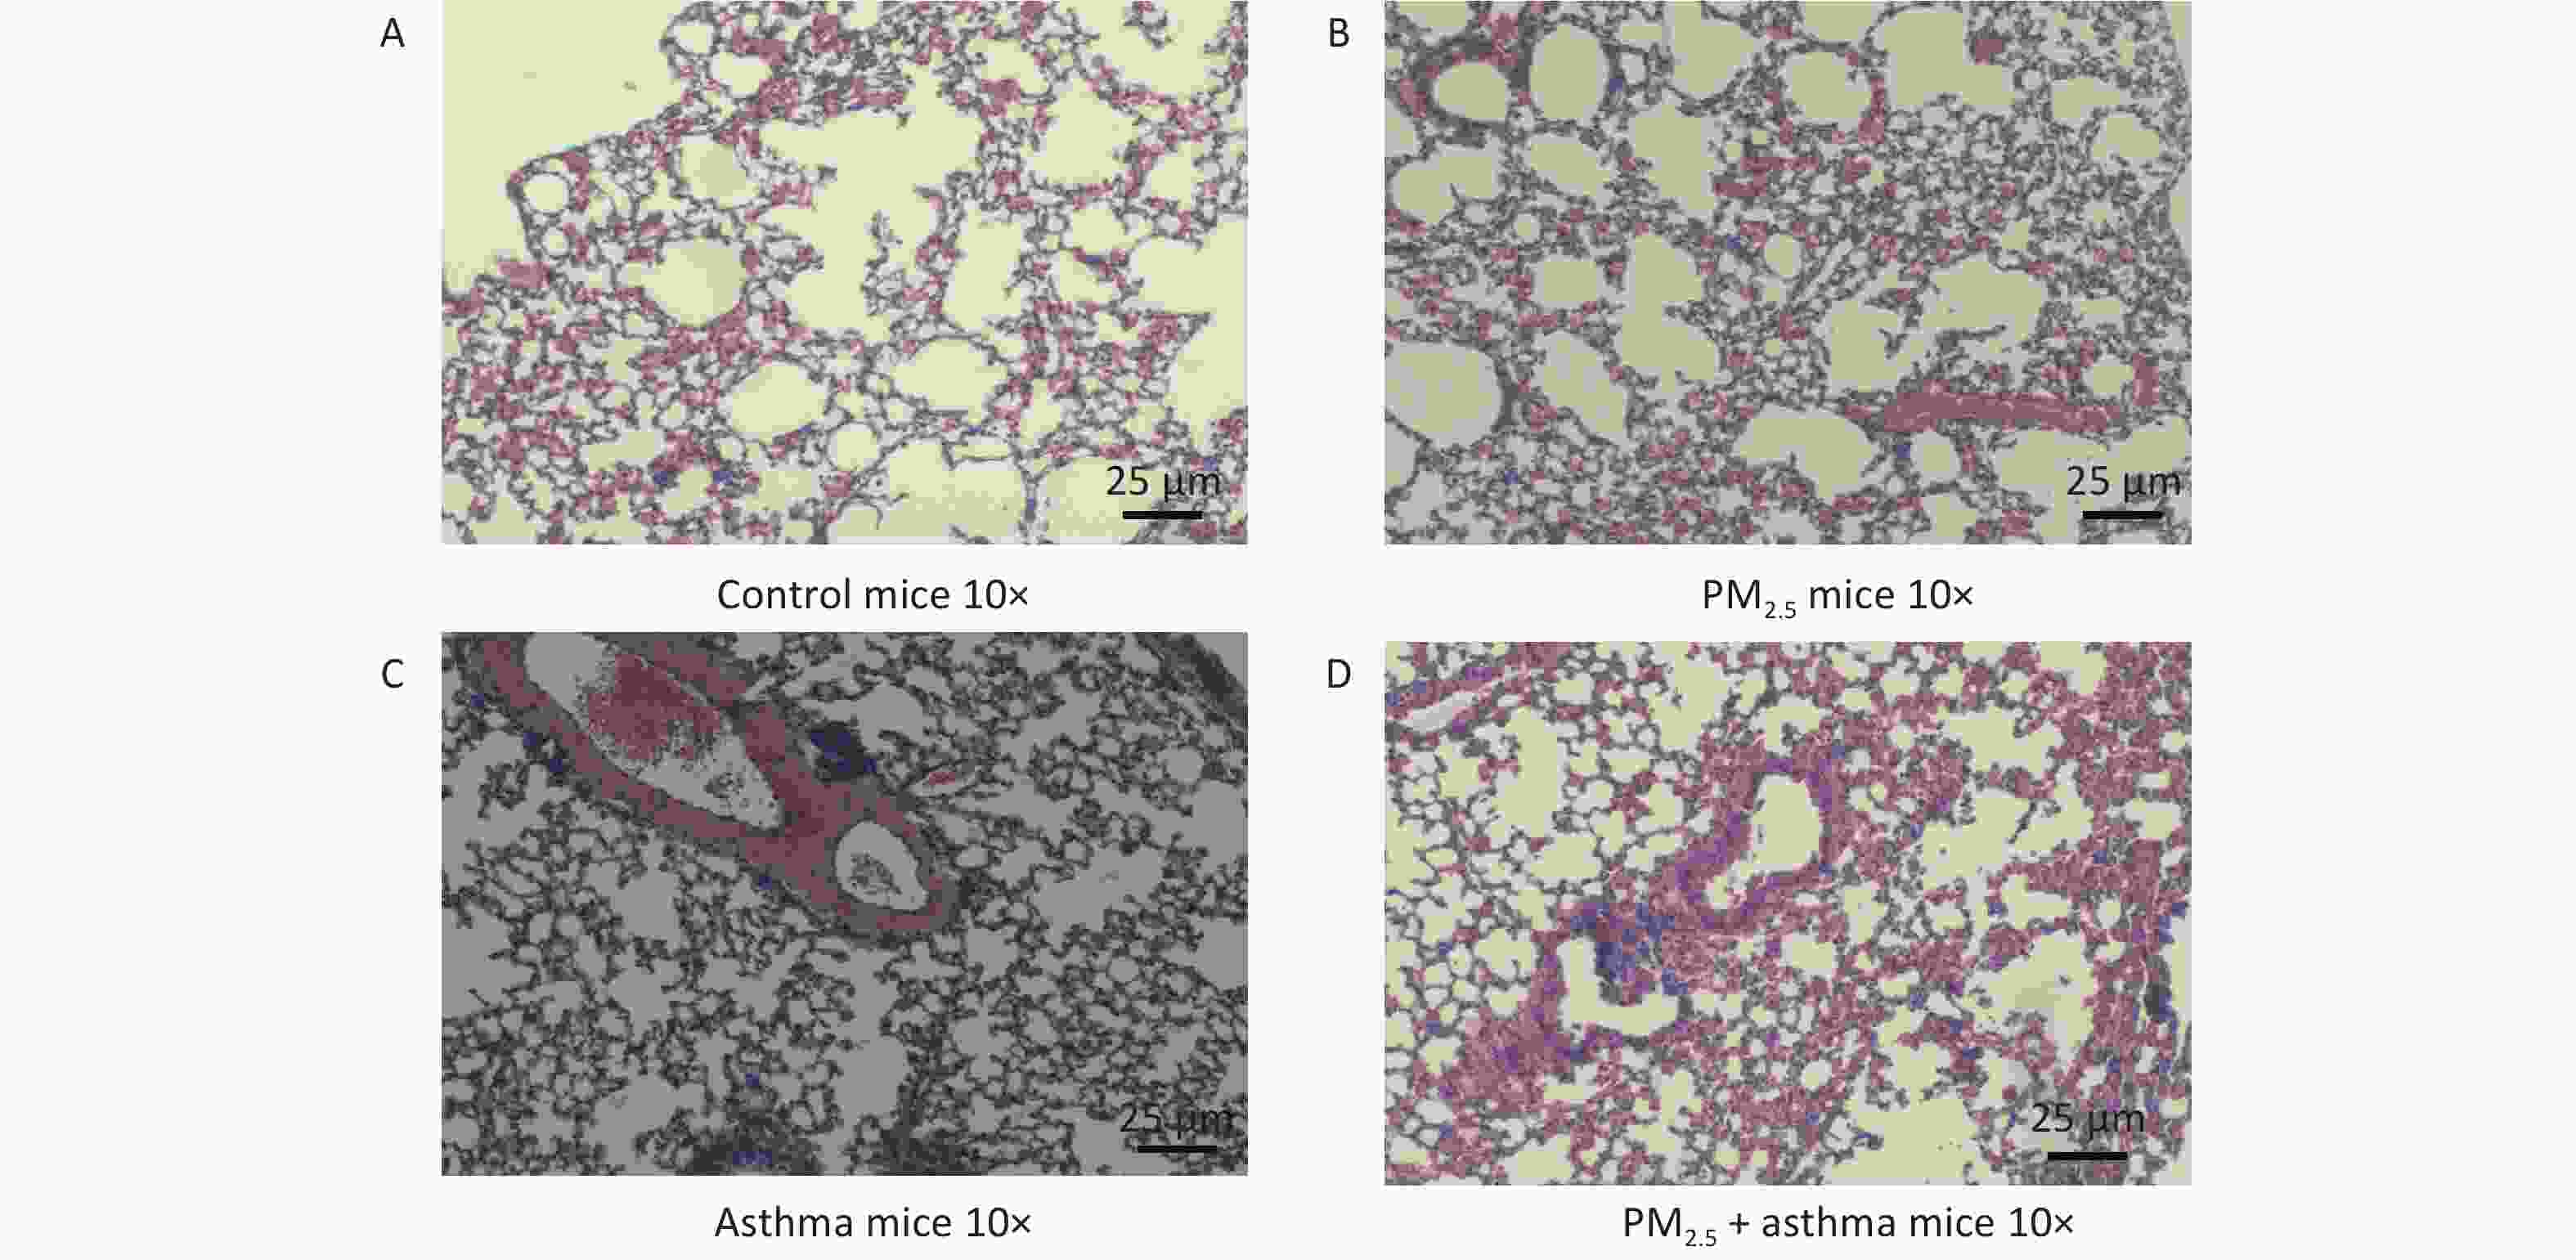
Figure 3. Histopathological analysis of lung tissues in four different experimental groups (H&E). Control (A), PM2.5 (B), OVA-sensitized (C), and OVA + PM2.5 treated groups (D). Scale bars = 25 µm.
-
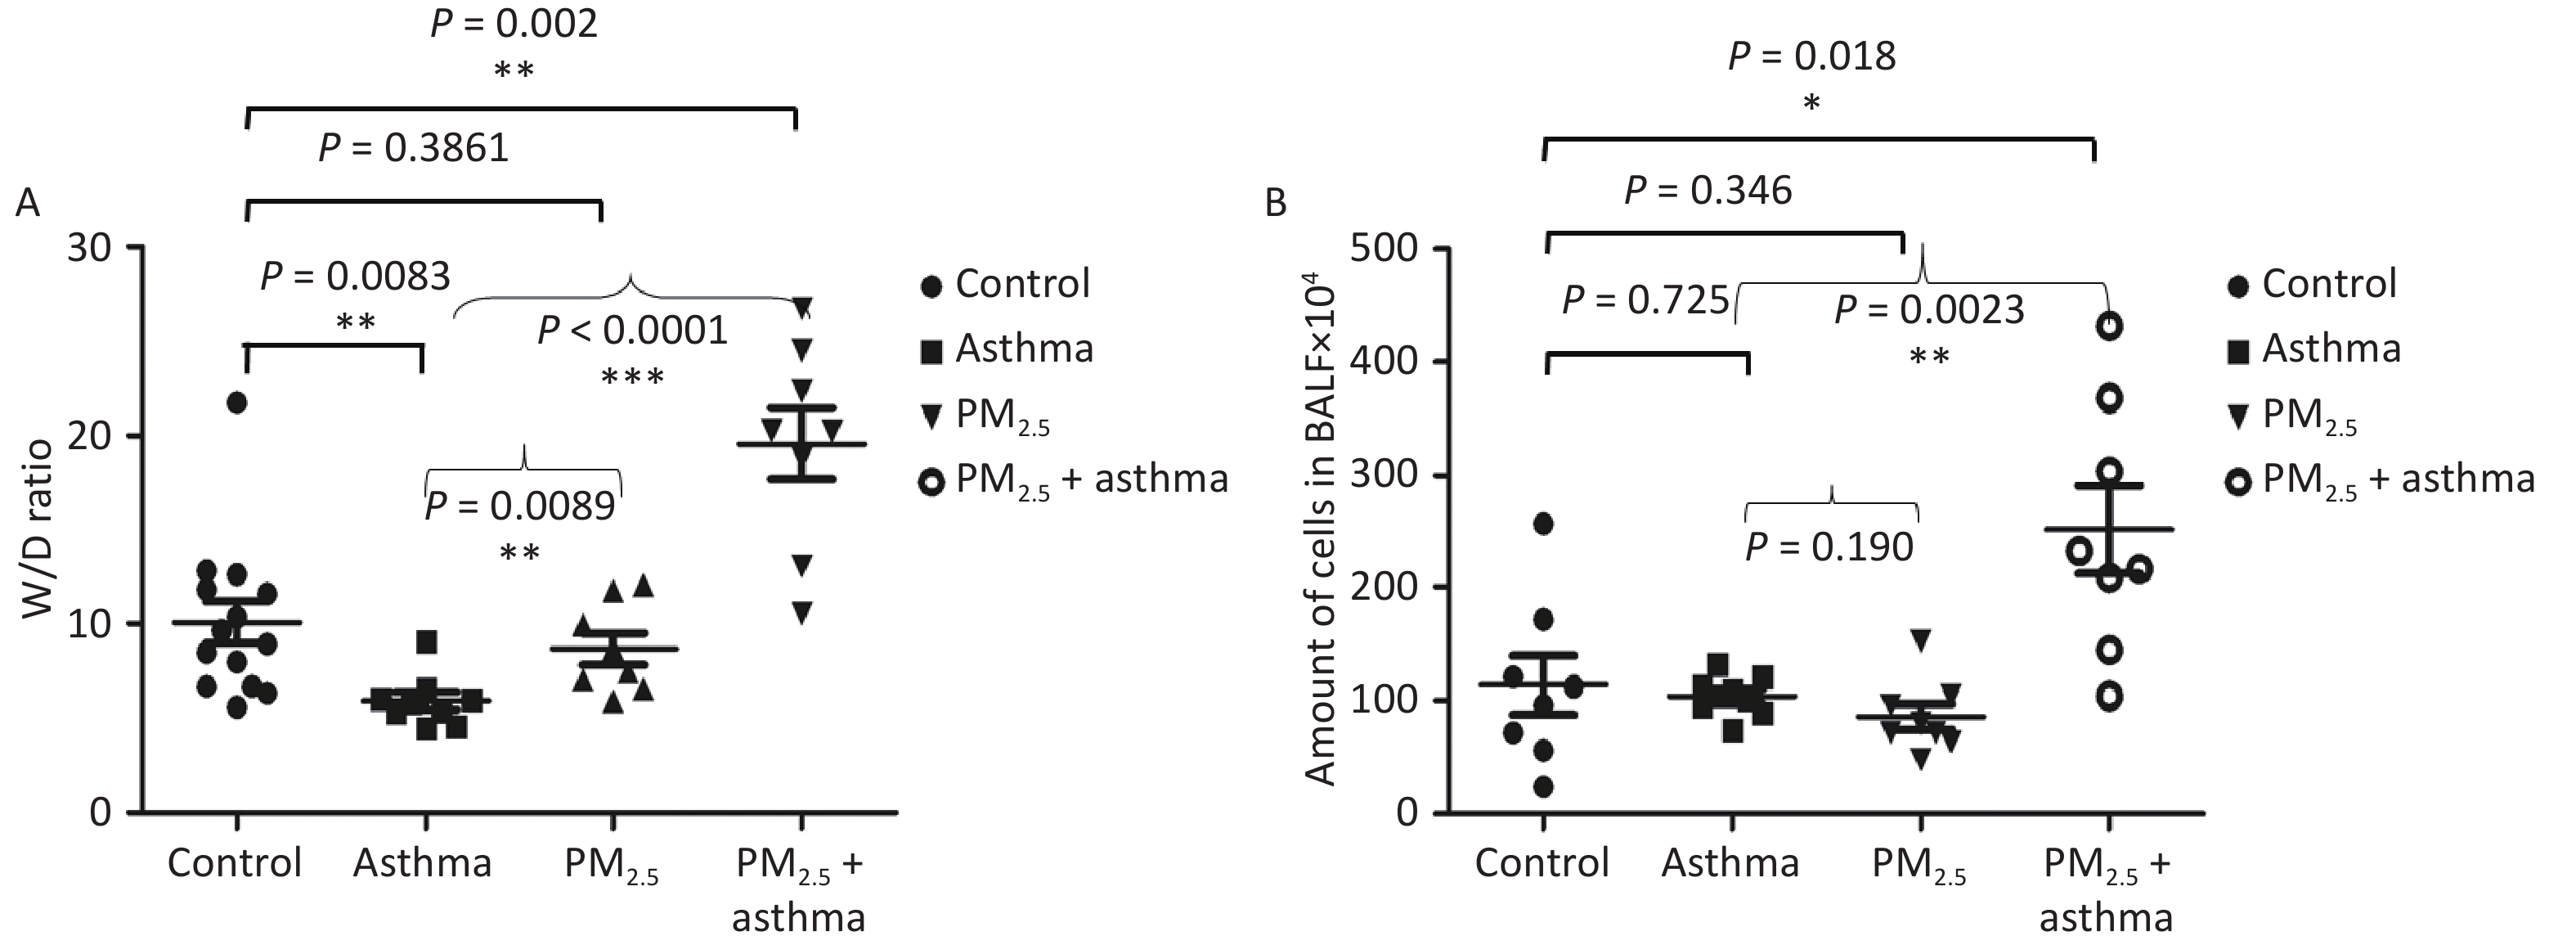
All of the mice were alive at the end of the animal experiment. The degree of lung injury was different in different groups. There was no significant increase in the lung wet-to-dry (W/D) weight ratio in the asthma and PM2.5 alone groups compared with the control group, but the PM2.5 + OVA group W/D ratio increased obviously (Figure 4A). In addition, the number of cells in BALF increased significantly in the PM2.5 + OVA group compared with the control, asthma and PM2.5 alone groups (Figure 4B).

Figure 4. Mouse W/D ratio and the number of cells in BALF in different groups. (A) mouse W/D ratio; (B) number of cells in BALF. **P < 0.01,*P < 0.05
-
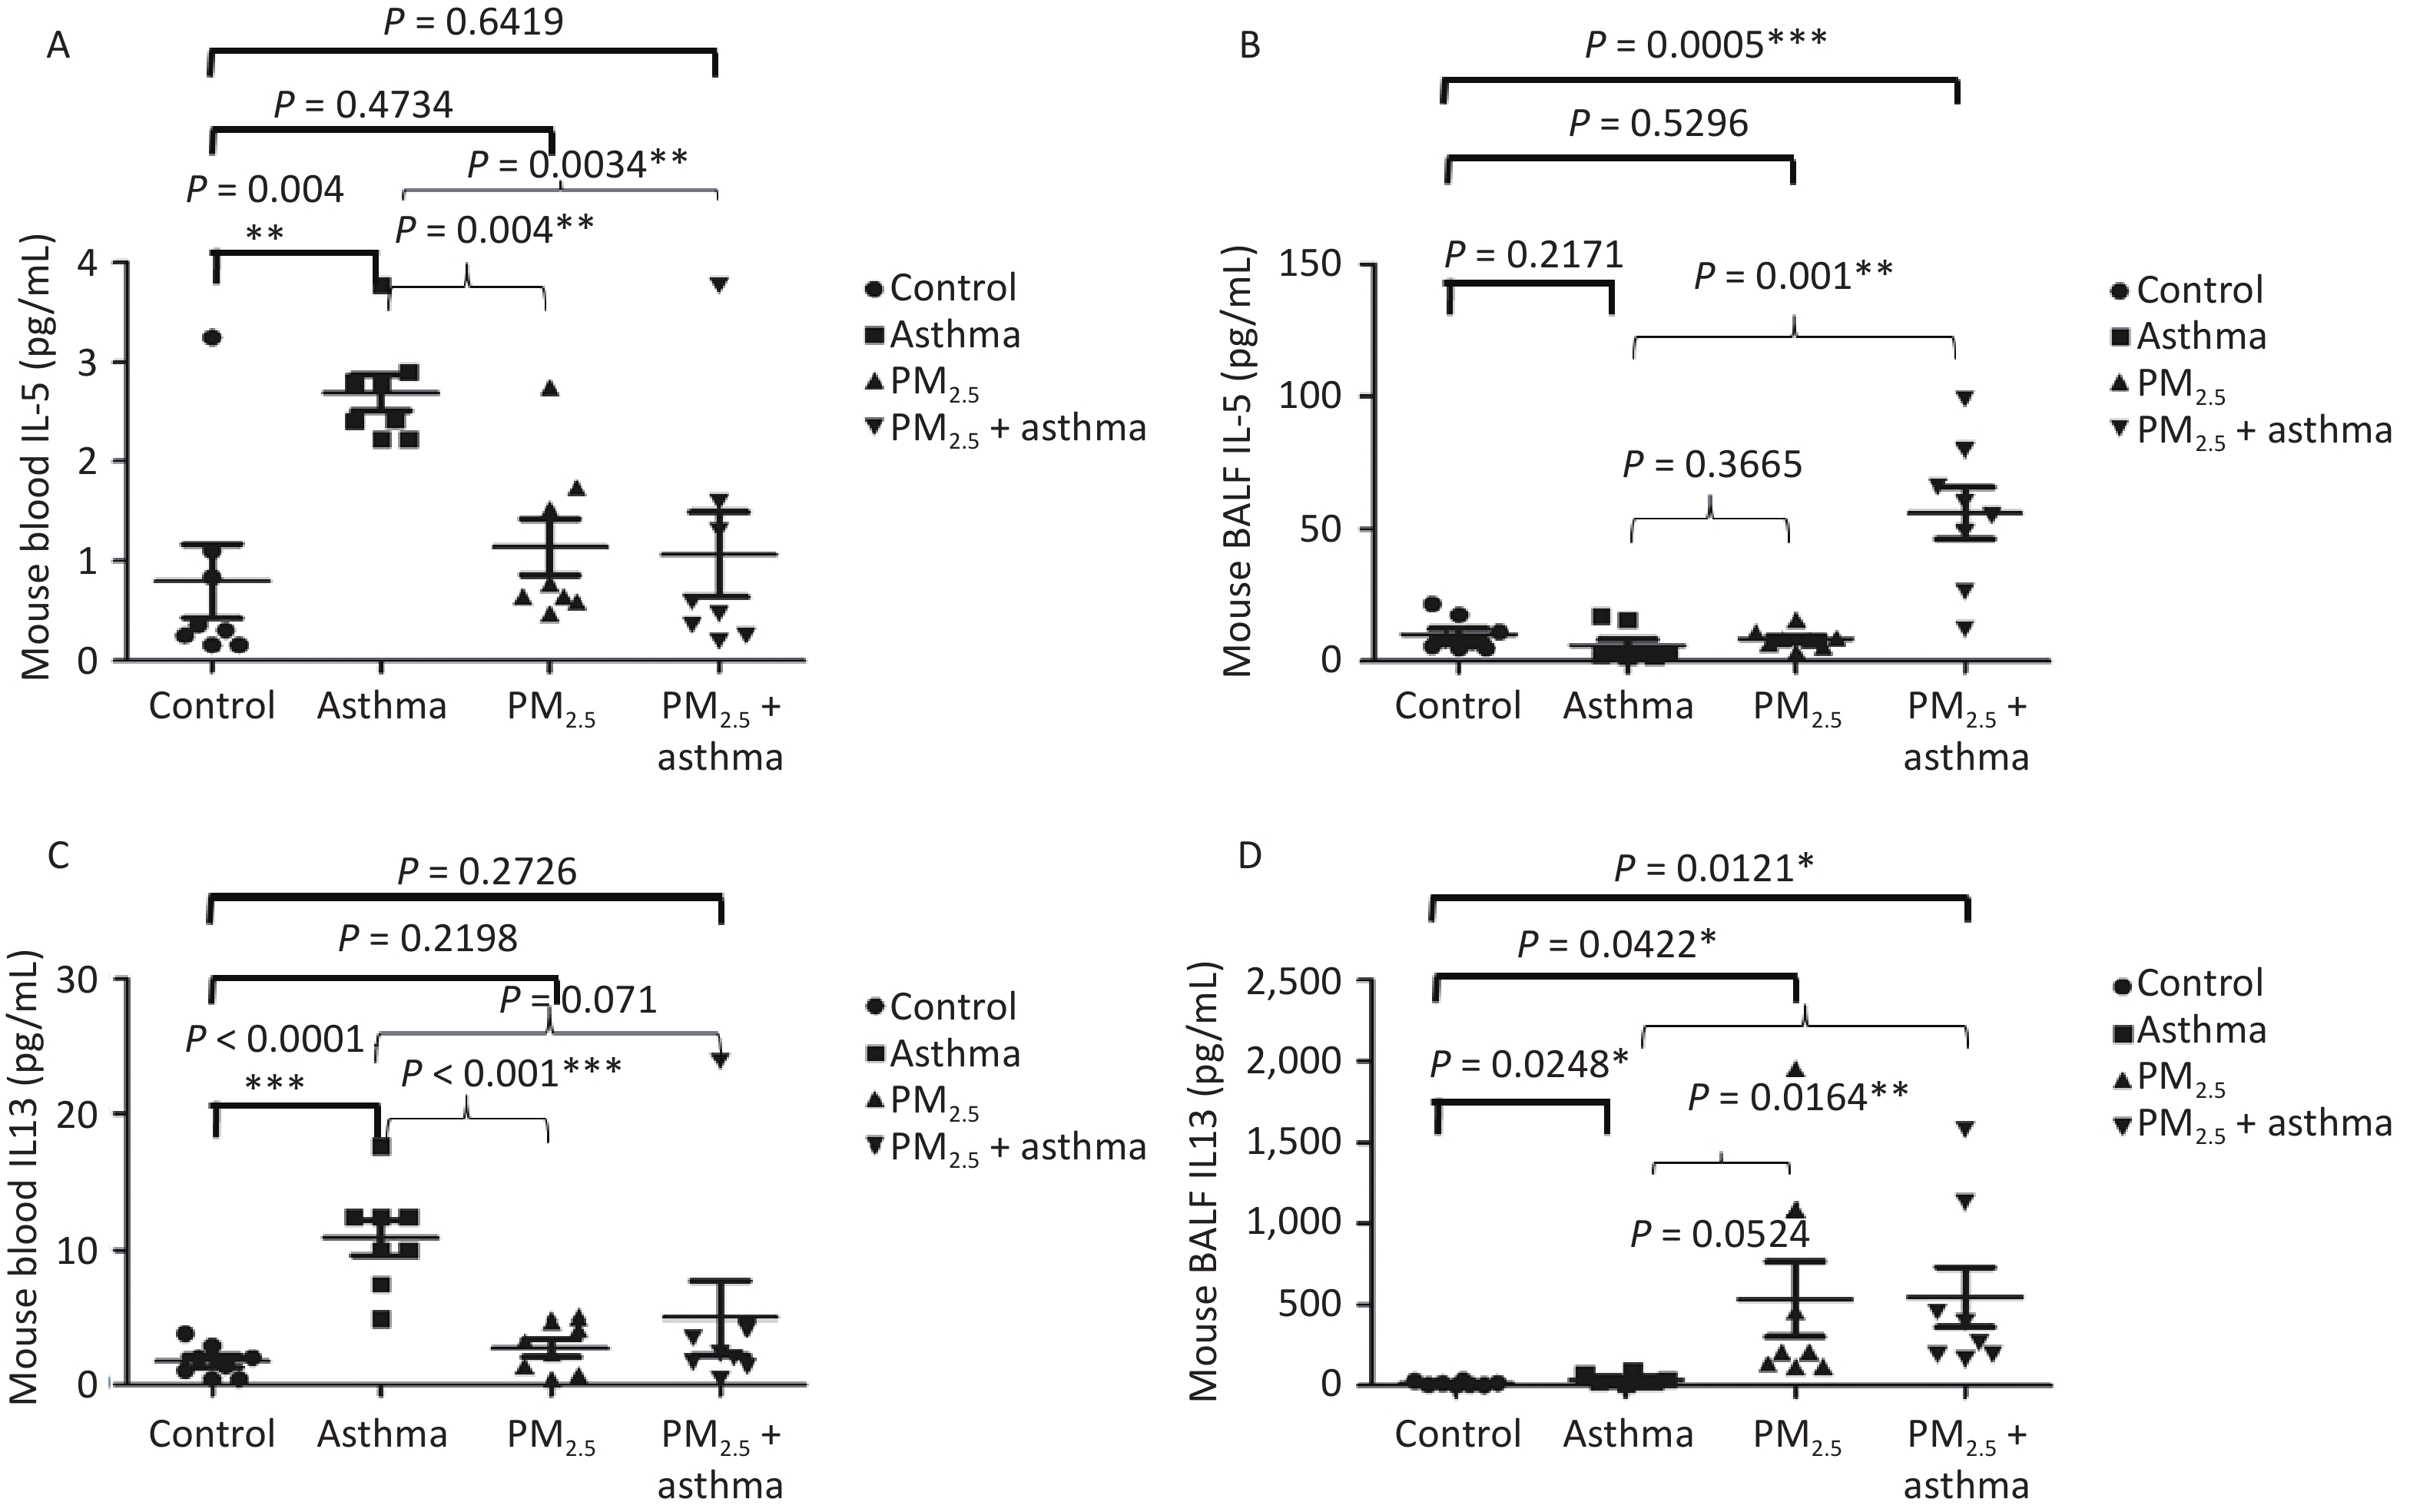
Studying the chronic effects of air pollutants on asthma patients, we found that PM2.5 was related to IL-5 and IL-13. Therefore, in the animal experiment, we detected the levels of IL-5 and IL-13 in the blood and bronchial lavage fluid of mice in each group. In blood, we found that the levels of IL-5 in the OVA, PM2.5 and PM2.5 + OVA groups were higher than those in the control group, but the difference only in the OVA model reached a significant level (Figure 5A). In BALF, IL-5 in the PM2. 5 + OVA model was the highest (Figure 5B). In the blood, the changes in IL-13 levels in mice were consistent with those in IL-5 levels. The levels of IL-13 in the asthma, PM2.5 and PM2.5 + OVA groups were higher than those in the control group, but the difference only in the asthma model reached a significant level (Figure 5C). In BALF, the IL-13 levels in the asthma, PM2.5 and PM2.5 + OVA groups were higher than those in the control group. The increase in the PM2.5 and PM2.5 + OVA groups reached statistical significance (Figure 5D).
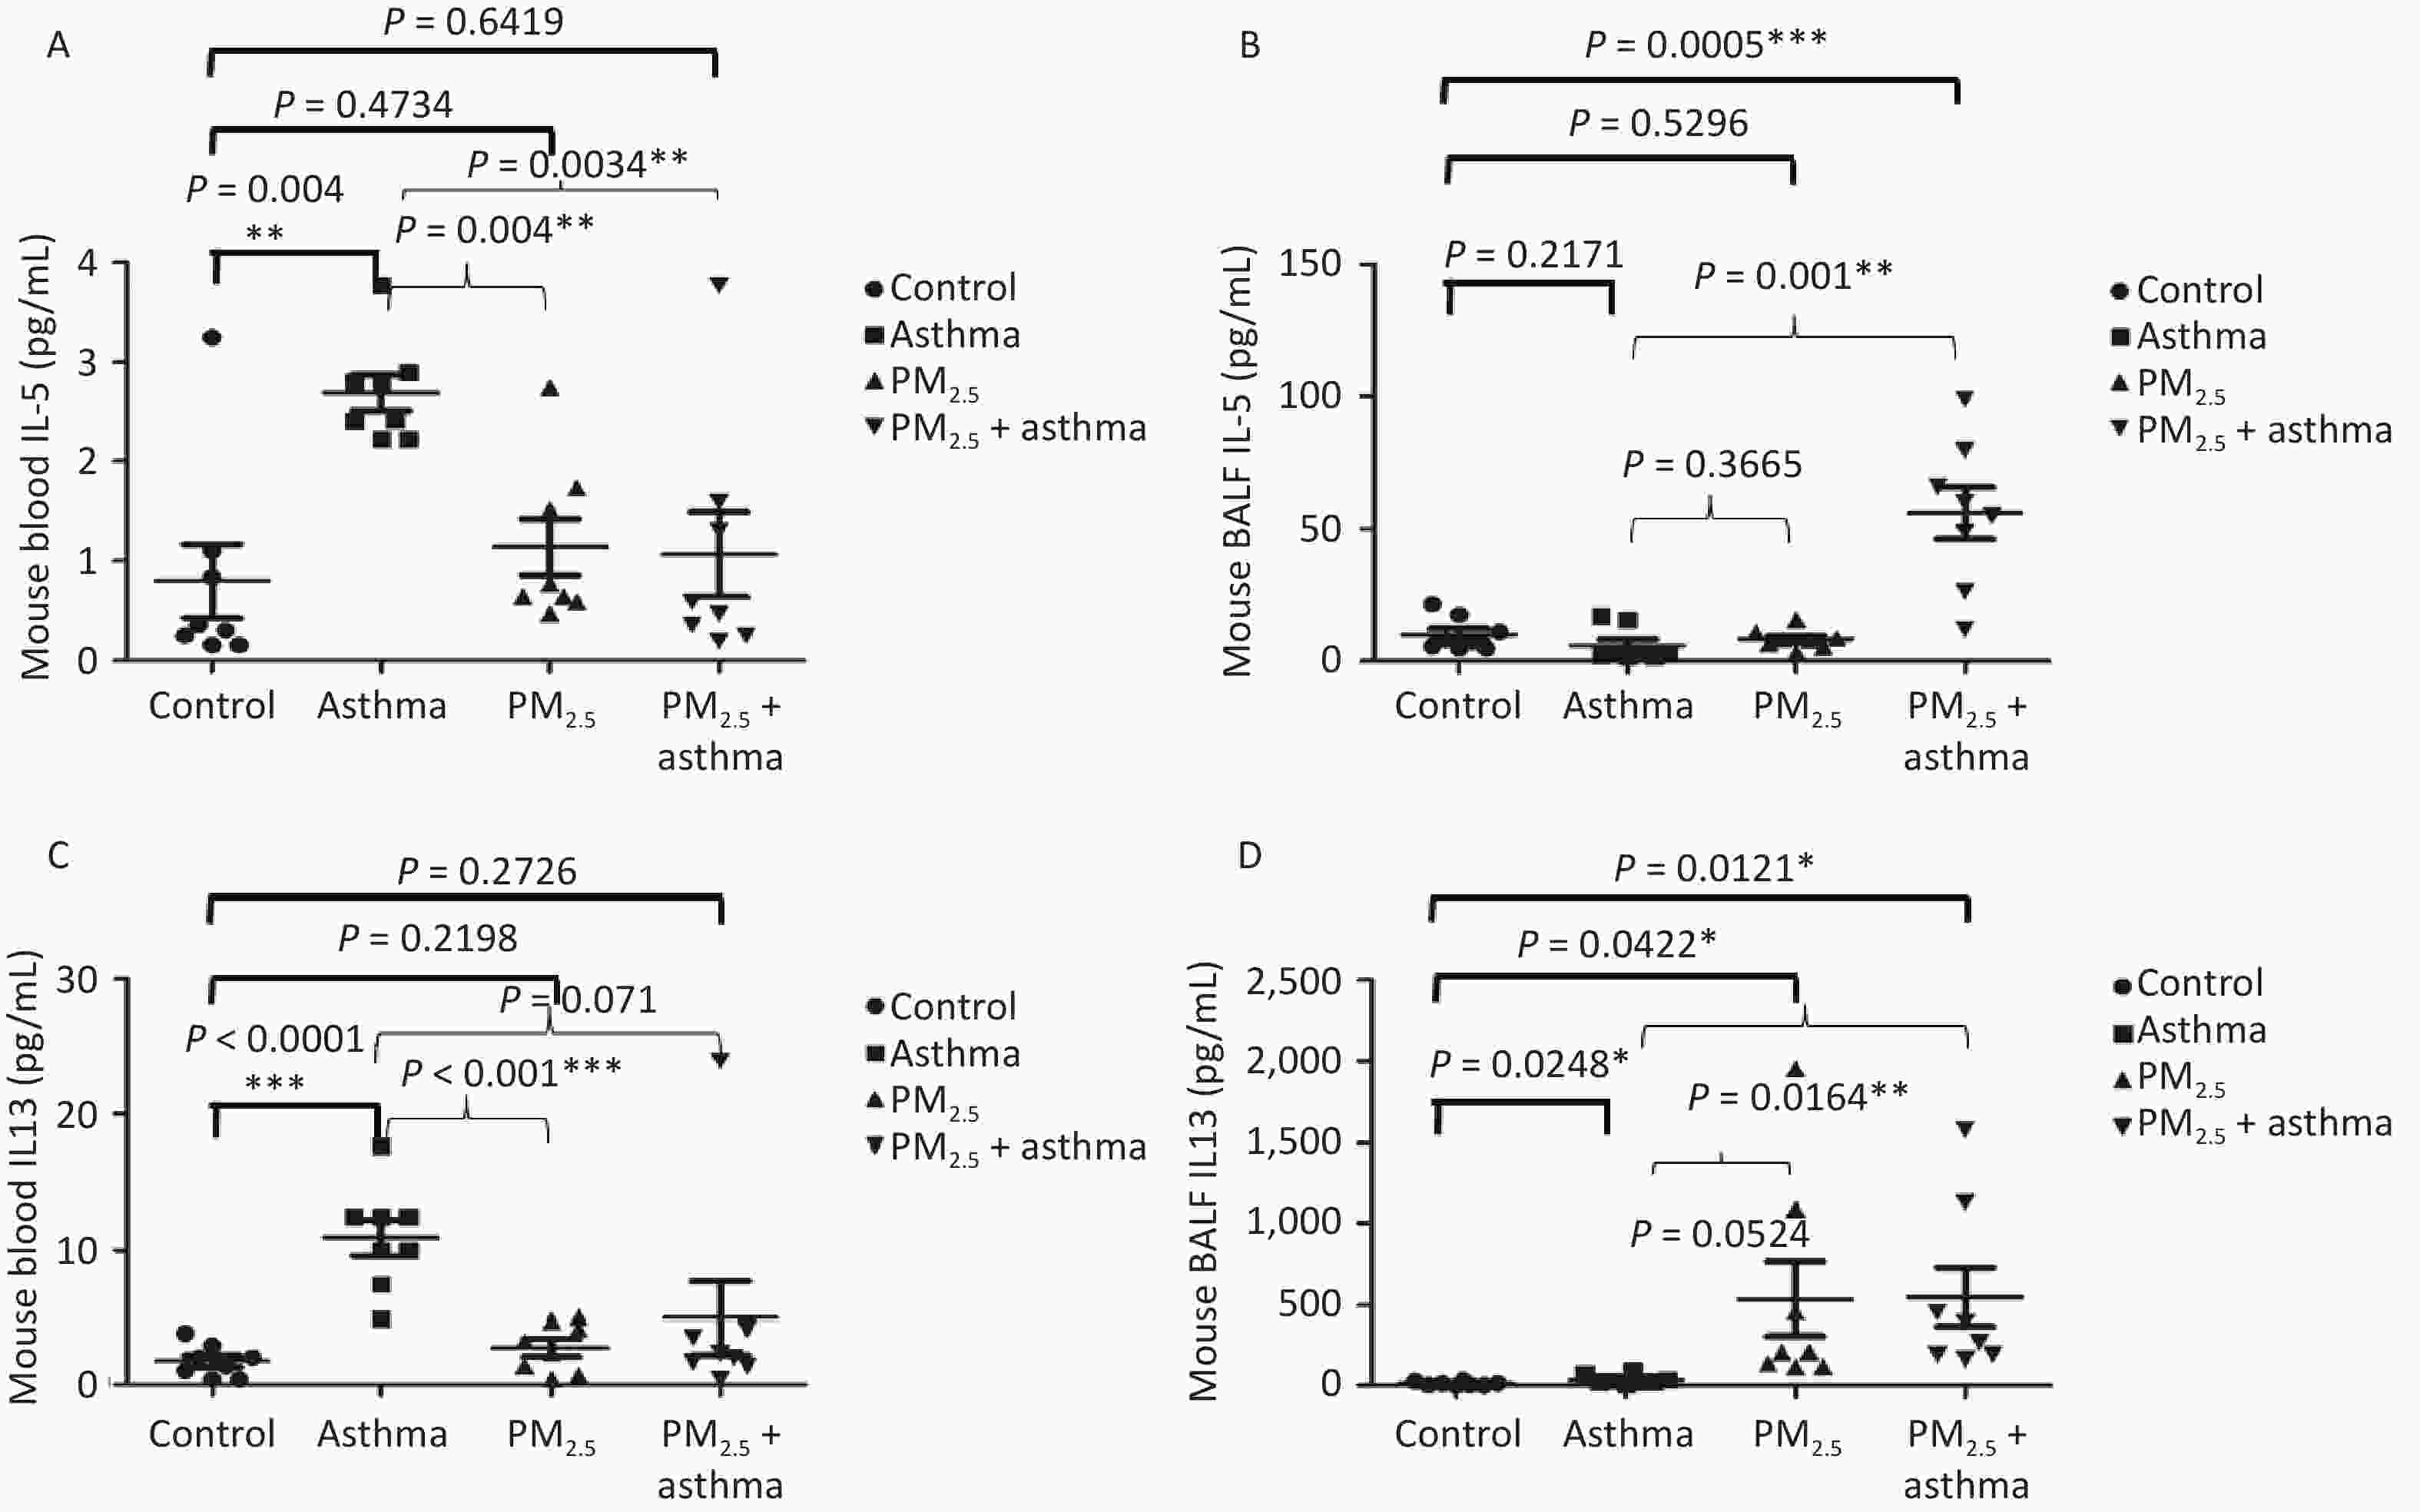
Figure 5. Differences in blood and BALF levels of IL-5 and IL-13 in BALB/c mice. (A) Mouse blood IL-5; (B) Mouse BALF IL-5; (C) Mouse blood IL-13; (D) Mouse BALF IL-13 (***P < 0.001, **P < 0.01, *P < 0.05).
-
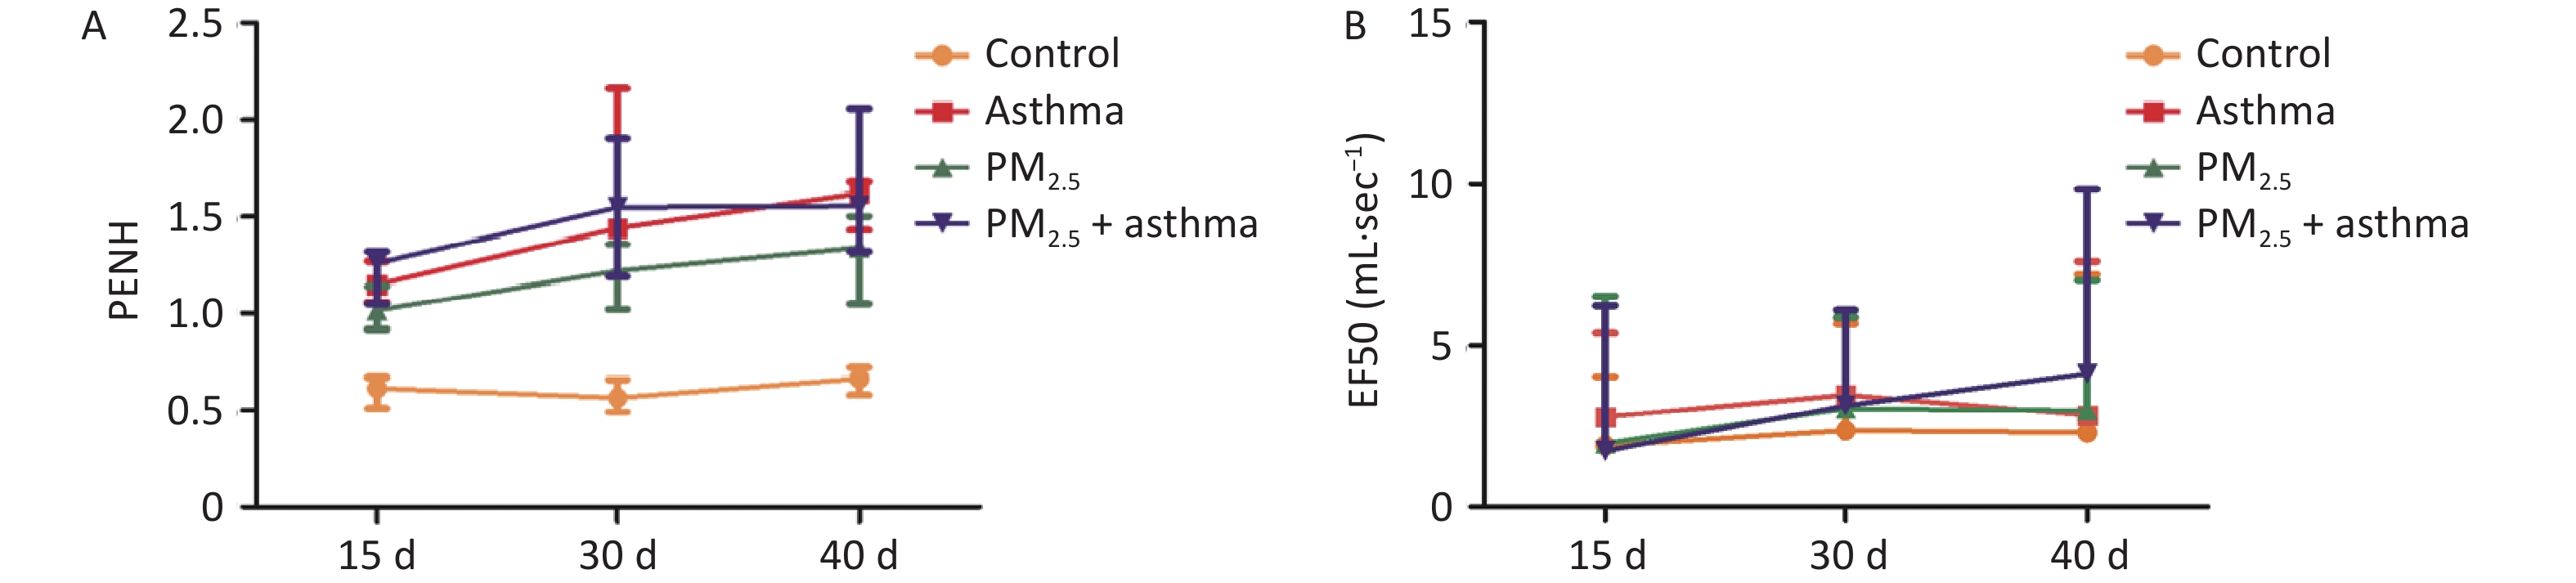
In the OVA group, PM2.5 or PM2.5 + OVA group, Penh increased gradually with the extension of time. Penh was higher in the asthma and PM2.5 + OVA groups than in the other two groups. Whether in the OVA group, PM2.5 or PM2.5 + OVA group, Penh was higher than that in the control group on the 15th, 30th, and 40th days (Figure 6A).
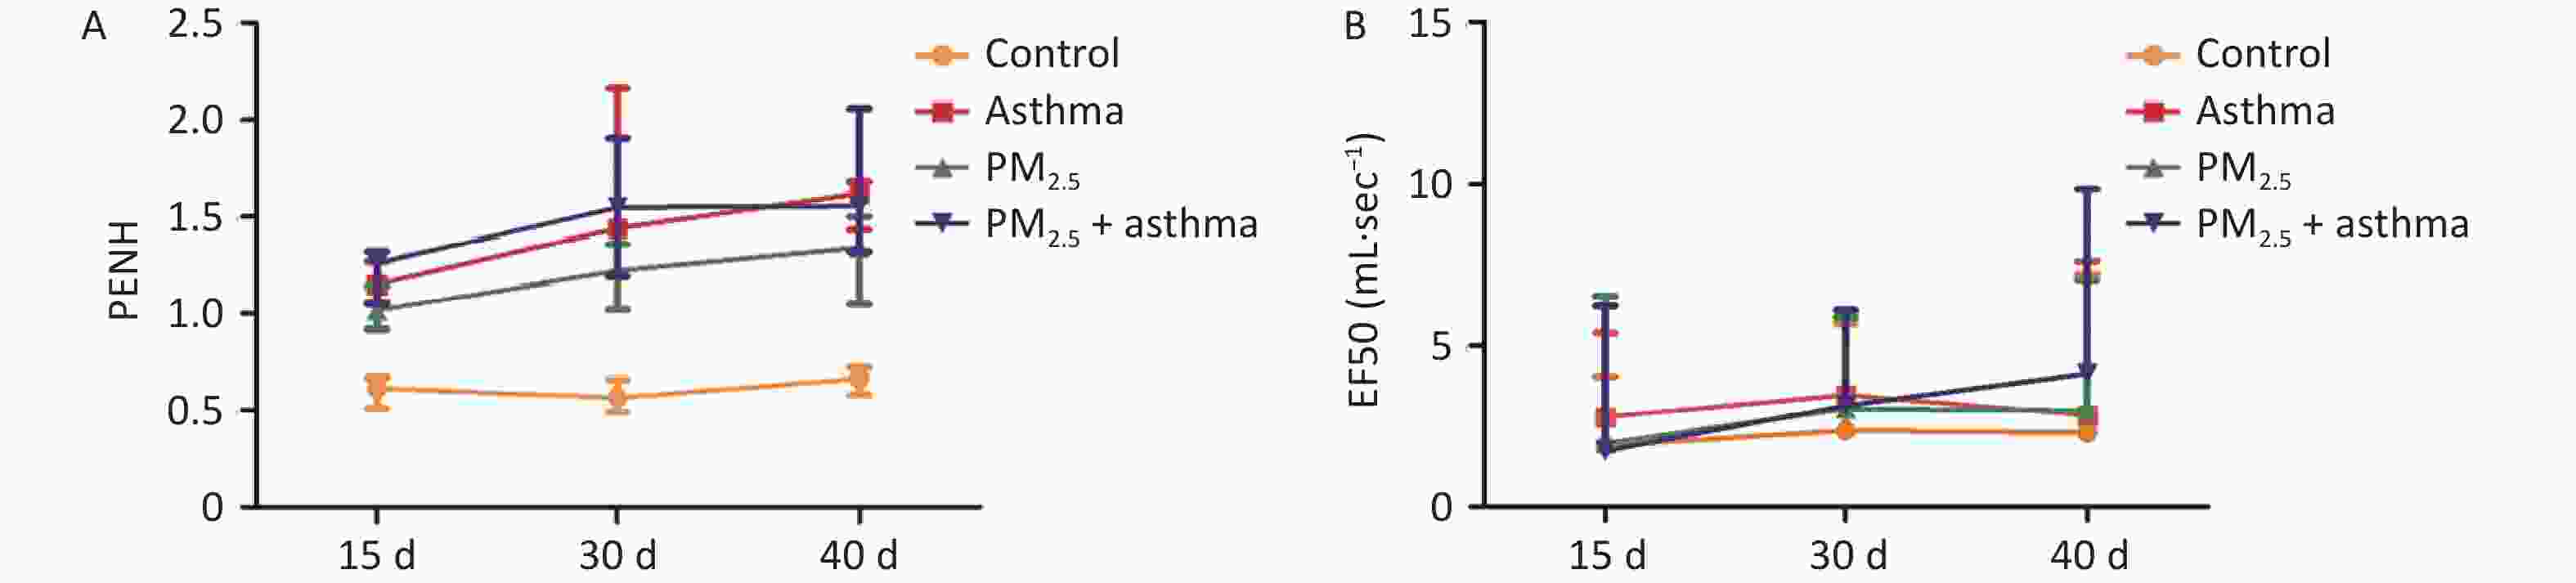
Figure 6. Comparison of lung function in different groups of BALB/c mice. (A) PENH; (B) EF50.
-
In the OVA-induced asthma mouse group, EF50 increased slowly over time. In the PM2.5 and asthma mouse groups, EF50 changed similarly over time. In the PM2.5 + OVAOVA group, EF50 increased significantly from 30–40 days. In all three experimental groups (asthma, PM2.5, PM2.5 + OVA), EF50 was higher than that in the control group (Figure 6B).
-
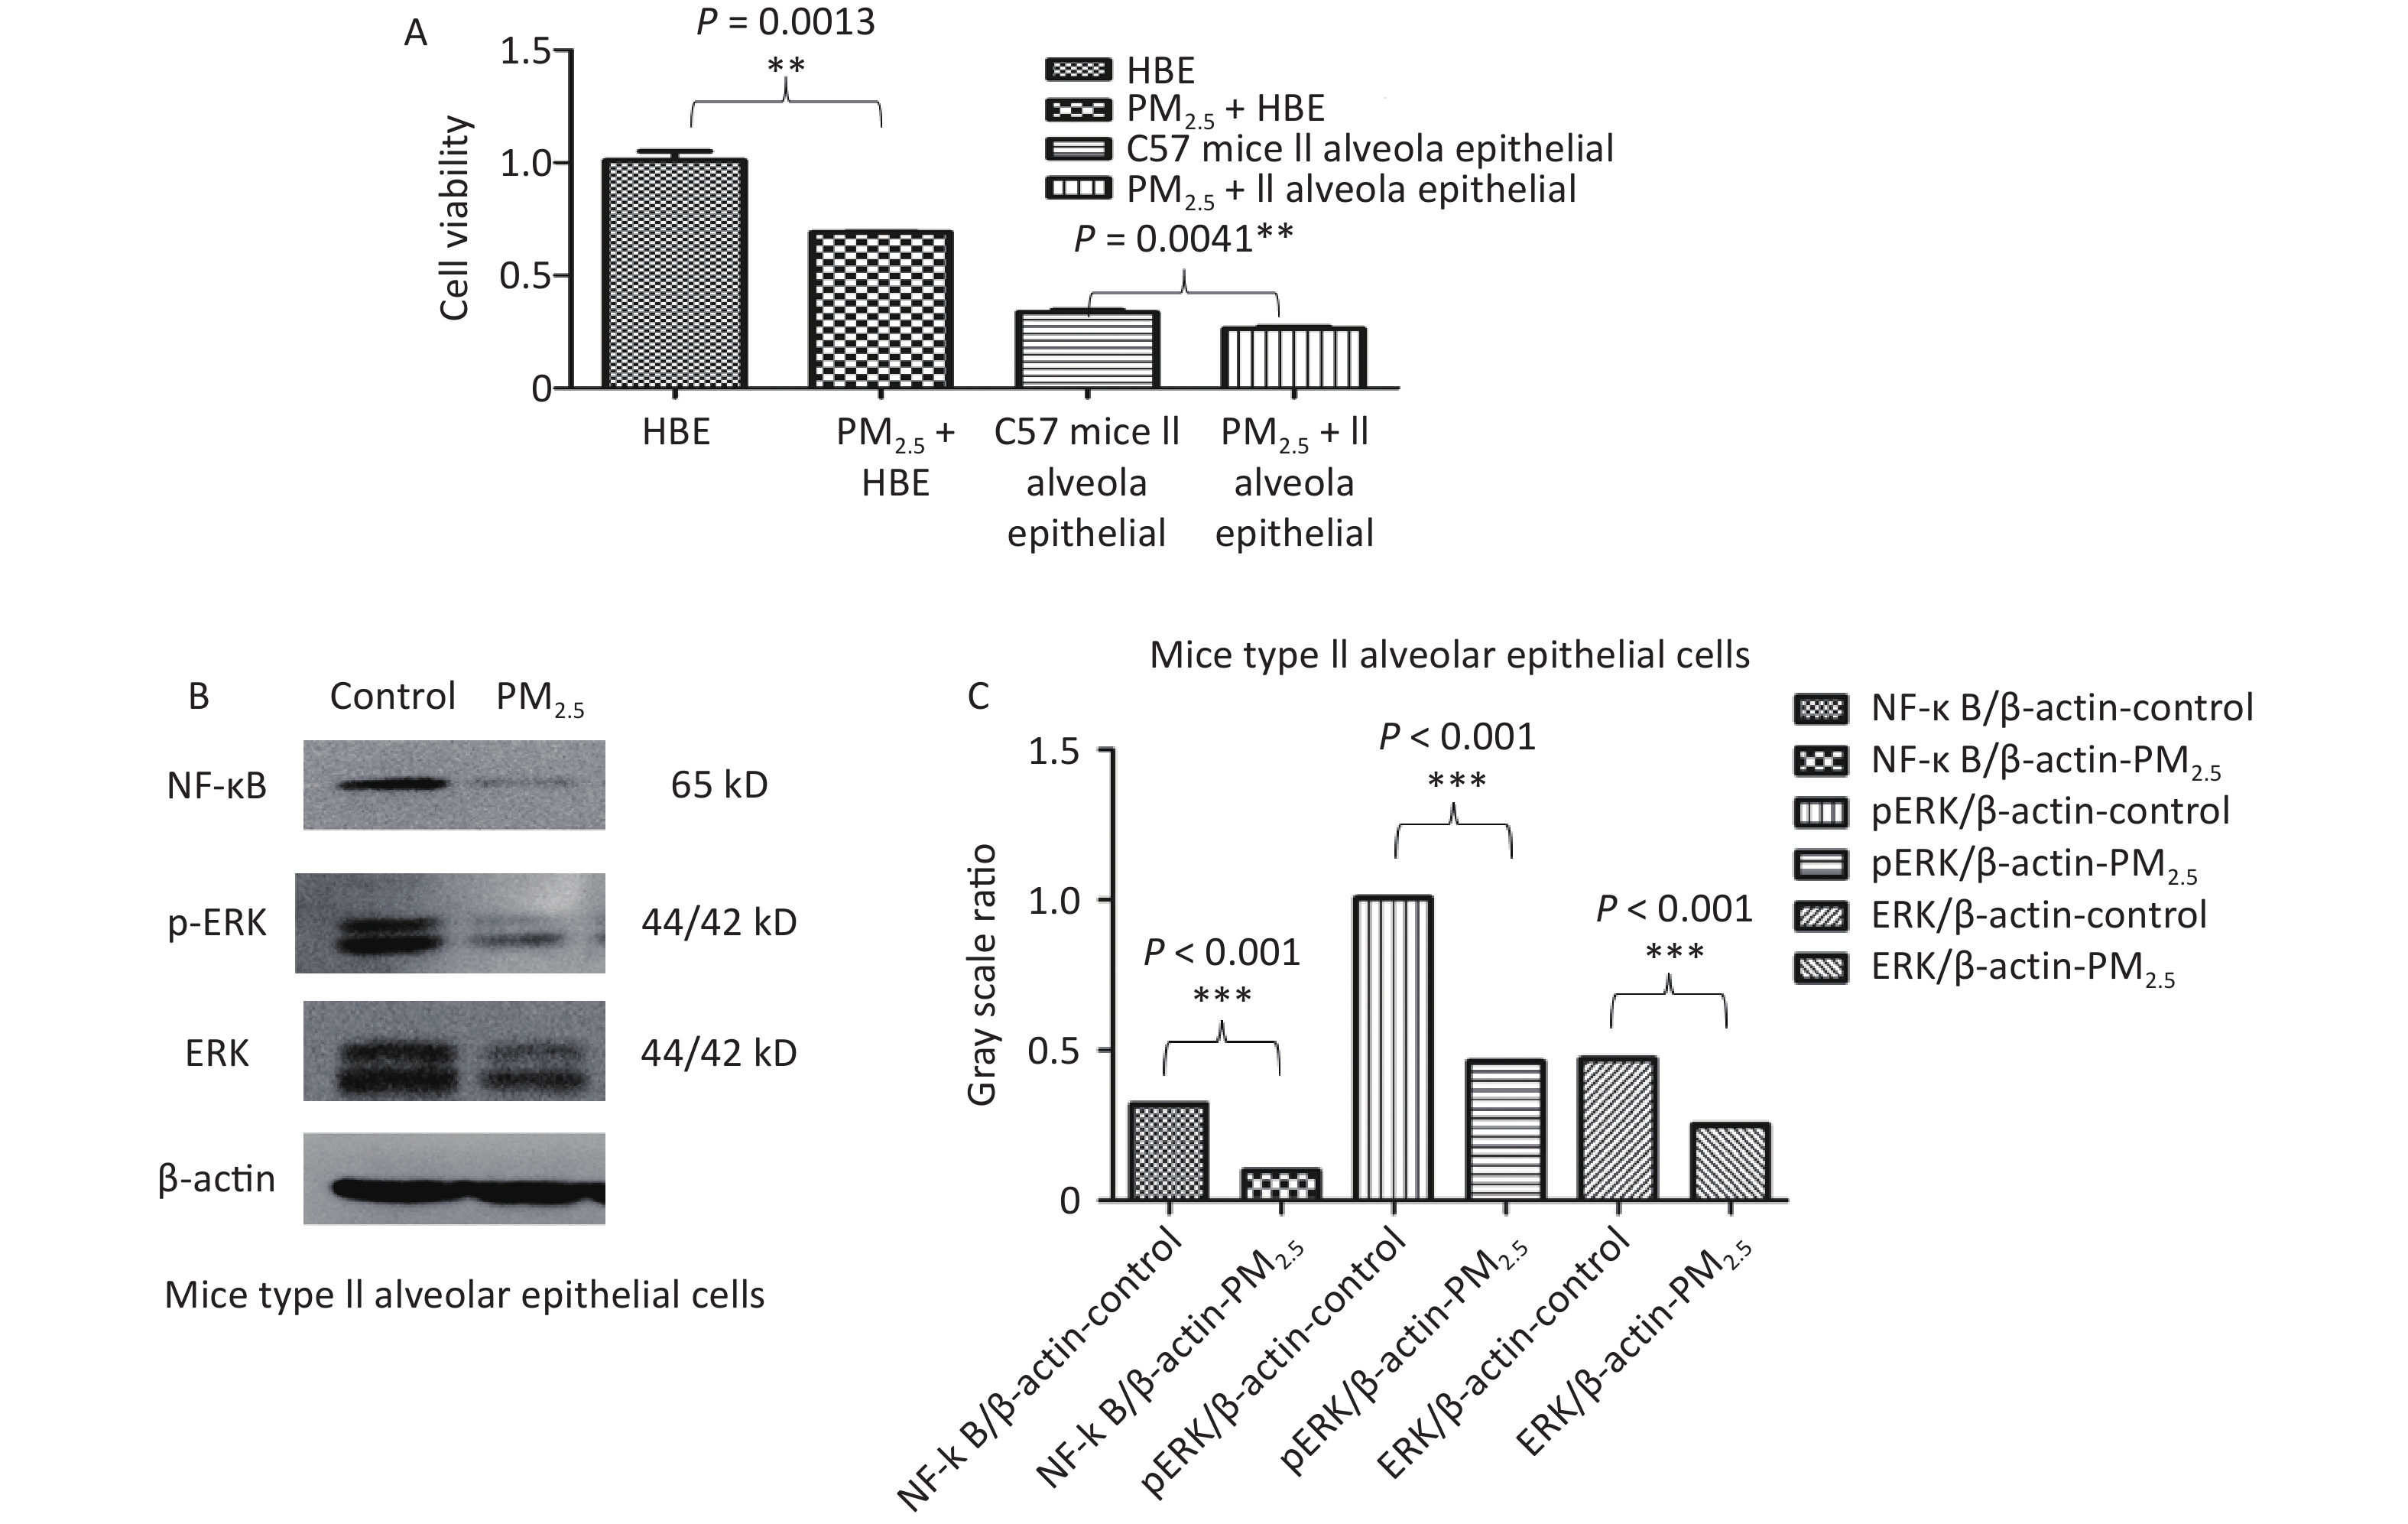
In vitro, the viability of both HBE and C57 mouse type II alveolar epithelial cells was decreased by 10 µg/mL PM2.5 (Figure 7A). PM2.5 (10 µg/mL) inhibited NF-κB, ERK and p-ERK protein expression in C57 mouse type II alveolar epithelial cells (Figure 7B–C).
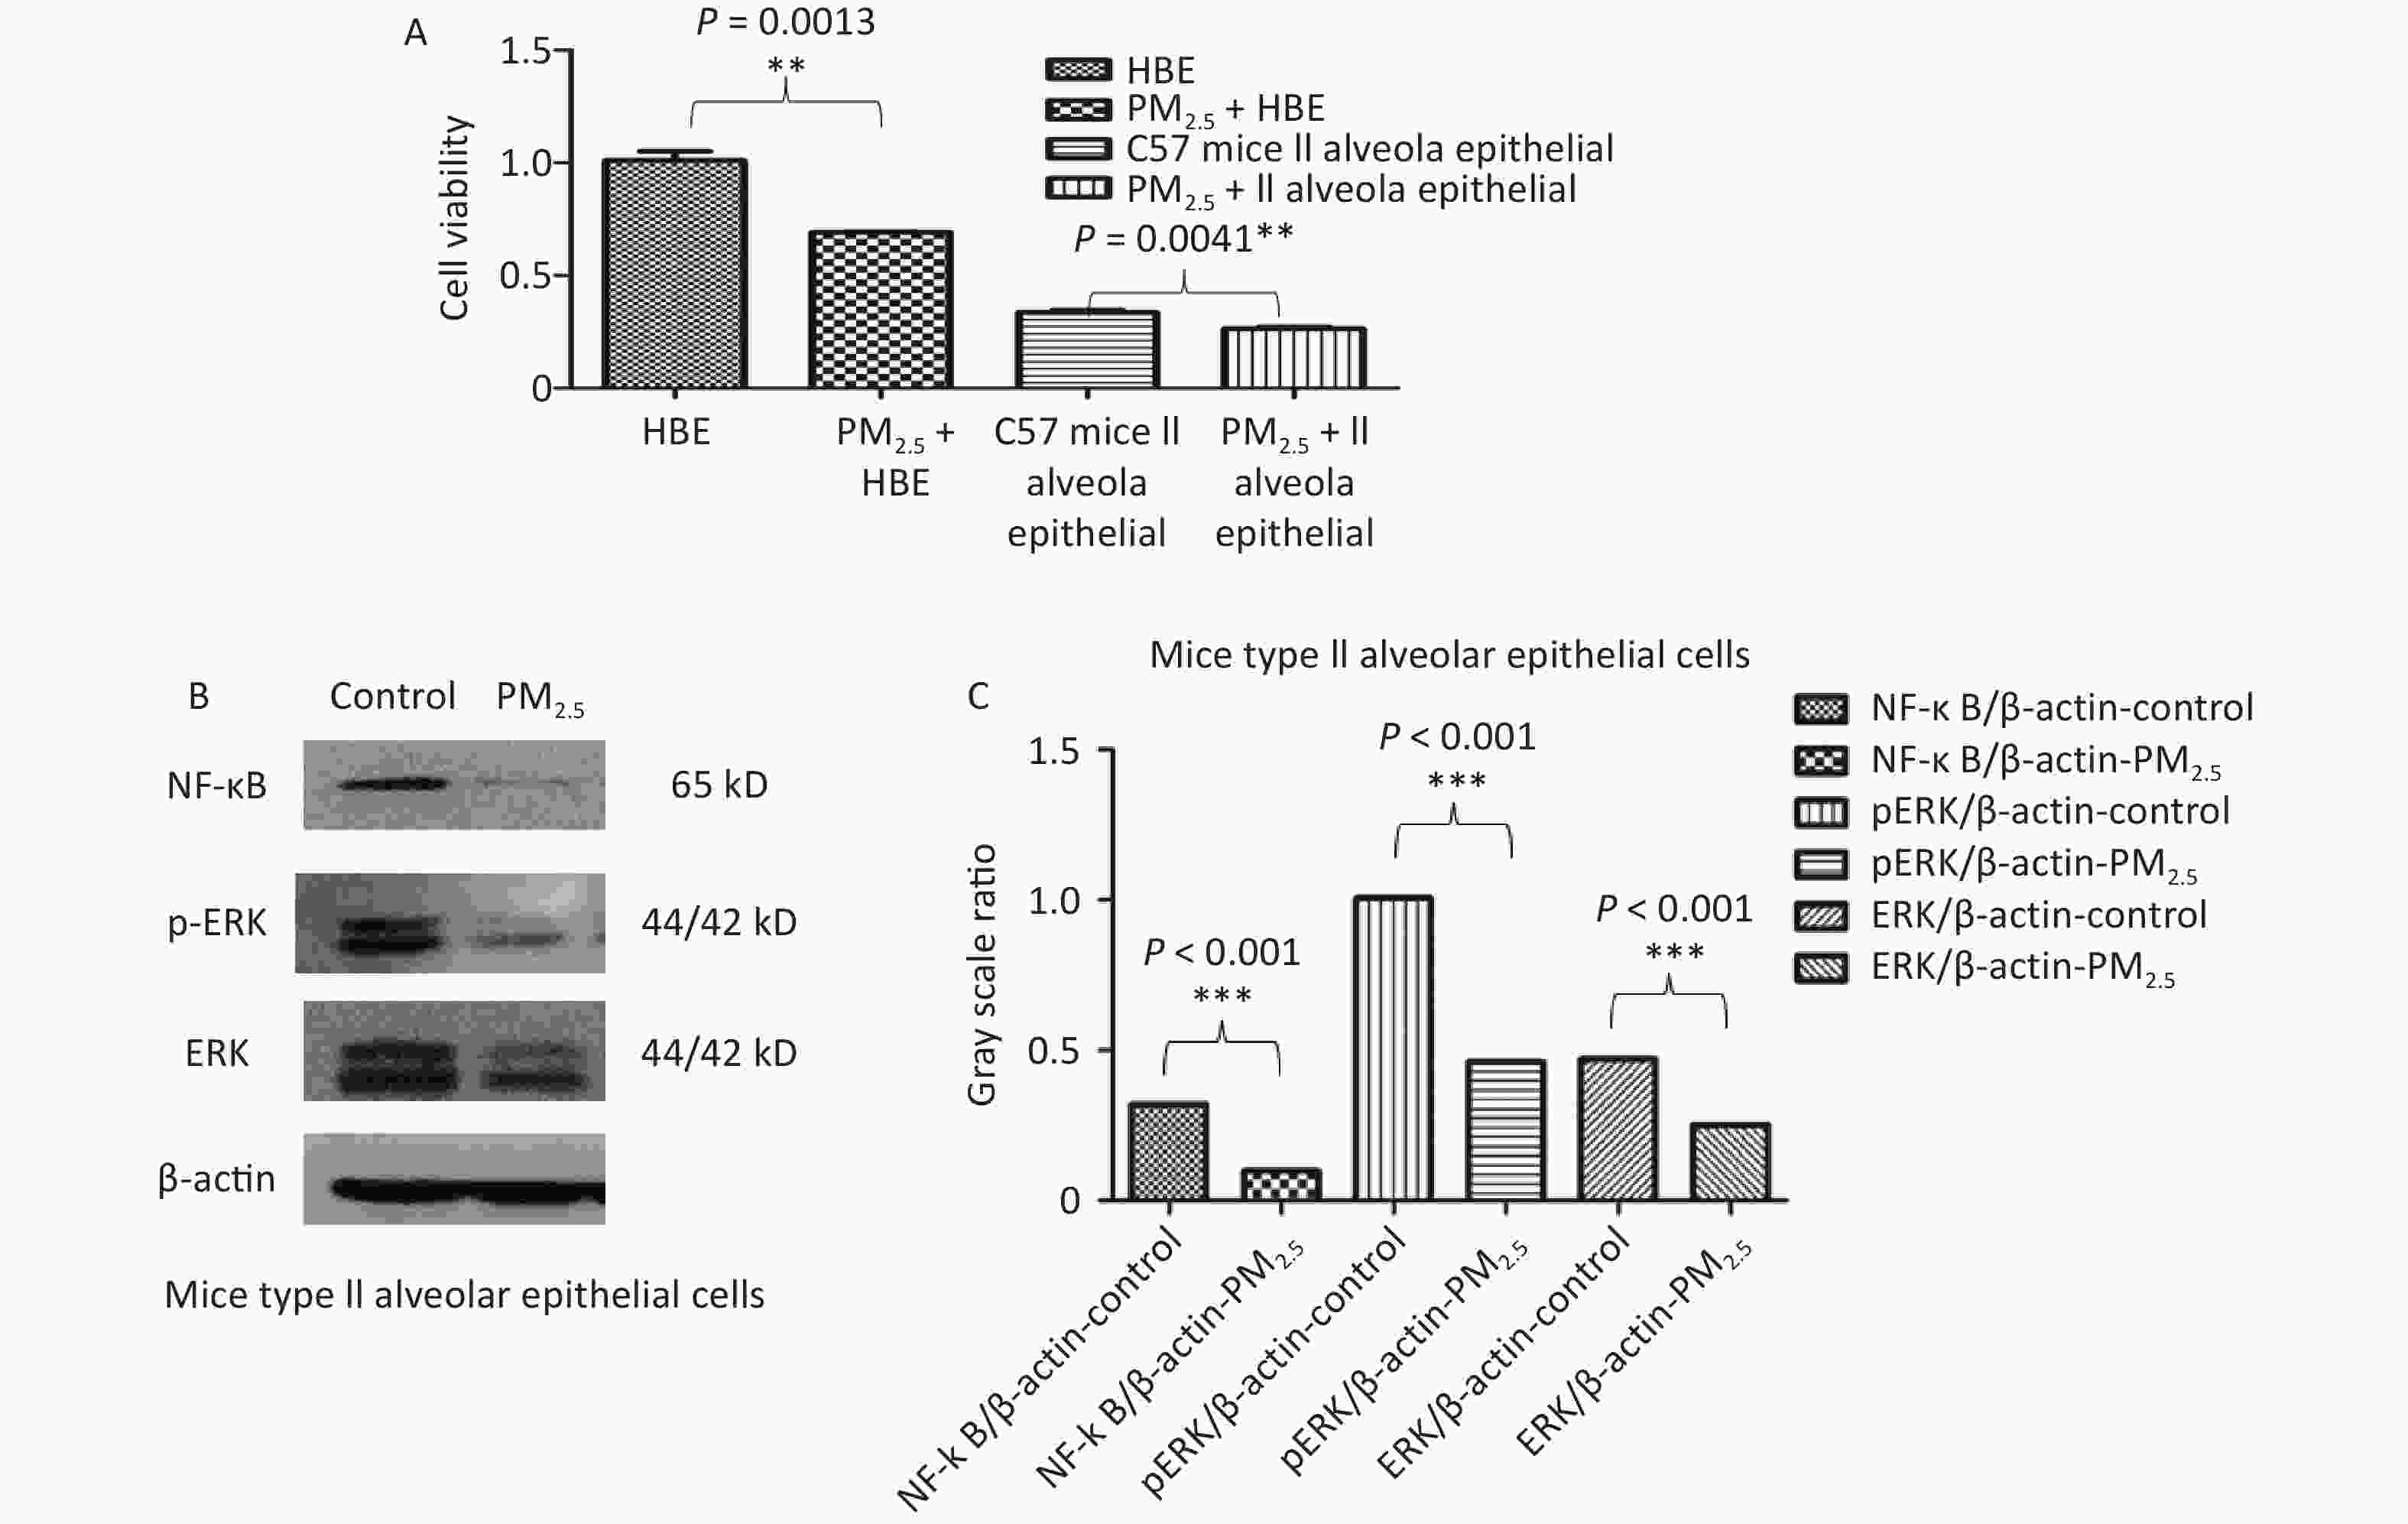
Figure 7. Effect of PM2.5 on cell proliferation and the possible mechanism in vitro. (A) PM2.5 inhibits cell proliferation in different cell lines (**P < 0.01); (B and C) NF-κB, ERK and p-ERK protein expression in C57 mouse type II alveolar epithelial cells.
-
Our observational study provides valuable insights into the intricate relationship between ambient outdoor air pollutants and their impact on lung function and inflammatory cytokines in adults with asthma. We examined both acute and chronic effects, uncovering associations that contribute to our understanding of asthma exacerbation in the context of environmental pollution.
In the acute effects observation, we found negative correlations between ambient air pollution, especially the O3 and NO2 subindexes, and PEF in asthma patients. When other factors remain unchanged, the PEF value decreases by 0.44 mL/min for every 1 μg/m3 increase in the daily mean value of O3 and by 2.02 mL/min for every 1 unit increase in the NO2 subindex. These results were consistent with many studies in other areas and countries[30,31]. Notably, NO2 emerged as a pivotal component of ambient air pollution and is the ambient pollutant targeted in many national environmental health policies. NO2 is a tracer of traffic-related air pollution but is toxic itself and can combine with high O3 levels and volatile organic compounds in the atmosphere, producing highly promiscuous oxidants such as hydroxyl radicals (·OH), peroxyl radicals (HOO·) and singlet oxygen (1O2)[32,33]. The tropospheric O3 in this reaction is another highly oxidative agent, produced as a photochemical product of ambient air pollution, with well-documented effects on the bronchial epithelium. The intricate interplay between NO2 and tropospheric O3 underscores the oxidative stress burden faced by individuals with asthma, whose respiratory tract lining fluid (RTLF) antioxidant defences may already be compromised.
Conversely, our chronic effect observation revealed intriguing correlations between PM2.5, PM10, and Air Quality Index (AQI) with interleukin-5 (IL-5) and interleukin-13 (IL-13) levels in asthma patients. However, we found no correlation between pulmonary function, ACT, FeNO and O3, NO2 or other components of ambient air pollutants in patients with asthma. Our results provide preliminary evidence that chronic air pollution exposure is associated with a stronger proinflammatory response from stimulated immune cells. This aligns with previous research showing that chronic exposure to PM2.5 and black carbon can stimulate the production of pro-inflammatory cytokines[34,35]. Our results raise the possibility that increased Th2 inflammatory reactivity may contribute to inflammatory conditions associated with air pollution, especially with PM2.5 and PM10. The inflammatory reactivity associated with air pollution probably occurs prior to changes in lung function and symptoms in asthma patients.
The mechanisms by which particulate matter exerts its effects are multifaceted. Ambient urban air pollution consists of gaseous components and particulate matter (PM). PM itself can be divided into fractions by particle size, known as the aerodynamic equivalent diameter (AED), for example, PM10, PM2.5 and ultra-fine particulate matter (UFPM). Particles larger than 10 μm are unlikely to enter the lower airways, as they will mostly be filtered by the nose and upper airways, whilst PM10, PM2.5 and UFPM can penetrate deeply into the respiratory tract[32]. Particles with a smaller AED are thought to penetrate and deposit into the deeper airways, reaching the terminal bronchioles and alveoli. Previous report showed that PM triggered enhanced pro-inflammatory responses by PBMCs from both healthy subjects and asthma patients[36]. Our observation of increased IL-5 and IL-13 levels in asthma patients exposed to PM2.5 further supports this mechanism, emphasizing the role of Th2-mediated inflammation in the pathophysiology of asthma[37].
Allergic asthma is a complicated respiratory disease with many concerns. A number of scholars have observed the effects of temperature (T) and NO2 interactions on asthma animals and studied the underlying toxicological mechanisms[27-29]. Their results suggest a toxicity of heat and NO2 on asthma with clear mechanisms, which can be ameliorated by CZP, indicating that both oxidative stress and TRPV1 expression may be primarily responsible for asthma of heat-NO2-induced toxicity. Our animal model experiments corroborated the human data, showing that PM2.5 exposure increased inflammatory markers and exacerbated lung injury in mice. The PM2.5 + OVA group exhibited the highest levels of lung injury markers, cell counts in bronchoalveolar lavage fluid (BALF), and Th2 cytokines (IL-5 and IL-13). We observed changes in lung function indicators, such as EF50 and Penh, over time in these animal models mirrored those seen in our patient cohort. The in vitro experiments further elucidated the toxicological pathways, revealing that PM2.5 inhibited cell viability and modulated inflammatory pathways via the NF-κB, ERK, and p-ERK pathways. These findings suggest that PM2.5 may aggravate lung injury by downregulating anti-inflammatory pathways while initial changes in lung function remain subtle.
PM2.5 increased the inflammatory reactivity of mice. The PM2.5 + OVA group had the highest W/D ratio (showing lung injury), number of cells in BALF and inflammation level (IL5 and IL-13) in BALF among the four groups. The WBP system measures the change in gas pressure in the cavity (ΔP), indirectly yielding the animal respiratory flow rate, the change in time according to the flow (Δt) and the measured value of lung volume was obtained by the integral of ΔV, and the parameters of ventilation, airway obstruction and conductivity were obtained[38]. EF50 and Penh are indicators of airway obstruction. In the OVA group, PM2.5 or PM2.5 + OVA group, Penh increased gradually with time. Penh was higher in the asthma and PM2.5 + OVA groups than in the other two groups. Whether in the OVA group, PM2.5 group or PM2.5 + OVA group, Penh was higher than that in the control group on the 15th, 30th and 40th days. In the OVA-induced asthma mouse group, EF50 increased slowly over time. In the PM2.5 and OVA mouse groups, EF50 changes with time were similar. In the PM2.5 + OVA group, EF50 increased significantly from 30–40 days. These results were similar to the findings we observed in the patients. In vitro experiments are important for understanding the toxicology of air pollution. We found that PM2.5 inhibited cell viability in human HBE and C57 mouse lung type II epithelial cells. In addition, PM2.5 inhibited NF-κB, ERK and p-ERK expression in C57 mouse lung type II epithelial cells. Therefore, we speculate that PM2.5 inhibits the expression of pulmonary inflammatory factors and aggravates lung injury by regulating the NF-κB, ERK and p-ERK pathways, while the initial change in lung function is not obvious.
Despite these significant findings, there are some limitations to our study. The small sample size and the reliance on fixed monitoring stations for air pollution exposure data may have led to underestimations of individual exposure levels. Additionally, the interaction between inflammation and oxidative stress pathways was not explored, warranting further investigation.
-
Our study highlights the significant impacts of ambient outdoor air pollutants on lung function and inflammatory responses in adults with asthma. Ambient air pollutants had both acute and chronic effects on asthma patients. Acute exposure to nitrogen dioxide (NO2) and ozone (O3) resulted in a notable decrease in Peak Expiratory Flow (PEF), emphasizing their significant acute effects on respiratory health and the need for stringent air quality regulations.
Chronically, particulate matter (PM2.5 and PM10) had more pronounced effects than other components of ambient air pollutants. PM2.5, in particular, increased lung injury and inflammatory reactivity in the bronchoalveolar lavage fluid (BALF) of an asthmatic mouse model. Given these findings and our in vitro data, we speculate that PM2.5 inhibits the expression of pulmonary inflammatory factors and aggravates lung injury by regulating the NF-κB, ERK, and p-ERK pathways, while the initial change in lung function is not obvious. These insights advocate for comprehensive air quality management to protect vulnerable populations.
-
The authors are grateful to Pei Jia at the Centre of Hydrogen Science, National Engineering Research Centre of Light Alloy Net Forming & State Key Laboratory of Metal Matrix Composite, Shanghai Jiao Tong University, Yu Zhang and all the people who helped us accomplish this project.
-
This study was approved by the Institutional Review Board at the Huashan Hospital, Fudan University, Shanghai, China, with approval number KY-2014-276.
All animal experiments were approved by the Fudan University Institutional Animal Care and Use Committee with approval number 202103022s.
-
Conceptualization: Yi Gong and Xiaodong Chen. Material preparation, data collection and analysis: Guifang Wang,Youzhi Zhang,Yi Yang,Peng Zhang,Liang Dong. Formal analysis: Yi Gong,Guifang Wang and Haiyan Yang. Writing-original draft: Guifang Wang and Yi Gong. Writing, review and editing: Liu Jie, Yi Gong,Guifang Wang and Xiaodong Chen. All authors read and approved the final manuscript.
HTML
Study Population
Ambient Air Pollutants and Weather Records
Animal Model
Allergic Sensitization, OVA Challenge, PM2.5 Exposure
Animal Lung Function Test
ELISA for Cytokines
Cell Culture and Treatment
Cell Viability Assay
Western Blot Analysis
Statistical Analysis
Descriptive Statistics
Acute Effects of Air Pollutants on Patients with Asthma
Chronic Effects of Air Pollutants on Patients with Asthma
Histopathological Changes in Lung
Differences in Lung Injury in Different Animal Groups and Comparison of the Number of Nucleated Cells in Bronchial Lavage
Differences in Blood and BALF Levels of IL-5 and IL-13 in BALB/c Mice
Comparison of Lung Function in Different Groups of BALB/c Mice
Enhanced Pause (Penh)
Expiratory Flow 50 (EF50)
Cell Proliferation Inhibited by PM2.5 in vitro
&These authors contributed equally to this work.

 Quick Links
 DownLoad: