


-
Bloodstream infections are serious systemic infectious diseases caused by various pathogenic microorganisms that invade the blood circulation and are a major global public health burden with high disability and fatality rates worldwide[1]. With the use of invasive devices and extensive immunosuppressive therapies, the incidence of bloodstream infections has increased[2]. Delayed treatment seriously affects patient outcomes, whereas rapid and accurate diagnosis of pathogens can significantly improve treatment and prognosis[3]. Blood cultures are highly sensitive and easy to perform; therefore, they are the main method and gold standard for the diagnosis of bloodstream infections and have many clinical functions, such as guiding prognosis, monitoring curative effects, and analyzing epidemiological data[4].
Quality control is indispensable in clinical laboratories and blood culture-related quality indicators are essential to ensure accuracy and patient safety[5]. The factors influencing blood culture include blood collection, drug use, culture conditions, laboratory technology and operation, indications for examination, and collection sets. To improve the accuracy and reliability of blood cultures, it is necessary to consider these factors comprehensively and take corresponding measures to optimize and improve the process[6,7]. Automated blood culture instruments that are widely used in hospitals now use blood culture bottles with improved compositions, thus optimizing the traditional blood culture process and improving detection efficiency[8]. However, the delayed entry of blood culture vials into an automated culture apparatus can prolong the overall time required to detect pathogens or may lead to false-negative microbial detection[9,10].
There are few studies on the laboratory analytical indicators of positive blood culture rates. Therefore, we conducted a retrospective study to evaluate the potential impact of various laboratory analytical indicators on the positive rate of blood cultures in conventional clinical settings at Peking Union Medical College Hospital over three years. The mode of transportation, source of blood culture bottles (factors affecting the time from bottle collection to arrival at the laboratory), rotation of personnel, and time of reception (factors affecting the time from bottle arrival at the laboratory to placement in automated blood culture instruments), which constituted the total pre-analytical time, were examined. We aimed to identify and investigate whether the total pre-analytical time affected the positivity rate of blood cultures and instrument time-to-detection (TTD) to provide a reference for improving blood culture quality control.
-
Peking Union Medical College Hospital is a tertiary hospital in Beijing, China. The microbiology laboratory is open 24 h a day to receive blood cultures from outpatient, emergency, and inpatient departments. The total number of blood culture bottles handled per year is approximately 25,000. All blood cultures were performed as directed; subsequently, two or three blood sets were collected as soon as possible for each potential episode of bloodstream infection, according to hospital protocols and clinical practice guidelines[11]. In this study, a set was defined as blood drawn from a puncture site and injected into two or more blood culture bottles (only one blood culture bottle was not included in the analysis). The hospital has two ways to transport blood culture vials to the microbiology laboratory after collection: direct transportation through piping logistics delivery (Translogic, Swisslog Healthcare), and storage at room temperature before transportation by field staff. Blood cultures (BACTEC™ PLUS-Aerobic/F Medium, BACTEC™-Lytic/10 Anaerobic/F Medium, and BACTEC™-Myco/F Lytic Medium; BD Diagnostics, United States) from the hospital outpatient, emergency, and inpatient departments were sent to the microbiology laboratory. Aerobic/F and anaerobic/F bottles were incubated in the BACTEC™ FX system for 5 days, and Myco/F bottles were incubated for 14 days for fungi such as Candida. Blood bottles defined as positive by the BACTEC™ FX system were sub-cultured and gram-stained (smear microscopy). Subsequently, microbial identification and antimicrobial susceptibility tests were performed both manually and automatically (VITEK BioMérieux). Gene sequencing was used to identify strains that could not be identified using conventional methods. A blood culture was considered contaminated if one or more of the following organisms were isolated from only one set of blood cultures: coagulase-negative Staphylococci, Corynebacterium, Micrococcus, Propionibacterium, or Bacillus species[7]. The staff in the microbiology laboratory rotated every three months. In September 2022, a transport robot (Orienter Biotechnology, Sichuan, China) was used to transport the specimens to the laboratory to improve work efficiency.
-
This retrospective study was conducted at Peking Union Medical College Hospital from January 1, 2020, to December 31, 2022. The following parameters of each peripheral blood culture bottle were extracted from the laboratory database using BACTEC system software: bottle code, blood sample collection time, blood culture incubation time on the instrument, patient demographic characteristics (sex and date of birth), patient type, and microbiological results. Both negative and positive culture results were included and used to stratify the patients into positive and negative groups. The influence of the following laboratory analytical indicators on positive blood culture rates and total pre-analytical time was analyzed: transportation mode (piping logistics delivery vs. staff), blood culture bottle source (outpatient/emergency department vs. inpatient department), personnel rotation (every three months), and reception time (8:00–19:59 vs. 20:00–07:59).
The total pre-analytical time was defined as the time from bottle collection to placement on the automated blood culture instruments. The transport and laboratory storage times before incubation were included in the total pre-analytical time. TTD was defined as the time from loading to the observation of a positive signal in the blood culture. The study was approved by the Human Research Ethics Committee of Peking Union Medical College Hospital (I-24PJ0002).
-
Measurements with non-normal distributions were described in terms of median and interquartile intervals. Pearson’s chi-square test was used to calculate the influence of laboratory analytical indicators on positive blood culture rates. A non-parametric test was used to calculate the influence of analytical indicators on the total pre-analytical time, and the influence of total pre-analytical time and different types of microorganisms on TTD. All statistical analyses were performed using GraphPad Prism 10.1, and differences were considered statistically significant at P < 0.05.
-
A total of 28,914 blood culture sets used to diagnose bloodstream infections were analyzed between January 1, 2020, and December 31, 2022. Of these, 26,238 were negative, 2,304 were positive, and 372 blood culture sets were used to identify the contaminants. The positive blood culture rate in the hospital was 8.07% (2,304/28,542 sets). We compared outpatient/emergency department with the inpatient department that used the piping logistics delivery system only. We found that the average positive blood culture rate from outpatient/emergency department was significantly higher than that from the inpatient department (12.46% vs. 5.83%; P < 0.0001). Two ways to transport blood culture vials from inpatient department to the microbiology laboratory were compared, the average positive blood culture rates for the piping logistics delivery and staff transportation were 5.83% and 5.59%, respectively (P = 0.4904). The average positive blood culture rates in blood culture vials received between 20:00–07:59 and 8:00–19:59 were not statistically significant (7.92% vs. 8.17%; P = 0.4630). Additionally, the rotation of personnel did not significantly affect the blood culture positivity rates (P = 0.0648; Table 1).
Group Laboratory analytical indicator Positive Negative Positivity rate, % Pa Mode of transportation Inpatient department Piping logistics delivery 503 8,130 5.83 0.4904 Staff transportation 553 9,338 5.59 Source Piping logistics delivery Outpatient/emergency department 1,245 8,745 12.46 < 0.0001 Inpatient department 503 8,130 5.83 Time of reception 8:00–19:59 1,432 16,104 8.17 0.4630 20:00–07:59 872 10,134 7.92 Rotation of personnel 1 409 5,019 7.54 0.0648 2 338 4,003 7.79 3 164 2,052 7.40 4 174 1,988 8.05 5 274 2,716 9.16 6 222 2,687 7.63 7 205 2,423 7.80 8 240 2,400 9.09 9 278 2,950 8.61 Note. aChi-square test. Table 1. Association between laboratory analytical indicators and positive blood culture rates
In addition to the blood culture positivity rate, we assessed the relationship between laboratory analytical indicators and the TTD of blood cultures. The results indicated that the median TTD of blood cultures in piping logistics delivery was significantly higher than that in staff transport (16 h vs. 15 h; P = 0.0093). The median TTD of blood cultures from the inpatient department was significantly higher than that of blood cultures from the outpatient/emergencydepartment (16 h vs. 14 h; P = 0.0003). The rotation of personnel (P < 0.0001) also significantly affected the median TTD of blood cultures (Table 2).
Group Laboratory analytical indicator Bottles (N) Time-to-detection Median (h) Q25 Q75 P Mode of transportation 0.0093a Inpatient department Piping logistics delivery 852 16 11.25 29 Staff transportation 1,118 15 11 24 Source 0.0003a Piping logistics delivery Outpatient/emergency department 2,215 14 11 24 Inpatient department 852 16 11.25 29 Time of reception 0.4672a 8:00–19:59 2,647 15 11 24 20:00–07:59 1,567 15 11 27 Rotation of personnel < 0.0001b 1 750 15 11 27.25 2 619 14 11 24 3 334 16 12 26 4 328 14 11 23 5 478 14.5 11 27.25 6 405 15 11 22 7 382 17 12 32.25 8 439 16 11 27 9 479 14 11 22 Note. aMann-Whitney U test; bKruskal-Wallis test. Table 2. Association between laboratory analytical indicators and the time-to-detection
-
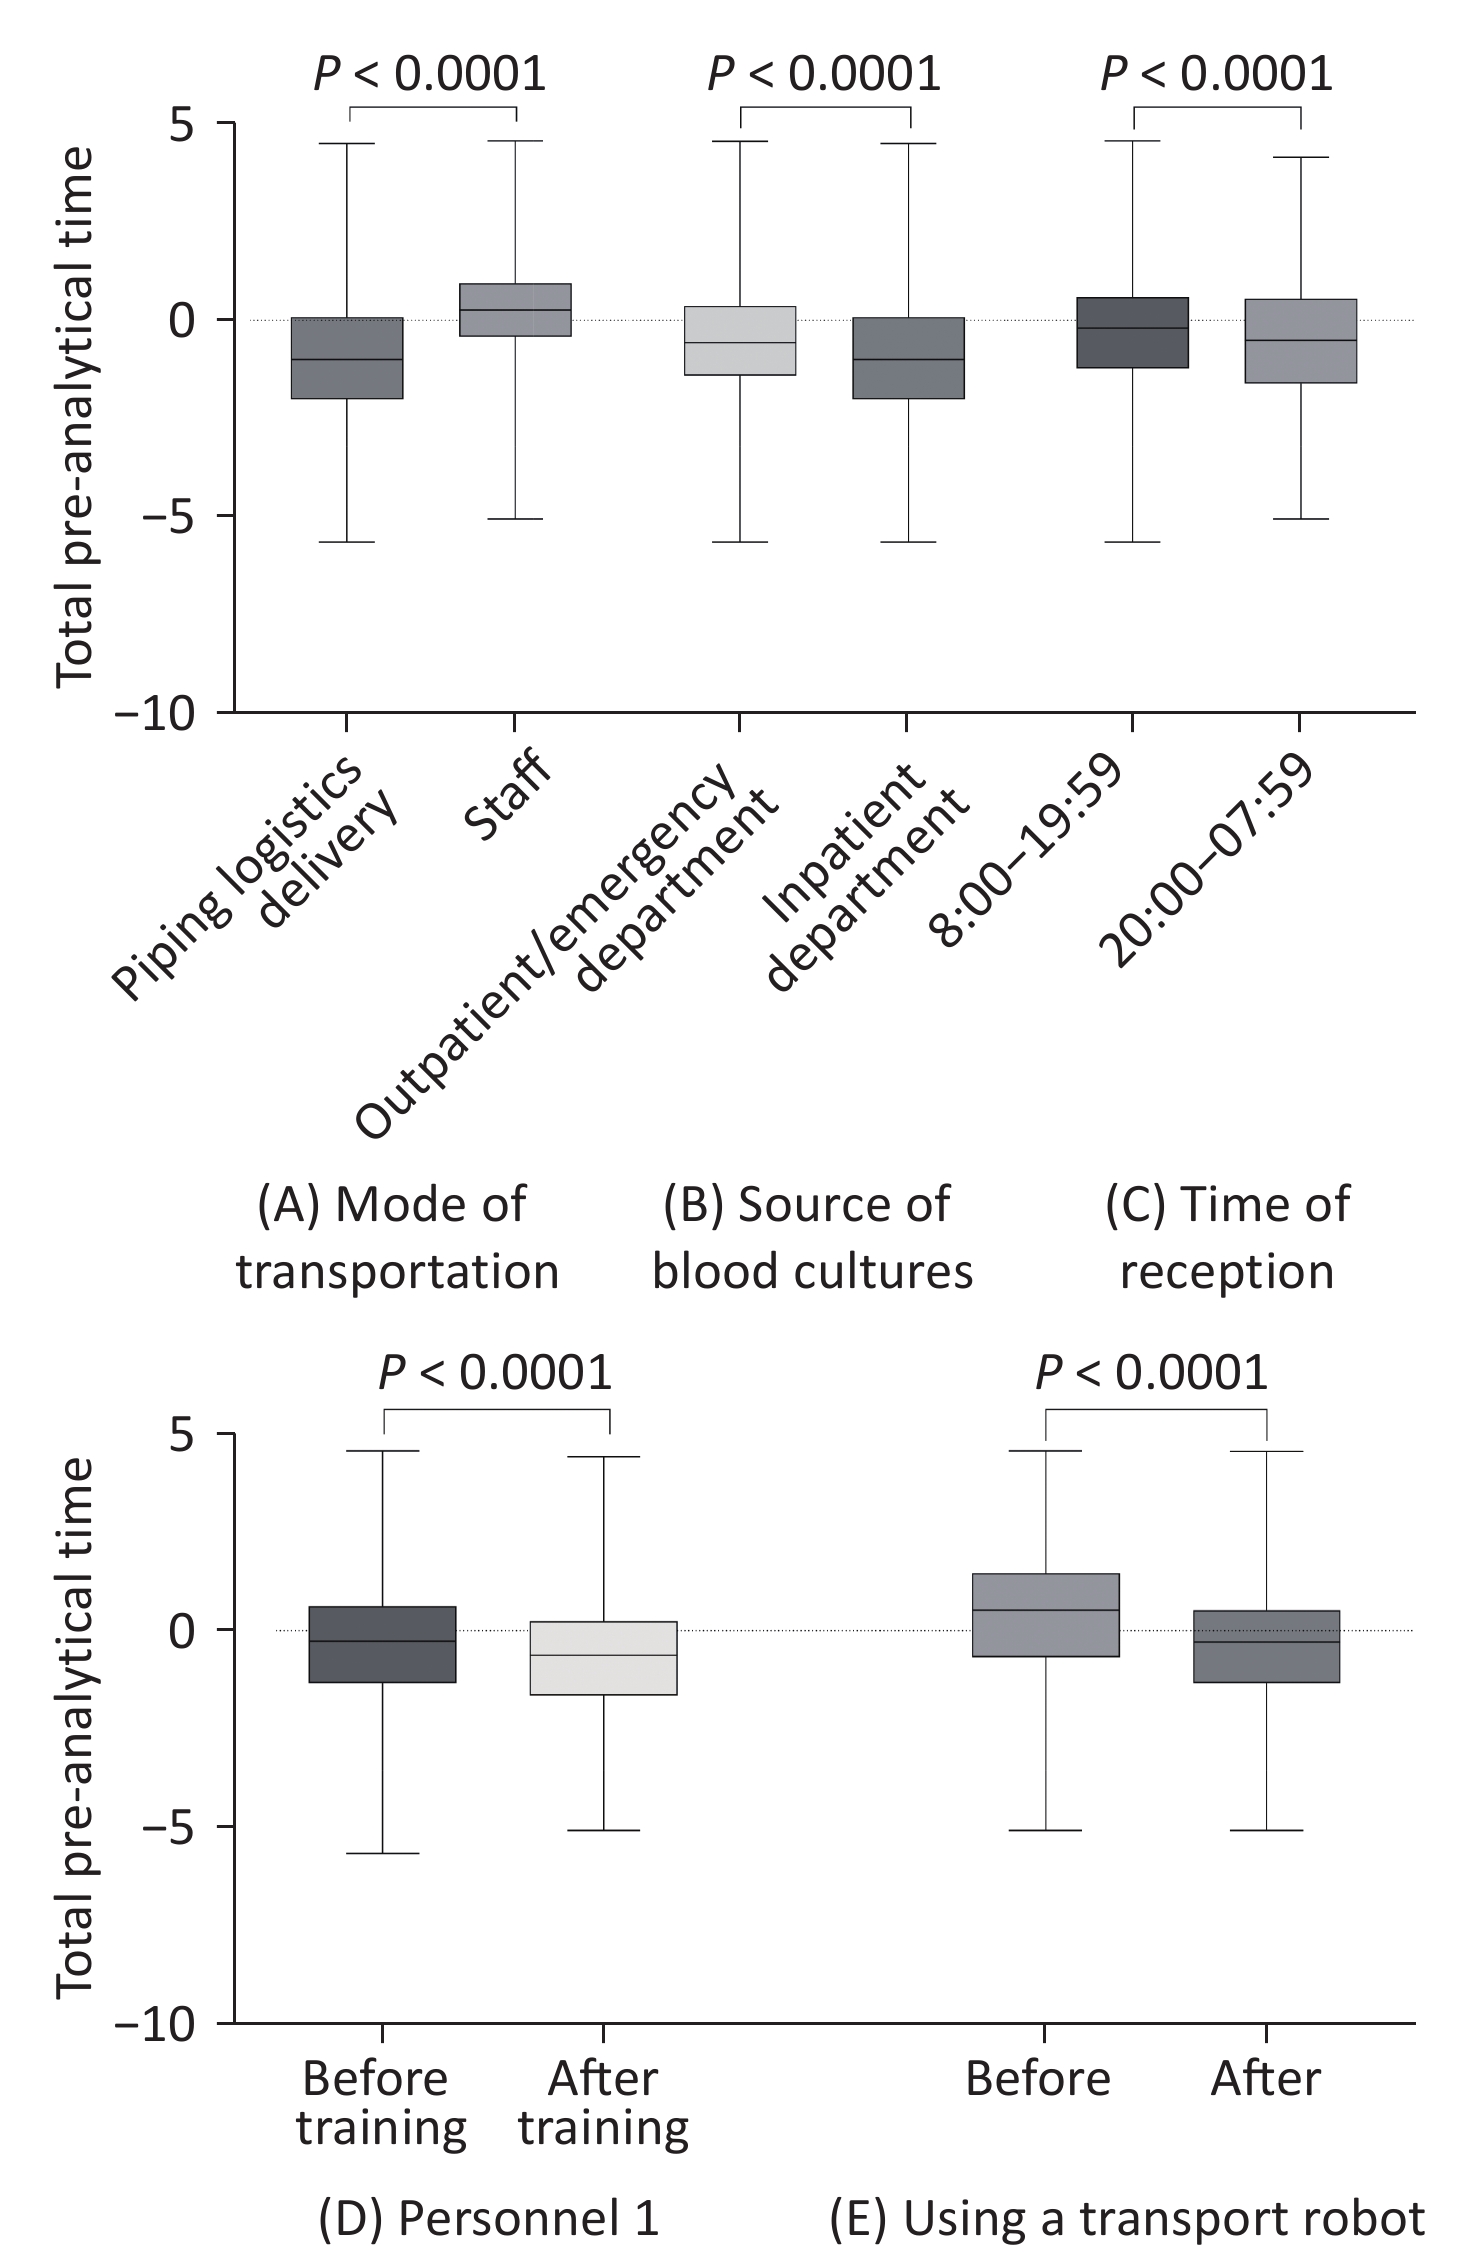
We analyzed the total pre-analytical time of blood culture bottle deliveries from different transport modes and patient sources and analyzed the reception time. In the inpatient department, the total pre-analytical time for piping logistics delivery was significantly shorter than that for staff transport (P < 0.0001). When using piping logistics delivery, the total pre-analytical time for the inpatient department was also significantly shorter than that for the outpatient/emergency department (P < 0.0001). The total pre-analytical time of blood culture vials received between 20:00 and 07:59 was significantly shorter than that of vials received between 8:00 and 19:59 (P < 0.0001). During the study period, we continuously trained our microbiology department staff in standard blood culture practices. Personnel 1 was responsible for blood culture during two periods (January–June 2020 and October–December 2021). The total pre-analytical time required by Personnel 1 after training was significantly shorter than that before training (P < 0.0001). In addition to training, in September 2022, we introduced a transport robot into the laboratory, which significantly reduced the total pre-analytical time (P < 0.0001) (Figure 1 and Table 3).

Figure 1. Comparison of the total pre-analytical time (h) and laboratory analytical indicators: mode of transportation (A), source of blood culture bottles (B), time of reception (C), total pre-analytical time of personnel 1 before and after training (D), total pre-analytical time before and after using a transport robot (E). Box plot of log-transformed data. Boxplot lower/upper fences represent the minimum and maximum values.
Group Laboratory analytical indicator Bottles (N) Total pre-analytical time Median (h) Q25 Q75 Pa Mode of transportation < 0.0001 Inpatient department Piping logistics delivery 25,266 0.50 0.25 1.05 Staff transportation 28,058 1.20 0.75 1.90 Source < 0.0001 Piping logistics delivery Outpatient/emergency department 23,526 0.67 0.38 1.28 Inpatient department 25,266 0.50 0.25 1.05 Time of reception < 0.0001 8:00–19:59 47,491 0.87 0.43 1.50 20:00–07:59 29,793 0.70 0.33 1.45 Personnel 1 < 0.0001 Pre-training 7,802 1.43 0.63 2.72 After training 7,293 0.82 0.40 1.42 transport robot < 0.0001 Before use 68,821 0.83 0.40 1.53 After use 8,463 0.65 0.32 1.17 Note. aMann-Whitney U test. Table 3. Association between laboratory analytical indicators and total pre-analytical time
The positive blood culture rates were 5.70%, 5.21%, and 4.91% within 1 h, within 1–2 h, and over 2 h of the pre-analytical time, respectively (P = 0.0007). Among these, the positive rate of the total pre-analytical time within 1 h was significantly higher than that within 1–2 h or > 2 h (P < 0.0170; Table 4).
Group (h) Bottles (N) Positive Negative Chi-square test χ2 P ≤ 1 45,662 2,603 43,059ab 14.5920 0.0007 1–2 19,745 1,028 18,717c > 2 11,877 583 11,294 Note. aCompared with 1–2 h, P < 0.0170; bcompared with > 2 h, P < 0.0170; ccompared with > 2 h, P > 0.0170. Table 4. Association between total pre-analytical time and positive blood culture rates
-
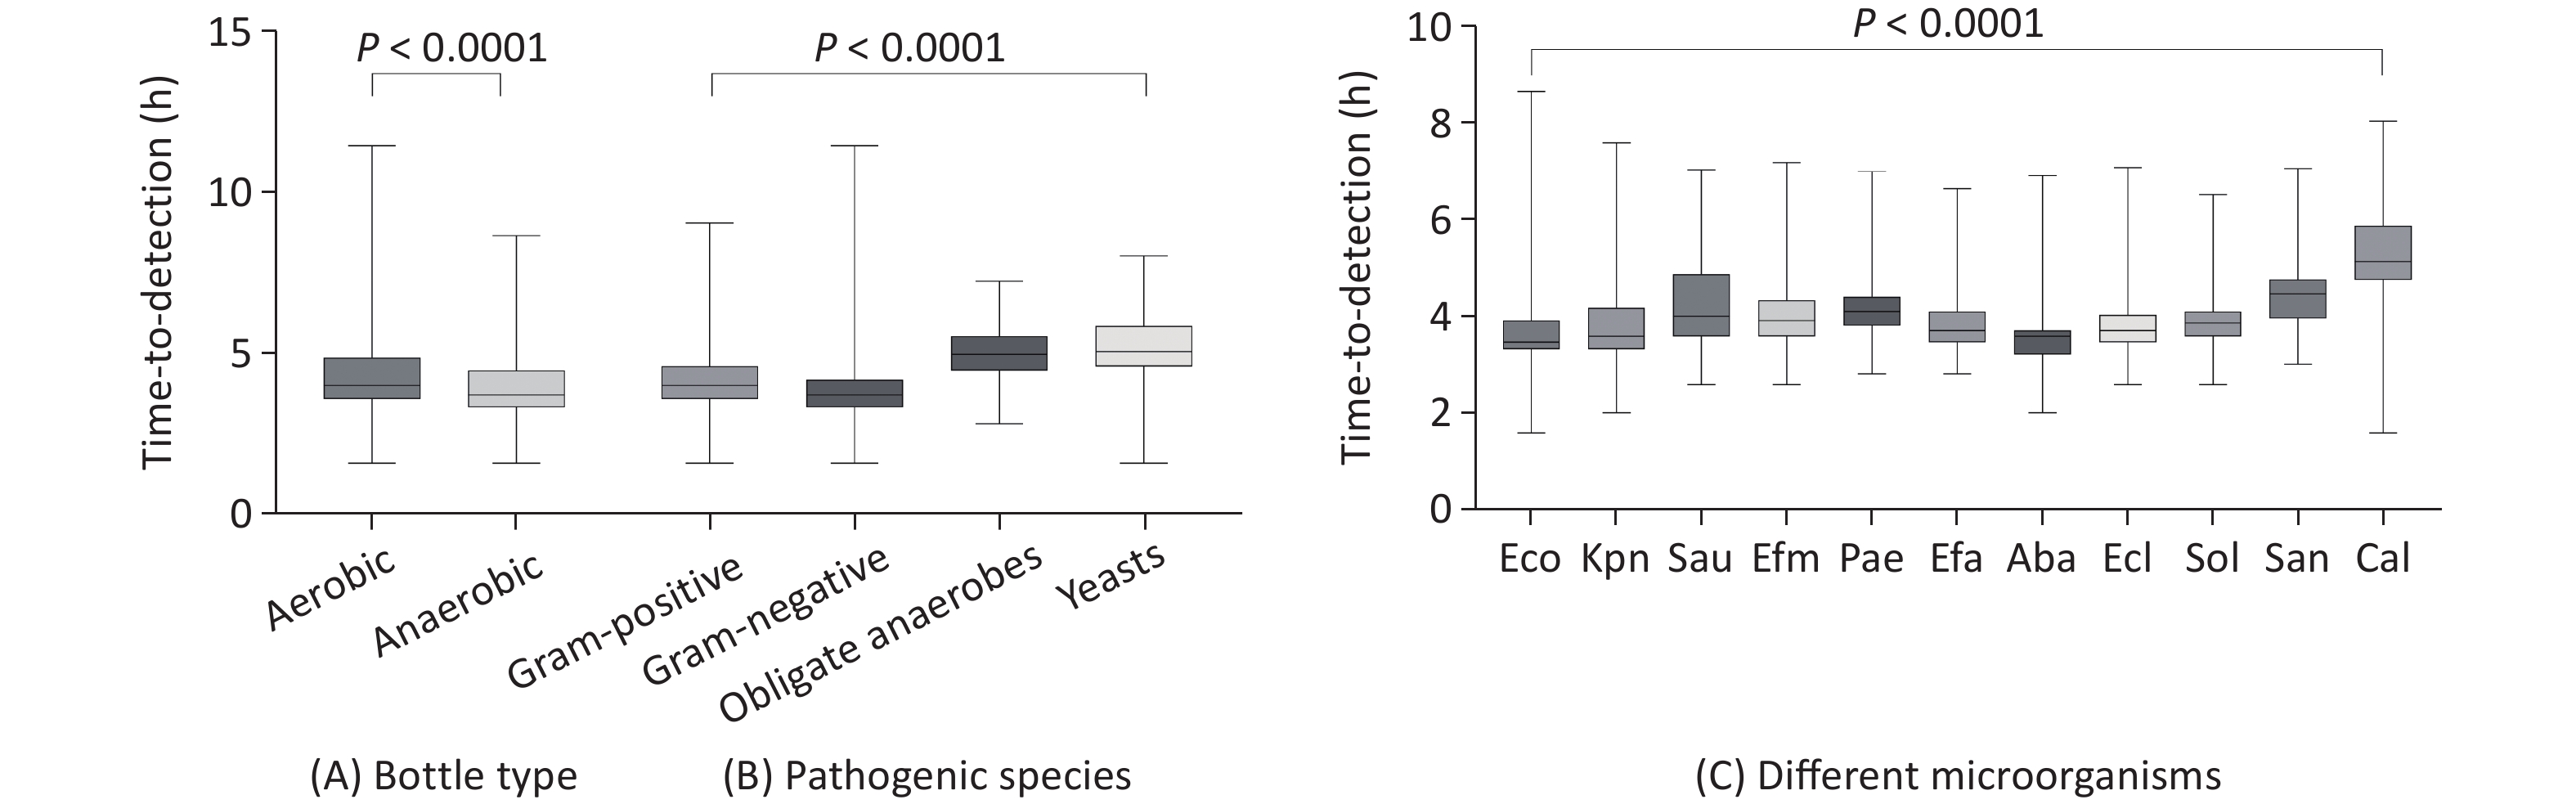
A total of 4,462 microorganisms were isolated from 77,284 blood culture bottles collected throughout the study period. We found that the TTD of the positive anaerobic bottles (13 h) was significantly shorter than that of the aerobic bottles (16 h) (P < 0.0001). Furthermore, Gram-negative bacteria had a shorter TTD (13 h) than Gram-positive bacteria (16 h), obligate anaerobes (32 h), and yeast (33 h) ( P < 0.0001). The time from placement on the instrument to positive blood culture detection was further stratified according to the detected microorganisms (P < 0.0001). The TTD for Escherichia coli (E. coli) (11 h) was the shortest among all blood culture pathogens. We analyzed the relationship between TTD and the total pre-analytical time and found that the difference was not statistically significant between the total pre-analytical time within 1 h, within 1–2 h, or > 2 h (Figure 2 and Table 5).
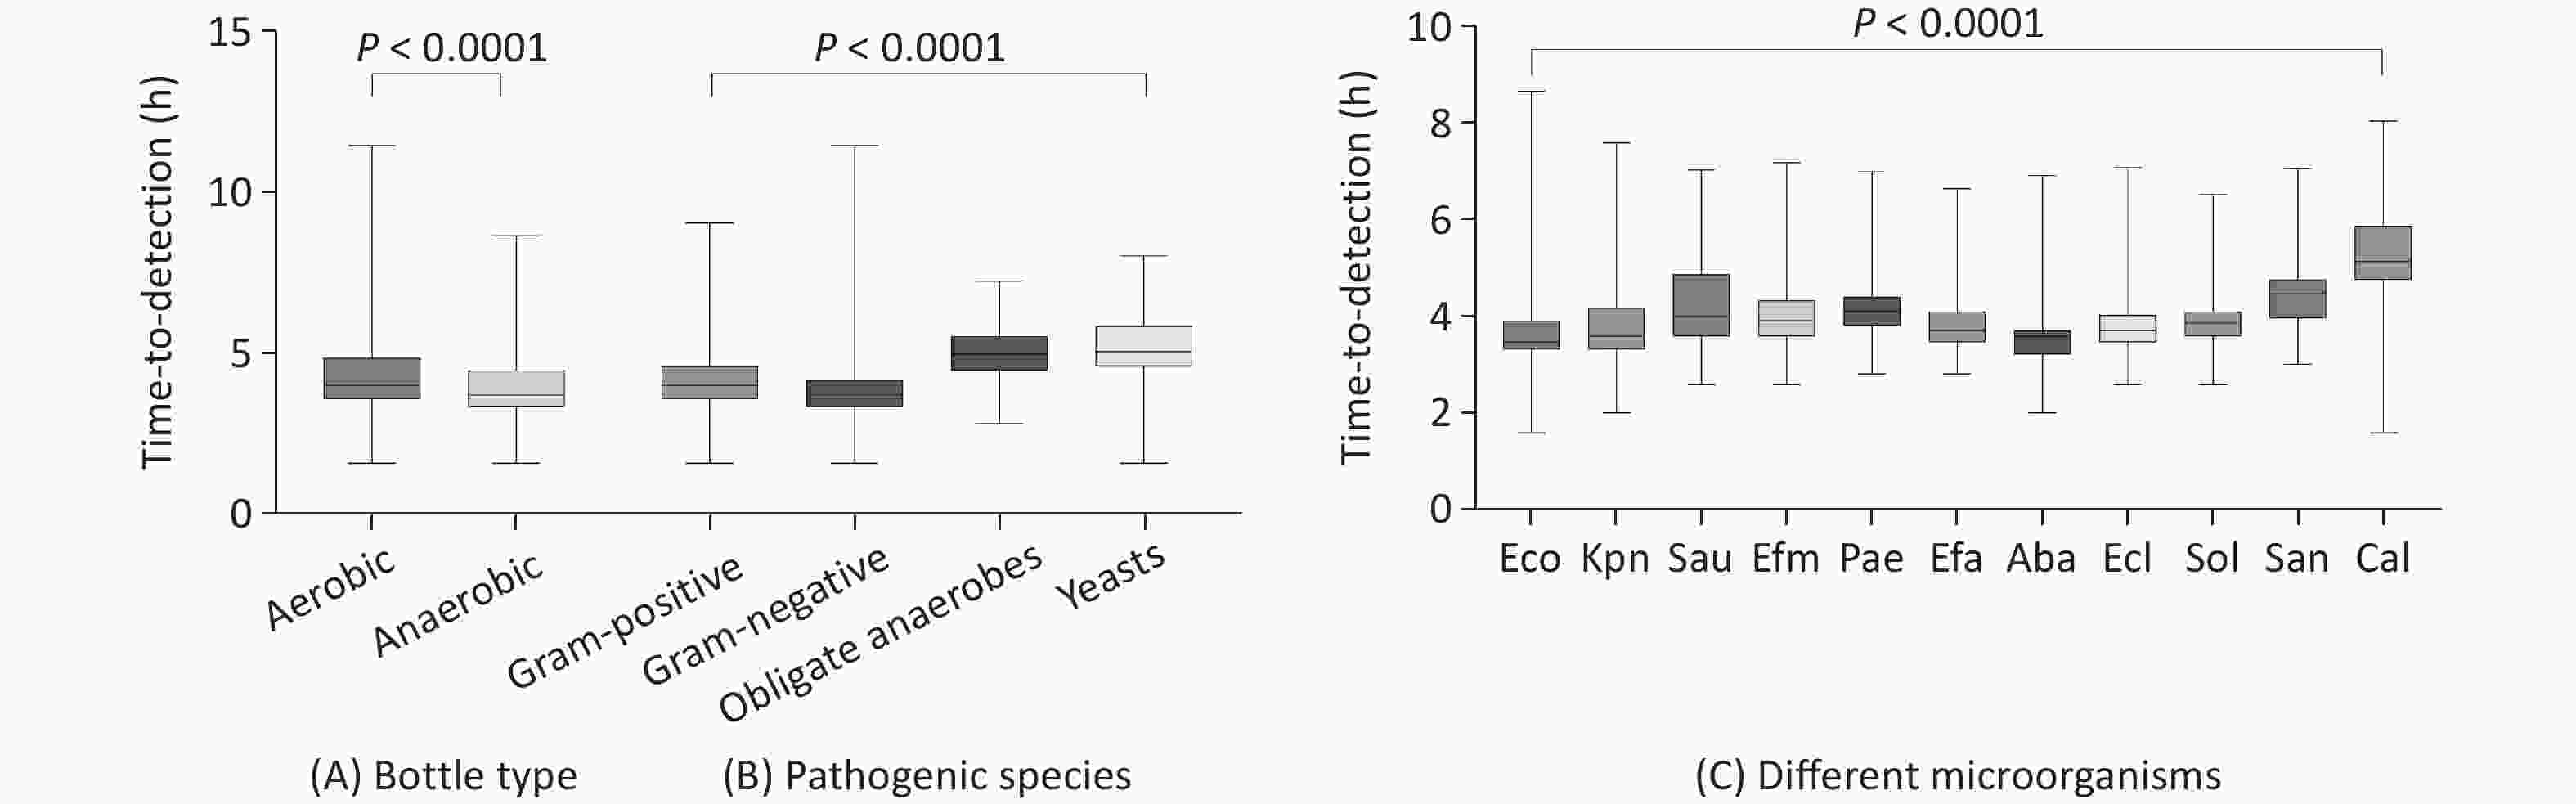
Figure 2. Time-to-detection (h) boxplots by bottle type (A), pathogenic species (B), and different microorganisms (C). Box plot of log-transformed data. Boxplot lower/upper fences represent the minimum and maximum values. Eco, Escherichia coli, Kpn, Klebsiella pneumoniae, Sau, Staphylococcus aureus, Efm, Enterococcus faecium, Pac, Pseudomonas aeruginosa, Efa, Enterococcus faecalis, Aba, Acinetobacter baumannii complex, Ecl, Enterobacter cloacae complex, Sol, Streptococcus oralis, San, Streptococcus angina, Cal, Candida albicans.
Grouping Bottles (N) Time-to-detection (h)a Median (h) T90 T95 T99 P Bottle type < 0.0001b Aerobic bottles 2,145 16 69 90 115.5 Anaerobic bottles 1,785 13 42 60 104.7 Pathogenic species < 0.0001c Obligate anaerobes 198 32 81.3 92.1 113.4 Gram-positive bacteria 1,484 16 50 86 126.6 Gram-negative bacteria 2,536 13 48 75.15 115.6 Yeasts 223 33 83.8 102.6 131.3 Microorganism < 0.0001c Escherichia coli 1,003 11 36.6 63 117.9 Klebsiella pneumoniae 644 12 53.5 79.5 115.1 Staphylococcus aureus 375 16 67.4 86 115.9 Enterococcus faecium 198 15 29 35 80.65 Pseudomonas aeruginosa 193 17 32.6 52.6 103.5 Enterococcus faecalis 193 13 27.2 37.3 95.24 Acinetobacter baumannii complex 140 12 16 24.85 94.99 Enterobacter cloacae complex 102 13 29 50.05 134.6 Streptococcus oralis 88 14.5 22 28.1 91 Streptococcus angina 85 22 58.8 103.2 133 candida albicans 83 35 92.2 125 262 Total pre-analytical time (h) 0.1231c ≤ 1 2,603 14 59 83 121 1–2 1,028 15 55 88.55 121.4 > 2 583 16 64.6 91 118.3 Note. aTime to achieve 90%, 95%, and 99% rates of positivity are indicated as T90, T95, and T99, respectively; bMann-Whitney U test; cKruskal-Wallis test. Table 5. Time-to-detection of microorganisms isolated in blood cultures
-
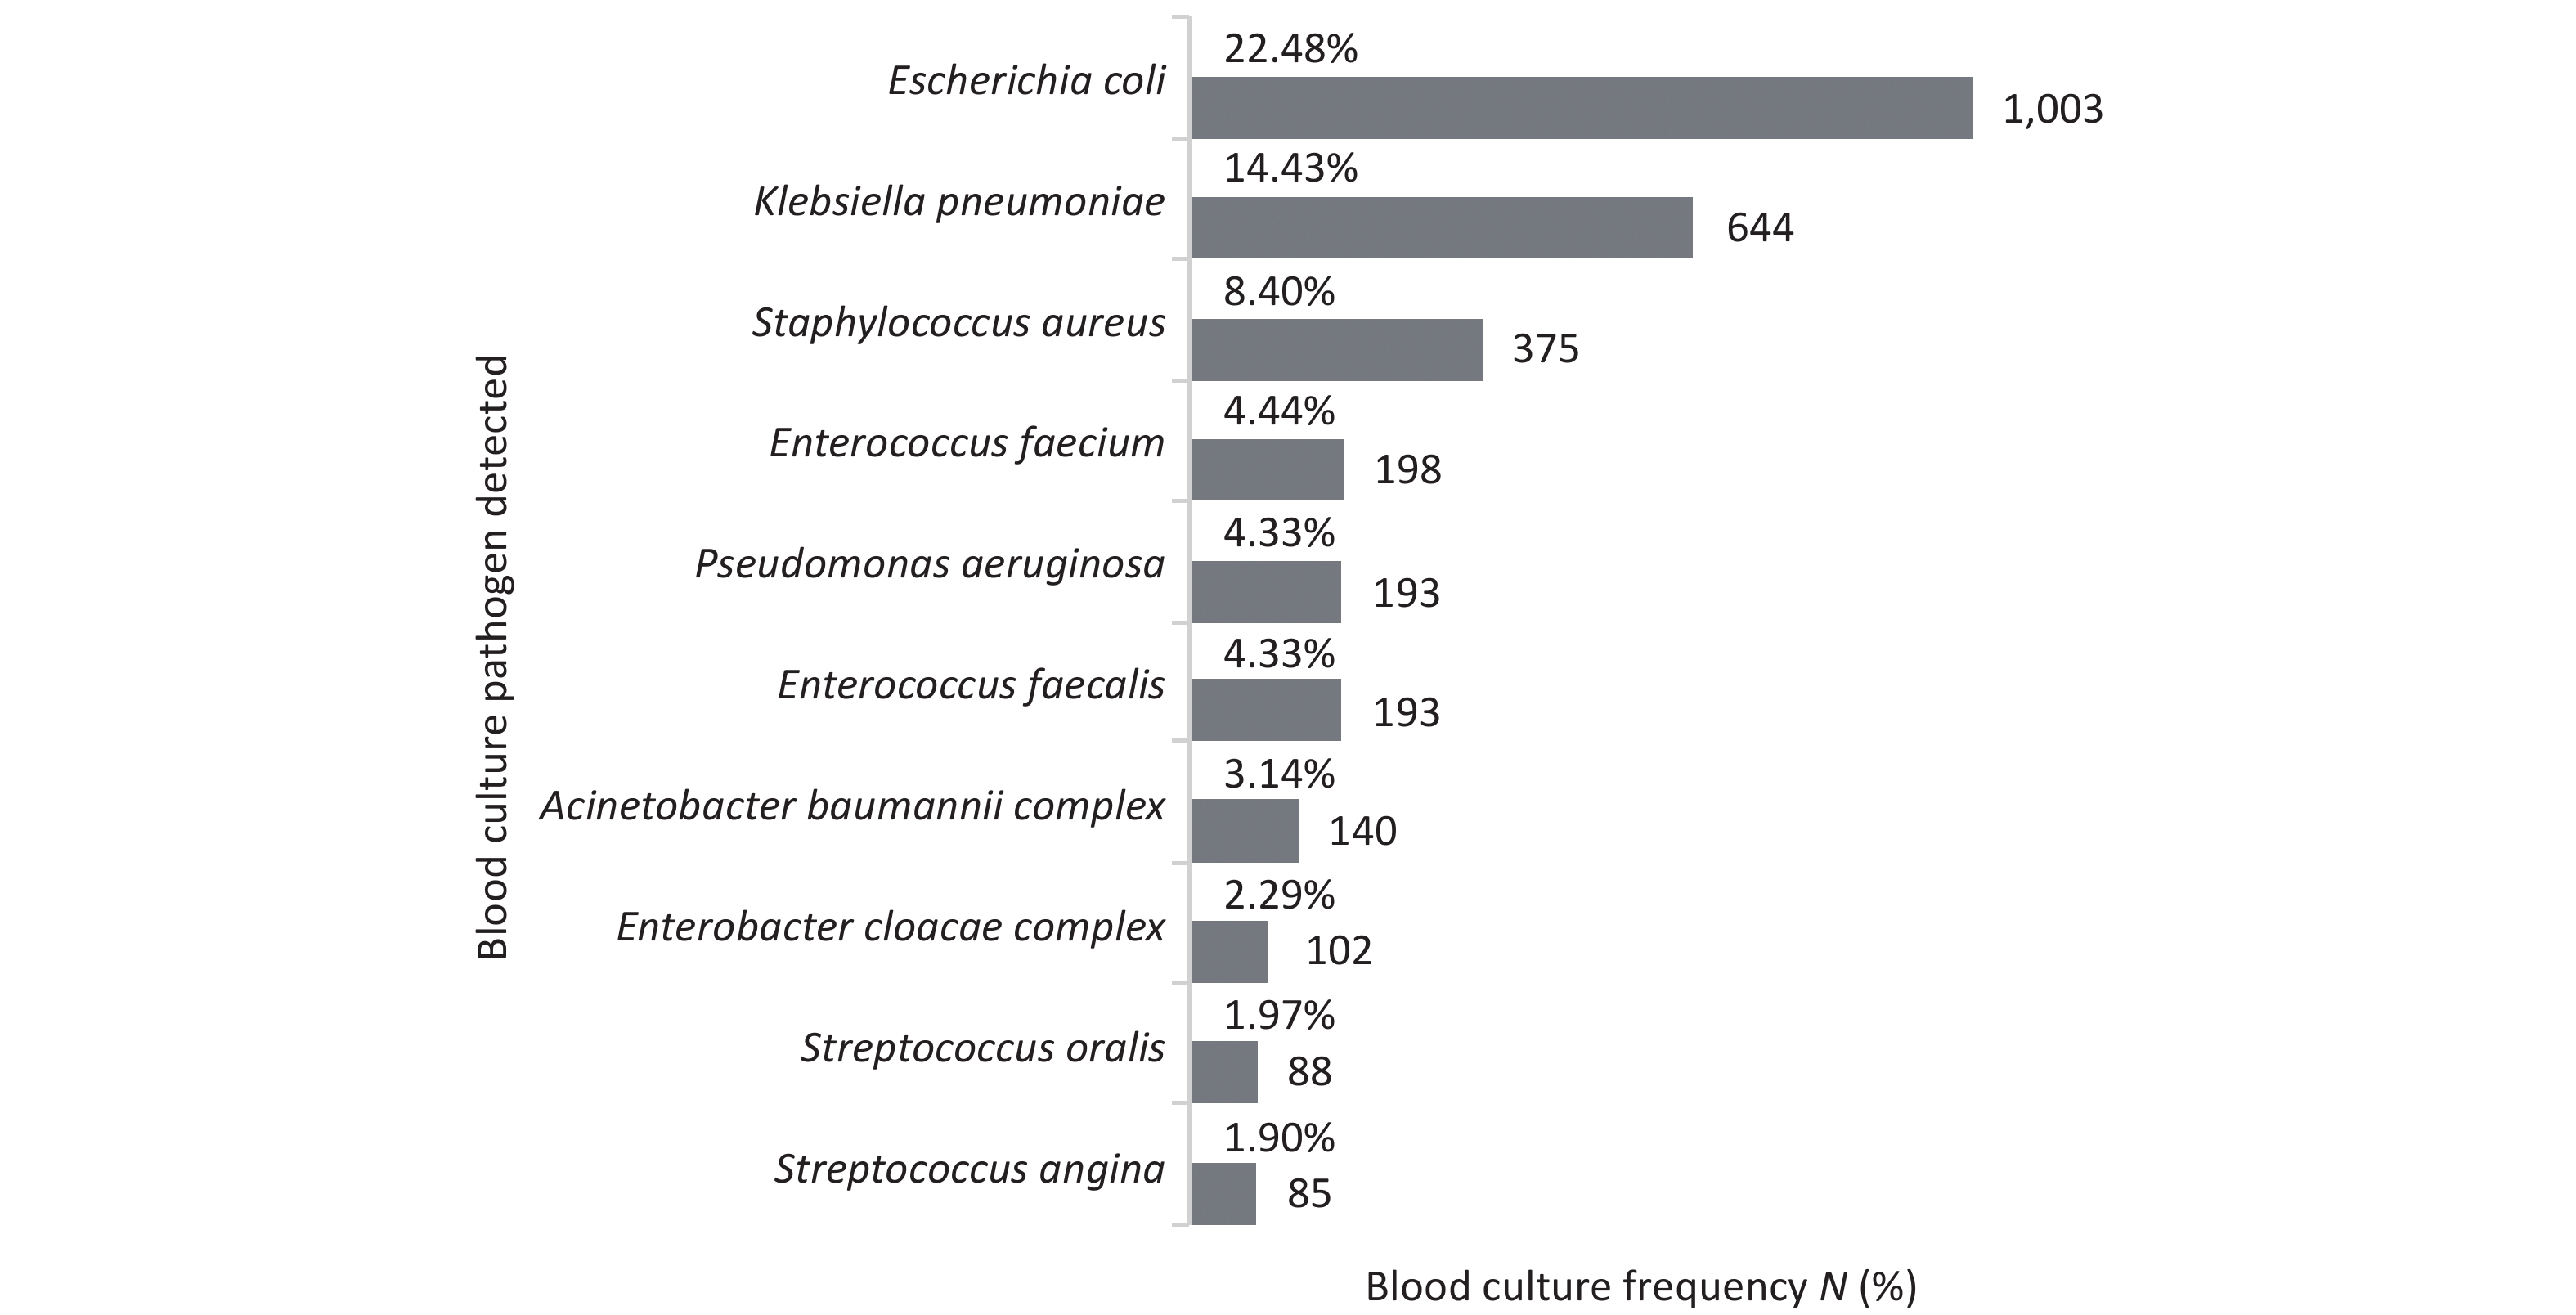
The most commonly isolated microorganisms responsible for ‘true’ bacteremia were E. coli (22.48%), K. pneumoniae (14.43%), Staphylococcus aureus (S. aureus) (8.40%), and Enterococcus faecium (4.44%). Among the isolated fungi, yeast accounted for 91.77% of the isolates, and Candida albicans accounted for 37.22% of the yeast-positive samples (Figure 3). Monitoring the blood culture contamination rate is an important indicator of laboratory performance[12]. A contamination rate of 1.29% (372/28,914 sets) was observed, which is within the limits of the standard guidelines.
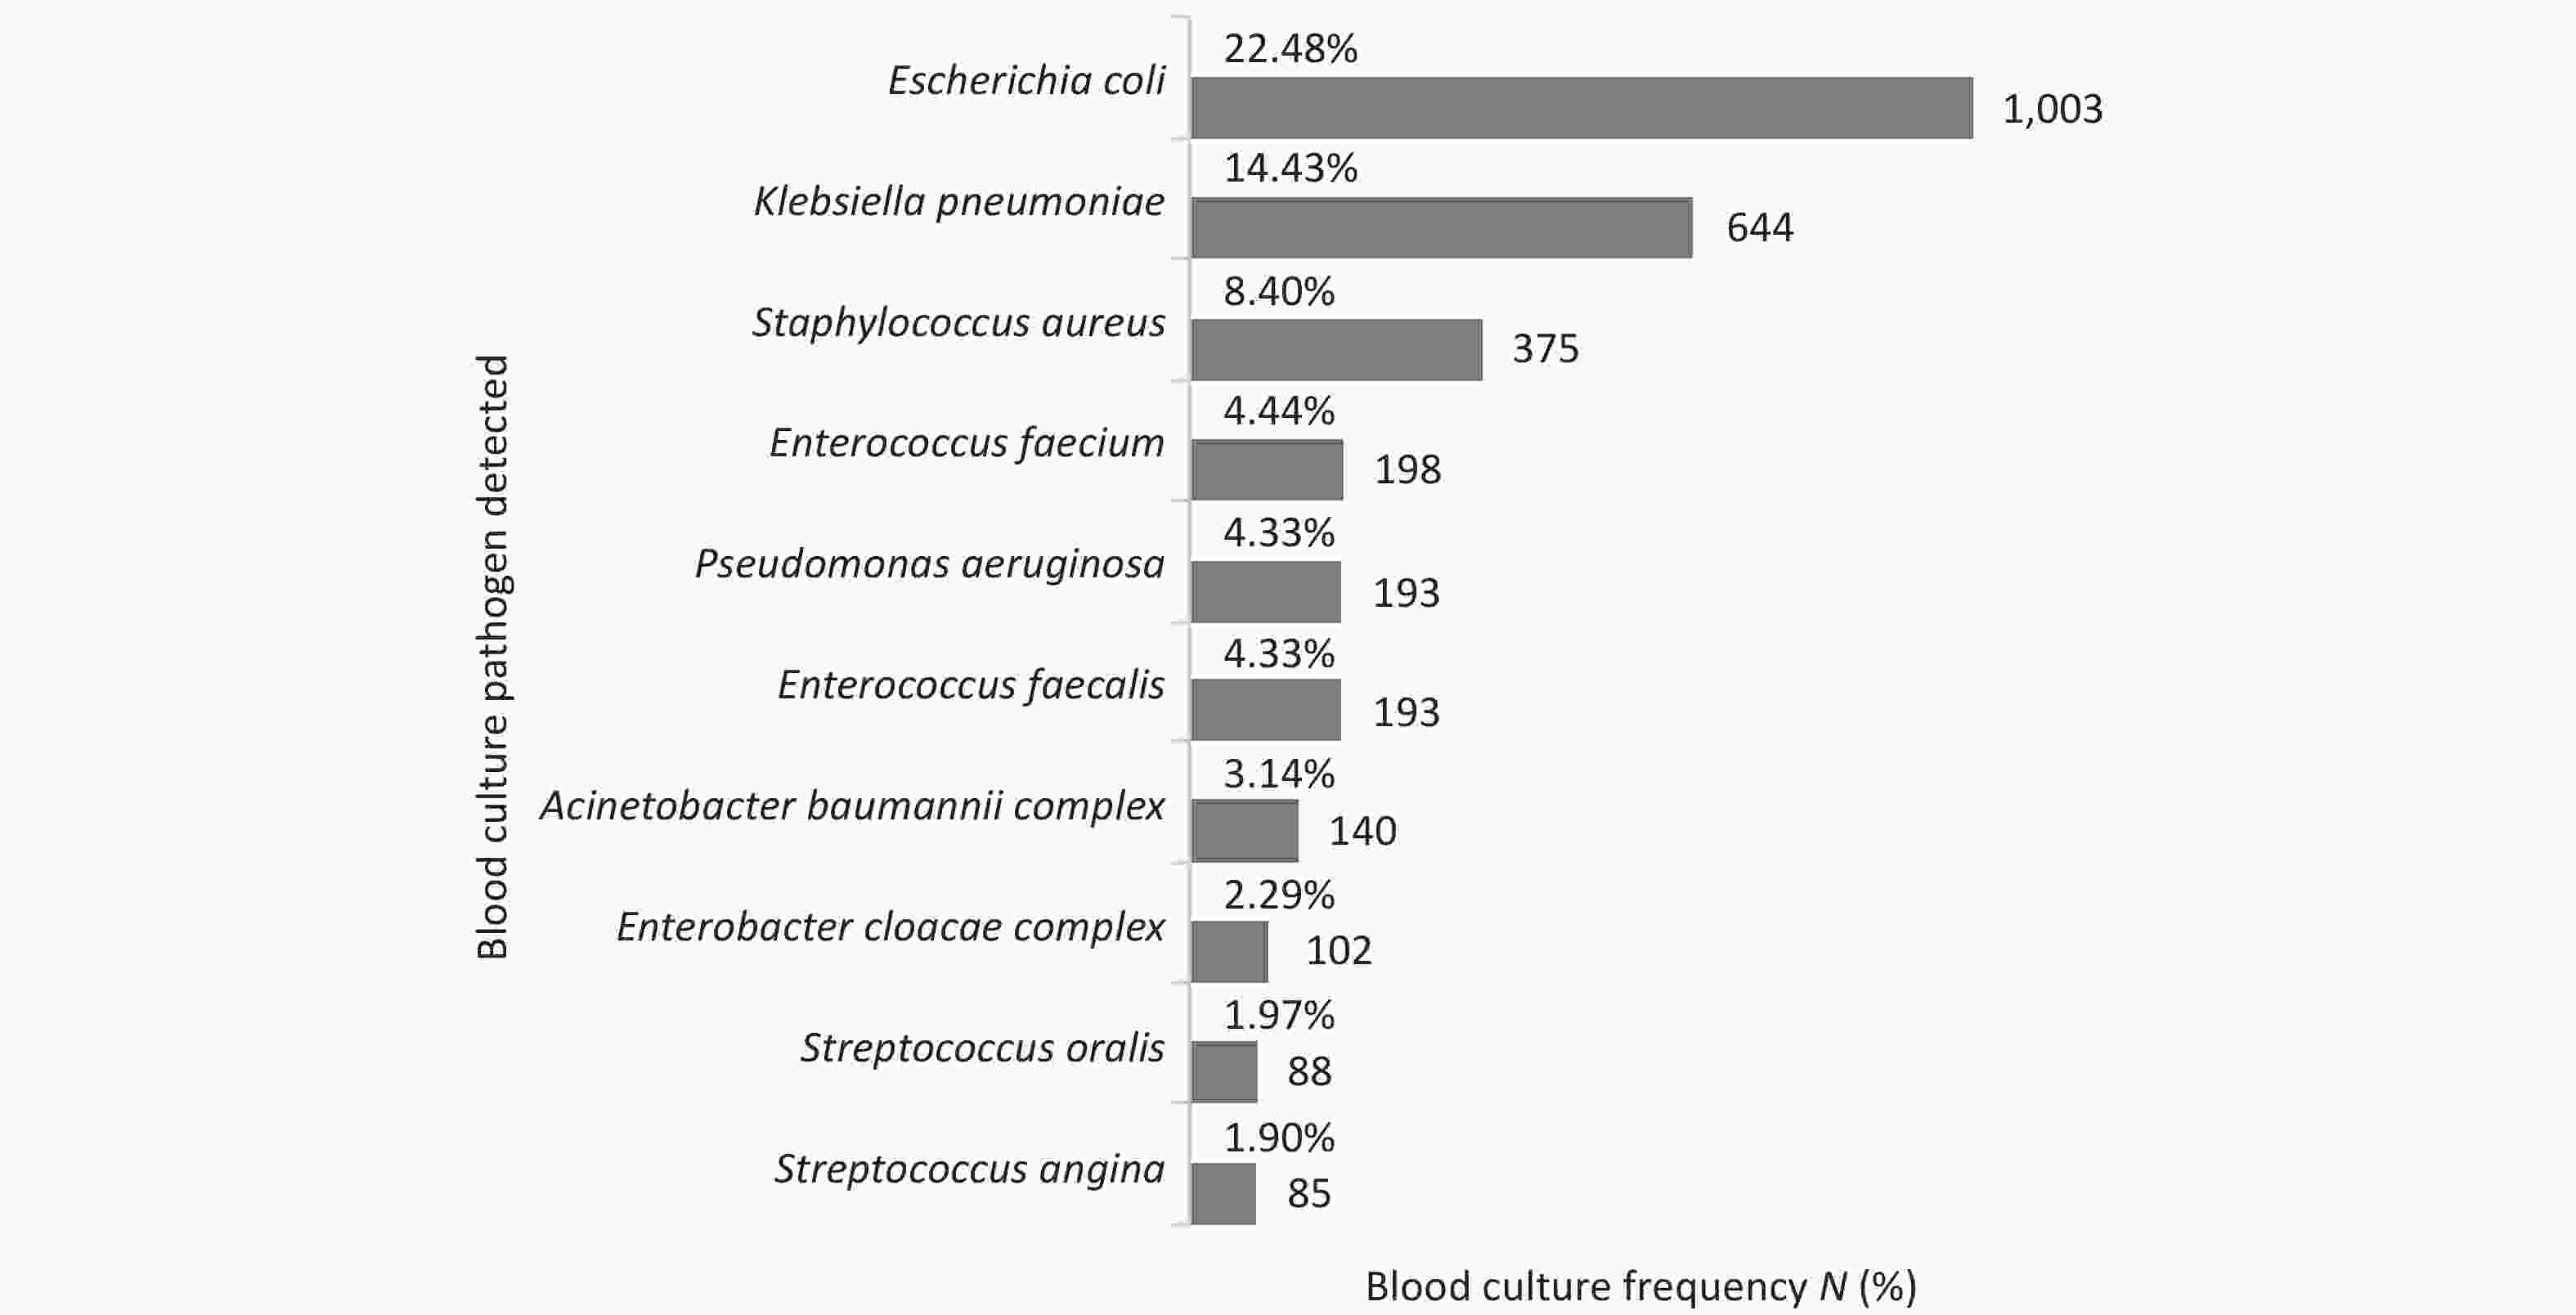
Figure 3. Top 10 pathogens identified in the study (N = 4,462).
In addition, we compared the pathogen distribution between outpatient/emergency and inpatient departments. Higher counts of Gram-positive and Gram-negative bacteria were detected in blood culture bottles from the outpatient/emergency department than in culture bottles from the inpatient department. However, the detection of fungi and obligate anaerobes in the blood culture vials from the outpatient/emergency department was lower than in the vials from the inpatient department (P < 0.0001) (Table 6).
Group Gram-negative bacteria Gram-positive bacteria Obligate anaerobes Fungi P Piping logistics
deliveryInpatient department 514 (54.16) 288 (30.35) 56 (5.90) 91 (9.59) < 0.0001 Outpatient/emergency department 1,317 (56.19) 849 (36.22) 110 (4.69) 68 (2.90) Note. Data were represented as N (%). Table 6. Distribution of pathogen in blood culture bottles from outpatient/emergency and inpatient departments
-
In patients with bloodstream infections, early pathogen identification, drug susceptibility testing, and informed antibiotic prescription can reduce the cost of antibiotic treatment and the burden of drug-resistant bacteria[13]. In patients with sepsis caused by a bloodstream infection, mortality increases with each hour of treatment delay[3,14]. Therefore, it is important to improve the positive blood culture rate and shorten the turnaround time for laboratory diagnoses.
To date, only a few studies have investigated the influence of laboratory analytical indicators on positive blood culture rates. Sautter et al. reported that delayed incubation of blood culture bottles leads to false-negative results in different microbial cultures[15]. A retrospective study that assessed blood culture processing in an ICU over one year found that blood cultures were less likely to be positive if collected on weekends. This indicates that prolonged transport time affects the positivity rate[16]. The prevalence of positive cultures was significantly lower in samples collected when the laboratory was closed than when it was open[17]. Our results also showed that the patient source influenced the positive blood culture rate; higher counts of Gram-positive and Gram-negative bacteria were detected in the outpatient/emergency department than in the inpatient department. Notably, the piping logistics delivery of blood cultures from inpatient department and blood cultures received between 20:00 and 07:59 significantly shortened the total pre-analytical time. In addition, we analyzed the total pre-analytical time required by the staff for handling blood cultures before and after training. We found that, after normative training, the total pre-analytical time of the staff was significantly shortened. To continuously improve blood culture quality control, we adopted a transport robot to deliver blood culture bottles to the laboratory by September 2022, further reducing the total pre-analytical time. Subsequently, we analyzed the relationship between the total pre-analytical time and the blood culture-positive rate and found that the positivity rate was significantly higher within 1 h than within 1–2 h or > 2 h (P < 0.017). These results suggest that automated transport systems should be used whenever possible and that regular training of microbiological staff must be conducted to standardize blood culture processing. In microbiological laboratories that operate discontinuously, satellite systems for blood culture instruments can be implemented in hospital departments that operate continuously. Compared with traditional centralized blood culture systems, satellite systems for blood culture have the characteristics of 24 h sampling, real-time culture detection, and greatly shortened detection turnaround time, thus improving the diagnostic timeliness of patients with bloodstream infections[18].
The development of automated laboratory blood culture systems and rapid identification methods has significantly reduced the time required to identify the microorganisms in positive blood cultures. However, the role of the total pre-analytical time in this is still controversial. Kerremans et al. found that sending blood cultures to the laboratory immediately after working hours significantly reduced the median time for the growth of positive microorganisms[19]. Lee et al. added common microorganisms to blood culture bottles and found that delayed incubation led to false negatives in TTD experiments[20]. Procop et al. found that TTD was not associated with an extended total pre-analytical time; however, when the transport time to the laboratory after blood culture collection was stratified, TTD was significantly shortened with the extension of transport time[21]. Researchers have speculated that bacteria may enter or complete a growth lag with longer transport times. Once placed on the instrument, bacteria rapidly entered the exponential growth phase. Our results show that the TTD of pathogen in blood culture is influenced by the species type; different bacterial species have different TTD records. Although bloodstream infections from outpatient, emergency, and inpatient departments are mainly caused by Gram-negative bacteria, the exact species differs between departments. The proportion of fungi in the inpatient departments was higher than that in the outpatient/emergency department. Importantly, the use of antibiotics affects the time of detection in inpatients, owing to their complex conditions. In addition, we found that the median TTD for the total pre-analytical times within 1 h, within 1–2 h, and > 2 h were 14, 15, and 16 h, respectively. However, the difference was not statistically significant. Of note, our microbiology laboratory was open for 24 h, and the median total pre-analytical time was only 0.82 h; therefore, the influence of a longer delay time on TTD could not be monitored.
The positive blood culture rate in the hospital was 8.07% and only peripheral blood cultures were used. Most patients had been treated in local or community hospitals before visiting the hospital and had used antibiotics before blood culture collection, which may have influenced the culture results. In this study, the most common pathogen, E. coli, was detected in 22.48% of positive cultures, followed by K. pneumoniae in 14.43%, and S. aureus in 8.40%. The mean instrumental TTD for E. coli, K. pneumoniae, and S. aureus were 11.0, 12.0, and16.0 h, respectively. This reflects differences in the growth dynamics of these bacteria. Notably, the most common pathogens were detected within 24 h, reflecting the importance of blood culture.
However, there were some methodological limitations to our study, such as a retrospective analysis based on electronically stored data in the laboratory, and the corresponding relationship between blood culture results and the clinical status of patients could not be evaluated. Although we obtained information regarding the sex, age, and ward placement of the patients, other unknown parameters, including venocentesis time, skin disinfection, blood volume, antibiotic treatment before sampling, and patient comorbidities, may have affected the results. Therefore, prospective, informative, and in-depth stratified studies are warranted.
In conclusion, this study suggests that microbiology laboratories should regularly monitor transport times, conduct regular training for microbiology staff, and standardize the blood culture reception process, all of which are potential indicators of blood culture quality. Paying attention to these laboratory analytical indicators, closely detecting these factors, and making targeted improvements may increase the blood culture positivity rate and benefit patients.
HTML
Blood Culture Collection and Processing
Data Collection
Data Analysis
Relationship between Laboratory Analytical Indicators and Blood Culture Positivity Rates
Relationship between Total Pre-Analytical Time and Blood Culture Positivity Rates
Relationship between the TTD and Bacterial Detection
Identification of Microorganisms Grown in Positive Blood Cultures
Competing Interests The authors declare that this study was conducted in the absence of any commercial or financial relationships that could be construed as potential conflicts of interest.
&These authors contributed equally to this work.

 Quick Links
 DownLoad: