


-
Polyaromatic hydrocarbons (PAHs) are ubiquitous pollutants generated by industrial activities. These compounds are released into the atmosphere and soil as complex mixtures due to incomplete combustion during daily living (tobacco smoking, traffic-related emission, cooking, and heating) and industrial activities (electronic waste recycling, asphalt, coal-fired power plants, foundries, and blast furnaces). Owing to their highly lipophilic nature, PAHs are readily absorbed into the human body through ingestion, inhalation, or dermal contact, and are subsequently distributed rapidly and widely throughout the body. Human exposure to PAHs is of significant concern, as studies have demonstrated that it may lead to adverse effects, such as immunotoxicity, neurotoxicity, carcinogenicity, genotoxicity, teratogenicity, and reproductive toxicity[1]. Allergic diseases, such as asthma, rhinitis, eczema, hay fever, and food allergies, are among the most prevalent chronic health conditions. While allergies are recognized as a result of interactions between multiple genetic and environmental factors, they are primarily considered environmental diseases.
However, research on the association between PAHs and allergic diseases in humans is limited and remains controversial. Previous studies have predominantly focused on individual PAH exposures, with minimal exploration of their combined effects on allergic outcomes[2]. To address this gap, we employed two advanced statistical methods: logistic regression and Bayesian kernel machine regression (BKMR). These approaches allowed us to comprehensively evaluate the associations of both individual and combined PAH exposures with allergic outcomes, utilizing data from a representative sample of the US population, specifically the National Health and Nutrition Examination Survey (NHANES) 2005–2006.
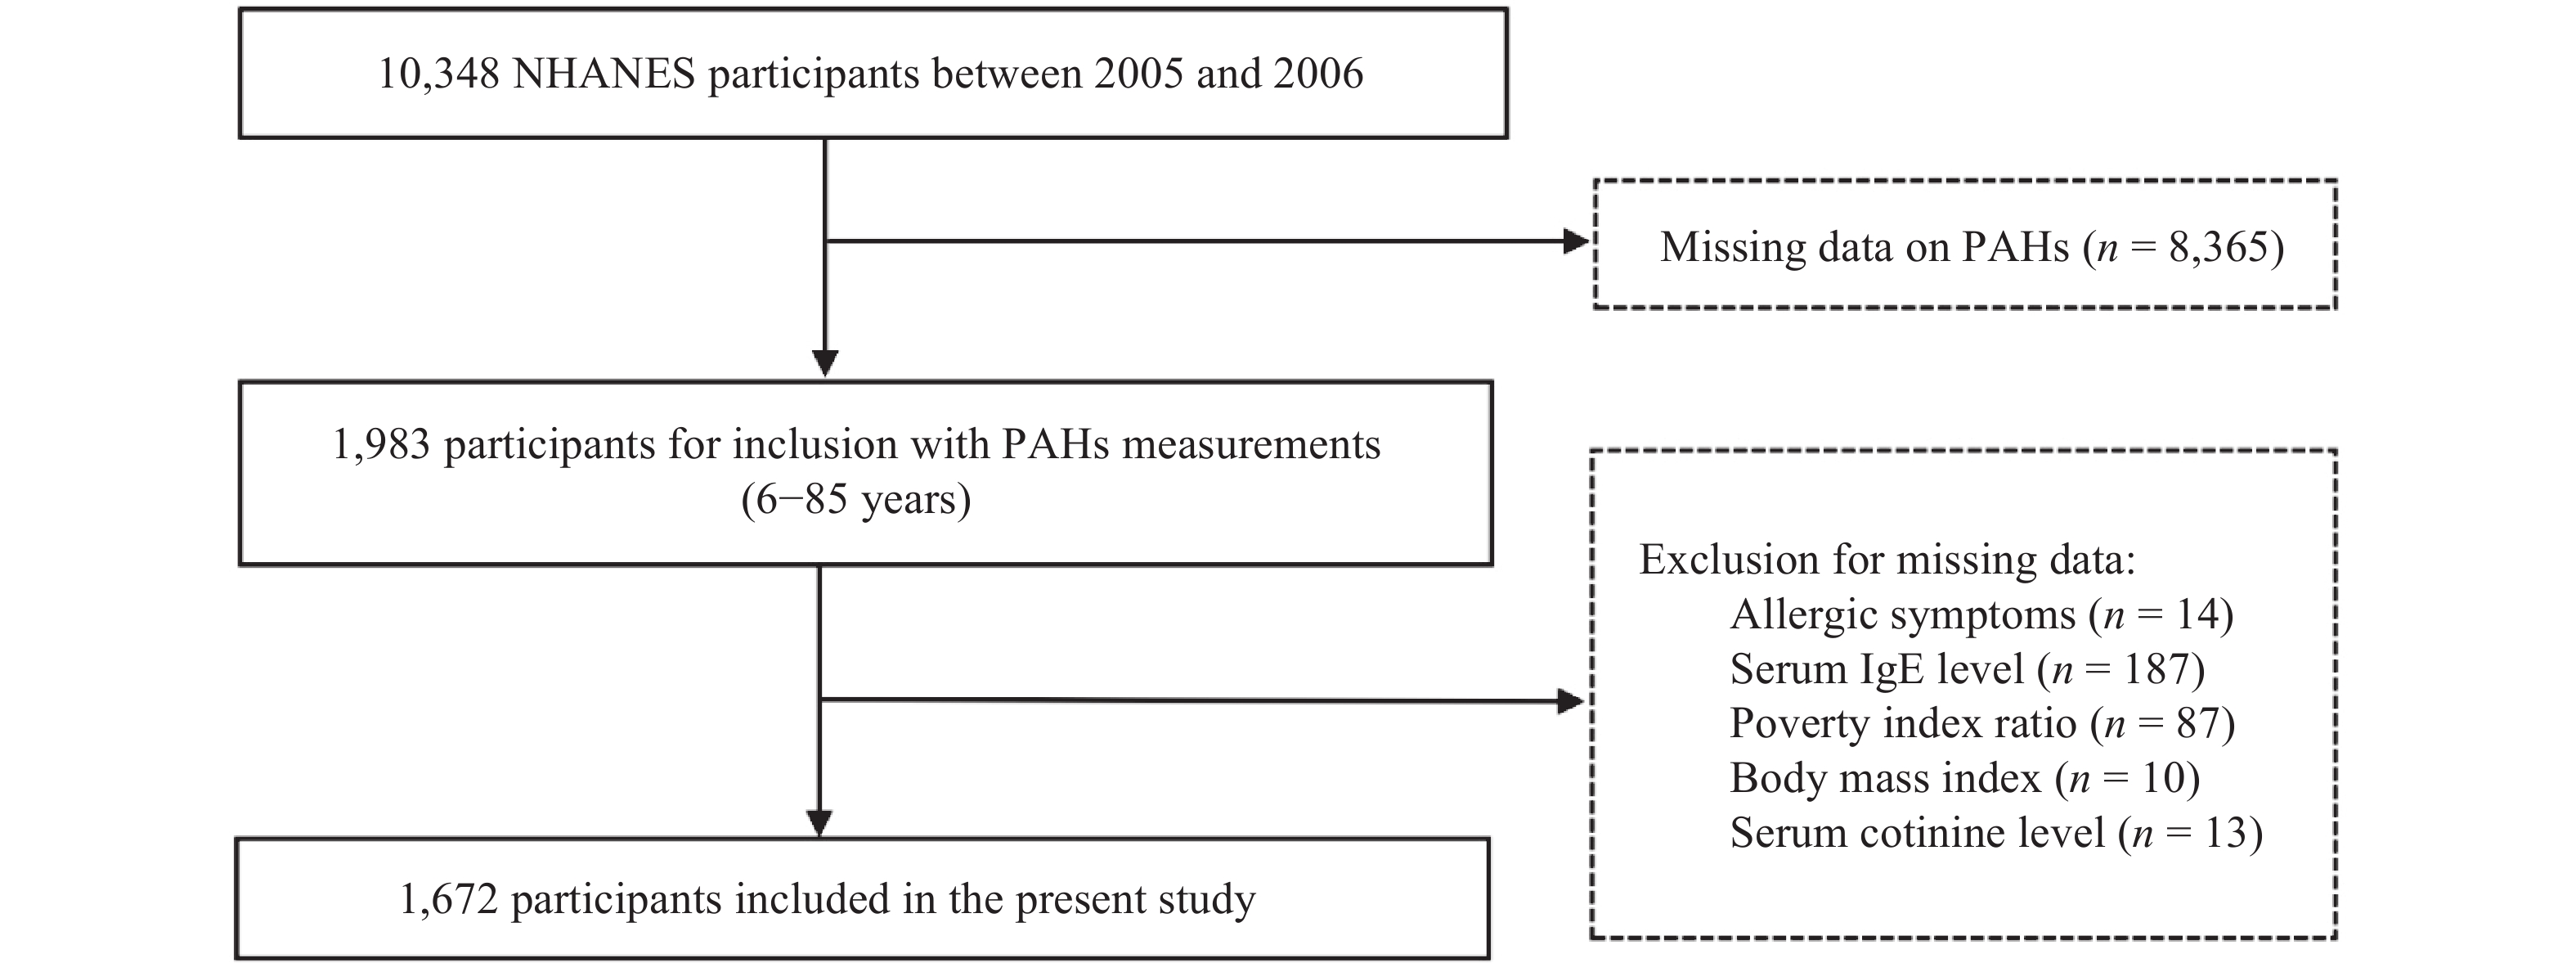
NHANES is a cross-sectional and nationally representative survey that assesses the health and nutritional status of the non-institutional US population. For this study, we used data from the 2005 to 2006 NHANES, and 1,672 participants were included in the subsequent analysis. The detailed participant selection process is illustrated in Supplementary Figure S1 (available in www.besjournal.com).
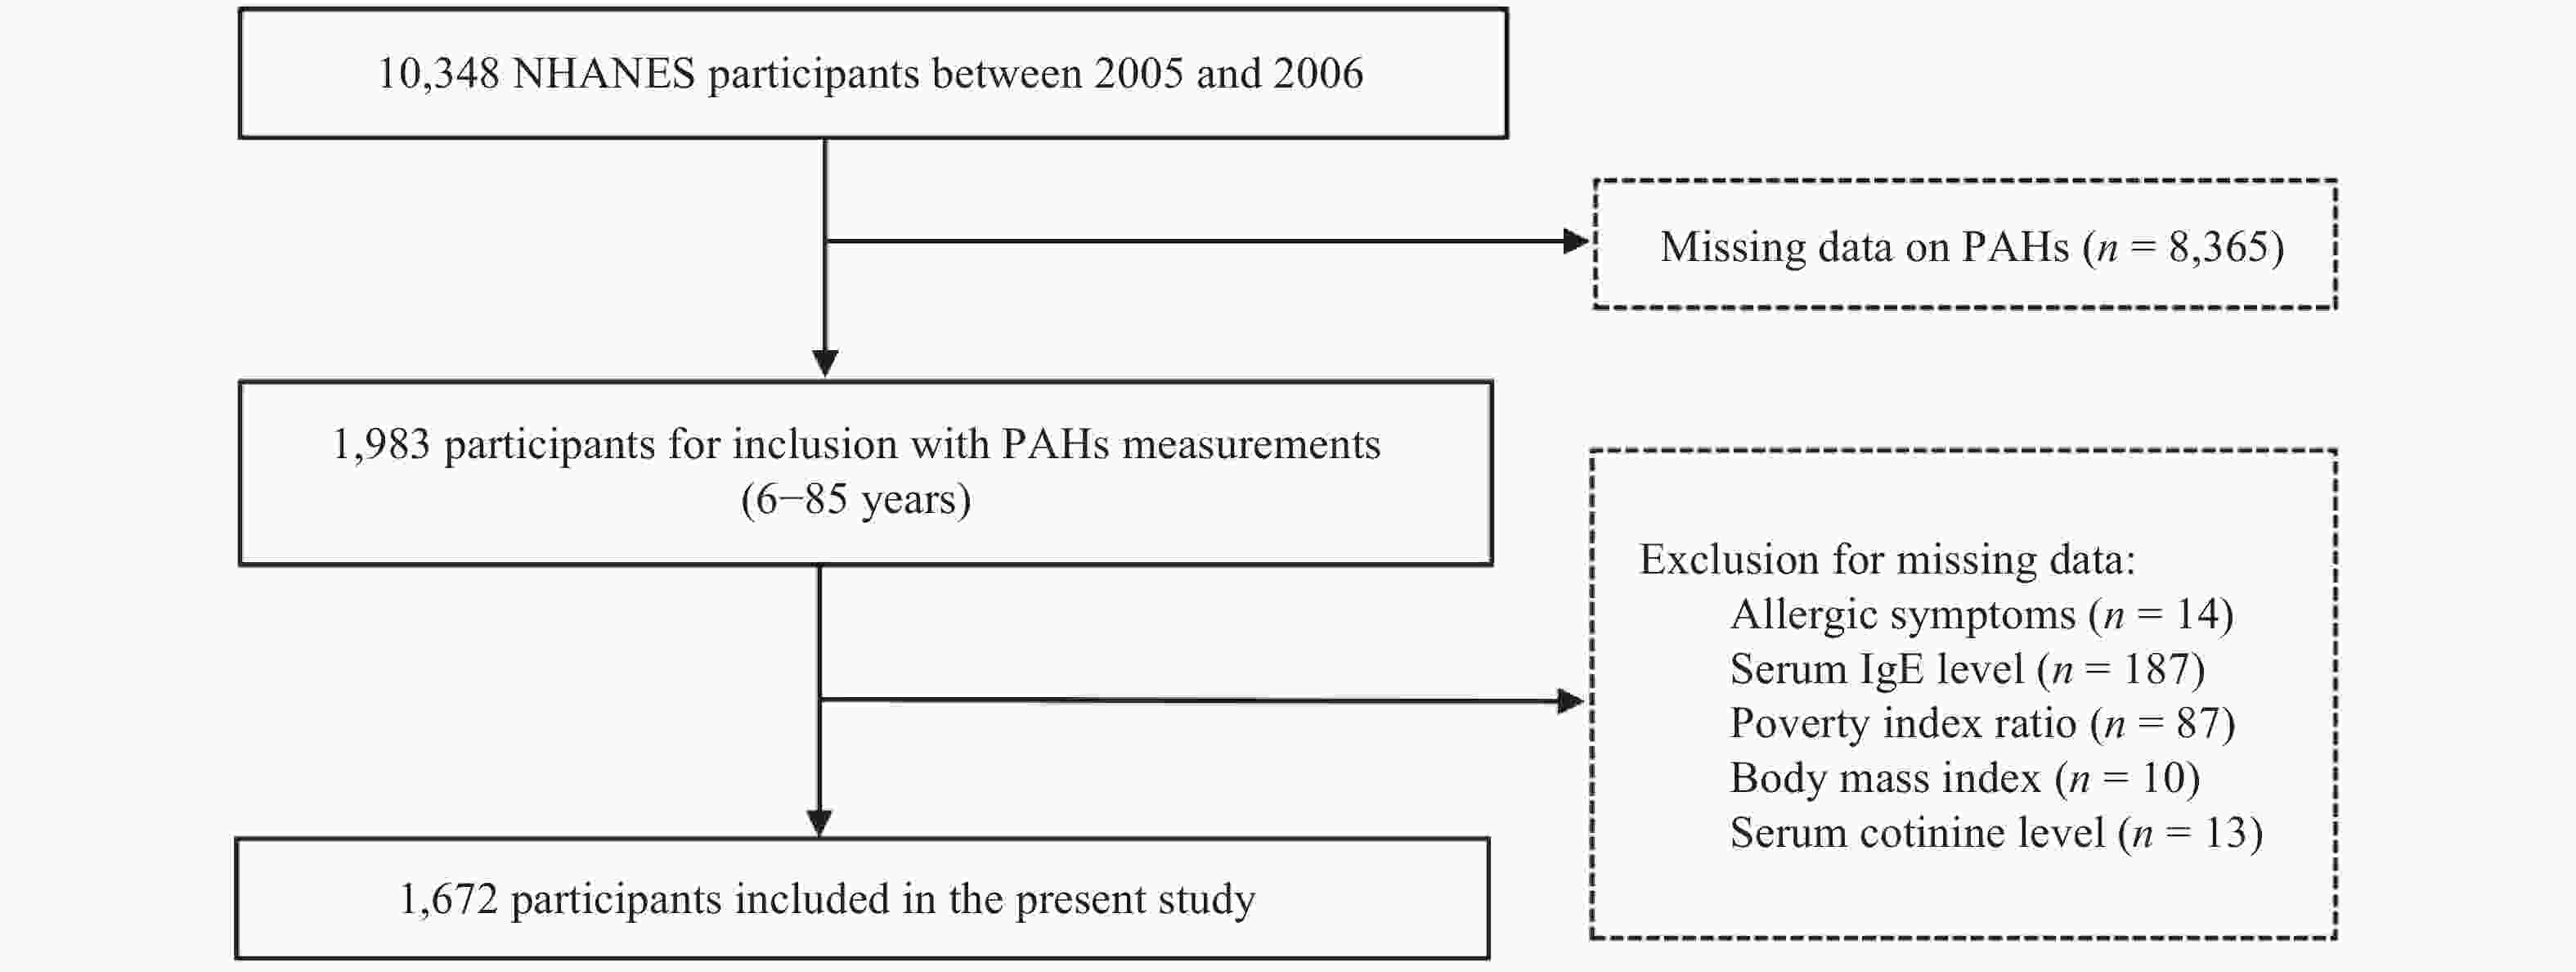
Figure S1. Flow diagram of the study population.
PAH exposure was estimated by measuring urinary PAH concentrations in participants aged ≥ 6 years. Detailed laboratory methods, quality control procedures, and conversion formulas are available online at https://wwwn.cdc.gov/Nchs/Nhanes/2005-2006/PAH_D.htm. Ten PAH metabolites were measured: 1-hydroxynaphthalene (1-OHNap), 2-hydroxynaphthalene (2-OHNap), 3-hydroxyfluorene (3-OHFlu), 2-hydroxyfluorene (2-OHFlu), 3-hydroxyphenanthrene (3-OHPhe), 1-hydroxyphenanthrene (1-OHPhe), 2-hydroxyphenanthrene (2-OHPhe), 1-hydroxypyrene (1-OHPyr), 9-hydroxyfluorene (9-OHFlu), and 4-hydroxyphenanthrene (4-OHPhe). To mitigate the impact of urine dilution on the results, urinary concentrations of PAHs (ng/L) were adjusted by dividing by urinary creatinine levels (mg/dL), multiplied by 0.01, and expressed as nanograms per gram of creatinine (ng/g Cr).
Information on allergic symptoms and diseases was obtained using self-administered questionnaires. For participants under 16 years of age, a proxy respondent, usually a parent, who was responsible for completing the interview. Six allergic symptoms were ascertained based on positive responses to the following questions: 1) Asthma: Has a doctor or other health professional ever told you that you have asthma? 2) Hay fever: Has a doctor or other health professional ever told you that you have hay fever? 3) Itchy rash: Have you ever had an itchy rash which was coming and going for at least 6 months? 4) Current sneezing: During the past 12 months, have you had a problem with sneezing or a runny or blocked nose when you did not have a cold or flu? 5) Eczema: Has a doctor or other health professional ever told you that you have eczema? and 6) Current wheezing: In the past 12 months, have you experienced wheezing or whistling on your chest?
Serum samples were analyzed for allergen-specific IgE using the Pharmacia Diagnostics ImmunoCAP 1000 System (Kalamazoo, Michigan, USA). Nineteen allergen-specific IgEs (Dermatophagoides farinae, Dermatophagoides pteronyssinus, cat, dog, cockroach, Alternaria alternata, peanut, egg, milk, ragweed, ryegrass, Bermuda grass, white oak, birch tree, shrimp, Aspergillus fumigatus, Russian thistle, mouse, and rat) were assessed. Allergic sensitization was defined as a positive response to at least one of the 19 specific IgE antigens (≥ 0.35 kU/L).
The potential confounders identified in this study were identified based on previous research[3]: sex, age, race/ethnicity, family poverty income ratio (PIR), body mass index (BMI), and serum cotinine level. Race/ethnicity was classified as “non-Hispanic white”, “non-Hispanic black”, “Mexican American”, or “others”. The PIR was dichotomized (< 1.85 and 1.85–5) to reflect the participants’ socioeconomic status. Serum cotinine level was categorized as < limit of detection (LOD, 0.015 ng/mL), < 1 ng/mL, and ≥ 1 ng/mL. For children (6–19 years), BMI categories were defined according to the age and gender-specific growth charts and categorized as underweight (BMI < 5th percentile), normal weight (BMI 5th to < 85th percentile), overweight (BMI 85th to < 95th percentile), or obese (BMI ≥ 95th percentile). Similarly, we used BMI to classify adults (≥ 20 years) as underweight (BMI < 18.5 kg/m2), normal weight (18.5 ≤ BMI < 25 kg/m2), overweight (25 ≤ BMI < 30 kg/m2) , or obese (BMI ≥ 30 kg/m2)[4].
Descriptive statistical analyses were performed to describe demographic characteristics, with categorical variables expressed as frequencies. The distributions of urinary PAH concentrations are described using the geometric mean (GM), median, and selected percentiles.
Logistic regression models were used to examine the potential associations of urinary PAH concentrations, treated as categorical variables (quartiles [Q] 1, Q2, Q3, and Q4), with allergic symptoms and sensitization. Tests for trends (p-trend) were performed by entering the median concentrations of PAH quartiles as continuous variables into the logistic regression models. In addition, we assessed the associations between urinary PAH concentrations, treated as log10-transformed continuous variables, and these outcomes. The models were adjusted for age, race/ethnicity, sex, BMI, PIR, and serum cotinine levels. Sensitivity analyses were conducted and stratified according to age (children and adults).
Owing to the different impacts generated by distinct PAH substances, the overall effect of mixed PAH exposure on allergic outcomes could not be assessed additively. Consequently, we used the BKMR model, a method for evaluating the health effects of mixture exposure, to better estimate the potential effects of PAHs on allergic outcomes. We calculated the posterior inclusion probabilities (PIPs), a measure of variable importance ranging from 0 to 1 to indicate the relative contribution of a given PAH exposure on allergic outcomes, with a threshold value of 0.5 used to judge importance. Because the PAH distributions were skewed, the data were log10-transformed to mitigate skewness in the BKMR model analysis.
All statistical analyses were performed using the R Studio software (version 4.2.2). Statistical significance was set at a two-tailed P-value < 0.05.
Supplementary Table S1 (available in www.besjournal.com) shows the demographic characteristics of the 1,672 participants included in the study. The demographic characteristics were similar between the baseline population (n = 8,412) and the study population (n = 1,672), except for race and ethnicity (Supplementary Table S2, available in www.besjournal.com).
Characteristics Asthma
N (%)*Hay fever
N (%)*Itchy rash
N (%)*Sneeze
N (%)*Eczema
N (%)*Wheeze
N (%)*Allergic
sensitization
N (%)aYes
(n = 232)No
(n = 1,440)Yes
(n = 131)No
(n = 1,541)Yes
(n = 142)No
(n = 1,530)Yes
(n = 500)No
(n = 1,172)Yes
(n = 134)No
(n = 1,538)Yes
(n = 218)No
(n = 1,454)Yes
(n = 815)No
(n = 857)Sex Male 116 (50.0) 723 (50.2) 61 (46.6) 778 (50.5) 71 (50.0) 768 (50.2) 229 (45.8) 610 (52.0) 62 (46.3) 777 (50.5) 107 (49.1) 732 (50.3) 446 (54.7) 393 (45.9) Female 116 (50.0) 717 (49.8) 70 (53.4) 763 (49.5) 71 (50.0) 762 (49.8) 271 (54.2) 562 (48.0) 72 (53.7) 761 (49.5) 111 (50.9) 722 (49.7) 369 (45.3) 464 (54.1) P -Value 0.953 0.389 0.964 0.019 0.345 0.728 0.000 Age Children (6–19 years) 107 (46.1) 553 (38.4) 30 (22.9) 630 (40.9) 43 (30.3) 617 (40.3) 178 (35.6) 482 (41.1) 59 (44.0) 601 (39.1) 72 (33.0) 588 (40.4) 352 (43.2) 308 (35.9) Adults (≥ 20 years) 125 (53.9) 887 (61.6) 101 (77.1) 911 (59.1) 99 (69.7) 913 (59.7) 322 (64.4) 690 (58.9) 75 (56.0) 937 (60.9) 146 (67.0) 866 (59.6) 463 (56.8) 549 (64.1) P -Value 0.026 0.000 0.019 0.034 0.261 0.037 0.002 Race/ethnicity Non-Hispanic White 87 (37.5) 639 (44.4) 77 (58.8) 649 (42.1) 59 (41.5) 667 (43.6) 256 (51.2) 470 (40.1) 65 (48.5) 661 (43.0) 101 (46.3) 625 (43.0) 304 (37.3) 422 (49.2) Non-Hispanic Black 81 (34.9) 382 (26.5) 26 (19.8) 437 (28.4) 45 (31.7) 418 (27.3) 128 (25.6) 335 (28.6) 49 (36.6) 414 (26.9) 64 (29.4) 399 (27.4) 272 (33.4) 191 (22.3) Mexican American 45 (19.4) 310 (21.5) 19 (14.5) 336 (21.8) 27 (19.0) 328 (21.4) 77 (15.4) 278 (23.7) 9 (6.7) 346 (22.5) 31 (14.2) 324 (22.3) 173 (21.2) 182 (21.2) Otherb 19 (8.2) 109 (7.6) 9 (6.9) 119 (7.7) 11 (7.7) 117 (7.6) 39 (7.8) 89 (7.6) 11 (8.2) 117 (7.6) 22 (10.1) 106 (7.3) 66 (8.1) 62 (7.3) P -Value 0.015 0.004 0.847 0.000 0.001 0.026 0.000 BMIc Underweight 2 (0.9) 30 (2.1) 2 (1.5) 30 (1.9) 2 (1.4) 30 (2.0) 9 (1.8) 23 (2.0) 0 (0.0) 32 (2.1) 4 (1.8) 28 (1.9) 15 (1.8) 17 (2.0) Normal weight 89 (38.4) 582 (40.4) 50 (38.2) 621 (40.3) 46 (32.4) 625 (40.8) 192 (38.4) 479 (40.9) 56 (41.8) 615 (40.0) 63 (28.9) 608 (41.8) 331 (40.6) 340 (39.7) Overweight 51 (22.0) 399 (27.7) 36 (27.5) 414 (26.9) 37 (26.1) 413 (27.0) 134 (26.8) 316 (27.0) 32 (23.9) 418 (27.2) 56 (25.7) 394 (27.1) 212 (26.0) 238 (27.8) Obese 90 (38.8) 429 (29.8) 43 (32.8) 476 (30.9) 57 (40.1) 462 (30.2) 165 (33.0) 354 (30.2) 46 (34.3) 473 (30.8) 95 (43.6) 424 (29.2) 257 (31.5) 262 (30.6) P -Value > 0.05 > 0.05 > 0.05 > 0.05 > 0.05 0.008 d > 0.05 PIR Below poverty level (< 1.85) 97 (41.8) 610 (42.4) 36 (27.5) 671 (43.5) 63 (44.4) 644 (42.1) 182 (36.4) 525 (44.8) 50 (37.3) 657 (42.7) 96 (44.0) 611 (42.0) 354 (43.4) 353 (41.2) Above poverty level (1.85–5) 135 (58.2) 830 (57.6) 95 (72.5) 870 (56.5) 79 (55.6) 886 (57.9) 318 (63.6) 647 (55.2) 84 (62.7) 881 (57.3) 122 (56.0) 843 (58.0) 461 (56.6) 504 (58.8) P -Value 0.875 0.000 0.600 0.001 0.225 0.574 0.353 Serum cotinine level Below LODe 45 (19.4) 271 (18.8) 22 (16.8) 294 (19.1) 29 (20.4) 287 (18.8) 101 (20.2) 215 (18.3) 26 (19.4) 290 (18.9) 31 (14.2) 285 (19.6) 159 (19.5) 157 (18.3) < 1 ng/mL 124 (53.4) 780 (54.2) 77 (58.8) 827 (53.7) 83 (58.5) 821 (53.7) 253 (50.6) 651 (55.5) 81 (60.4) 823 (53.5) 97 (44.5) 807 (55.5) 436 (53.5) 468 (54.6) ≥ 1 ng/mL 63 (27.2) 389 (27.0) 32 (24.4) 420 (27.3) 30 (21.1) 422 (27.6) 146 (29.2) 306 (26.1) 27 (20.1) 425 (27.6) 90 (41.3) 362 (24.9) 220 (27.0) 232 (27.1) P -Value 0.973 0.529 0.254 0.177 0.160 0.000 0.815 Note. NHANES: National Health and Nutrition Examination Survey; BMI: body mass index; PIR: poverty income ratio; LOD: limit of detection; Bold: Statistically significant (P < 0.05). *Self-reported current symptoms in past 12 months; Symptoms of asthma, hay fever, and eczema were assessed only among those who reported a doctor’s diagnosis. aAny serum IgE positive ≥ 0.35kU/L. bOther race/ethnicity includes other Hispanic and non-Hispanic multiracial ethnicity. cNHANES classified children as underweight (BMI < 5th percentile), normal weight (BMI 5th to < 85th percentile), overweight (BMI 85th to < 95th percentile), or obese (BMI ≥ 95th percentile) according to the U.S. CDC gender-specific growth charts based on age and classified adults as underweight (BMI < 18.5 kg/m2), normal weight (18.5 ≤ BMI < 25 kg/m2), overweight (25 ≤ BMI < 30 kg/m2) , or obese (BMI ≥ 30 kg/m2). dThe statistical value P between BMI and wheezing in adults was 0.008, in children was 0.124. eBelow 0.015 ng/mL. Table S1. Demographic characteristics of the study population by allergic outcome status in NHANES 2005–2006 (n = 1,672)
Characteristics Study population
(N = 1672)Baseline population
(N = 8412)P-value N (%) N (%) Sex 0.2234 Male 839 50.2 4084 48.5 Female 833 49.8 4328 51.5 Age 0.3092 Children (6–19 years) 660 39.5 3433 40.8 Adults (≥ 20 years) 1012 60.5 4979 59.2 Race/ethnicity 0.0032 Non-Hispanic White 726 43.4 3377 40.1 Non-Hispanic Black 463 27.7 2247 26.7 Mexican American 355 21.2 2133 25.4 Other 128 7.7 655 7.8 BMI 0.9196 Underweight 32 1.9 153 1.8 Normal weight 671 40.1 3263 38.8 Overweight 450 26.9 2146 25.5 Obese 519 31.1 2412 28.7 PIR 0.1451 Below poverty level (< 1.85) 707 42.3 3537 42.0 Above poverty level (1.85–5) 965 57.7 4460 53.0 Serum cotinine level 0.4565 Below LOD (0.015 ng/mL) 316 18.9 1319 15.7 < 1 ng/mL 904 54.1 4099 48.7 ≥ 1 ng/mL 452 27.0 1944 23.1 Note. BMI: body mass index; PIR: poverty income ratio; LOD: limit of detection. All analyses were performed by chi-square test. Numbers vary slightly in BMI, PIR, and serum cotinine level among baseline population due to missing data. Table S2. Demographic characteristics of all participants aged ≥ 6 years (n = 8,412) and the study population (n = 1,672)
The distributions of urinary PAH metabolite concentrations, both unadjusted (ng/L) and adjusted (ng/g Cr) for creatinine, are summarized in Supplementary Table S3 (available in www.besjournal.com). The detection rates of the ten PAH metabolites were higher than 96%.
Characteristics Not adjusted for creatinine (ng/L) Creatinine adjusted (ng/g Cr) Percentile of distribution Percentile of distribution Metabolites Detection rate (%) GM 25th 50th 75th 95th GM 25th 50th 75th 95th 1-OHNap 99.8 2463.7 788.0 1885.0 7055.2 43959.4 2184.5 702.8 1597.2 5528.5 34056.7 2-OHNap 100.0 3806.6 1709.4 3631.9 8107.5 28044.9 3375.2 1686.5 2984.3 6215.1 20745.2 3-OHFlu 99.8 117.7 49.2 101.3 253.9 1323.9 104.3 47.4 78.1 177.8 1055.2 2-OHFlu 100 301.8 143.3 275.9 585.4 2547.7 267.6 138.2 207.7 413.4 1879.3 3-OHPhe 99.8 103.2 54.5 101.2 197.7 544.6 91.5 53.1 83.0 140.2 391.7 1-OHPhe 100 148.5 81.2 147.9 267.9 664.8 131.7 80.4 125.7 201.4 474.8 2-OHPhe 99.6 63.4 34.5 63.1 115.2 296.7 56.2 33.5 51.1 86.4 227.2 1-OHPyr 99.8 100.9 48.5 95.8 205.8 678.8 89.4 48.0 82.7 150.9 462.5 9-OHFlu 100 308.7 159.1 301.3 585.8 1720.6 273.7 151.3 244.9 443.4 1339.6 4-OHPhe 96.5 29.8 16.0 29.3 55.4 152.4 26.4 15.3 24.8 42.6 106.6 Note. GM: Geometric Mean. Table S3. Distribution of urinary PAH metabolites (creatinine unadjusted and adjusted) among participants in NHANES 2005–2006 (n = 1,672)
Table 1 and Supplementary Table S4 (available in www.besjournal.com) illustrated the relationships between PAHs, categorical and continuous variables, and allergic outcomes in the overall study population. Compared with the lowest quartiles of PAH metabolites, the highest quartiles were generally associated with an approximately 1.2 to 2-fold increased risk of hay fever, itchy rash, and wheezing (Table 1). Similar association patterns were observed in the continuous model analyses (Supplementary Table S4). However, no associations were found between urinary PAHs treated as categorical or continuous variables and asthma, sneezing, eczema, or allergic sensitization (Table 1 and Supplementary Table S4).
PAHs Asthma Hay fever Itchy rash Sneeze Eczema Wheeze Allergic sensitization 1-OHNap Q1 (≤ 703.50) Reference Reference Reference Reference Reference Reference Reference Q2 (703.51–1597.22) 0.71
(0.47–1.06)0.90
(0.52–1.55)1.17
(0.70–1.95)0.85
(0.63–1.16)1.08
(0.64–1.80)0.86
(0.55–1.35)0.86
(0.55–1.35)Q3 (1597.23–5527.62) 0.87
(0.59–1.29)1.09
(0.64–1.86)1.42
(0.86–2.34)1.06
(0.78–1.44)1.47
(0.89–2.41)0.79
(0.50–1.24)0.79
(0.50–1.24)Q4 (≥ 5527.63) 1.04
(0.68–1.60)1.54
(0.89–2.69)1.51
(0.87–2.60)1.18
(0.85–1.64)1.07
(0.60–1.90)1.54
(0.99–2.39)1.54
(0.99–2.39)P for trenda 0.301 0.049 0.239 0.138 0.832 0.002 0.896 2-OHNap Q1 (≤ 1686.52) Reference Reference Reference Reference Reference Reference Reference Q2 (1686.53–2984.26) 1.01
(0.68–1.51)0.62
(0.35–1.08)1.54
(0.93–2.53)0.83
(0.61–1.12)1.25
(0.76–2.04)0.61
(0.38–0.96)0.61
(0.38–0.96)Q3 (2984.27–6210.78) 0.94
(0.62–1.42)1.17
(0.70–1.94)1.27
(0.75–2.17)0.83
(0.61–1.13)1.18
(0.70–2.00)0.86
(0.56–1.33)0.86
(0.56–1.33)Q4 (≥ 6210.79) 1.09
(0.70–1.70)1.19
(0.68–2.10)1.55
(0.88–2.74)0.88
(0.63–1.24)1.55
(0.87–2.74)1.22
(0.78–1.90)1.22
(0.78–1.90)P for trend 0.642 0.202 0.329 0.853 0.185 0.033 0.668 3-OHFlu Q1 (≤ 47.42) Reference Reference Reference Reference Reference Reference Reference Q2 (47.43–78.09) 0.88
(0.59–1.30)0.59
(0.35–1.00)0.91
(0.55–1.50)0.88
(0.65–1.18)1.08
(0.65–1.79)0.84
(0.54–1.32)0.84
(0.54–1.32)Q3 (78.10–177.65) 0.93
(0.62–1.38)0.64
(0.37–1.10)1.14
(0.69–1.88)0.79
(0.58–1.09)1.23
(0.75–2.04)0.95
(0.61–1.49)0.95
(0.61–1.49)Q4 (≥ 177.66) 0.82
(0.51–1.32)1.18
(0.66–2.11)1.62
(0.92–2.87)1.00
(0.70–1.42)0.91
(0.49–1.68)1.32
(0.82–2.13)1.32
(0.82–2.13)P for trend 0.513 0.095 0.050 0.514 0.523 0.078 0.524 2-OHFlu Q1 (≤ 138.23) Reference Reference Reference Reference Reference Reference Reference Q2 (138.24–207.67) 0.85
(0.58–1.26)0.74
(0.44–1.24)0.58
(0.34–0.98)0.88
(0.65–1.19)0.91
(0.54–1.53)0.80
(0.52–1.24)0.80
(0.52–1.24)Q3 (207.68–413.15) 0.77
(0.51–1.15)0.60
(0.34–1.05)0.94
(0.58–1.52)0.71
(0.52–0.98)1.33
(0.81–2.17)0.64
(0.41–1.02)0.64
(0.41–1.02)Q4 (≥ 413.16) 0.83
(0.52–1.32)1.18
(0.67–2.08)1.30
(0.76–2.24)1.10
(0.78–1.56)1.05
(0.58–1.90)1.27
(0.80–2.02)1.27
(0.80–2.02)P for trend 0.703 0.134 0.064 0.148 0.929 0.024 0.310 3-OHPhe Q1 (≤ 53.08) Reference Reference Reference Reference Reference Reference Reference Q2 (53.09–82.98) 0.92
(0.62–1.35)1.02
(0.61–1.70)1.20
(0.73–1.99)0.86
(0.64–1.17)1.00
(0.60–1.67)0.85
(0.55–1.32)0.85
(0.55–1.32)Q3 (82.99–140.10) 0.72
(0.48–1.09)0.57
(0.31–1.04)0.88
(0.50–1.54)0.71
(0.52–0.97)1.01
(0.60–1.70)0.84
(0.54–1.30)0.84
(0.54–1.30)Q4 (≥ 140.11) 0.87
(0.57–1.34)1.44
(0.84–2.46)2.18 (1.30–3.66) 0.86
(0.62–1.19)1.21
(0.70–2.09)1.12
(0.72–1.74)1.12
(0.72–1.74)P for trend 0.655 0.079 0.001 0.636 0.428 0.284 0.514 1-OHPhe Q1 (≤ 80.49) Reference Reference Reference Reference Reference Reference Reference Q2 (80.50–125.73) 0.77
(0.52–1.14)0.55
(0.32–0.98)0.92
(0.55–1.54)0.83
(0.61–1.13)0.83
(0.49–1.40)0.71
(0.45–1.11)0.71
(0.45–1.11)Q3 (125.74–201.28) 0.83
(0.55–1.24)0.75
(0.44–1.28)0.82
(0.47–1.40)0.72
(0.52–0.99)0.82
(0.47–1.41)0.87
(0.56–1.35)0.87
(0.56–1.35)Q4 (≥ 201.29) 0.85
(0.56–1.31)0.90
(0.52–1.54)1.58
(0.95–2.63)0.95
(0.69–1.32)1.39
(0.82–2.36)1.02
(0.66–1.59)1.02
(0.66–1.59)P for trend 0.747 0.538 0.022 0.775 0.072 0.373 0.838 2-OHPhe Q1 (≤ 33.54) Reference Reference Reference Reference Reference Reference Reference Q2 (33.55–51.07) 1.33
(0.86–2.04)0.67
(0.38–1.16)1.37
(0.81–2.31)0.60
(0.44–0.82)1.19
(0.72–1.97)0.81
(0.52–1.25)0.81
(0.52–1.25)Q3 (51.08–86.33) 1.01
(0.65–1.55)0.76
(0.45–1.30)1.27
(0.74–2.19)0.79
(0.58–1.07)0.93
(0.54–1.61)0.86
(0.55–1.33)0.86
(0.55–1.33)Q4 (≥ 86.34) 0.99
(0.65–1.52)1.09
(0.64–1.85)1.99 (1.15–3.43) 0.81
(0.58–1.12)1.45
(0.84–2.50)1.14
(0.73–1.77)1.14
(0.73–1.77)P for trend 0.364 0.290 0.015 0.883 0.202 0.223 0.656 1-OHPyr Q1 (≤ 47.99) Reference Reference Reference Reference Reference Reference Reference Q2 (48.00–82.69) 0.71
(0.47–1.06)0.60
(0.36–1.00)1.00
(0.58–1.72)0.92
(0.68–1.24)1.07
(0.65–1.78)1.05
(0.68–1.64)1.05
(0.68–1.64)Q3 (82.70–150.76) 0.85
(0.57–1.28)0.52
(0.30–0.90)1.17
(0.71–1.93)0.74
(0.54–1.02)0.86
(0.50–1.49)1.13
(0.72–1.78)1.13
(0.72–1.78)Q4 (≥ 150.77) 0.91
(0.60–1.39)0.83
(0.49–1.40)1.95 (1.16–3.27) 0.72
(0.52–1.01)1.33
(0.78–2.28)1.40
(0.89–2.19)1.40
(0.89–2.19)P for trend 0.841 0.955 0.006 0.064 0.242 0.106 0.604 9-OHFlu Q1 (≤ 151.42) Reference Reference Reference Reference Reference Reference Reference Q2 (151.43–244.91) 0.73
(0.49–1.08)0.84
(0.48–1.46)0.91
(0.55–1.50)1.01
(0.75–1.38)0.72
(0.44–1.17)0.90
(0.58–1.40)0.90
(0.58–1.40)Q3 (244.92–443.30) 0.62
(0.41–0.93)0.98
(0.57–1.69)0.79
(0.46–1.34)0.87
(0.63–1.19)0.46
(0.27–0.80)0.77
(0.49–1.21)0.77
(0.49–1.21)Q4 (≥ 443.31) 0.75
(0.48–1.18)1.38
(0.79–2.42)1.43
(0.84–2.45)1.11
(0.79–1.56)0.78
(0.45–1.34)1.07
(0.67–1.71)1.07
(0.67–1.71)P for trend 0.484 0.096 0.070 0.430 0.652 0.438 0.761 4-OHPhe Q1 (≤ 15.32) Reference Reference Reference Reference Reference Reference Reference Q2 (15.33–24.79) 1.02
(0.69–1.52)0.62
(0.35–1.09)1.24
(0.74–2.09)0.82
(0.61–1.11)1.02
(0.62–1.68)1.29
(0.83–2.00)1.29
(0.83–2.00)Q3 (24.80–42.61) 0.98
(0.65–1.46)0.70
(0.40–1.22)1.03
(0.60–1.77)0.77
(0.57–1.05)0.68
(0.39–1.19)1.13
(0.72–1.77)1.13
(0.72–1.77)Q4 (≥ 42.62) 0.96
(0.63–1.47)1.50
(0.90–2.49)2.01
(1.20–3.36)0.86
(0.62–1.18)1.41
(0.85–2.34)1.28
(0.82–2.00)1.28
(0.82–2.00)P for trend 0.789 0.006 0.004 0.607 0.120 0.480 0.879 Note. All models adjusted for age, race/ethnicity, sex, BMI, PIR, and serum cotinine level; Bold: Statistically significant (P < 0.05). Q1: Quartile 1; Q2: Quartile 2; Q3: Quartile 3; Q4: Quartile 4; OR: odds ratio; CI: confidence interval. aP values for the medians of each quartile of PAHs levels included in the logistic regression models. Table 1. Adjusted ORs (95% CIs) for the association between the quartiles of urinary PAHs and allergic outcomes in the overall study population in NHANES 2005–2006 (n = 1,672)
When stratified by age (children and adults), positive associations were more pronounced among adults, with an approximately 1.5 to 2.5-fold increased risk of hay fever, itchy rash, and wheezing (Table 2). Similar results were obtained when the PAHs were analyzed as continuous variables (Supplementary Table S5, available in www.besjournal.com). However, there is no strong evidence of an association between PAHs and allergies in children (Supplementary Table S6, available in www.besjournal.com).
PAHs Asthma Hay fever Itchy rash Sneeze Eczema Wheeze Allergic sensitization 1-OHNap Q1 (≤ 832.33) Reference Reference Reference Reference Reference Reference Reference Q2 (832.34–2280.99) 0.47
(0.27–0.82)0.71
(0.38–1.34)1.06
(0.58–1.92)0.84
(0.57–1.23)1.30
(0.66–2.54)0.67
(0.37–1.21)0.70
(0.49–1.00)Q3 (2281.00–8754.41) 0.82
(0.49–1.38)1.07
(0.59–1.97)1.13
(0.61–2.11)0.79
(0.53–1.17)1.35
(0.67–2.71)0.85
(0.48–1.51)0.80
(0.55–1.16)Q4 (≥ 8754.42) 0.55
(0.30–1.02)1.35
(0.70–2.59)1.22
(0.62–2.39)0.82
(0.53–1.26)0.92
(0.41–2.07)1.66
(0.95–2.90)0.90
(0.60–1.36)P for trenda 0.233 0.155 0.606 0.700 0.461 0.002 0.637 2-OHNap Q1 (≤ 1779.03) Reference Reference Reference Reference Reference Reference Reference Q2 (1779.04–3308.11) 1.05
(0.60–1.82)0.89
(0.47–1.69)1.39
(0.77–2.49)0.80
(0.54–1.18)1.19
(0.61–2.33)0.81
(0.45–1.47)1.17
(0.81–1.68)Q3 (3308.12–8093.59) 1.12
(0.64–1.97)1.62
(0.89–2.95)1.15
(0.61–2.16)0.91
(0.61–1.35)1.34
(0.67–2.70)1.08
(0.61–1.92)1.13
(0.77–1.64)Q4 (≥ 8093.60) 1.52
(0.80–2.88)1.67
(0.82–3.39)1.12
(0.54–2.33)0.94
(0.59–1.48)1.47
(0.64–3.36)1.95
(1.07–3.57)1.12
(0.73–1.72)P for trend 0.170 0.109 0.892 0.869 0.424 0.003 0.846 3-OHFlu Q1 (≤ 46.12) Reference Reference Reference Reference Reference Reference Reference Q2 (46.13–78.36) 0.79
(0.46–1.35)0.70
(0.38–1.30)0.97
(0.53–1.78)0.96
(0.65–1.41)1.10
(0.57–2.12)0.74
(0.41–1.34)0.92
(0.64–1.32)Q3 (78.37–244.31) 0.85
(0.49–1.46)1.03
(0.57–1.87)1.13
(0.61–2.08)1.06
(0.71–1.57)0.97
(0.48–1.95)0.98
(0.56–1.74)0.86
(0.59–1.24)Q4 (≥ 244.32) 0.96
(0.46–2.02)1.89
(0.86–4.14)2.20
(0.99–4.88)0.96
(0.57–1.61)1.15
(0.45–2.95)1.77
(0.90–3.49)0.84
(0.51–1.38)P for trend 0.784 0.035 0.032 0.823 0.782 0.017 0.667 2-OHFlu Q1 (≤ 141.86) Reference Reference Reference Reference Reference Reference Reference Q2 (141.87–231.87) 0.74
(0.44–1.25)0.81
(0.44–1.48)0.74
(0.39–1.39)1.04
(0.71–1.52)1.05
(0.54–2.03)0.71
(0.40–1.28)1.03
(0.72–1.47)Q3 (231.88–606.78) 0.62
(0.35–1.09)0.79
(0.42–1.50)0.95
(0.51–1.76)0.85
(0.56–1.27)0.91
(0.44–1.84)0.70
(0.39–1.27)0.81
(0.56–1.19)Q4 (≥ 606.79) 0.94
(0.47–1.88)1.86
(0.89–3.89)2.52
(1.21–5.23)0.99
(0.60–1.63)1.18
(0.49–2.85)1.85
(0.97–3.50)0.80
(0.50–1.28)P for trend 0.586 0.021 0.001 0.878 0.649 0.001 0.414 3-OHPhe Q1 (≤ 53.43) Reference Reference Reference Reference Reference Reference Reference Q2 (53.44–84.63) 1.04
(0.63–1.72)1.21
(0.68–2.15)1.22
(0.67–2.22)1.00
(0.68–1.46)1.12
(0.57–2.19)0.93
(0.53–1.62)1.07
(0.75–1.54)Q3 (84.64–161.36) 0.56
(0.31–1.02)0.59
(0.30–1.15)0.79
(0.40–1.55)0.78
(0.52–1.16)1.00
(0.49–2.00)0.80
(0.45–1.43)0.77
(0.53–1.11)Q4 (≥ 161.37) 0.88
(0.47–1.64)1.38
(0.71–2.68)2.21
(1.15–4.25)0.91
(0.58–1.41)1.10
(0.50–2.41)1.42
(0.79–2.53)0.78
(0.51–1.18)P for trend 0.710 0.287 0.008 0.733 0.880 0.073 0.174 1-OHPhe Q1 (≤ 90.00) Reference Reference Reference Reference Reference Reference Reference Q2 (90.01–143.97) 0.59
(0.34–1.01)0.53
(0.28–0.99)0.71
(0.38–1.36)1.06
(0.71–1.57)0.48
(0.22–1.04)1.04
(0.59–1.81)0.96
(0.67–1.39)Q3 (143.98–230.87) 0.60
(0.34–1.04)0.73
(0.40–1.33)0.90
(0.49–1.68)1.02
(0.68–1.52)0.78
(0.39–1.54)0.98
(0.56–1.72)0.75
(0.52–1.09)Q4 (≥ 230.88) 0.78
(0.45–1.37)0.73
(0.39–1.37)1.53
(0.84–2.81)0.95
(0.63–1.45)1.13
(0.57–2.21)1.38
(0.79–2.40)0.89
(0.60–1.31)P for trend 0.824 0.803 0.036 0.691 0.217 0.169 0.585 2-OHPhe Q1 (≤ 38.44) Reference Reference Reference Reference Reference Reference Reference Q2 (38.45–59.67) 0.61
(0.36–1.06)0.63
(0.34–1.17)0.68
(0.35–1.30)0.61
(0.41–0.90)0.81
(0.40–1.68)0.56
(0.31–1.02)1.00
(0.70–1.44)Q3 (59.68–105.19) 0.61
(0.35–1.06)0.73
(0.40–1.35)0.97
(0.52–1.79)0.88
(0.60–1.30)0.95
(0.46–1.95)0.91
(0.53–1.56)0.82
(0.57–1.19)Q4 (≥ 105.20) 0.87
(0.50–1.53)1.12
(0.61–2.07)1.75
(0.95–3.23)0.80
(0.53–1.21)1.75
(0.87–3.53)1.24
(0.72–2.13)0.81
(0.55–1.21)P for trend 0.896 0.289 0.009 0.862 0.056 0.055 0.235 1-OHPyr Q1 (≤ 44.37) Reference Reference Reference Reference Reference Reference Reference Q2 (44.38–77.79) 0.70
(0.41–1.20)0.48
(0.26–0.89)1.11
(0.59–2.07)0.78
(0.54–1.15)1.00
(0.52–1.96)1.10
(0.63–1.94)0.95
(0.66–1.36)Q3 (77.80–157.95) 0.69
(0.39–1.21)0.59
(0.32–1.09)0.98
(0.50–1.91)0.61
(0.41–0.92)0.69
(0.32–1.48)0.91
(0.51–1.64)0.80
(0.55–1.16)Q4 (≥ 157.96) 0.88
(0.48–1.60)0.80
(0.42–1.53)2.52
(1.31–4.84)0.71
(0.46–1.10)1.40
(0.67–2.93)1.59
(0.89–2.84)0.74
(0.49–1.12)P for trend 0.906 0.837 0.001 0.323 0.238 0.050 0.160 9-OHFlu Q1 (≤ 180.80) Reference Reference Reference Reference Reference Reference Reference Q2 (180.81–295.92) 0.87
(0.51–1.46)0.96
(0.52–1.77)0.91
(0.48–1.73)0.80
(0.54–1.18)0.67
(0.35–1.29)0.84
(0.48–1.49)0.92
(0.64–1.33)Q3 (295.93–551.46) 0.57
(0.32–1.01)0.98
(0.52–1.83)1.48
(0.81–2.71)0.81
(0.55–1.20)0.38
(0.17–0.82)0.89
(0.51–1.58)0.92
(0.63–1.33)Q4 (≥ 551.47) 0.94
(0.51–1.73)1.48
(0.77–2.88)1.66
(0.84–3.26)0.74
(0.47–1.15)1.09
(0.53–2.22)1.30
(0.72–2.34)1.02
(0.67–1.55)P for trend 0.891 0.147 0.089 0.304 0.409 0.140 0.748 4-OHPhe Q1 (≤ 16.85) Reference Reference Reference Reference Reference Reference Reference Q2 (16.86–29.02) 0.93
(0.55–1.56)0.75
(0.39–1.42)0.93
(0.51–1.69)0.72
(0.49–1.05)0.70
(0.35–1.40)0.83
(0.48–1.43)0.71
(0.49–1.02)Q3 (29.03–49.82) 0.66
(0.37–1.16)0.96
(0.52–1.78)0.74
(0.39–1.39)0.60
(0.41–0.90)0.59
(0.29–1.23)0.62
(0.35–1.11)0.71
(0.49–1.02)Q4 (≥ 49.83) 0.91
(0.51–1.61)1.56
(0.84–2.91)1.36
(0.73–2.53)0.71
(0.47–1.08)1.15
(0.58–2.26)1.32
(0.77–2.26)0.94
(0.63–1.39)P for trend 0.802 0.038 0.209 0.295 0.355 0.066 0.647 Note. All models adjusted for age, race/ethnicity, sex, BMI, PIR, and serum cotinine level; Bold: Statistically significant (P < 0.05). Q1: Quartile 1; Q2: Quartile 2; Q3: Quartile 3; Q4: Quartile 4; OR: odds ratio; CI: confidence interval. aP values for the medians of each quartile of PAHs levels included in the logistic regression models. Table 2. Adjusted ORs (95% CIs) for the association between the quartiles of urinary PAHs and allergic outcomes in adults in NHANES 2005–2006 (n = 1,012)
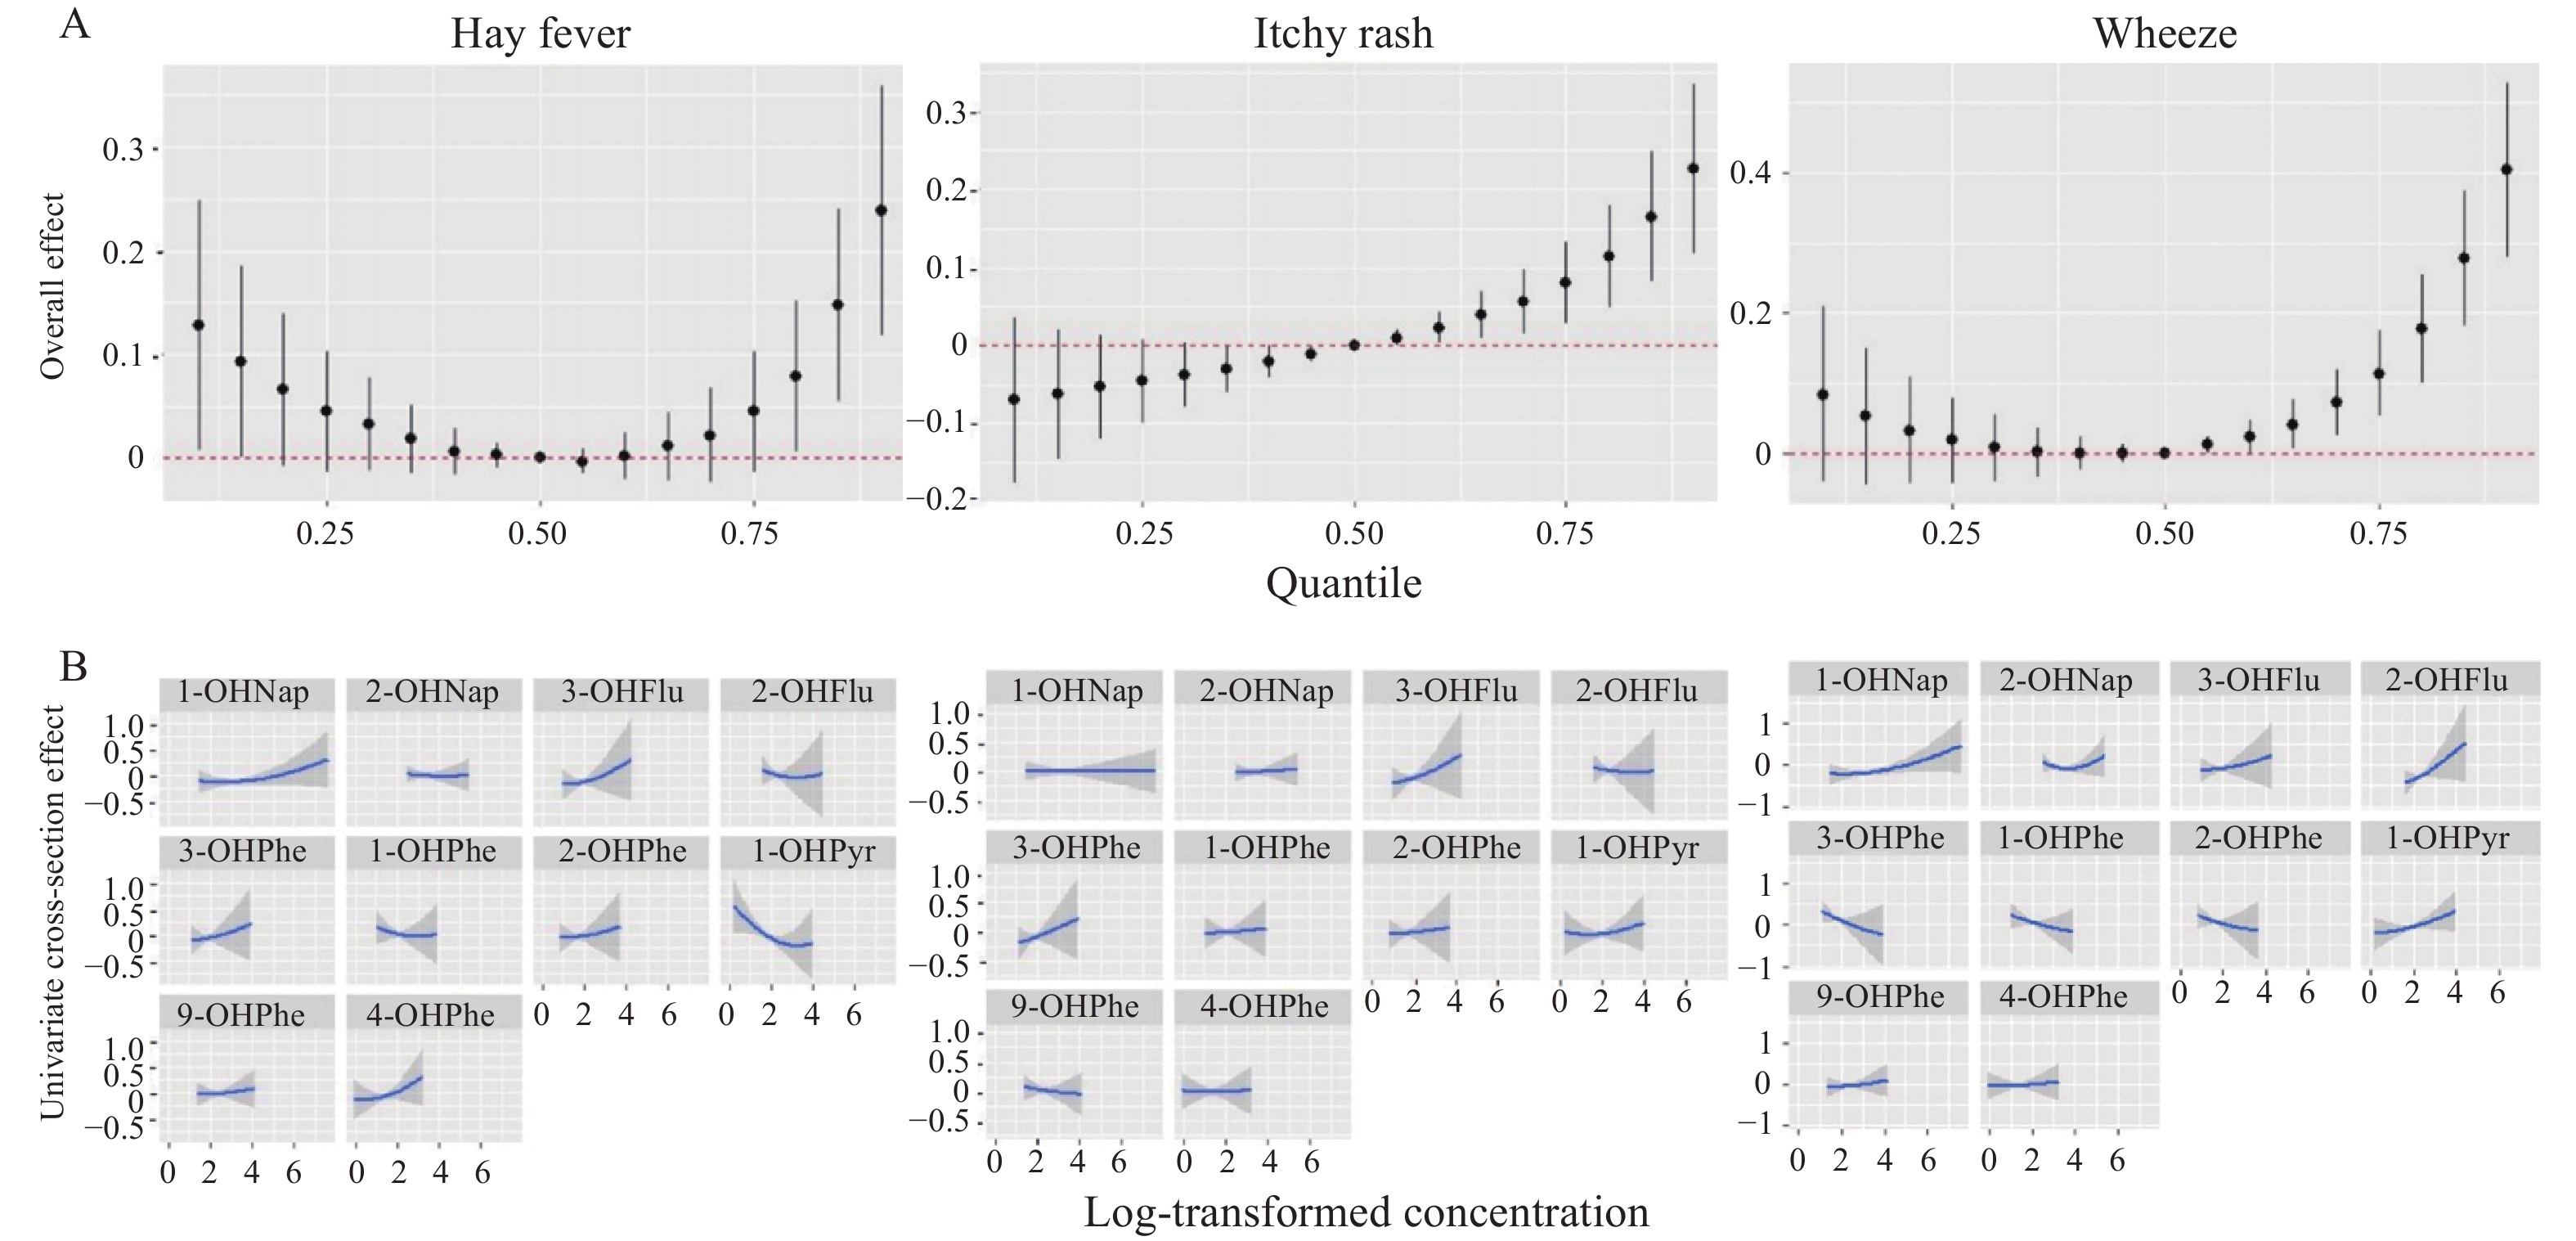
BKMR analyses further confirmed that the overall effect of the PAH mixtures was positively associated with the risk of hay fever, itchy rash, and wheezing. We observed that co-exposure to high concentrations of each PAH was associated with an increased risk of hay fever (mixtures above the 80th percentile), itchy rash (mixtures above the 60th percentile), and wheezing (mixtures above the 65th percentile) compared to the corresponding 50th percentile (Supplementary Figure S2A, available in www.besjournal.com). The trends of the univariate exposure-response functions for each PAH are presented in Supplementary Figure S2B. When all other PAH metabolites were fixed at their median concentrations, most were positively associated with hay fever, itchy rashes, and wheezing, which is similar to the results obtained in the logistic regression model.
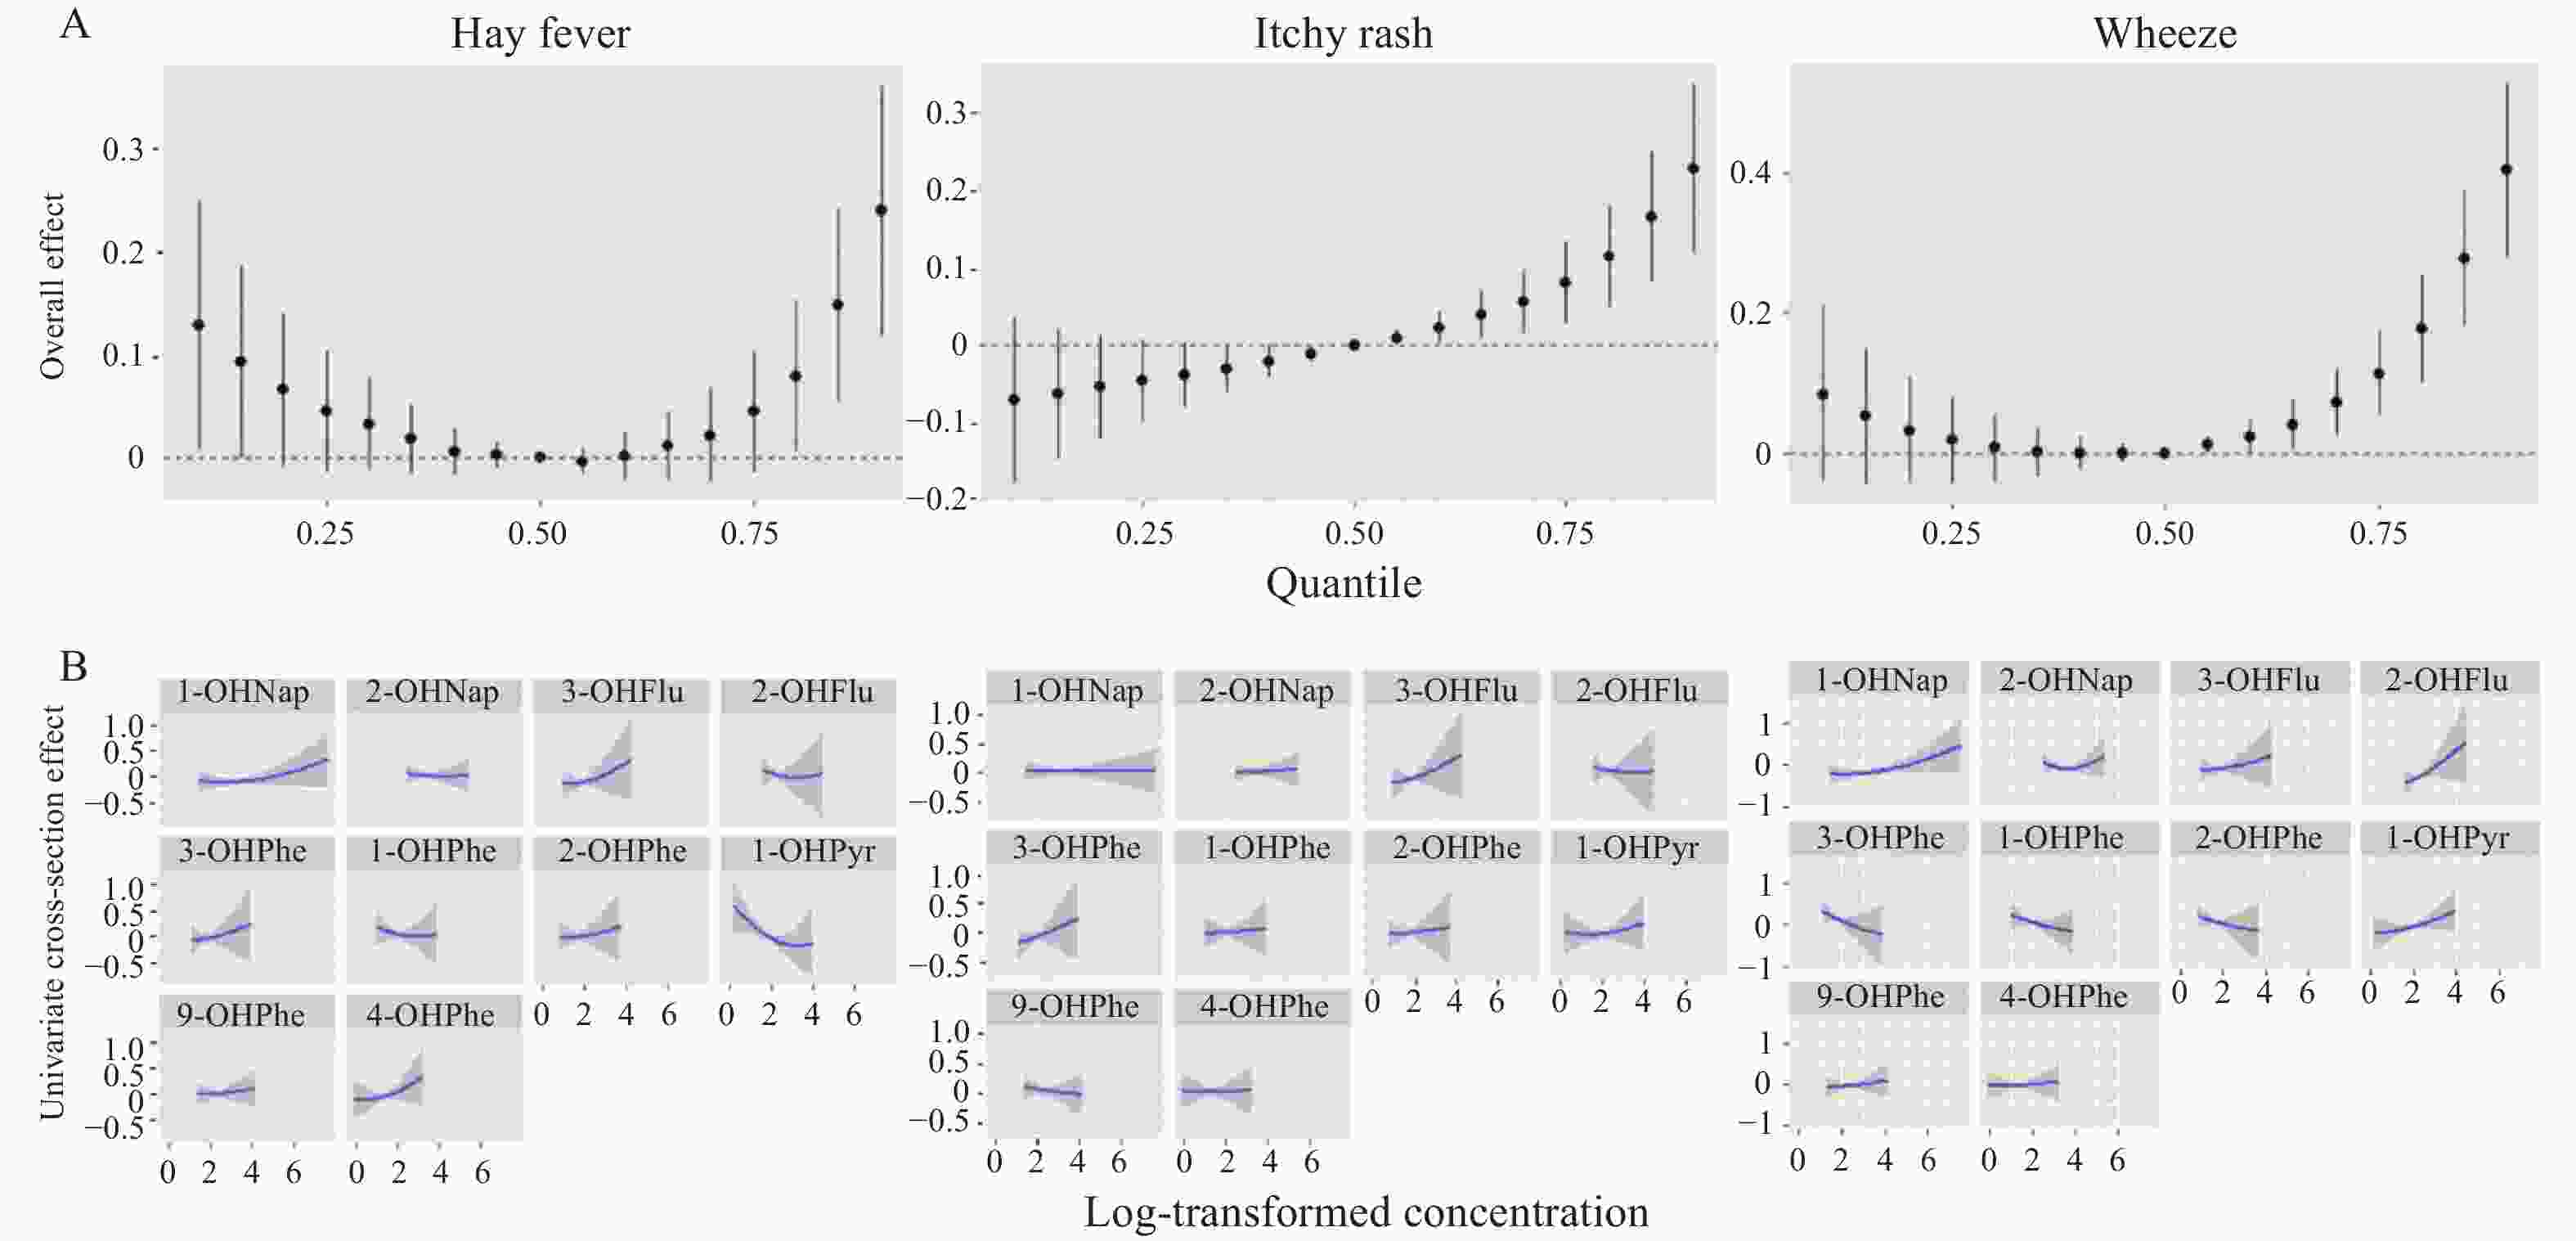
Figure S2. Overall effect of the urinary PAHs mixture on risks of allergic outcomes (A) and univariate exposure-response function between PAH metabolites and allergic outcomes (B) in the overall study population, estimated using BKMR models. Models were adjusted for age, race/ethnicity, sex, BMI, PIR, and serum cotinine level. The concentrations of urinary PAHs were log-transformed in the models.
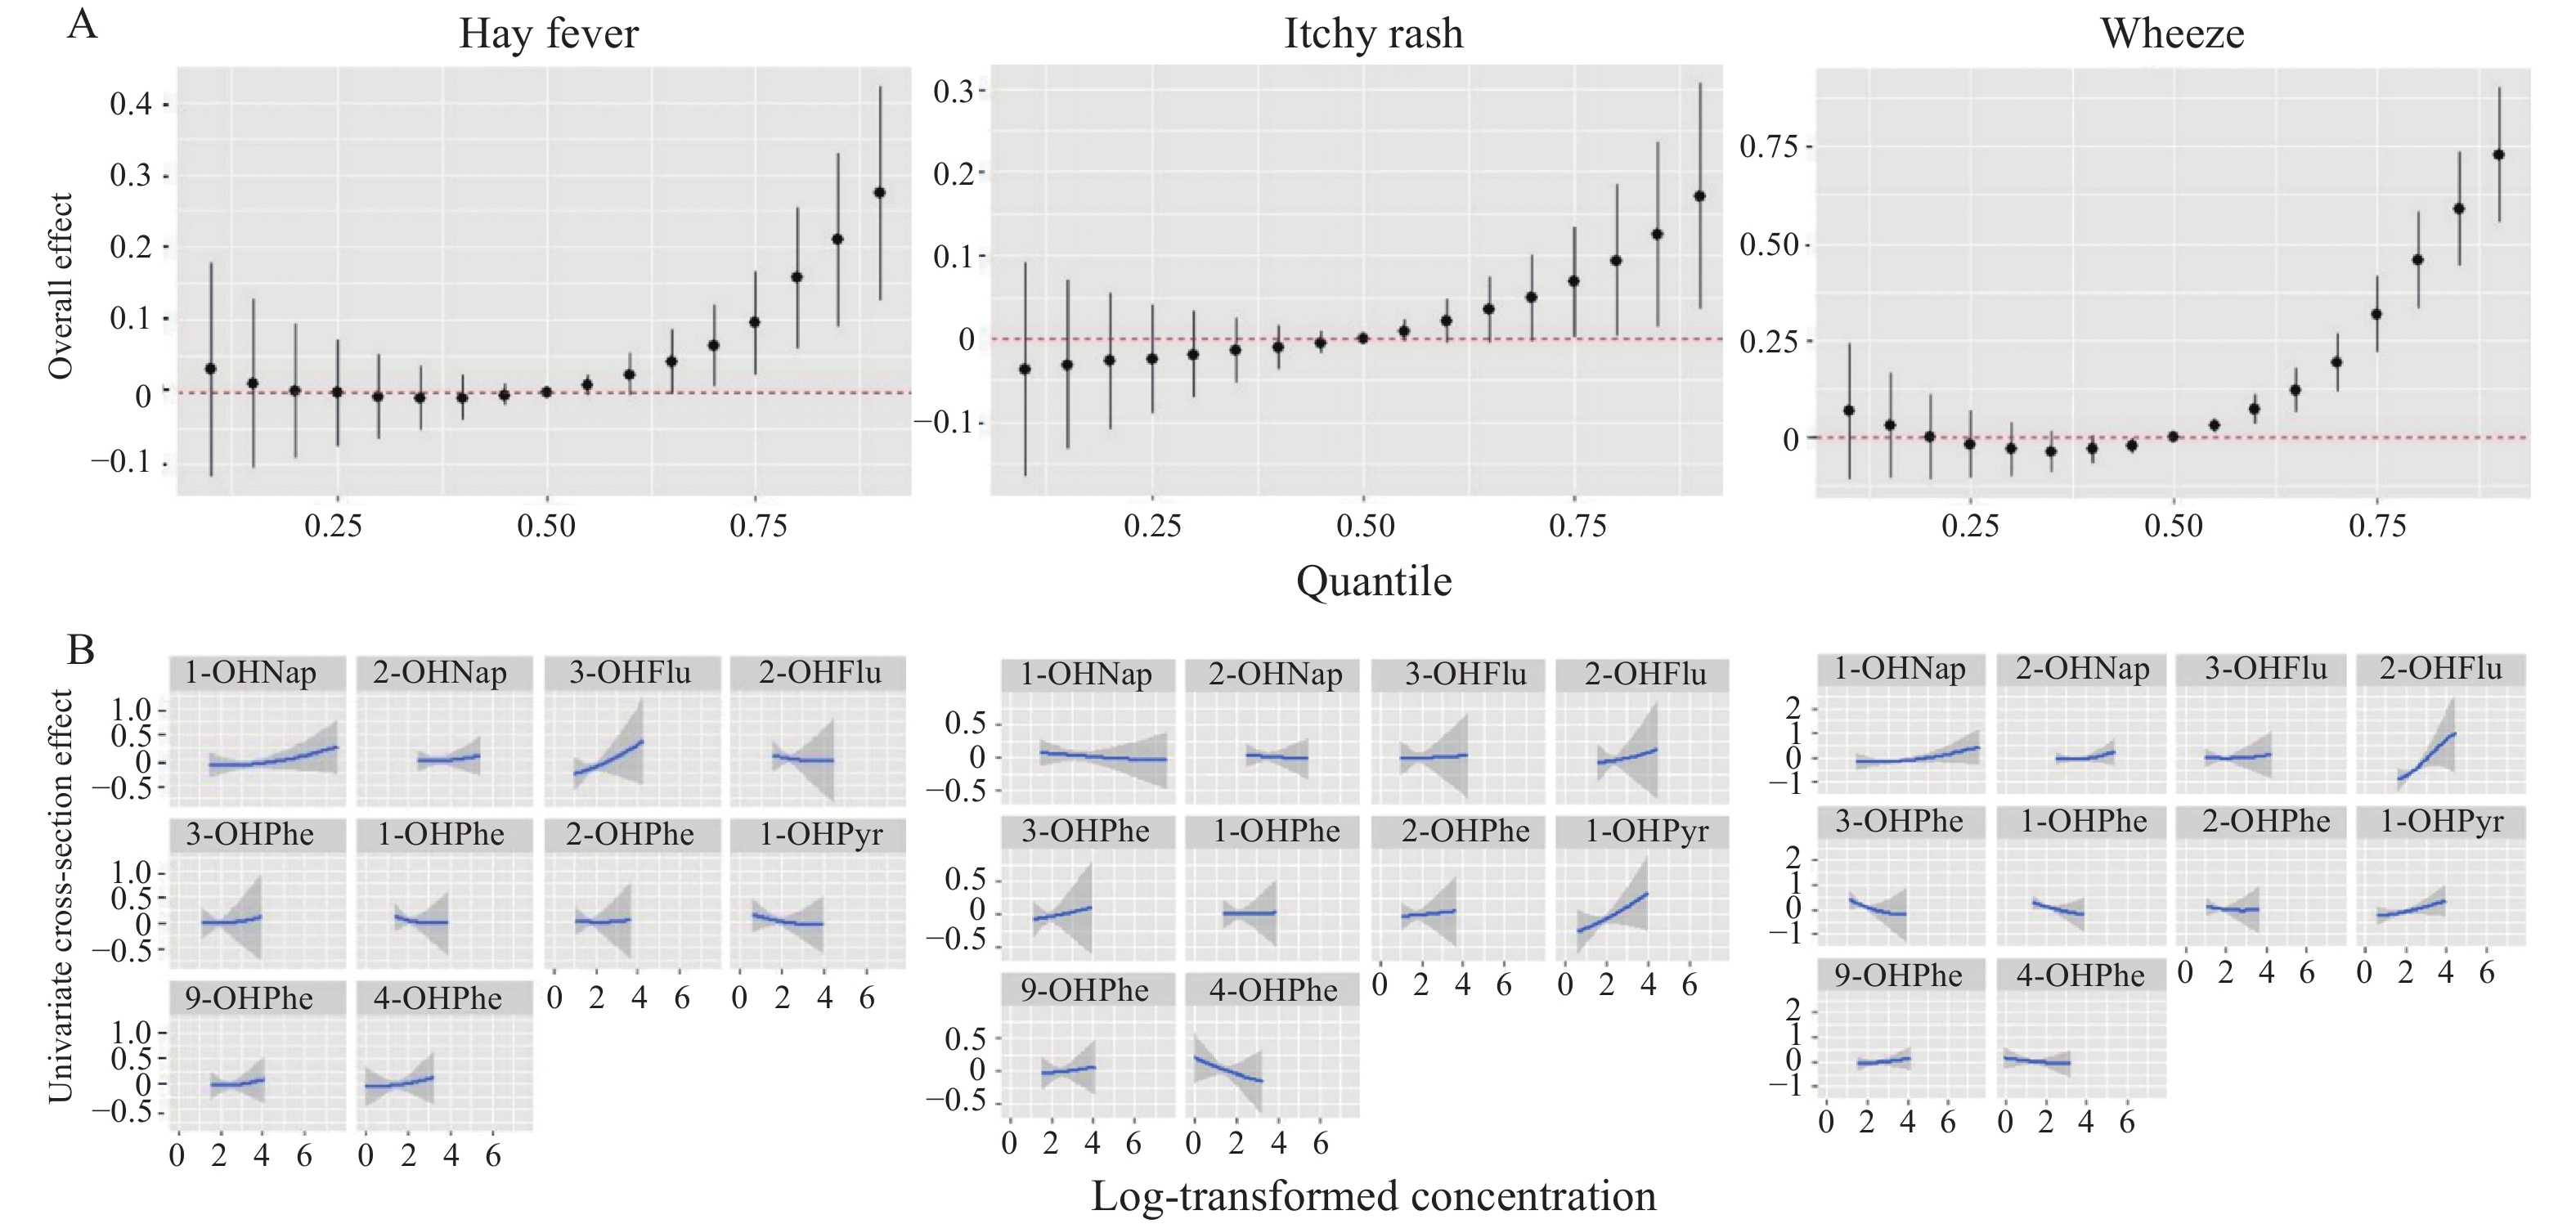
When stratified by age, the results showed that these associations were more pronounced in adults (Figure 1). The PIPs derived from the BKMR model for the overall study population and the adults are summarized in Supplementary Table S7 (available in www.besjournal.com). 1-OHNap and 2-OHFlu were considered the most important contributors to the positive associations with allergic outcomes.
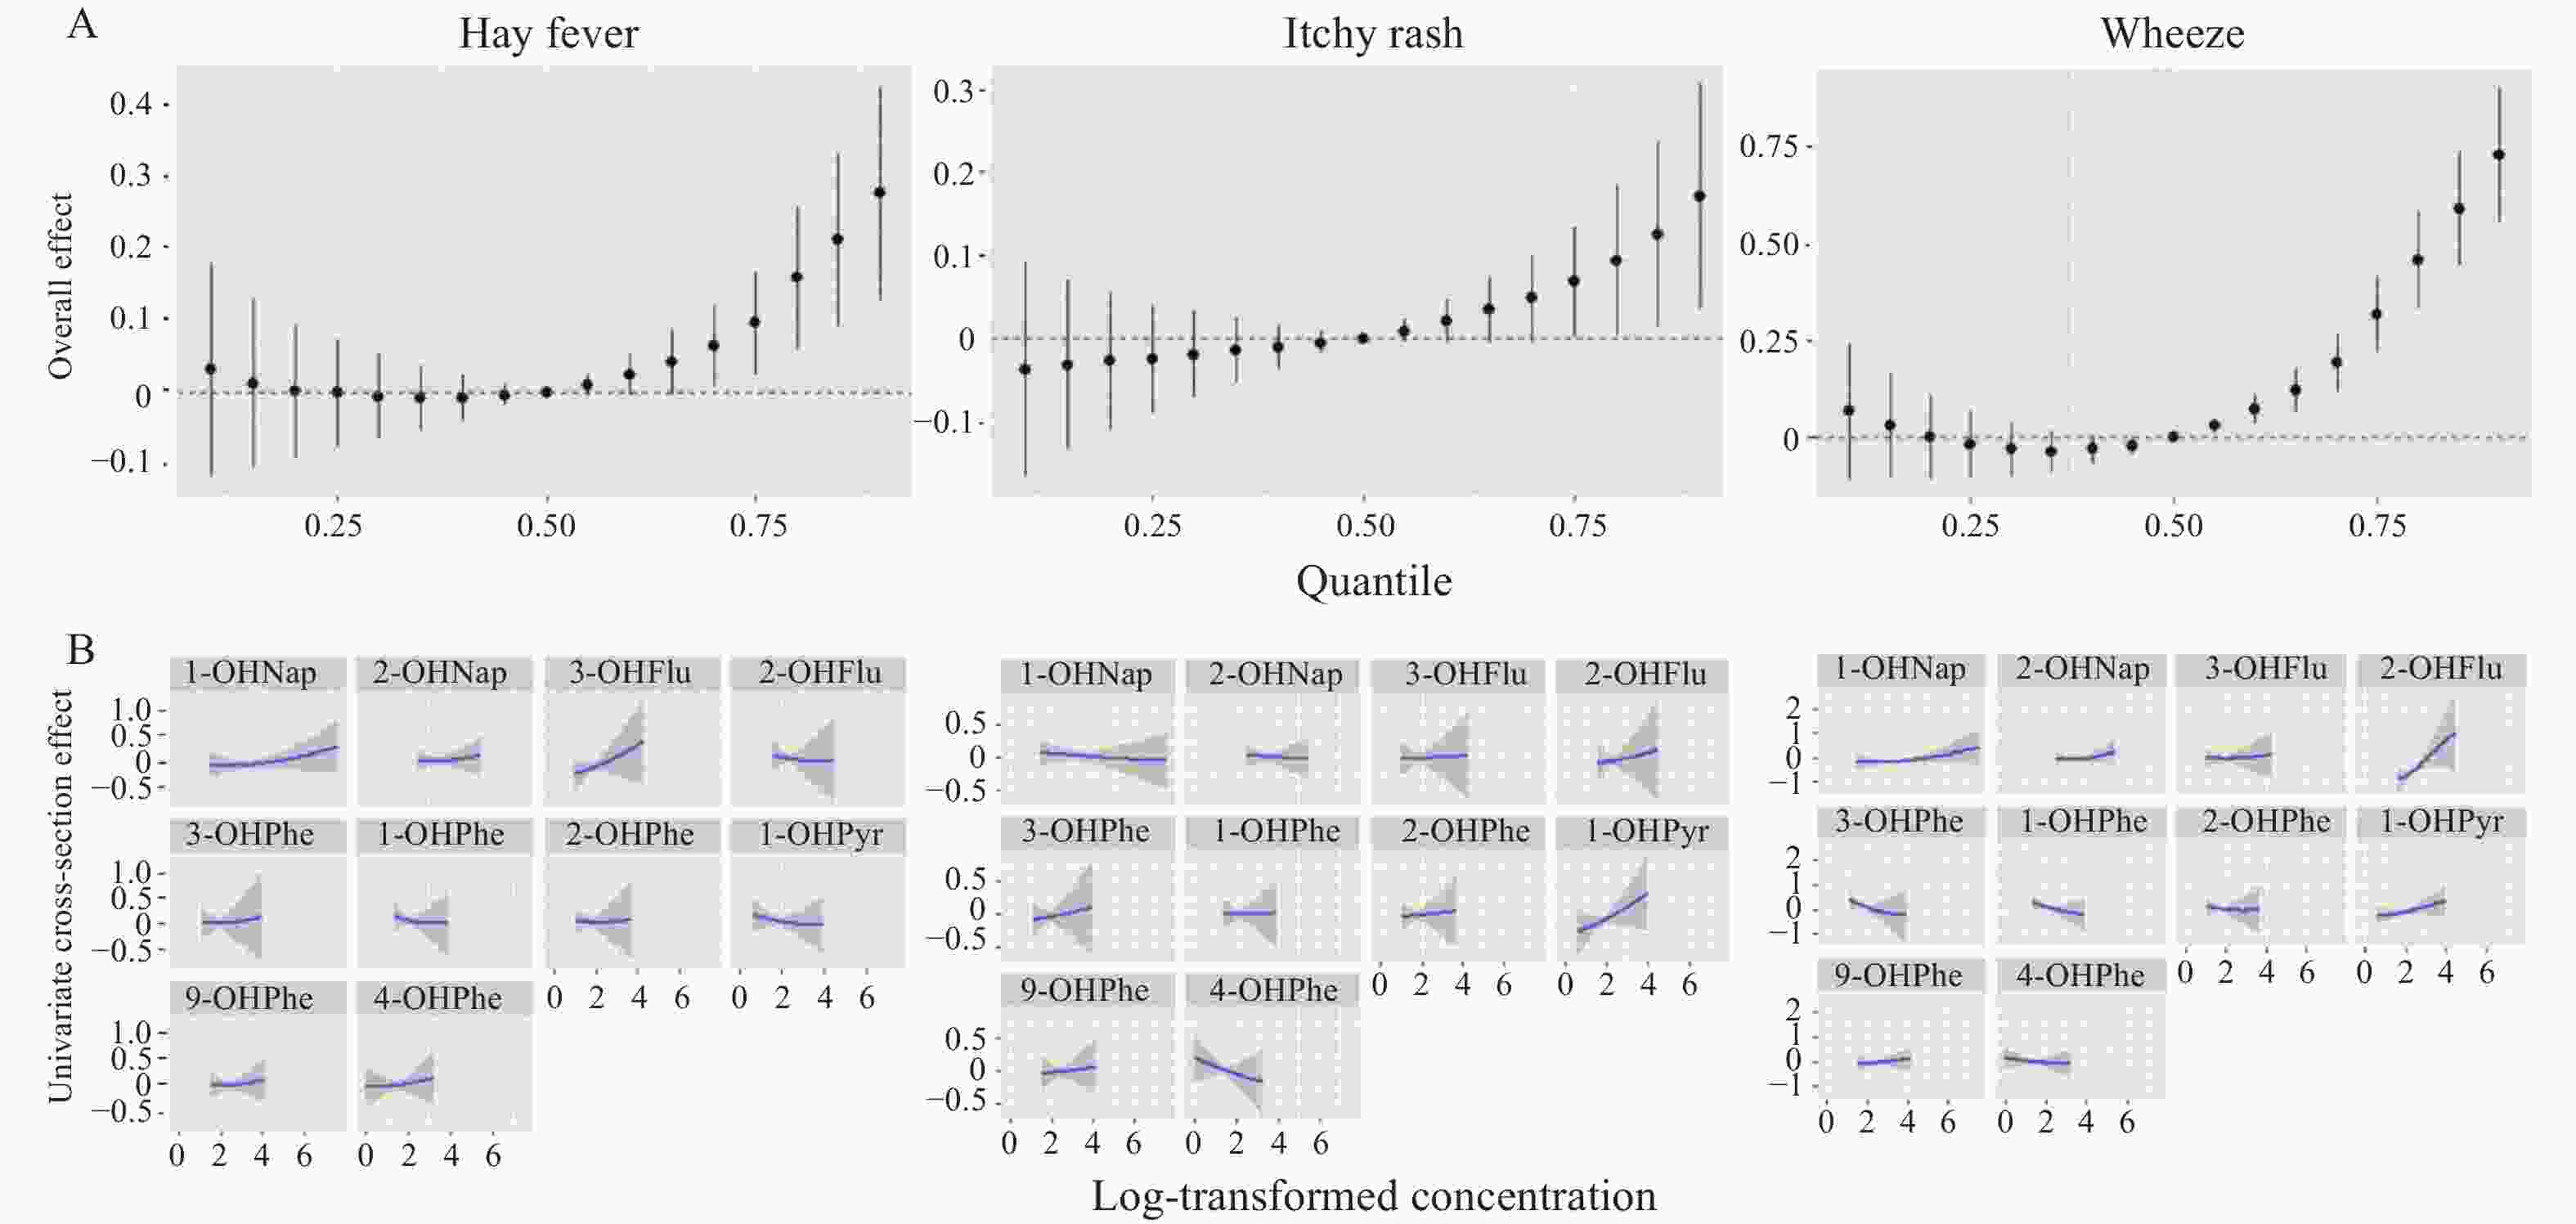
Figure 1. Overall effect of the urinary PAHs mixture on risks of allergic outcomes (A) and univariate exposure-response function between PAH metabolites and allergic outcomes (B) in adults by BKMR. Models were adjusted for age, race/ethnicity, sex, BMI, PIR, and serum cotinine level. The concentrations of urinary PAHs were log-transformed in the model.
This study investigated the individual and joint associations between PAHs and allergic outcomes in the general US population. We found that exposure to PAHs, both individually and in combination, was associated with an elevated risk of hay fever, itchy rashes, and wheezing, with these associations being particularly pronounced in adults. Among the various PAHs, 1-OHNap, and 2-OHFlu were the most important contributors to these associations.
To date, only a few studies have examined the association between PAHs and hay fever in humans. However, other studies have suggested that environmental chemicals, including pesticides, may serve as risk factors for the development or exacerbation of hay fever[5]. Our finding that PAH exposure increases the risk of itchy rashes is inconsistent with previous reports[6]. The inconsistencies among existing studies could be explained by differences in the demographic backgrounds of the research populations, sample sizes, exposure classifications, and correction methods for PAH concentrations. Conversely, the observation that PAH exposure increased the risk of wheezing is consistent with the findings of previous studies. For instance, an analysis of data from the NHANES dataset, covering 2001–2008 and 2011–2012, identified a positive correlation between 4-OHPhe exposure and wheezing in girls aged 13–19 years[7].
Several studies have suggested that PAH exposure is associated with asthma[8]. In contrast to previous findings, we found no association between PAHs and asthma. Explanations may include the possibility that PAHs may be more strongly associated with acute asthma exacerbations; however, our questionnaires (which assessed asthma) were not sufficiently sensitive to distinguish recent asthma. Previous studies have demonstrated that PAHs enhance B cell differentiation and induce allergic sensitization[9]. However, no association was found between PAHs and allergic sensitization in our study. This might be partly attributed to differences in divergent analytical methods (Poisson and logistic regression) and study designs (prospective and cross-sectional).
The effects of PAHs on allergic outcomes have mainly been studied in children. To date, few studies have revealed an association between PAH exposure and allergy-related outcomes in adults. Our study showed that adults were more likely to develop hay fever, itchy rashes, and wheezing owing to PAH exposure. This may be due to higher smoking and occupational exposure to PAHs in this age group or reduced resistance due to stressful lives, which makes them more susceptible to environmental pollution. However, there is no evidence of an association between PAH exposure and allergic outcomes in children aged 6–19 years. The lack of consistency with other studies[2] may be related to the age of the children included in our study. Previous studies have primarily focused on infants and young children, whereas we excluded children under six years of age because of a lack of PAH data. Another possible explanation is that our study included a large, representative sample of children in the US, whereas previous studies used smaller and more demographically similar groups.
Notably, 1-OHNap, and 2-OHFlu were the most important contributors to the positive associations with hay fever, itchy rash, and wheezing. The chemical properties of these substances, combined with widespread exposure in daily life, may explain this phenomenon. 1-OHNap and 2-OHFlu are metabolites of naphthalene and fluorene, respectively, and are classified as prioritized pollutants based on their high concentration, high exposure, recalcitrant nature, and toxicity[1]. In addition, compelling evidence has documented the deleterious effects of naphthalene and fluorene on allergic diseases, which supports our results[10].
The strengths and limitations of this study should be considered when interpreting the findings. To the best of our knowledge, this is the first study to investigate the individual and joint associations of PAHs with various allergic outcomes. We used to estimate the joint effects of the PAH metabolites on these outcomes. Furthermore, the use of the NHANES data renders our findings generalizable and reliable. However, this study had several limitations. First, the causal relationship between PAHs and allergic outcomes could not be determined. Second, the concentrations of PAH metabolites detected in the urine represent only a single point in time and may not accurately reflect long-term exposure levels. Finally, despite controlling for covariates, there may still be some unmeasured or unknown confounders that have not been considered, such as co-exposure to air pollutants or other chemicals.
In summary, exposure to PAHs, both individually and in combination, was associated with an elevated risk of hay fever, itchy rashes, and wheezing in the general US population, with stronger associations observed in adults. 1-OHNap and 2-OHFlu were the most significant contributors to these associations. This research benefits human society by providing critical evidence linking PAH exposure to common health issues, such as hay fever, itchy rash, and wheezing, thereby informing public health policies and interventions aimed at reducing these risks. Considering the limitations of this study, further prospective studies are required to confirm our findings.
-
PAHs Asthma Hay fever Itchy rash Sneeze Eczema Wheeze Allergic sensitization 1-OHNap 0.99 (0.79–1.25) 1.32 (1.02–1.72) * 1.13 (0.87–1.46) 1.08 (0.91–1.28) 1.03 (0.78–1.37) 1.32 (1.06–1.64) * 0.95 (0.81–1.11) 2-OHNap 1.01 (0.69–1.50) 1.47 (0.90–2.40) 1.40 (0.87–2.24) 0.90 (0.67–1.20) 1.35 (0.83–2.21) 1.41 (0.96–2.09) 0.90 (0.69–1.18) 3-OHFlu 0.98 (0.67–1.42) 1.75 (1.09–2.82) * 2.05 (1.30–3.23)** 1.11 (0.84–1.47) 1.09 (0.67–1.77) 1.47 (1.03–2.12) * 0.91 (0.70–1.19) 2-OHFlu 0.86 (0.55–1.32) 1.64 (0.96–2.80) 1.99 (1.20–3.32)** 1.16 (0.84–1.60) 1.14 (0.66–1.98) 1.60 (1.06–2.41) * 0.88 (0.65–1.18) 3-OHPhe 0.81 (0.51–1.29) 1.68 (0.97–2.89) 2.14 (1.28–3.58)** 1.00 (0.71–1.42) 1.46 (0.84–2.52) 1.07 (0.68–1.69) 0.94 (0.68–1.29) 1-OHPhe 0.79 (0.49–1.27) 1.22 (0.68–2.20) 1.87 (1.09–3.20) * 0.88 (0.62–1.26) 1.41 (0.80–2.50) 0.99 (0.61–1.61) 0.95 (0.69–1.32) 2-OHPhe 0.71 (0.43–1.16) 1.54 (0.88–2.71) 1.88 (1.10–3.20) * 0.98 (0.69–1.39) 1.46 (0.83–2.57) 1.03 (0.64–1.66) 0.97 (0.70–1.34) 1-OHPyr 0.91 (0.62–1.34) 1.06 (0.65–1.73) 1.79 (1.15–2.80) * 0.83 (0.62–1.11) 1.43 (0.90–2.28) 1.33 (0.91–1.94) 1.02 (0.78–1.32) 9-OHFlu 0.68 (0.43–1.07) 1.63 (0.96–2.76) 1.44 (0.86–2.42) 1.05 (0.76–1.46) 0.87 (0.50–1.52) 1.18 (0.76–1.84) 1.05 (0.78–1.43) 4-OHPhe 0.92 (0.60–1.43) 1.65 (0.96–2.82) 1.61 (0.96–2.72) 0.84 (0.61–1.16) 1.12 (0.65–1.93) 1.18 (0.76–1.84) 0.97 (0.72–1.31) Note. All models adjusted for age, race/ethnicity, sex, BMI, PIR, and serum cotinine level; *P < 0.05;**P < 0.01.
Urine PAHs concentrations were adjusted for creatinine then log10-transformed.Table S4. Adjusted ORs (95% CIs) for the association between urinary PAHs and allergic outcomes in the overall study population in NHANES 2005–2006 (n = 1,672)
PAHs Asthma Hay fever Itchy rash Sneeze Eczema Wheeze Allergic sensitization 1-OHNap 0.88 (0.65–1.18) 1.29 (0.97–1.73) 0.98 (0.71–1.35) 0.94 (0.76–1.15) 0.99 (0.70–1.41) 1.35 (1.04–1.74) * 1.01 (0.83–1.23) 2-OHNap 1.24 (0.74–2.08) 1.64 (0.94–2.84) 1.14 (0.64–2.01) 0.90 (0.62–1.30) 1.33 (0.70–2.51) 1.77 (1.09–2.87) * 0.97 (0.68–1.37) 3-OHFlu 1.02 (0.61–1.71) 1.96 (1.14–3.36) * 1.83 (1.06–3.16) * 1.16 (0.81–1.66) 1.10 (0.59–2.06) 1.71 (1.08–2.70) * 0.90 (0.64–1.26) 2-OHFlu 0.96 (0.54–1.73) 1.72 (0.94–3.13) 1.98 (1.09–3.58) * 1.22 (0.82–1.82) 1.16 (0.58–2.32) 2.03 (1.23–3.36)** 0.84 (0.57–1.22) 3-OHPhe 0.86 (0.46–1.61) 1.63 (0.87–3.03) 1.90 (1.03–3.48) * 1.04 (0.68–1.60) 1.25 (0.61–2.55) 1.21 (0.70–2.10) 0.80 (0.53–1.21) 1-OHPhe 0.72 (0.38–1.38) 1.21 (0.62–2.38) 1.67 (0.88–3.18) 0.83 (0.53–1.30) 1.15 (0.54–2.43) 1.07 (0.60–1.94) 0.87 (0.57–1.33) 2-OHPhe 0.83 (0.44–1.56) 1.41 (0.74–2.66) 1.75 (0.95–3.24) 0.93 (0.60–1.43) 1.44 (0.71–2.89) 1.23 (0.70–2.15) 0.84 (0.56–1.27) 1-OHPyr 0.94 (0.56–1.59) 1.23 (0.70–2.15) 2.02 (1.19–3.42)** 0.88 (0.61–1.27) 1.52 (0.83–2.80) 1.55 (0.97–2.49) 0.80 (0.56–1.13) 9-OHFlu 0.80 (0.43–1.46) 1.60 (0.86–2.96) 1.53 (0.83–2.81) 0.86 (0.57–1.30) 0.89 (0.43–1.83) 1.28 (0.75–2.19) 1.08 (0.73–1.60) 4-OHPhe 0.89 (0.50–1.58) 1.47 (0.79–2.72) 1.16 (0.62–2.16) 0.72 (0.48–1.09) 0.90 (0.45–1.81) 1.15 (0.67–1.95) 0.80 (0.55–1.18) Note. All models adjusted for age, race/ethnicity, sex, BMI, PIR, and serum cotinine level; *P < 0.05;**P < 0.01. Urine PAHs concentrations were adjusted for creatinine then log10-transformed. Table S5. Adjusted ORs (95% CIs) for the association between urinary PAHs and allergic outcomes in adults in NHANES 2005–2006 (n = 1,012)
PAHs Asthma Hay fever Itchy rash Sneeze Eczema Wheeze Allergic sensitization 1-OHNap Q1 (≤ 579.12) Reference Reference Reference Reference Reference Reference Reference Q2 (579.13–1101.93) 0.82 (0.43–1.56) 1.06 (0.37–3.05) 1.23 (0.45–3.34) 0.76 (0.45–1.29) 1.28 (0.57–2.87) 1.37 (0.67–2.82) 1.10 (0.71–1.71) Q3 (1101.94–2870.60) 1.37 (0.76–2.48) 1.41 (0.50–4.02) 2.16 (0.87–5.36) 1.39 (0.84–2.30) 1.18 (0.52–2.68) 1.11 (0.53–2.33) 0.88 (0.56–1.38) Q4 (≥ 2870.61) 1.15 (0.62–2.13) 1.02 (0.32–3.26) 1.45 (0.54–3.90) 1.47 (0.88–2.45) 1.42 (0.63–3.23) 1.12 (0.53–2.37) 1.08 (0.68–1.71) P for trend a 0.573 0.921 0.710 0.051 0.491 0.923 0.758 2-OHNap Q1 (≤ 1605.16) Reference Reference Reference Reference Reference Reference Reference Q2 (1605.17–2560.92) 0.90 (0.49–1.65) 0.82 (0.32–2.15) 1.07 (0.38–2.98) 0.81 (0.50–1.34) 1.08 (0.50–2.33) 0.39 (0.18–0.83) 0.65 (0.42–1.03) Q3 (2560.93–4503.30) 0.80 (0.43–1.50) 0.30 (0.08–1.18) 2.32 (0.90–5.94) 0.72 (0.43–1.22) 1.04 (0.45–2.38) 0.66 (0.33–1.29) 0.68 (0.43–1.08) Q4 (≥ 4503.31) 1.04 (0.57–1.90) 0.80 (0.29–2.24) 2.05 (0.76–5.52) 0.90 (0.54–1.50) 1.40 (0.62–3.17) 0.51 (0.25–1.04) 0.71 (0.44–1.13) P for trend 0.723 0.788 0.142 0.970 0.396 0.271 0.426 3-OHFlu Q1 (≤ 49.23) Reference Reference Reference Reference Reference Reference Reference Q2 (49.24–77.73) 1.18 (0.65–2.17) 0.32 (0.11–0.94) 0.85 (0.34–2.15) 1.00 (0.61–1.65) 0.82 (0.36–1.84) 0.98 (0.48–2.03) 0.61 (0.39–0.96) Q3 (77.74–125.23) 1.04 (0.55–1.98) 0.20 (0.06–0.69) 1.48 (0.60–3.64) 0.90 (0.53–1.52) 1.01 (0.45–2.26) 1.19 (0.58–2.44) 0.76 (0.47–1.23) Q4 (≥ 125.24) 1.13 (0.59–2.17) 0.39 (0.13–1.15) 1.58 (0.60–4.14) 0.91 (0.53–1.57) 1.13 (0.49–2.59) 0.81 (0.37–1.78) 0.88 (0.54–1.43) P for trend 0.830 0.419 0.276 0.741 0.581 0.496 0.633 2-OHFlu Q1 (≤ 132.06) Reference Reference Reference Reference Reference Reference Reference Q2 (132.07–191.96) 0.72 (0.39–1.33) 0.30 (0.09–0.98) 0.45 (0.17–1.15) 0.70 (0.42–1.16) 0.58 (0.24–1.39) 0.87 (0.43–1.78) 0.94 (0.60–1.49) Q3 (191.97–289.03) 1.09 (0.59–1.98) 0.47 (0.16–1.33) 0.93 (0.39–2.20) 0.89 (0.53–1.49) 1.82 (0.86–3.85) 1.06 (0.52–2.17) 1.24 (0.77–1.99) Q4 (≥ 289.04) 0.70 (0.36–1.34) 0.49 (0.17–1.44) 0.88 (0.35–2.23) 0.79 (0.46–1.34) 0.73 (0.30–1.77) 0.60 (0.27–1.33) 0.95 (0.59–1.53) P for trend 0.384 0.518 0.840 0.660 0.649 0.189 0.795 3-OHPhe Q1 (≤ 52.93) Reference Reference Reference Reference Reference Reference Reference Q2 (52.94–80.98) 0.79 (0.43–1.45) 0.71 (0.24–2.11) 1.34 (0.52–3.49) 0.79 (0.48–1.30) 0.71 (0.31–1.65) 0.81 (0.40–1.64) 0.88 (0.55–1.39) Q3 (80.99–117.35) 0.86 (0.46–1.61) 0.38 (0.10–1.40) 1.78 (0.67–4.71) 0.64 (0.37–1.09) 1.05 (0.47–2.35) 1.01 (0.50–2.04) 1.02 (0.64–1.64) Q4 (≥ 117.36) 0.89 (0.47–1.66) 1.15 (0.40–3.30) 2.35 (0.87–6.36) 0.92 (0.54–1.55) 1.08 (0.47–2.52) 0.55 (0.25–1.21) 1.31 (0.81–2.13) P for trend 0.902 0.449 0.085 0.972 0.559 0.149 0.128 1- OHPhe Q1 (≤ 67.61) Reference Reference Reference Reference Reference Reference Reference Q2 (67.62–106.82) 0.57 (0.30–1.09) 0.40 (0.12–1.39) 1.28 (0.53–3.13) 0.71 (0.43–1.18) 0.91 (0.41–2.06) 0.66 (0.31–1.39) 0.85 (0.54–1.34) Q3 (106.83–161.67) 1.18 (0.66–2.14) 0.80 (0.28–2.25) 1.12 (0.43–2.96) 0.72 (0.43–1.21) 1.12 (0.50–2.51) 1.17 (0.59–2.32) 1.00 (0.63–1.59) Q4 (≥ 161.68) 0.98 (0.52–1.82) 0.87 (0.31–2.47) 1.48 (0.57–3.84) 0.82 (0.49–1.38) 1.11 (0.48–2.57) 0.70 (0.32–1.50) 1.22 (0.76–1.97) P for trend 0.554 0.770 0.489 0.697 0.707 0.565 0.214 2-OHPhe Q1 (≤ 29.40) Reference Reference Reference Reference Reference Reference Reference Q2 (29.41–41.34) 1.13 (0.63–2.01) 0.46 (0.15–1.40) 1.19 (0.48–2.94) 0.74 (0.45–1.21) 1.28 (0.59–2.77) 1.56 (0.79–3.09) 0.94 (0.60–1.47) Q3 (41.35–61.12) 0.77 (0.41–1.44) 0.25 (0.07–0.98) 1.41 (0.56–3.54) 0.61 (0.36–1.03) 0.96 (0.42–2.20) 0.77 (0.35–1.67) 0.95 (0.60–1.49) Q4 (≥ 61.13) 0.97 (0.52–1.81) 1.06 (0.41–2.71) 1.52 (0.59–3.93) 0.89 (0.54–1.48) 1.17 (0.51–2.66) 0.93 (0.43–1.99) 1.18 (0.74–1.89) P for trend 0.804 0.399 0.396 0.968 0.852 0.456 0.359 1-OHPyr Q1 (≤ 53.32) Reference Reference Reference Reference Reference Reference Reference Q2 (53.33–88.74) 0.94 (0.51–1.74) 0.69 (0.25–1.94) 0.99 (0.40–2.44) 0.98 (0.59–1.61) 0.82 (0.38–1.79) 1.16 (0.56–2.43) 0.95 (0.60–1.50) Q3 (88.75–143.81) 1.05 (0.56–1.97) 0.43 (0.13–1.39) 1.20 (0.47–3.03) 0.99 (0.59–1.67) 0.72 (0.32–1.63) 1.42 (0.68–2.98) 1.05 (0.65–1.68) Q4 (≥ 143.82) 1.13 (0.60–2.13) 0.68 (0.23–1.97) 1.43 (0.54–3.79) 0.74 (0.43–1.27) 0.71 (0.30–1.65) 1.00 (0.45–2.19) 0.99 (0.61–1.60) P for trend 0.611 0.628 0.414 0.220 0.483 0.818 0.979 9-OHFlu Q1 (≤ 128.77) Reference Reference Reference Reference Reference Reference Reference Q2 (128.78–197.18) 0.75 (0.41–1.37) 0.73 (0.25–2.10) 1.71 (0.72–4.09) 0.85 (0.50–1.42) 1.13 (0.52–2.43) 0.73 (0.35–1.51) 0.92 (0.59–1.45) Q3 (197.19–323.24) 0.81 (0.44–1.50) 0.37 (0.11–1.33) 1.37 (0.52–3.59) 0.89 (0.52–1.51) 0.88 (0.39–1.99) 0.95 (0.47–1.92) 0.91 (0.57–1.45) Q4 (≥ 323.25) 0.77 (0.41–1.45) 1.02 (0.37–2.81) 0.95 (0.32–2.77) 1.27 (0.76–2.15) 0.59 (0.24–1.48) 0.57 (0.26–1.25) 1.29 (0.80–2.08) P for trend 0.584 0.710 0.593 0.178 0.163 0.203 0.176 4-OHPhe Q1 (≤ 13.76) Reference Reference Reference Reference Reference Reference Reference Q2 (13.77–20.65) 0.69 (0.36–1.32) 0.27 (0.07–1.02) 0.52 (0.17–1.64) 0.53 (0.31–0.88) 0.60 (0.26–1.39) 1.14 (0.54–2.39) 0.79 (0.50–1.24) Q3 (20.66–33.65) 1.43 (0.79–2.59) 0.47 (0.15–1.45) 1.64 (0.65–4.14) 0.77 (0.47–1.26) 0.90 (0.41–1.97) 1.60 (0.78–3.27) 1.04 (0.66–1.63) Q4 (≥ 33.66) 1.25 (0.68–2.31) 1.14 (0.44–2.91) 2.07 (0.82–5.22) 0.77 (0.47–1.28) 0.89 (0.40–1.97) 0.94 (0.43–2.06) 1.10 (0.69–1.75) P for trend 0.201 0.223 0.026 0.868 0.854 0.736 0.377 Note. All models adjusted for age, race/ethnicity, sex, BMI, PIR, and serum cotinine level. Q1: Quartile 1; Q2: Quartile 2; Q3: Quartile 3; Q4: Quartile 4; OR: odds ratio; CI: confidence interval. a p values for the medians of each quartile of PAHs levels included in the logistic regression models. Table S6. Adjusted ORs (95% CIs) for the association between the quartiles of urinary PAHs and allergic outcomes in children in NHANES 2005–2006 (n = 660)
Population PAHs Hay fever Itchy rash Wheeze Overall 1-OHNap 0.3358 0.0970 0.6004 2-OHNap 0.3082 0.1904 0.6534 3-OHFlu 0.5262 0.4132 0.5642 2-OHFlu 0.5382 0.3378 0.7352 3-OHPhe 0.4832 0.3984 0.5972 1-OHPhe 0.4978 0.2178 0.5504 2-OHPhe 0.4350 0.2640 0.5614 1-OHPyr 0.6608 0.4000 0.4554 9-OHFlu 0.3580 0.1992 0.4092 4-OHPhe 0.5050 0.1948 0.4044 Adults 1-OHNap 0.3172 0.1390 0.5098 2-OHNap 0.3254 0.1416 0.5390 3-OHFlu 0.4852 0.2312 0.5262 2-OHFlu 0.4160 0.2824 0.8858 3-OHPhe 0.4412 0.2978 0.6590 1-OHPhe 0.4376 0.2726 0.6220 2-OHPhe 0.3934 0.2174 0.5770 1-OHPyr 0.3658 0.4414 0.5014 9-OHFlu 0.4158 0.2510 0.4380 4-OHPhe 0.3780 0.2674 0.4120 Note. Bold: Statistically significant in the logistic regression model. Table S7. Posterior inclusion probabilities (PIPs) for urinary PAHs metabolites with allergic outcomes in the overall study population (n = 1,672) and adults (n = 1,012)
HTML
 24144+.pdf
|

|

 Quick Links
 DownLoad: