


-
Hand, foot, and mouth disease (HFMD) is an infectious disease caused by enteroviruses, mostly coxsackie A16 (CAV16) and enterovirus 71 (EV71)[1], which inhabit the respiratory and digestive tracts and spread due to poor hand hygiene. In the past two decades, pediatric HFMD has become an important public health issue in East and Southeast Asia, particularly in regions such as China’s Beijing, Taiwan, and Shandong Province[1-4]. Children under 5 years of age are more likely to be affected, with poorer health outcomes than adolescents or adults[5]. Currently, there are no specific antiviral drugs or therapies for HFMD[6].
The incidence of HFMD varies seasonally across geographical areas[7-11]. Two peaks can be observed in tropical and subtropical areas, such as Singapore and Malaysia, and one peak can be observed in high-latitude regions, such as the US, Japan, and Finland[9,10,12-15].
The relationship between ambient temperature and the incidence of HFMD has been increasingly studied; however, varying conclusions have been reached, particularly in studies conducted in Guangdong, Wuhan, Shanghai, Chengdu, China, and Singapore[3,13,16-18]. For instance, a study in Singapore suggested a J-shaped relationship, where every 1 °C increase above 32 °C was associated with a 36% increased risk of HFMD[13], whereas a study in Chengdu showed an M-shaped relationship between temperature and the incidence of HFMD[16]. Such disparities may be partly attributed to the diversity of meteorological and socio-economic factors across different regions.
Regarding meteorological factors, most prior studies on the association between climate variables and HFMD transmission along the Yangtze River were based in a single site, and few studies have focused on the heterogeneity among different sites[16,19]. Moreover, some multi-location studies selected their sites based on administrative regions[20,21], which sometimes cannot accurately reflect the influence of a specific climate feature on the incidence of HFMD. To address this issue, 26 cities along the Yangtze River were selected to investigate the impact of environmental temperature on the spread of HFMD. This study aimed to obtain a comprehensive understanding of the relationship between climate variability and HFMD in this crucial region.
Regarding socio-economic factors, previous studies have directly included per capita GDP and population factors as covariates rather than key factors in their models. In this study, the impact of socioeconomic factors on HFMD in the Yangtze River region was evaluated using concentration and Theil indices, with per capita Gross Domestic Product (GDP) and population factors as key variables. The concentration index assessed whether the incidence of HFMD in each region is linked to economic factors; however, it only reflects overall health fairness and does not distinguish between regional and inter-regional differences in the incidence of the disease. This was complemented by the Theil index, which effectively captures both regional and inter-regional differences[22]. Further analysis of the correlation between these indicators and the incidence of HFMD can provide a basis for the formulation of targeted socio-economic policies and public health measures to reduce the risk of HFMD and improve health equity.
This study aimed to evaluate the impact of climate variables (temperature, relative humidity, precipitation, and air pressure), population (number of children), and economic factors (per capita GDP) on the incidence of HFMD in 26 cities along the Yangtze River from 2014 to 2016, to provide a reference for the development of public health prevention and control measures.
-
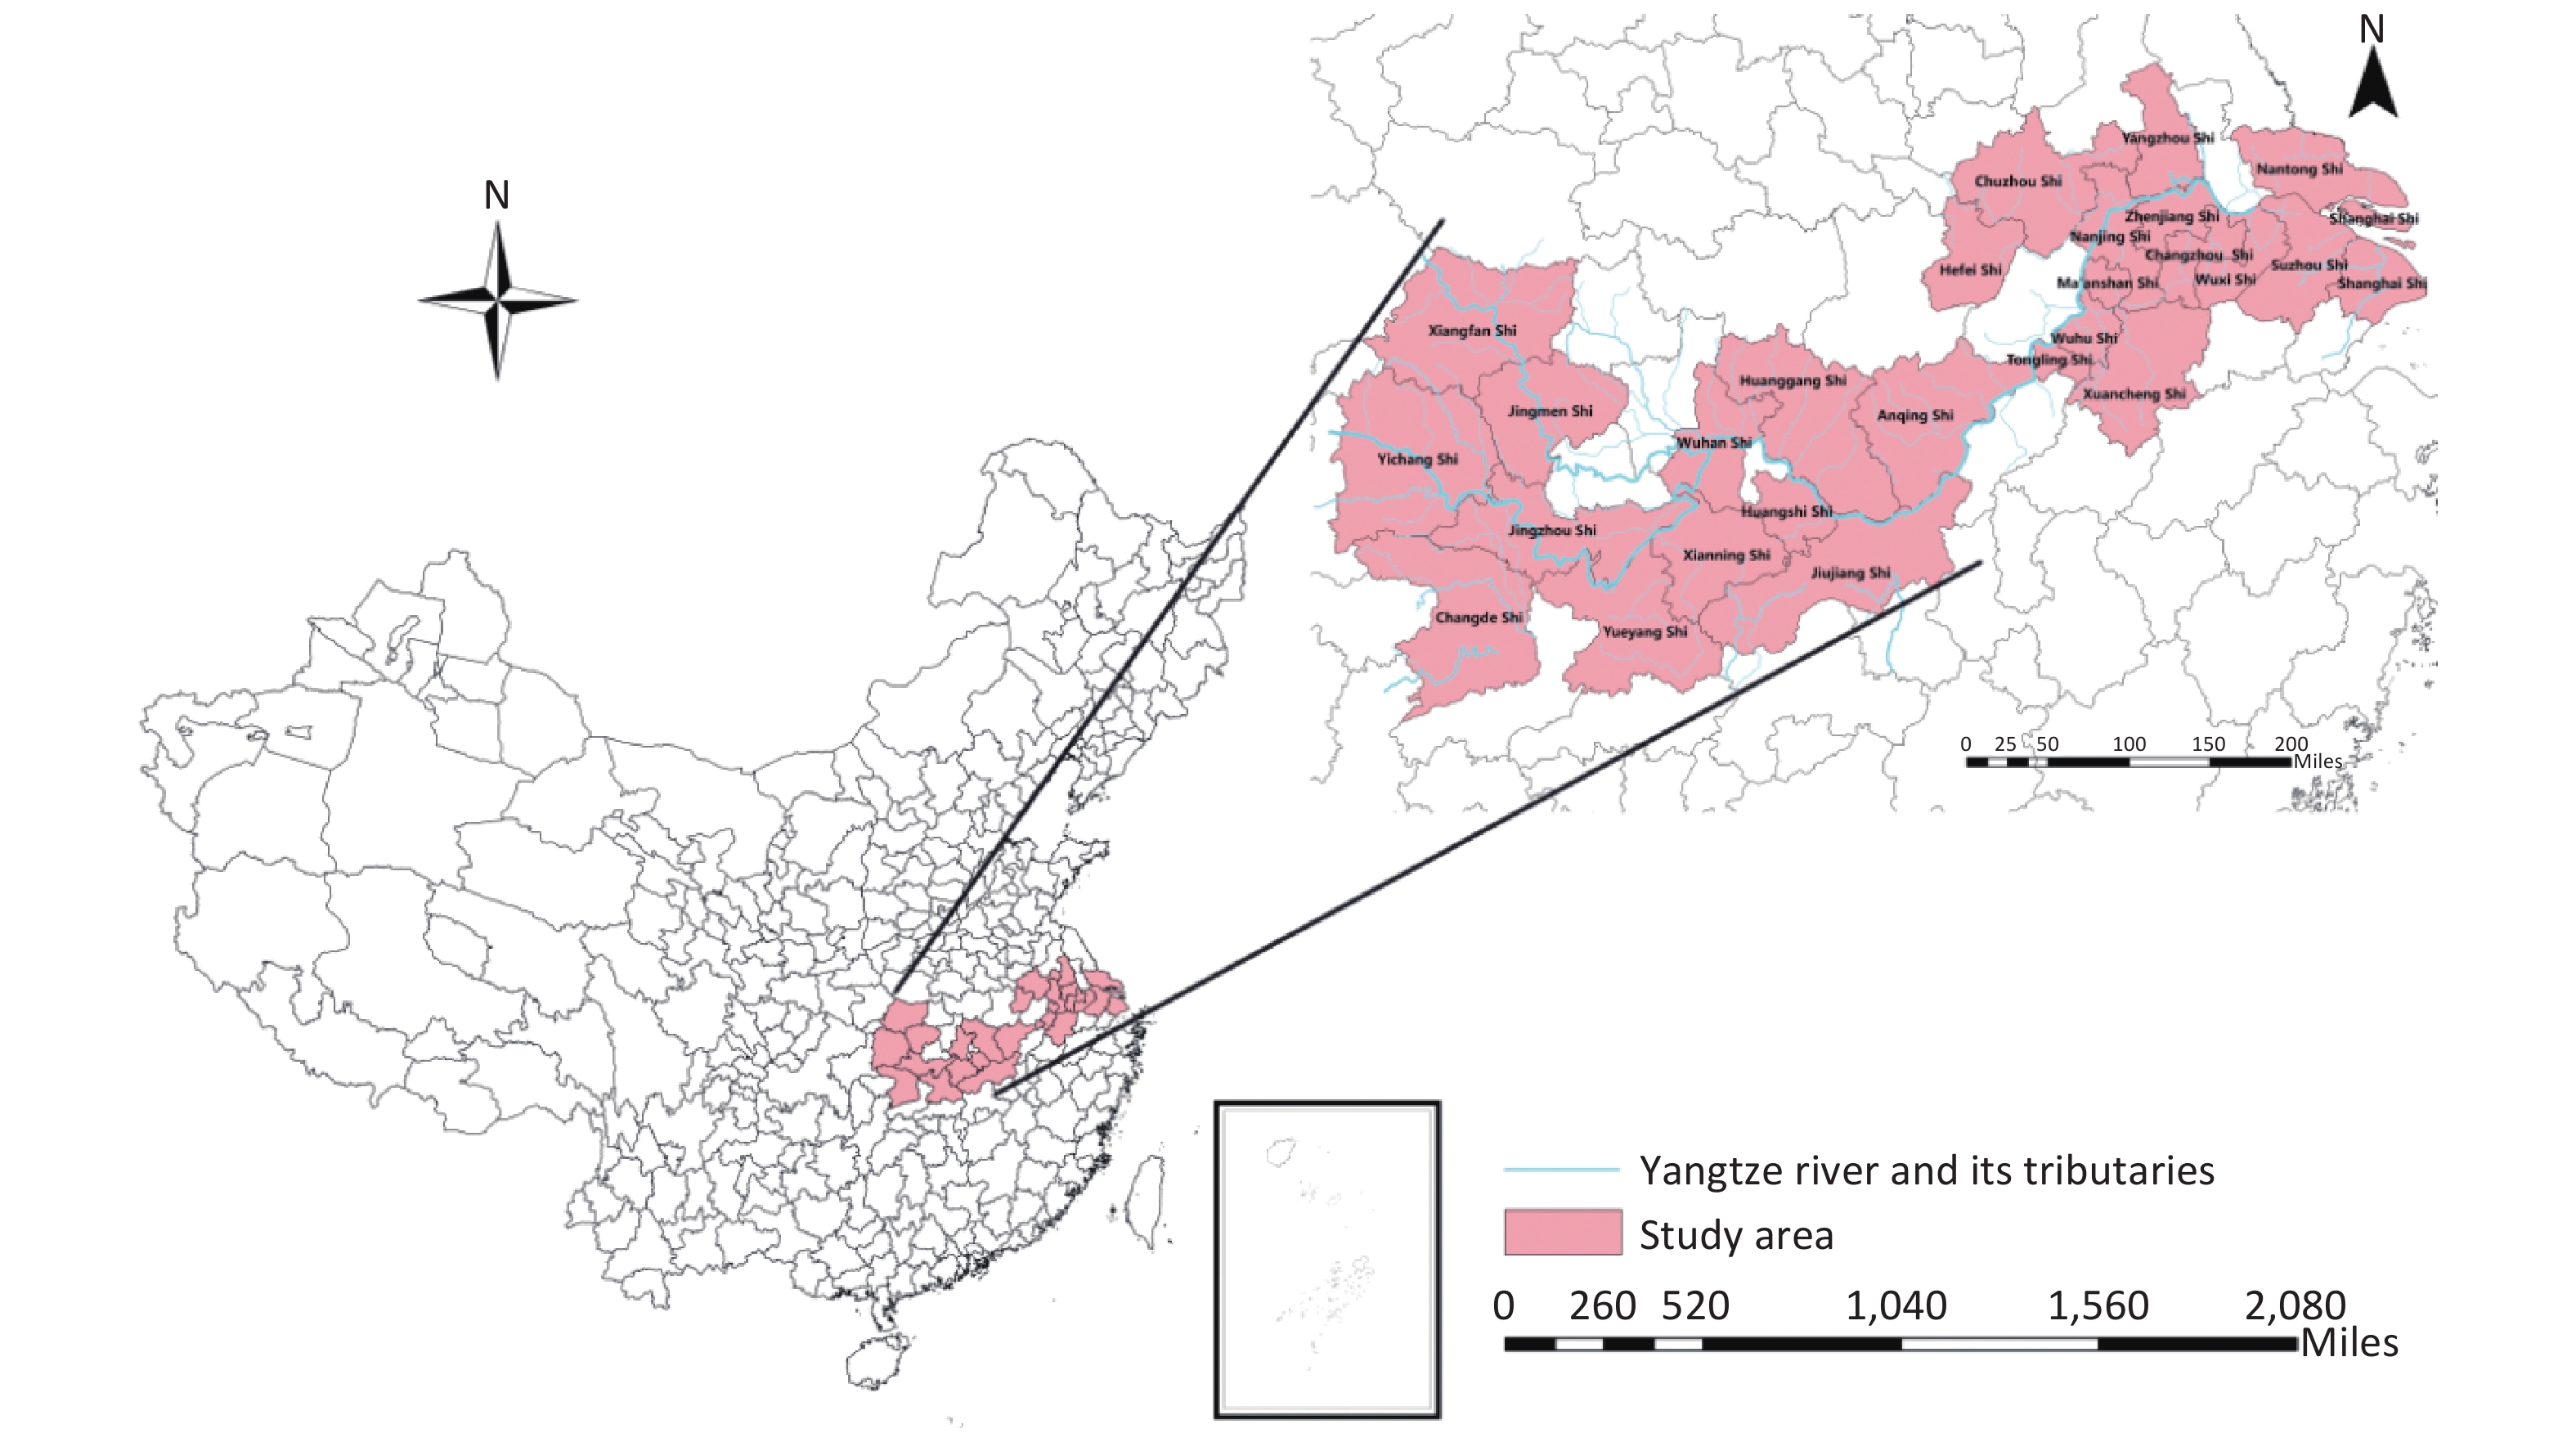
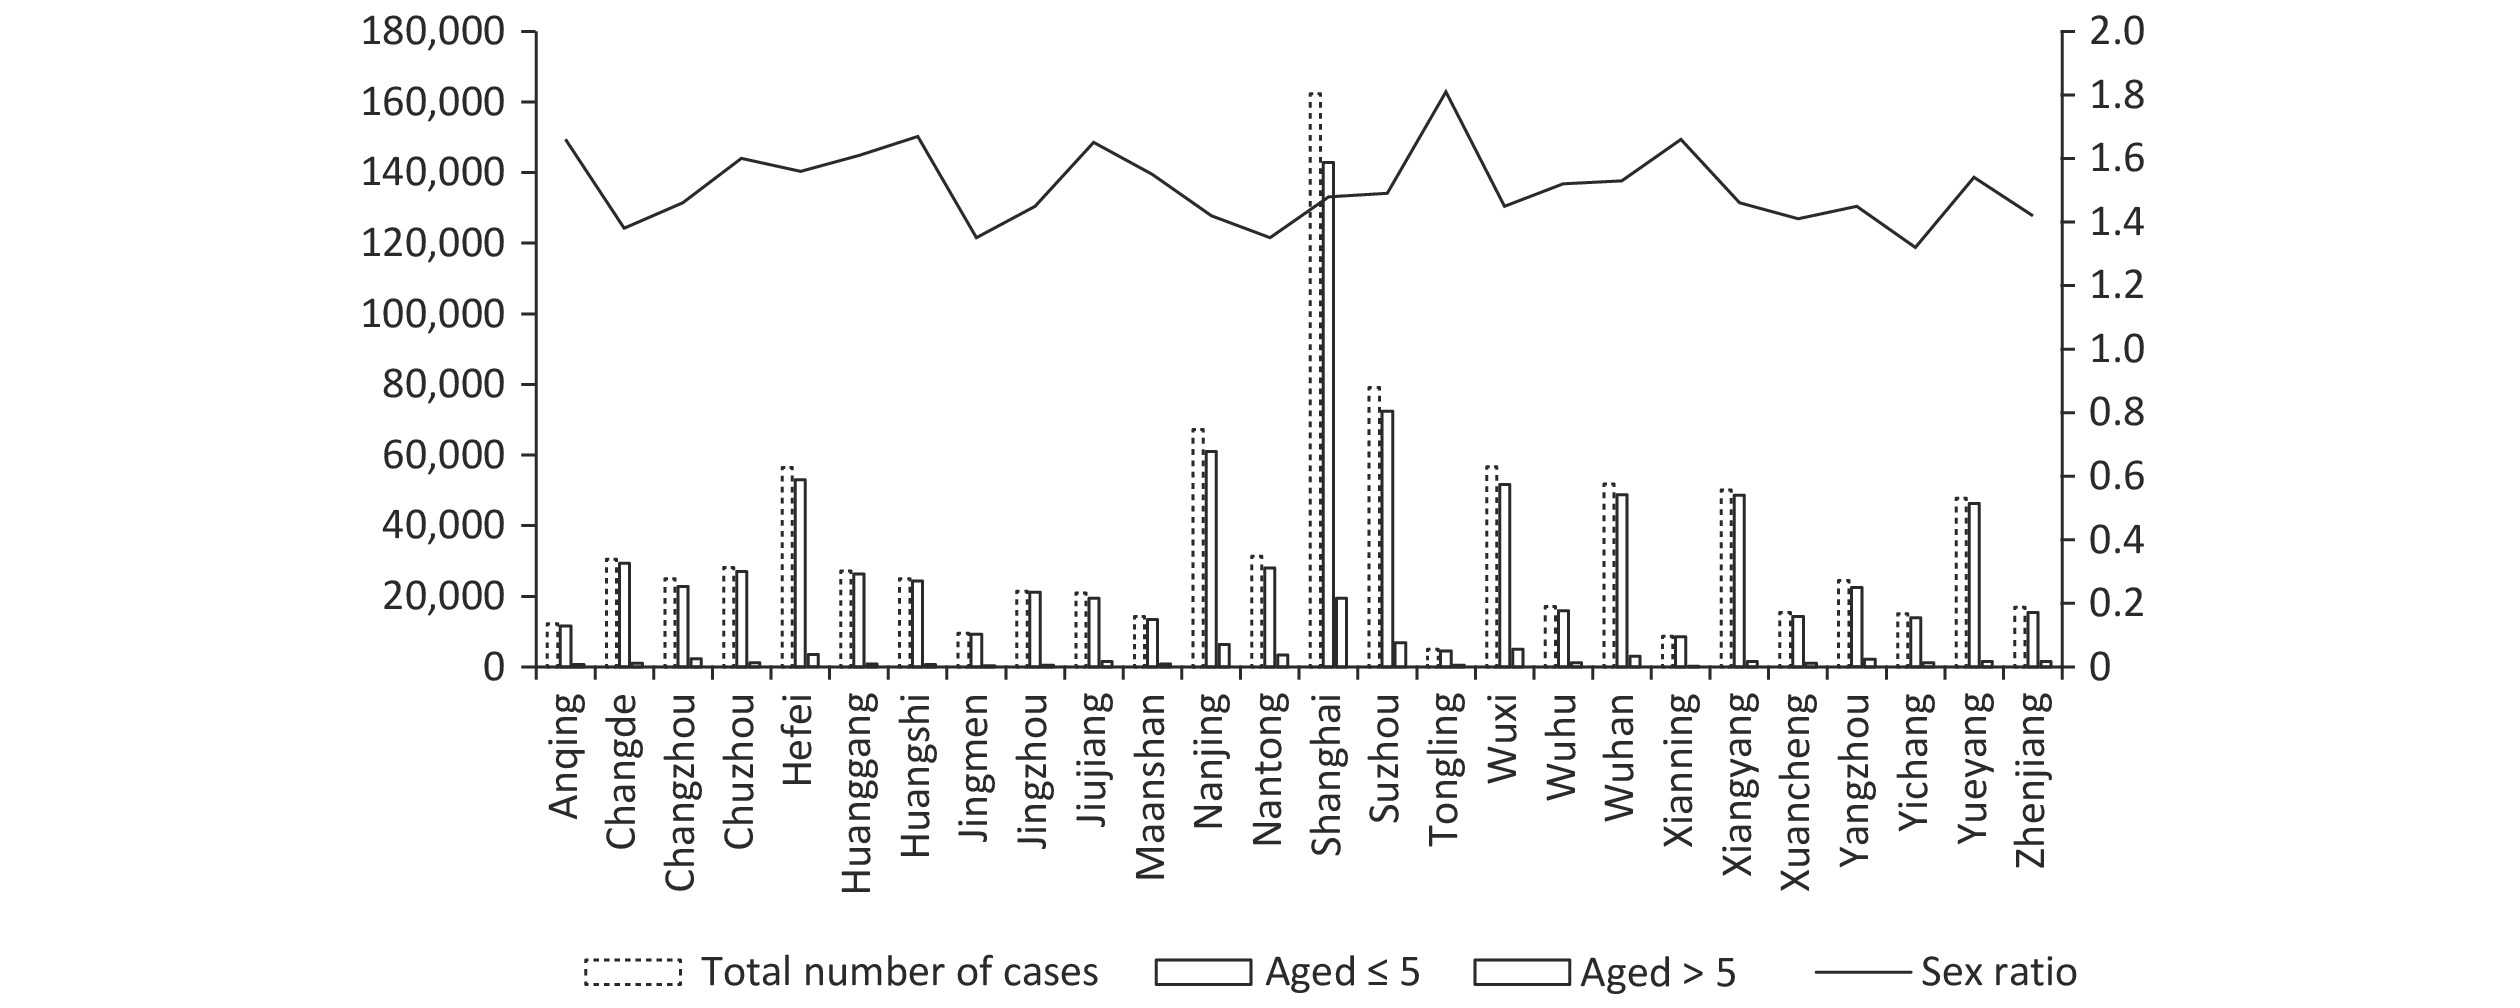
The Yangtze River Economic Belt covers 11 provinces and cities, including Shanghai, Jiangsu, and Zhejiang, with an area of approximately 2.0523 million km2, accounting for 21.4% of the country’s total area. The population and GDP both exceed 40% of the country's total. Twenty-six cities located in the Three Gorges coastal plain in eastern China, along the middle and lower reaches of the Yangtze River, were selected for this study (Figure 1). The study area was approximately 272,183 km2, covering the provinces of Hubei, Hunan, Anhui, and Jiangxi, with a total population of 1.3725 billion at the end of 2016 (Supplementary Figure S1).

Figure 1. Basic demographic characteristics of hand, foot, and mouth disease (HFMD) cases in each city.
-
Between January 1, 2014, and December 31, 2016, comprehensive data on all reported cases of HFMD from the 26 designated cities were sourced from the National Infectious Disease Surveillance System of the esteemed Chinese Center for Disease Control and Prevention. The dataset encapsulates key variables, including sex, date of birth, age, current residential location, population categorization, case classification, and onset date of the condition. The data were further grouped by sex and age (≤ 5 years and > 5 years).
-
Daily meteorological data from each city, including mean temperature, relative humidity, rainfall, wind speed, air pressure, and sunshine duration were collected from the China Meteorological Data Network (http://data.cma.cn)[23]. Daily mean temperature was used to estimate the association between temperature and the number of HFMD cases, as it indicates the average exposure throughout a 24-hour period[20,21]. The population and the GDP per capita were collected from the statistical yearbooks of the corresponding cities but the data source was constrained by survivorship bias, missed reports, and cross-regional discrepancies, potentially distorting views of disease epidemiology and impacting outcomes and conclusions.
-
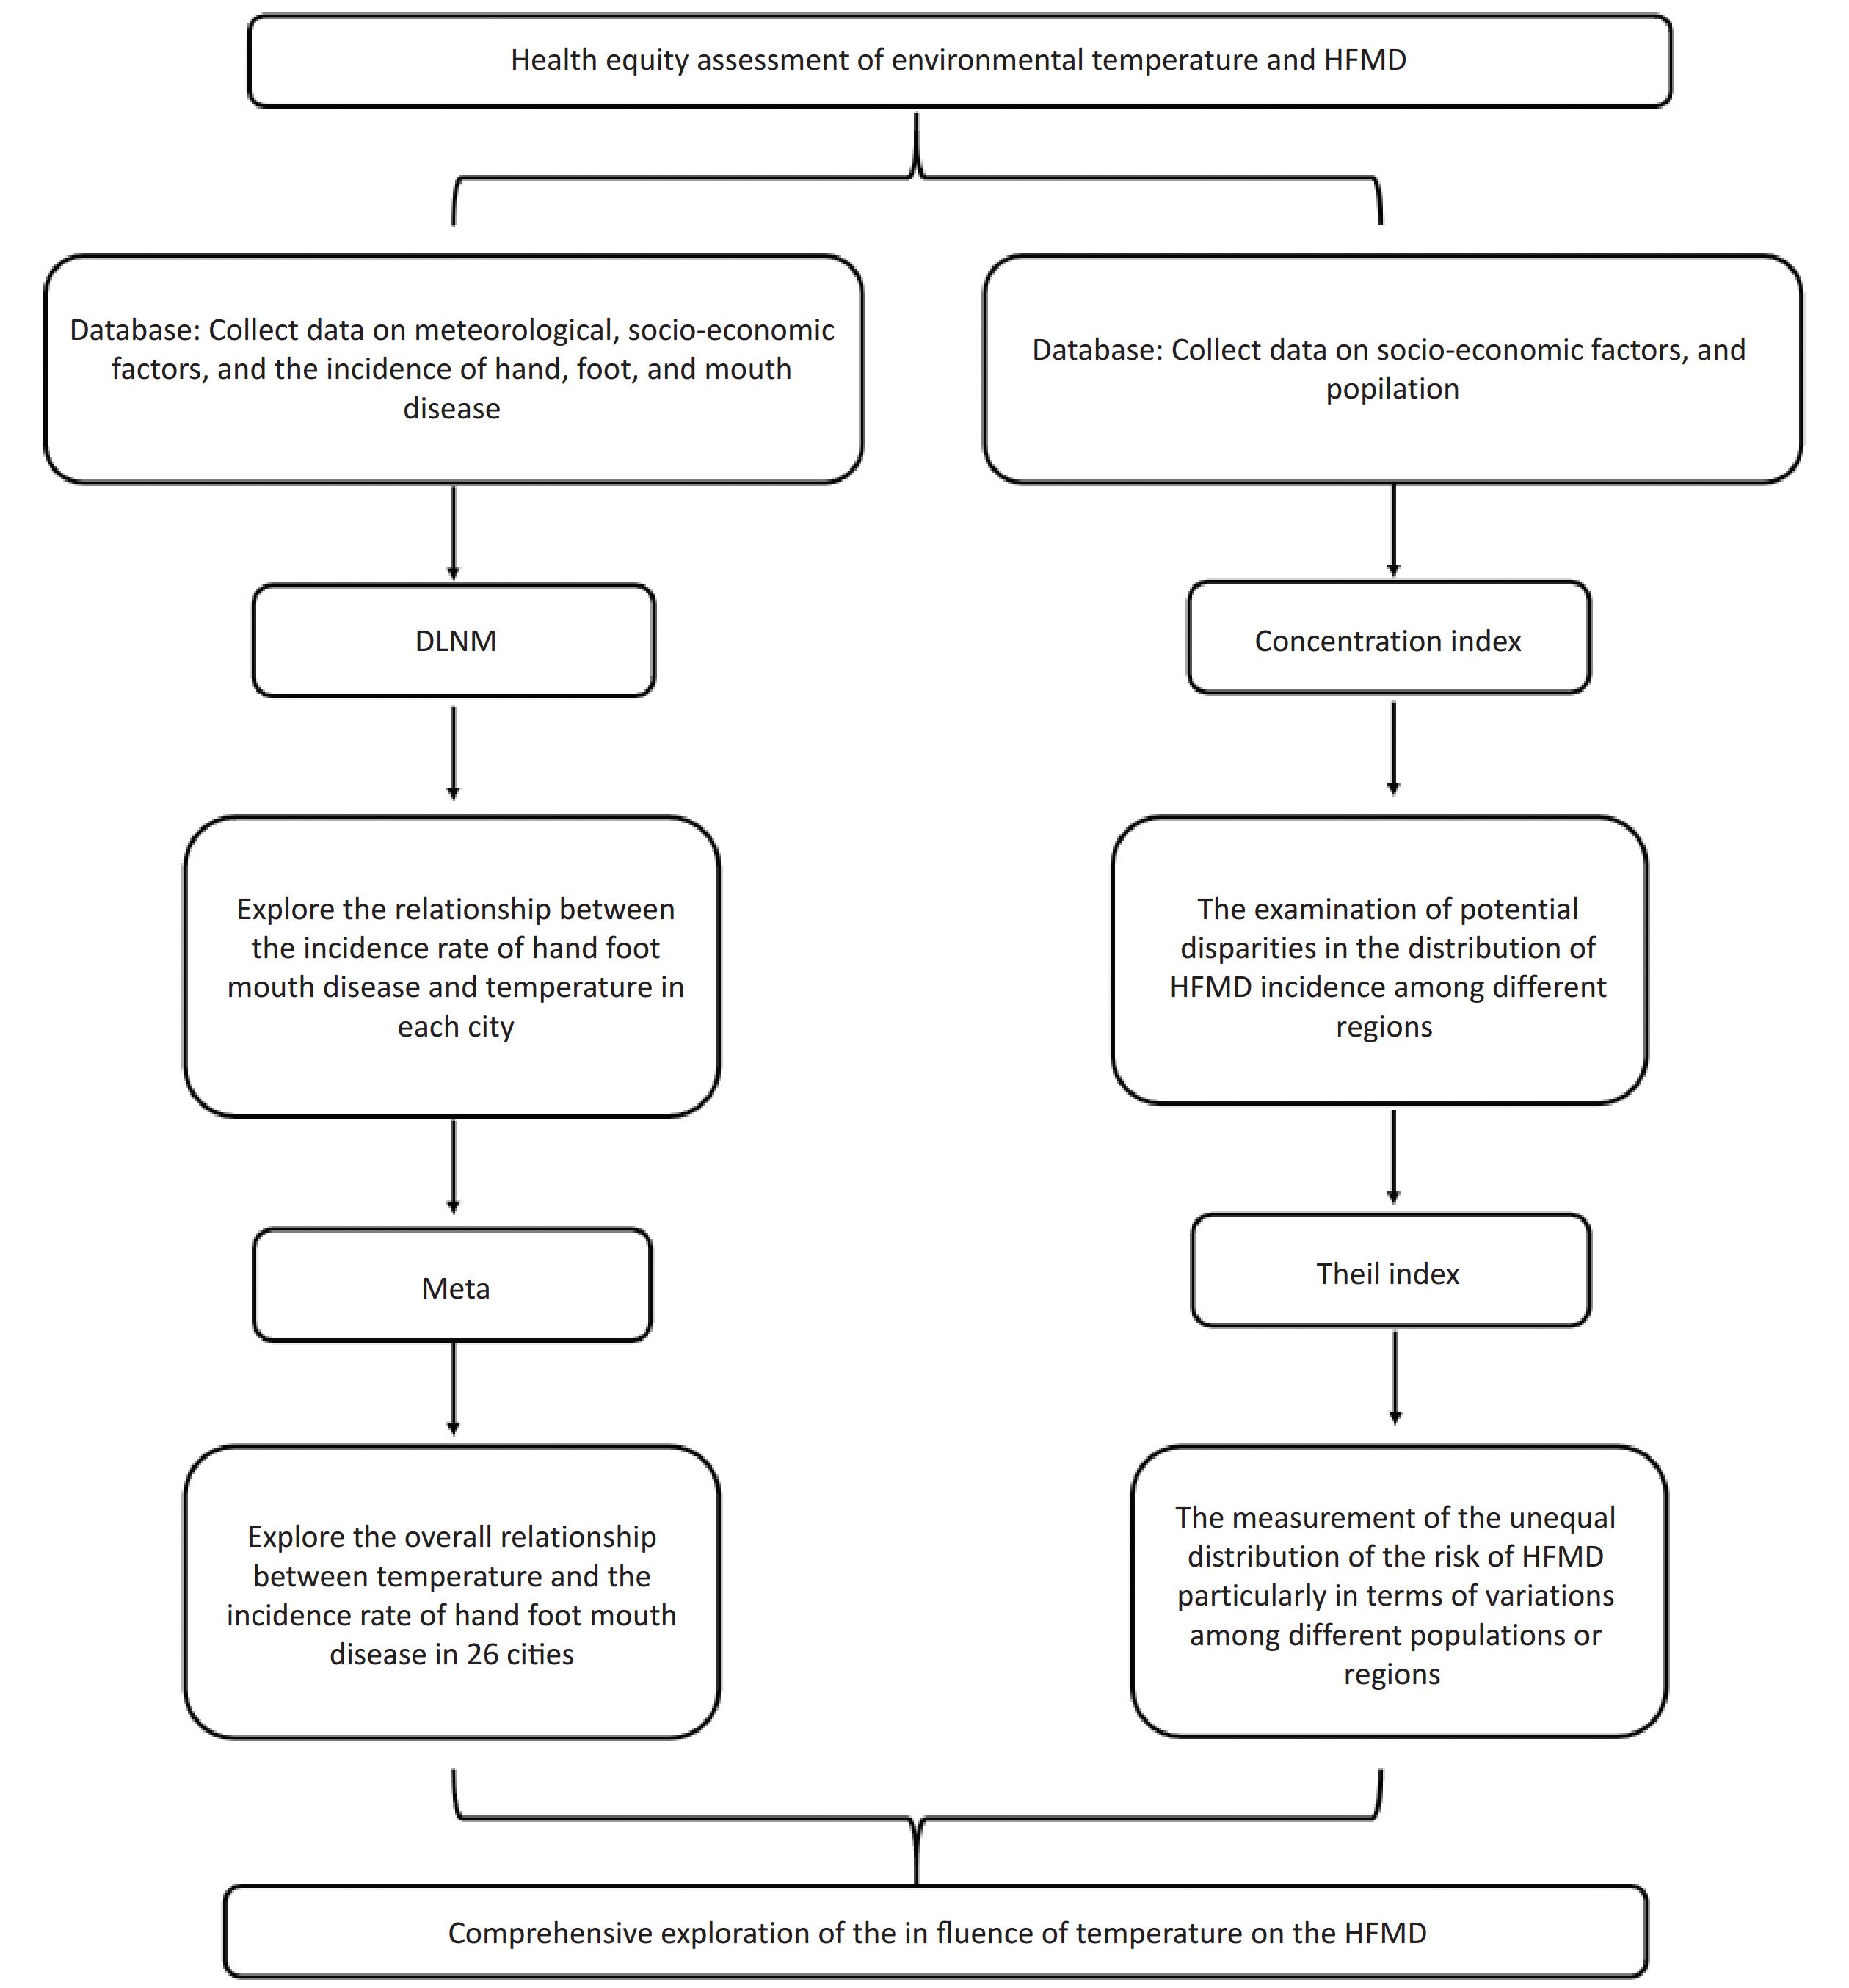
A two-stage approach was used to explore the effect of temperature on the incidence of HFMD. For clarity and comprehensiveness, a detailed flowchart illustrating the entire process, from data collection to analysis and interpretation, is included in the supplementary material (
Supplementary Figure S2 ). In the first stage, the association between the incidence of HFMD and temperature was analyzed separately for each city using a distributed lag nonlinear model (DLNM), with a quasi-Poisson distribution in the exposure-lag dimension and median temperature as the reference[6]. Model 1 is as follows:$$ \begin{aligned} {\text{log}}\left[E\left(Yt\right)\right]=& \alpha+\beta Temp_{t,l}+bs\left(Time,df_1\right)+ \\ & bs\left(Meteorological\;factors,\;df_2\right)+\\ & factor\left(DOW\right)+ factor\left(Holiday\right)+\\ & facotr\left(GDP\right)+ factor\left(population\;density\right) \end{aligned} $$ (1) where Yt denotes the daily cases of HFMD morbidity, α is the intercept, and Tempt,l is the cross-basis, a nonlinear term for temperature-morbidity association; Time refers to the long-time trend. The exposure-response curve was plotted using a quadratic B-spline with three internal knots at the 2.5th, 50th, and 97.5th percentiles of the temperature distribution, and the lag-response curve was fitted with a quadratic B-spline function with an equal distribution of three nodes in the log scale, with the maximum lag day set at 14[24]. The meteorological factors included in the model were atmospheric pressure (hPa), relative humidity (%), precipitation (mm), wind speed (m/s), and sunshine hours (h). These meteorological factors were substituted into the model to obtain different degrees of freedom (df) for exploration. Here, “meteorological factors” are presented as representatives. Potential confounders of day of week (DOW), holiday, GDP per capita, and population density were accounted for. A sensitivity analysis based on the sum of the quasi Akaike Information Criterion (QAIC) of the 26 cities was conducted to determine the forms of the variables (Supplementary Table S1). Finally, the df of time was stable at eight, and three or four for meteorological factors[25].
tmean 3 3 3 3 3 3 3 3 3 3 3 time 9 9 9 8 8 8 8 8 8 7 7 rainfall 3 5 4 3 3 4 4 5 5 3 5 rh 3 3 3 3 4 3 3 3 3 3 3 pressure 4 4 4 4 4 4 4 4 4 4 4 ws 3 3 3 3 3 3 3 3 3 3 3 sh 3 3 3 3 3 3 4 3 4 5 4 Anqing 6013.31 6024.82 6023.51 6180.96 6180.96 6189.79 6189.79 6196.35 6196.35 6222.55 6236.97 Changde 7367.91 7390.19 7377.36 7815.36 7815.36 7824.44 7824.44 7837.47 7837.47 8138.35 8164.47 Changzhou 7085.05 7100.60 7090.61 7286.85 7286.85 7295.04 7295.04 7305.16 7305.16 7202.49 7217.43 Chuzhou 7266.80 7288.66 7278.12 7606.90 7606.90 7620.55 7620.55 7630.05 7630.05 7593.71 7617.62 Hefei 8614.36 8638.45 8624.16 9156.06 9156.06 9167.24 9167.24 9185.13 9185.13 9202.13 9227.93 Huanggang 8106.75 8132.67 8122.76 8309.67 8309.67 8327.64 8327.64 8333.17 8333.17 8330.58 8353.20 Huangshi 7046.29 7065.54 7056.97 7456.60 7456.60 7465.11 7465.11 7480.62 7480.62 7425.38 7444.71 Jingmen 5398.10 5414.28 5407.46 5458.91 5458.91 5468.44 5468.44 5476.10 5476.10 5584.80 5603.89 Jingzhou 6662.33 6672.23 6667.25 6974.54 6974.54 6979.50 6979.50 6988.05 6988.05 6982.85 6993.92 Jiujiang 6709.14 6726.42 6718.02 7004.19 7004.19 7011.57 7011.57 7020.51 7020.51 7132.33 7149.36 Maanshan 6129.79 6143.28 6132.30 6308.52 6308.52 6312.05 6312.05 6323.66 6323.66 6267.49 6283.03 Nanjing 9723.46 9748.07 9740.05 10557.35 10557.35 10574.46 10574.46 10593.21 10593.21 10446.23 10470.48 Nantong 7676.49 7696.54 7687.51 7961.09 7961.09 7967.56 7967.56 7973.51 7973.51 8020.50 8030.48 Shanghai 12397.35 12437.79 12415.84 14052.06 14052.06 14080.30 14080.30 14107.14 14107.14 13605.04 13658.77 Suzhou 7787.37 7770.28 7784.05 8063.30 8063.30 8048.46 8048.46 8032.43 8032.43 7900.03 7868.21 Tongling 4910.94 4923.88 4920.37 4936.12 4936.12 4945.38 4945.38 4946.25 4946.25 4931.23 4941.98 Wuhan 8599.92 8623.94 8610.42 9164.92 9164.92 9176.13 9176.13 9191.03 9191.03 9224.45 9251.37 Wuhu 6450.13 6464.45 6457.16 6792.59 6792.59 6799.90 6799.90 6806.85 6806.85 6881.41 6896.90 Wuxi 9010.71 9032.58 9020.25 9403.08 9403.08 9417.77 9417.77 9422.12 9422.12 9336.49 9349.90 Xiangyang 8080.23 8077.12 8082.44 8689.47 8689.47 8696.37 8696.37 8691.89 8691.89 8784.49 8785.96 Xianning 5163.19 5175.29 5174.93 5244.92 5244.92 5257.39 5257.39 5258.22 5258.22 5225.15 5237.31 Xuancheng 6567.35 6577.83 6570.94 6690.53 6690.53 6689.91 6689.91 6701.75 6701.75 6645.88 6654.85 Yangzhou 7103.43 7117.99 7109.48 7252.70 7252.70 7257.74 7257.74 7265.81 7265.81 7240.81 7258.08 Yichang 6071.06 6082.57 6074.23 6129.42 6129.42 6134.78 6134.78 6143.82 6143.82 6148.07 6161.35 Yueyang 8278.24 8299.92 8288.24 9139.71 9139.71 9159.22 9159.22 9174.83 9174.83 9469.35 9509.38 Zhenjiang 6537.85 6550.16 6540.32 6774.31 6774.31 6782.73 6782.73 6791.45 6791.45 6749.20 6767.73 QAIC 190757.55 191175.56 190974.75 200410.10 200410.10 200649.49 200649.49 200876.60 200876.60 200691.01 201135.25 Table S1. QAIC values at different degrees of freedom(partial)
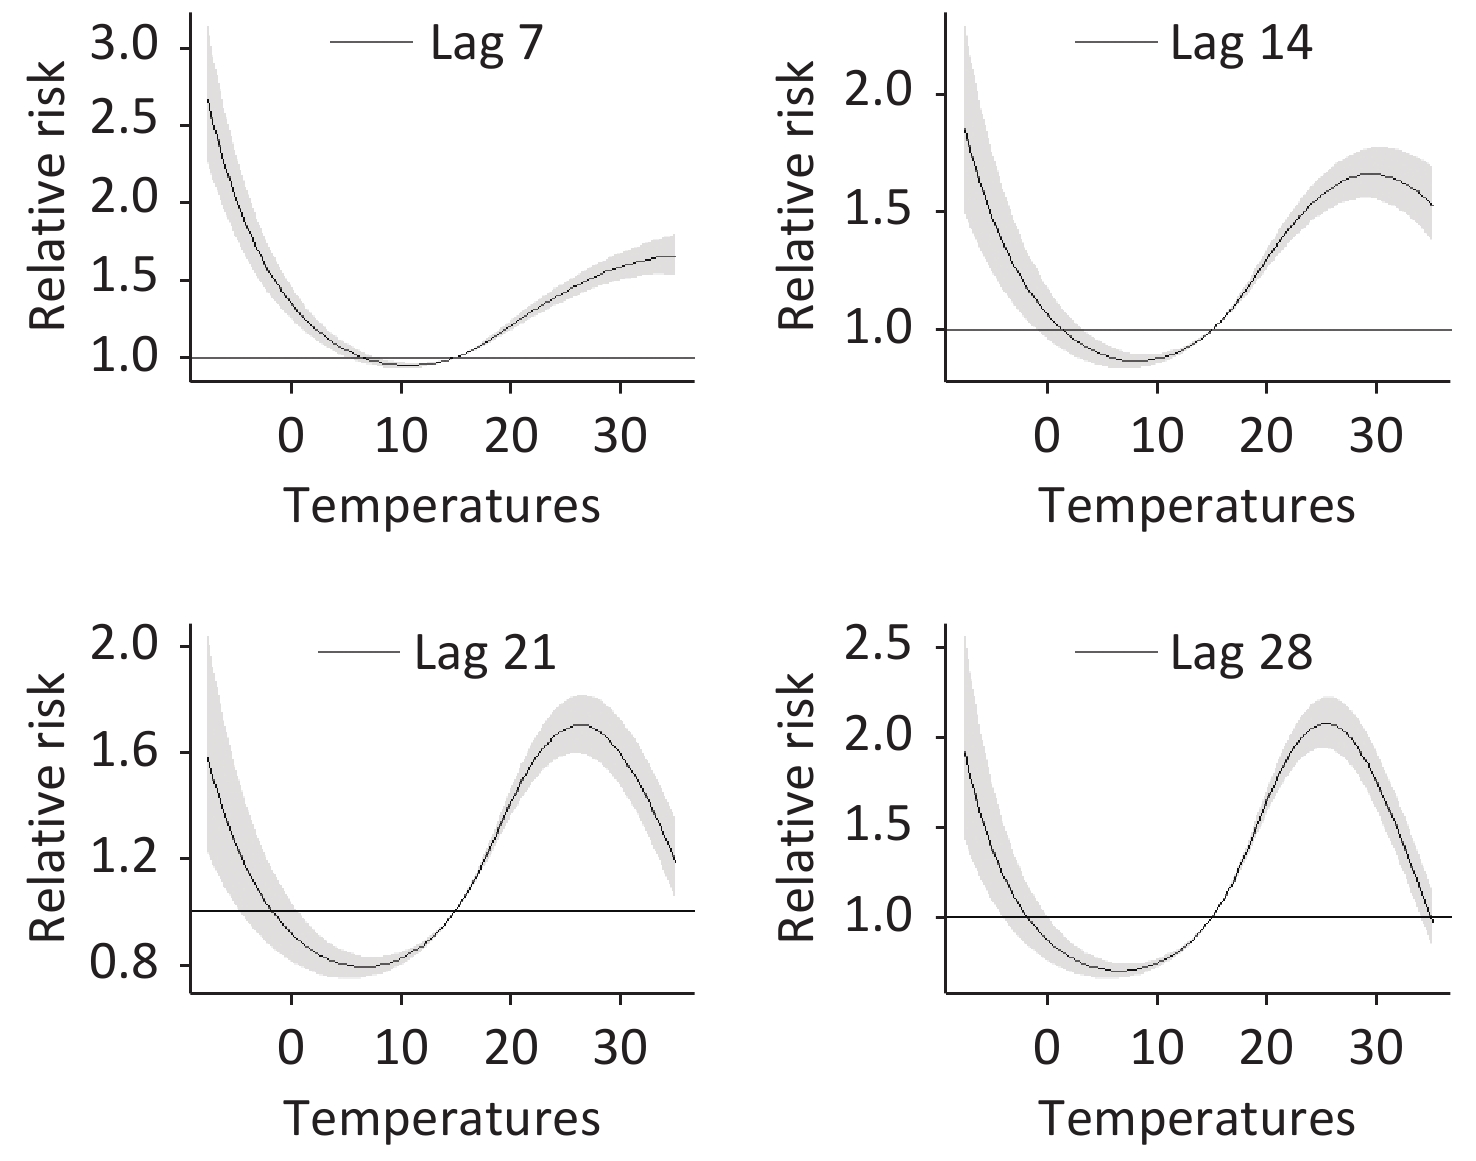
In the second stage, a multivariate random-effects meta-analysis based on the exposure-response association of the 26 cities was conducted to explore the overall relationship between temperature and the incidence of HFMD. To analyze the lag effect, the 95th, 50th, and 5th percentiles of the temperature were selected to plot the lag-response association diagram. Heterogeneity was tested using Cochran’s Q test and the I2 statistic[26]. Extreme cold and extreme heat temperatures were defined as temperatures lower than the 2.5th and higher than the 97.5th location-specific percentiles, respectively. The sensitivity of the random-effects model was examined by changing the df of time in the second stage, as shown in Figure 2.
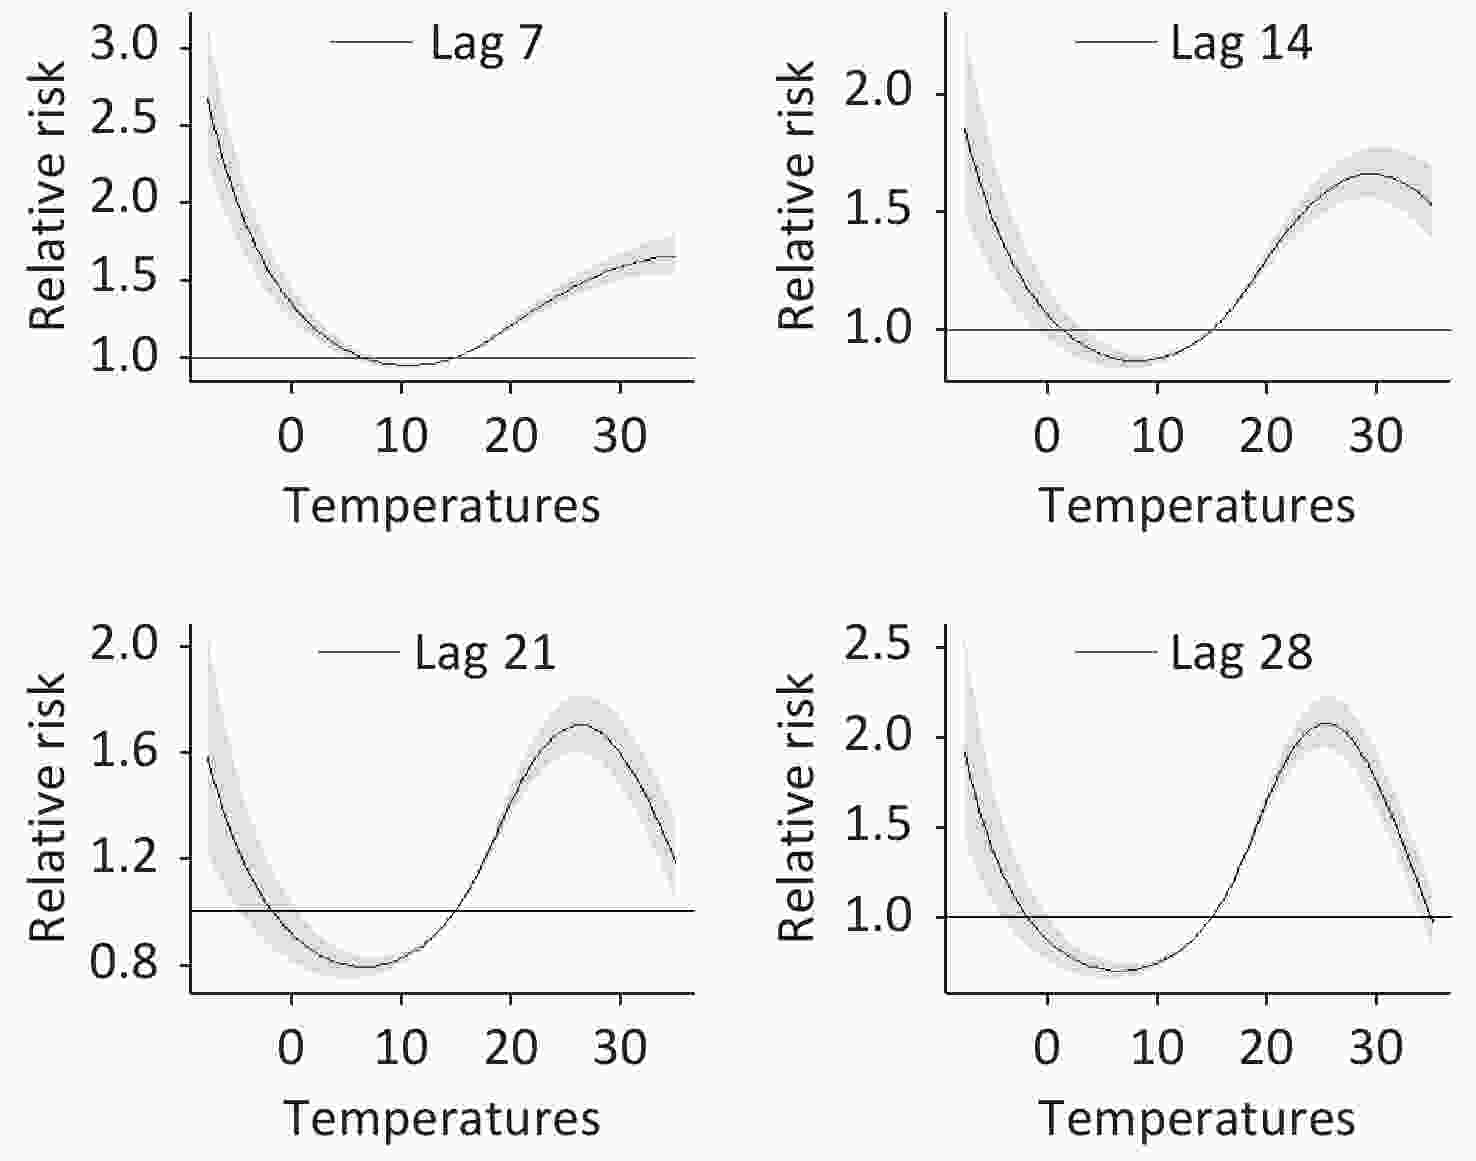
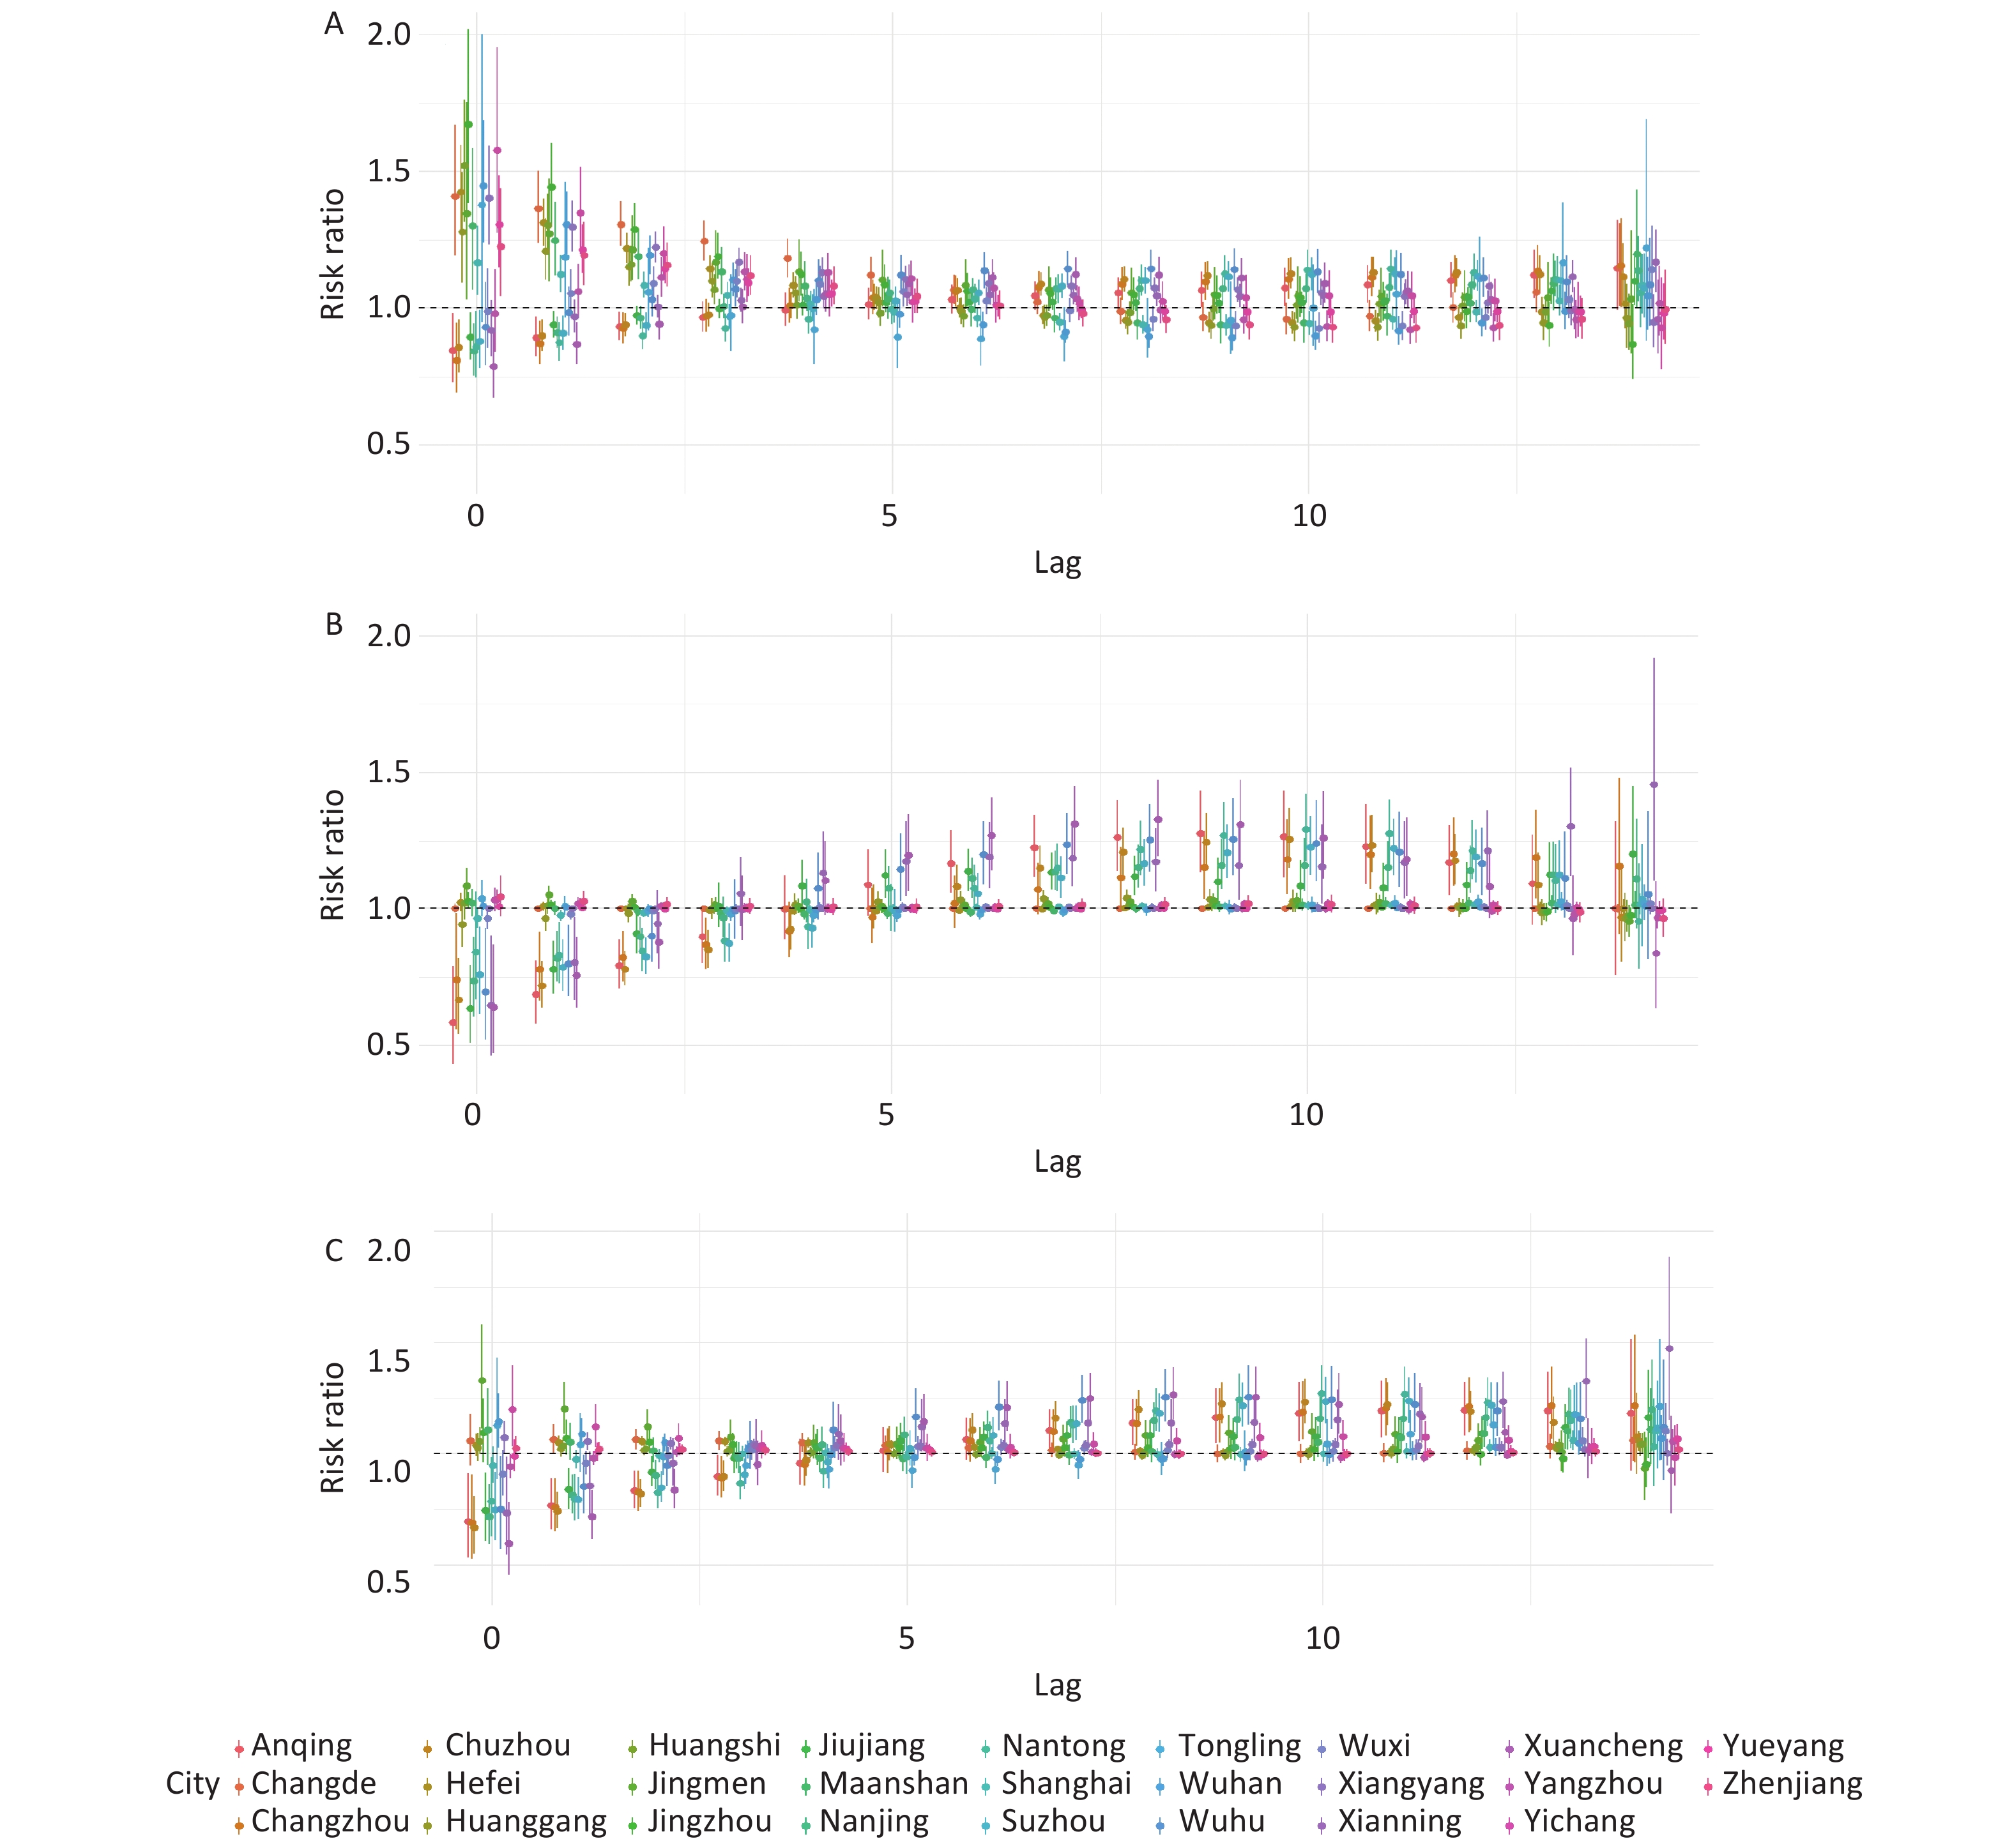
Figure 2. The effect of temperature changes with different lag days.
The concentration and Theil indices were also incorporated in the analysis. The concentration index allowed for the examination of potential disparities in the distribution of HFMD incidence among different regions. The level of inequality in the incidence of HFMD across different populations was assessed using the concentration index and the concentration curve. The Theil index allowed for measurement of the unequal distribution of the risk of HFMD, particularly in terms of variations among different populations or regions. The Theil index was also used to analyze the risk distribution of HFMD across different time periods or intervention measures. This assisted in evaluating the effectiveness and fairness of the implemented interventions[27,28].
Concentration index and concentration curve are currently commonly used to study the equity of health resources. They measure the degree of health inequality associated with socioeconomic conditions and are suitable indicators for evaluating the inequality of health and health services under different socio-economic conditions.
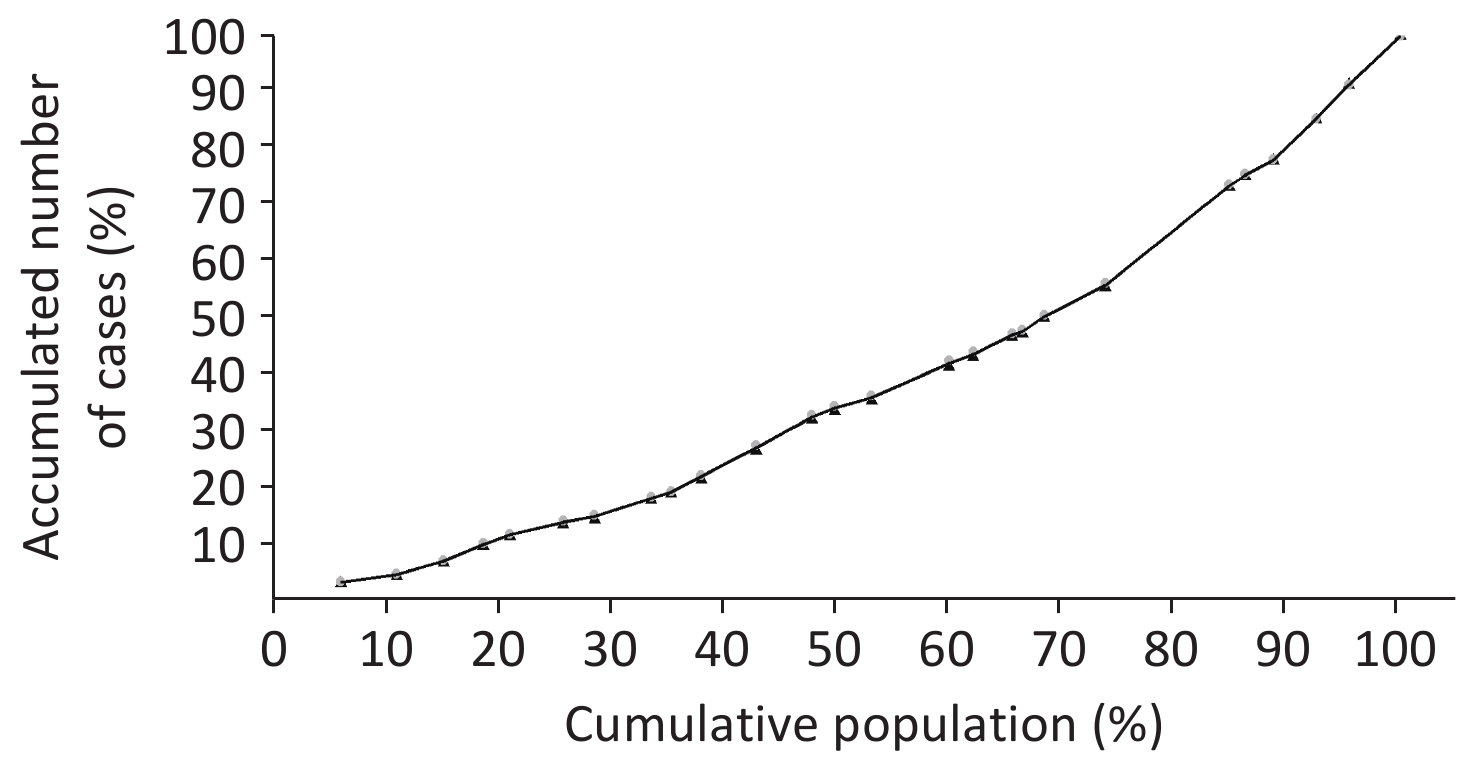
The concentration index was calculated and the concentration curve was plotted as follows: the horizontal axis (X) represents the cumulative percentage of per capita GDP in the 26 cities from low to high, whereas the vertical axis (Y) represents the cumulative percentage of incidence in children, which serves as an absolute fairness line. The formula for calculating the concentration index is as follows:
$$ S = \frac{1}{2} \sum_{i=0}^{n-1} (Y_i + Y_{i+1})(X_{i+1} - X_i) $$ (2) where Y0 = 0, X0 = 0, Yi is the cumulative percentage of incidence among children in the ith class, and Xi represents the cumulative percentage of children under the age of five in the ith class. Given that the diagonal area is 1 if the area under the concentration curve is S, then the concentration index is 2 (0 5-S). The concentration index is twice the distance between the concentration curve and the fair line, with values ranging from -1 to 1. A concentration index of 0 reflects absolute fairness, a positive concentration index reflects the redistribution of health resources towards the affluent population, and a negative concentration index reflects the redistribution of health resources towards the impoverished population.
The Theil index is an indicator that measures the degree of inequality and has been widely used in recent years in studies on the fairness of health resource allocation. It not only considers overall differences, but also further decomposes intra-group and inter-group differences, providing more detailed information for policymakers. The Theil Index (TI) (3) formula is as follows:
$$ \begin{aligned} &T={\displaystyle \sum _{i=1}^{n}{P}_{i}}{\text{log}}\frac{{P}_{i}}{{Y}_{i}}(i=1,2,\mathrm{...},n)\\ & T={T}_{Inter\;group}+{T}_{Group}\\ & {T}_{Group}={\displaystyle \sum_{g=1}^{k}{P}_{g}}{T}_{g}(g=1,2,3)\\ & {T}_{Inter\;group}={\displaystyle \sum _{g=1}^{k}{P}_{g}}{\text{log}}\frac{{P}_{g}}{{Y}_{g}}(g=1,2,3)\end{aligned} $$ (3) where T represents the Theil index, Pi denotes the proportion of children in each of the 26 cities of the total number of children, and Yi signifies the proportion of children in each of the 26 cities of the total number of incidences. The Theil index for intra-group differences is denoted by T group in the aforementioned categories. In the present study, intra-group differences were categorized into five groups based on the variation in the relative risk (RR) with different lag times, temperature trends related to the RR, and changes in the RR under different cold and hot temperatures. The T group represents the Theil index of inter-group differences, Pg represents the proportion of the total number of children in each group of the total population of the 26 cities, and Tg represents the Theil index for each group. The Theil index ranges from 0 to 1, with a value closer to 0 indicating a smaller difference, and a value closer to 1 indicating a greater difference.
Data were analyzed using Excel 2013 software (Microsoft Corp., Redmond, WA, USA). The “dlnm” and “mvmeta” packages in R 3.5.3 software (https://www.R-project.org/; The R foundation, Vienna, Austria) were used for modeling analysis.
-
A total of 919,458 confirmed HFMD cases were reported during the study period, with the maximum number of cases (162,303) in Shanghai and the minimum number of cases (5,513) in Tongling (Figure 1). A large number of patients were aged under five, accounting for 93.36% and among the children and adolescents with HFMD, there were significantly more males, with a male-to-female ratio of 1.49:1 (Supplementary Table S2).
City Total number of cases Gender ratio Aged
≤ 5Aged
> 5Population of 10000 in 2014 Population of 10000 in 2015 Population of 10000 in 2016 GDP in 2014 GDP in 2014 GDP in 2014 Anqing 12,279 1.66 11,596 683 620.9 622 529.3 1,544 1417.43 1531.2 Changde 30,428 1.38 29,365 1,063 583.08 584 584.4 2,514 2,709 2955.5 Changzhou 25,036 1.46 22,733 2,303 474.8164 476 470.14 4,902 5,273 5773.9 Chuzhou 28,106 1.6 26,909 1,197 398.5 402 404.4 1,214 1,306 1422.8 Hefei 56,433 1.56 52,976 3,457 770.532 780 787 5,181 5,660 6274.38 Huanggang 27,083 1.61 26,296 787 628.357 629 632.1 1,477 1589.24 1726.17 Huangshi 24,928 1.67 24,251 677 245.3994 246 246.5498 1,219 1228.1 1305.55 Jingmen 9,571 1.35 9,276 295 289.1475 290 290.1296 1,311 1388.46 1521 Jingzhou 21,503 1.45 21,045 458 572.8955 571 569.7896 1,480 1590.5 1726.75 Jiujiang 20,950 1.65 19,379 1,571 489.69 483 520.36 1,780 1,903 2104.05 Maanshan 14,300 1.55 13,405 895 227.7 229 229.3 1,357 1365.3 1493.8 Nanjing 67,264 1.42 60,980 6,284 814.0653 816 823.59 8,821 9,721 10503.02 Nantong 31,307 1.35 28,051 3,256 728.2571 730 730 5,653 6,148 6768.2 Shanghai 162,303 1.48 142,797 19,506 2425.68 2,415 2419.7 23,561 25,123 28178.65 Suzhou 79,187 1.49 72,395 6,792 1059.7856 1,063 1061.6 13,761 14,504 15475.09 Tongling 4,973 1.81 4,507 466 73.78 74 160.1 716 721.29 957.25 Wuxi 56,718 1.45 51,661 5,057 999.739 1,061 1076.62 10,069 10,906 11912.61 Wuhu 17,006 1.52 15,862 1,144 361.7 385 367 2,310 2,457 2699.44 Wuhan 51,730 1.53 48,738 2,992 653.1581 655 651.1 8,205 8,518 9210.02 Xianning 8,724 1.66 8,556 168 557.857 561 563.9 3,129 3382.12 3694.5 Xiangyang 50,201 1.46 48,637 1,564 247.7538 251 252.5998 964 1,030 1107.93 Xuancheng 15,348 1.41 14,291 1,057 257.4 280 260.1 918 971 1057.8 Yangzhou 24,535 1.45 22,380 2,155 446.3065 448 448.36 3,698 4,017 4449.38 Yichang 15,046 1.32 13,843 1,203 409.3384 412 412.9998 3,132 3,385 3709.36 Yueyang 47,722 1.54 46,185 1,537 559.51 563 568.11 2,669 2,886 3100.87 Zhenjiang 16,963 1.42 15,468 1,495 317.0411 318 317.65 3,252 3,502 3833.84 Table S2. Summary of hand, foot and mouth disease cases and socioeconomic characteristics in various cities
The concentration index for child mortality was 0.2463, which was above 0, suggesting that deaths of children were concentrated in economically affluent areas. This indicates that children residing in economically affluent regions have a higher risk of developing HFMD than those in other areas. In addition, the concentration index for males was 0.2416, which was slightly lower than the overall concentration index, suggesting a relatively balanced distribution of health resources to males. The concentration index for females was 0.2534, which was slightly higher than the overall concentration index, indicating that the distribution of health resources to females was also favorable (Figure 3).
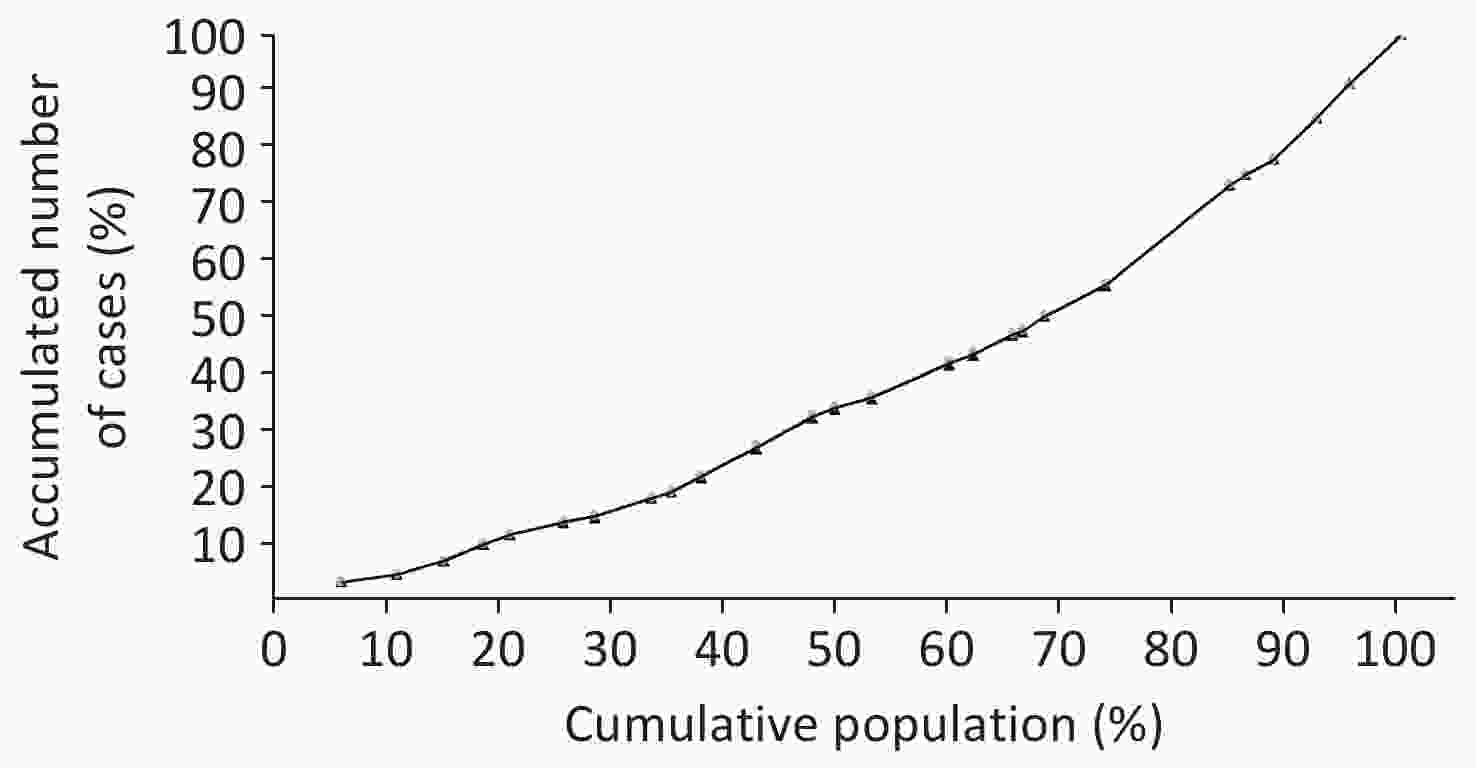
Figure 3. Concentration curve of child mortality in the 26 cities ranked by per capita Gross Domestic Product (GDP).
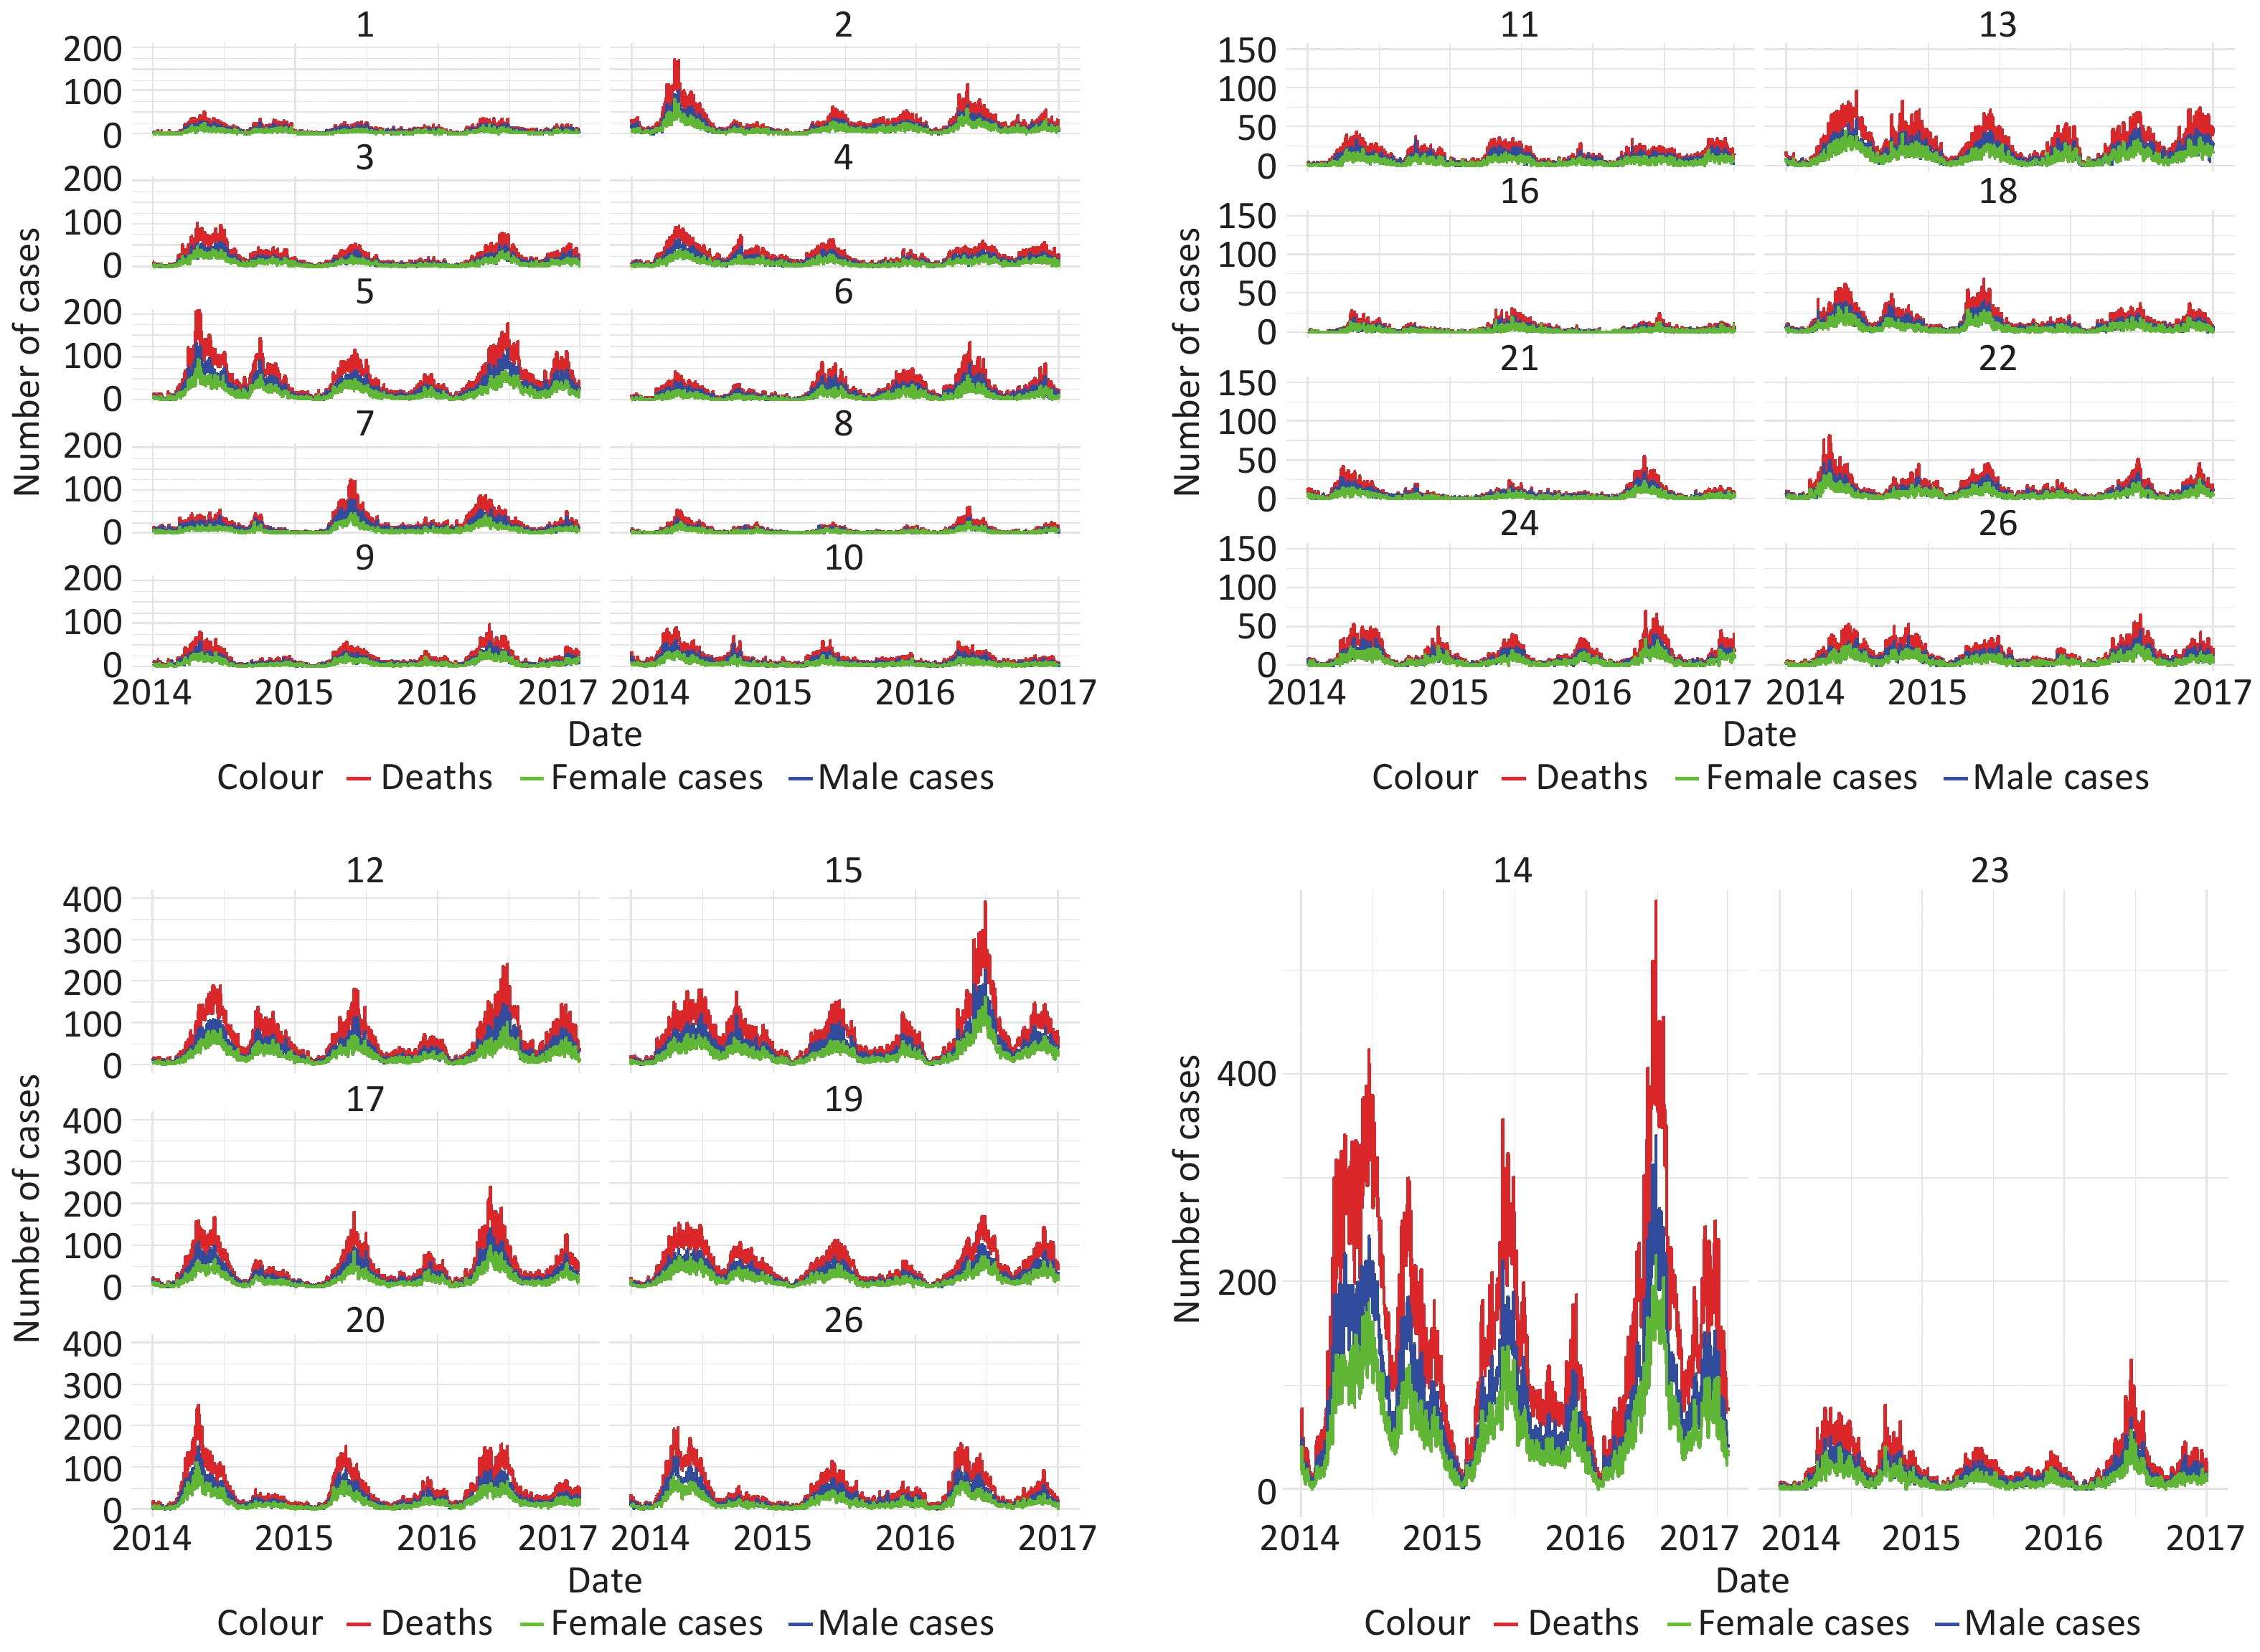
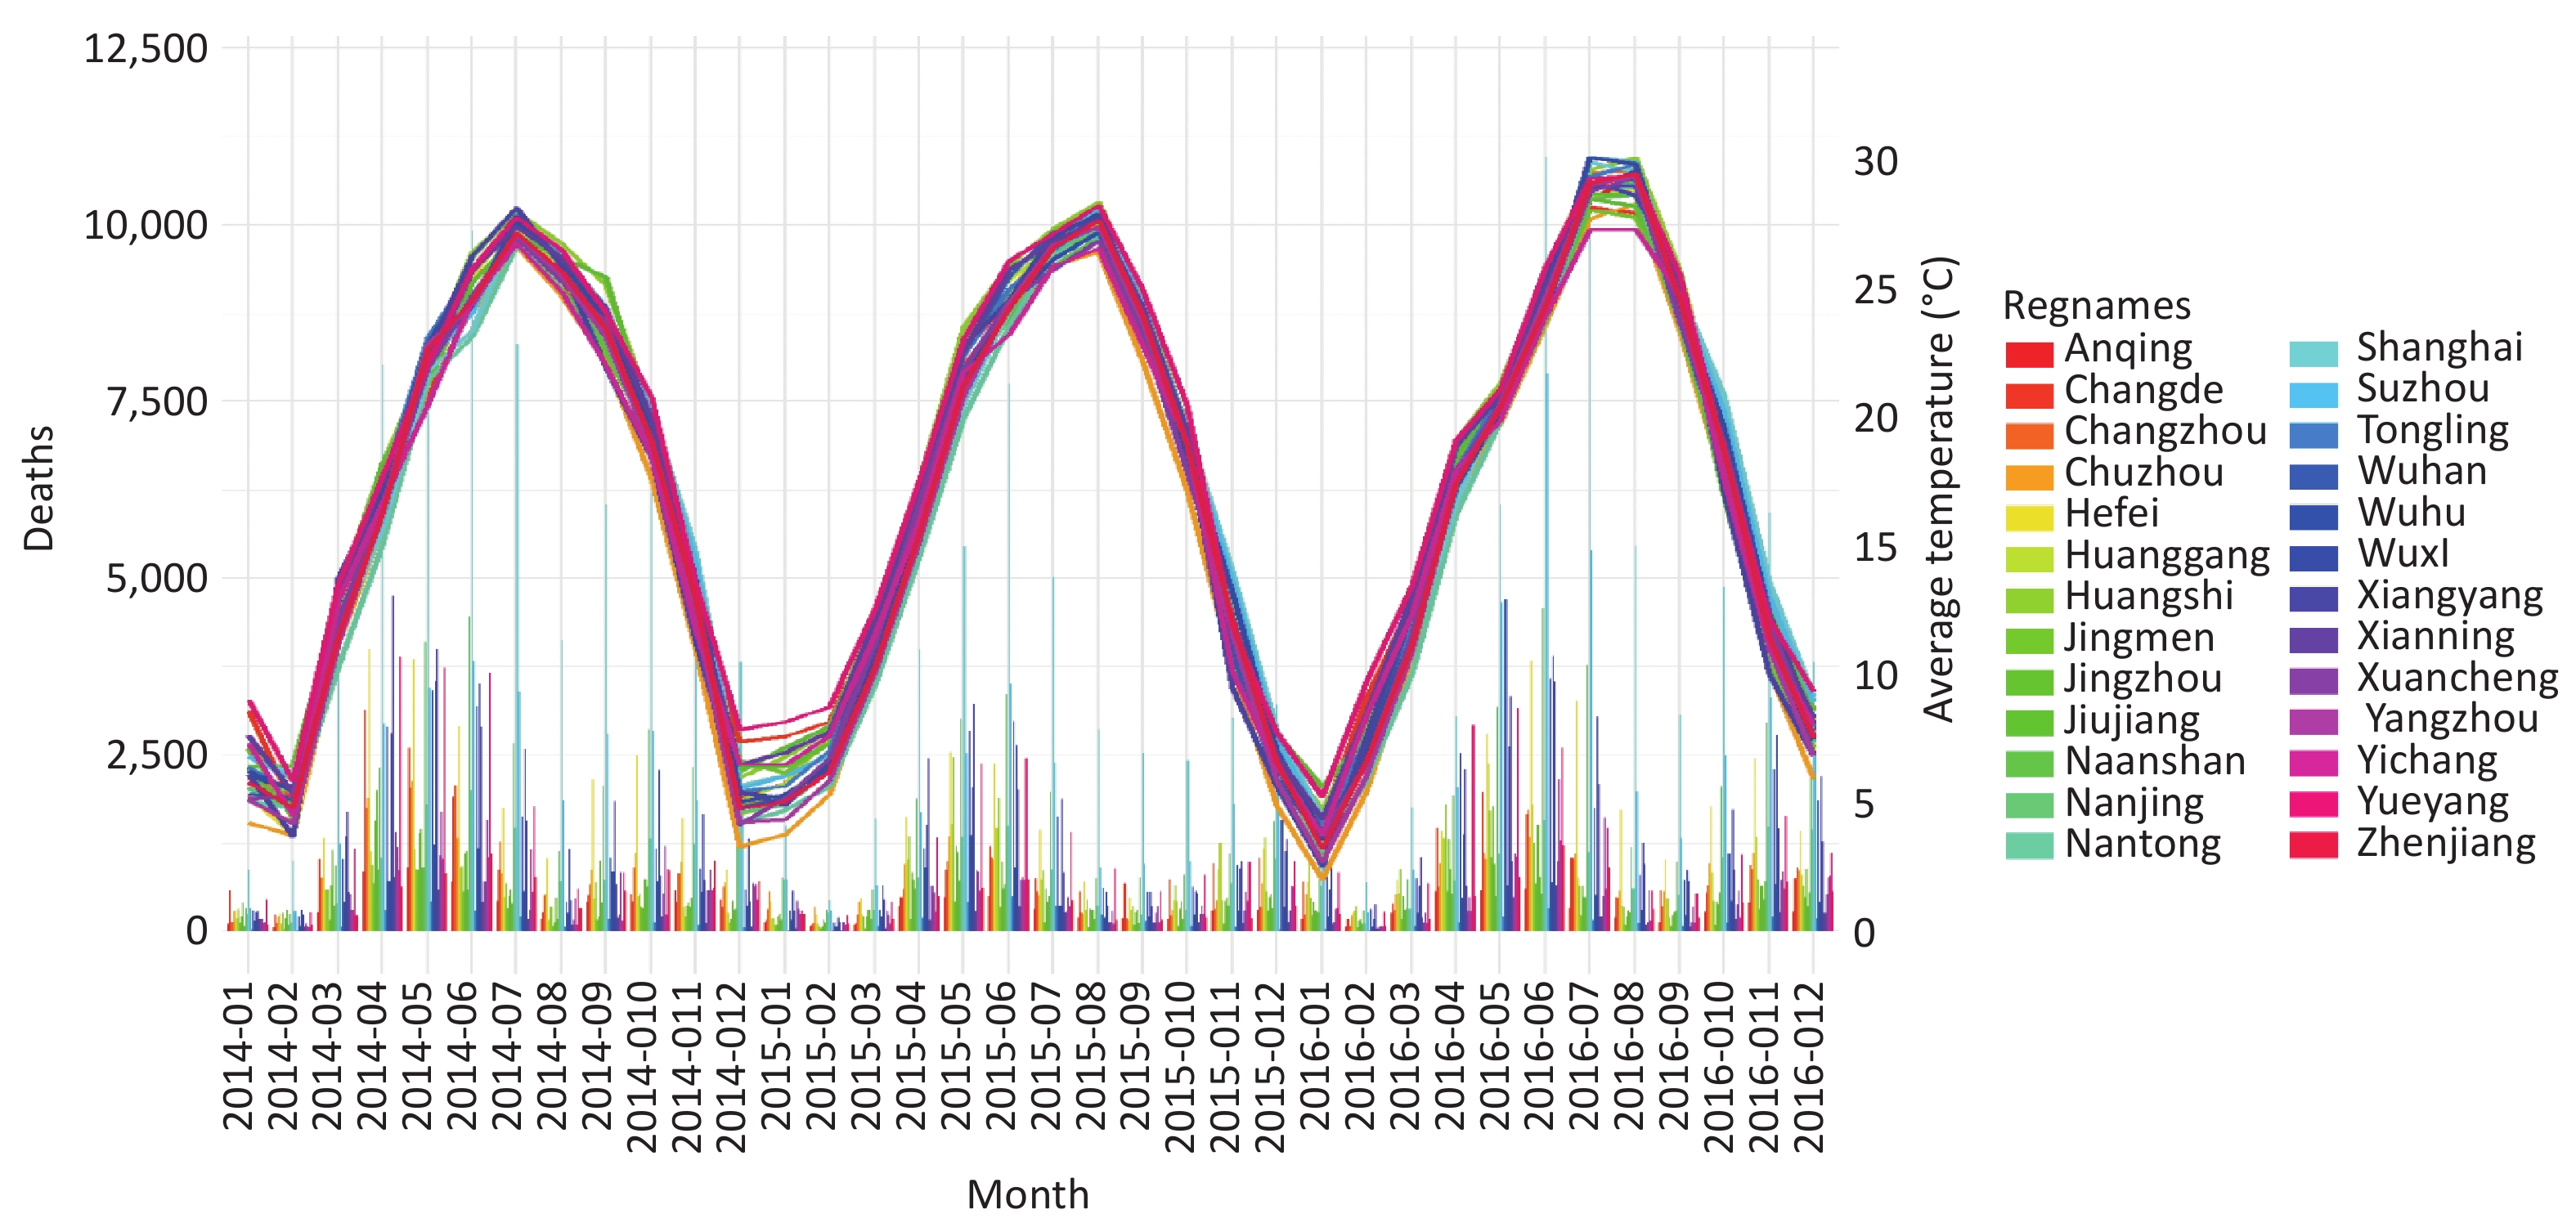
Seasonal changes in the number of HFMD cases in the 26 cities are presented in Supplementary Figures S3 and S4. The incidence of HFMD peaks in late spring and early summer (April to June) annually. Specifically, the number of cases in each year increased with an increase in temperature and reached the first peak, and then decreased when the temperature increased to a certain point. The second peak, which was lower, appeared in November as the temperature decreased. Significant differences in the number of cases were observed between different regions.
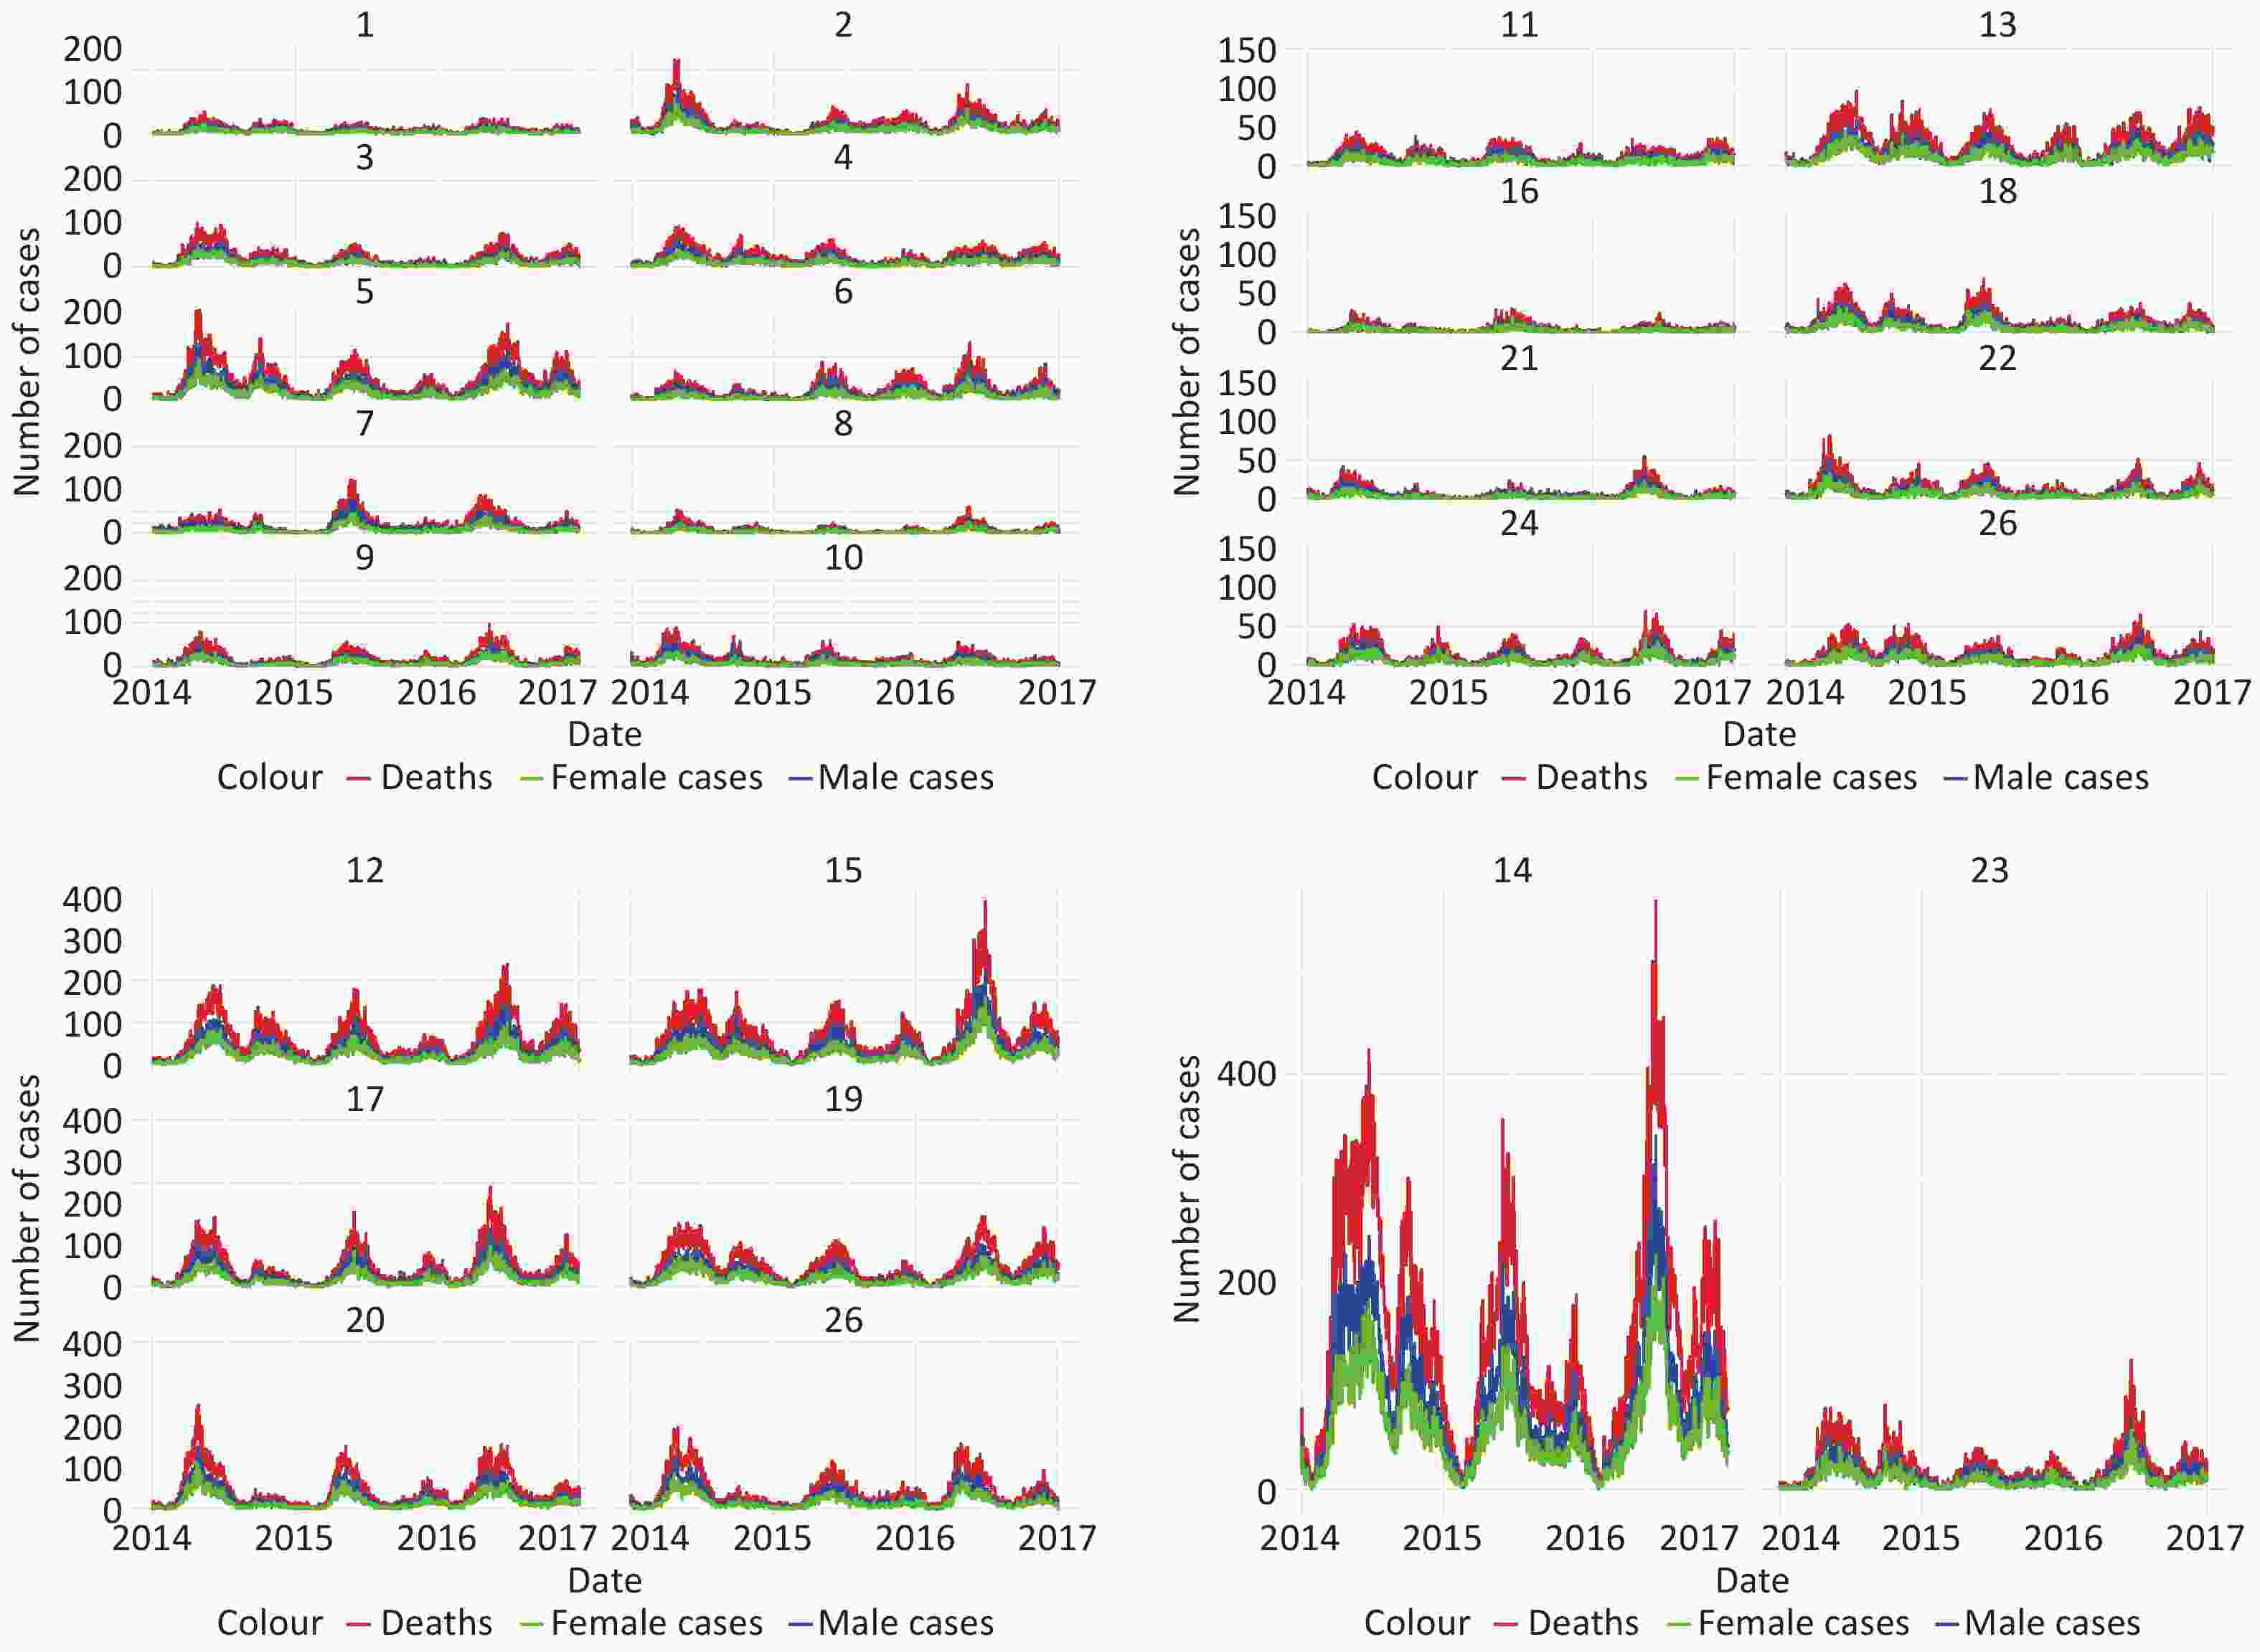
Figure S3. Seasonal distribution of temperature and daily reported HFMD cases in each study city, 2014–2016.
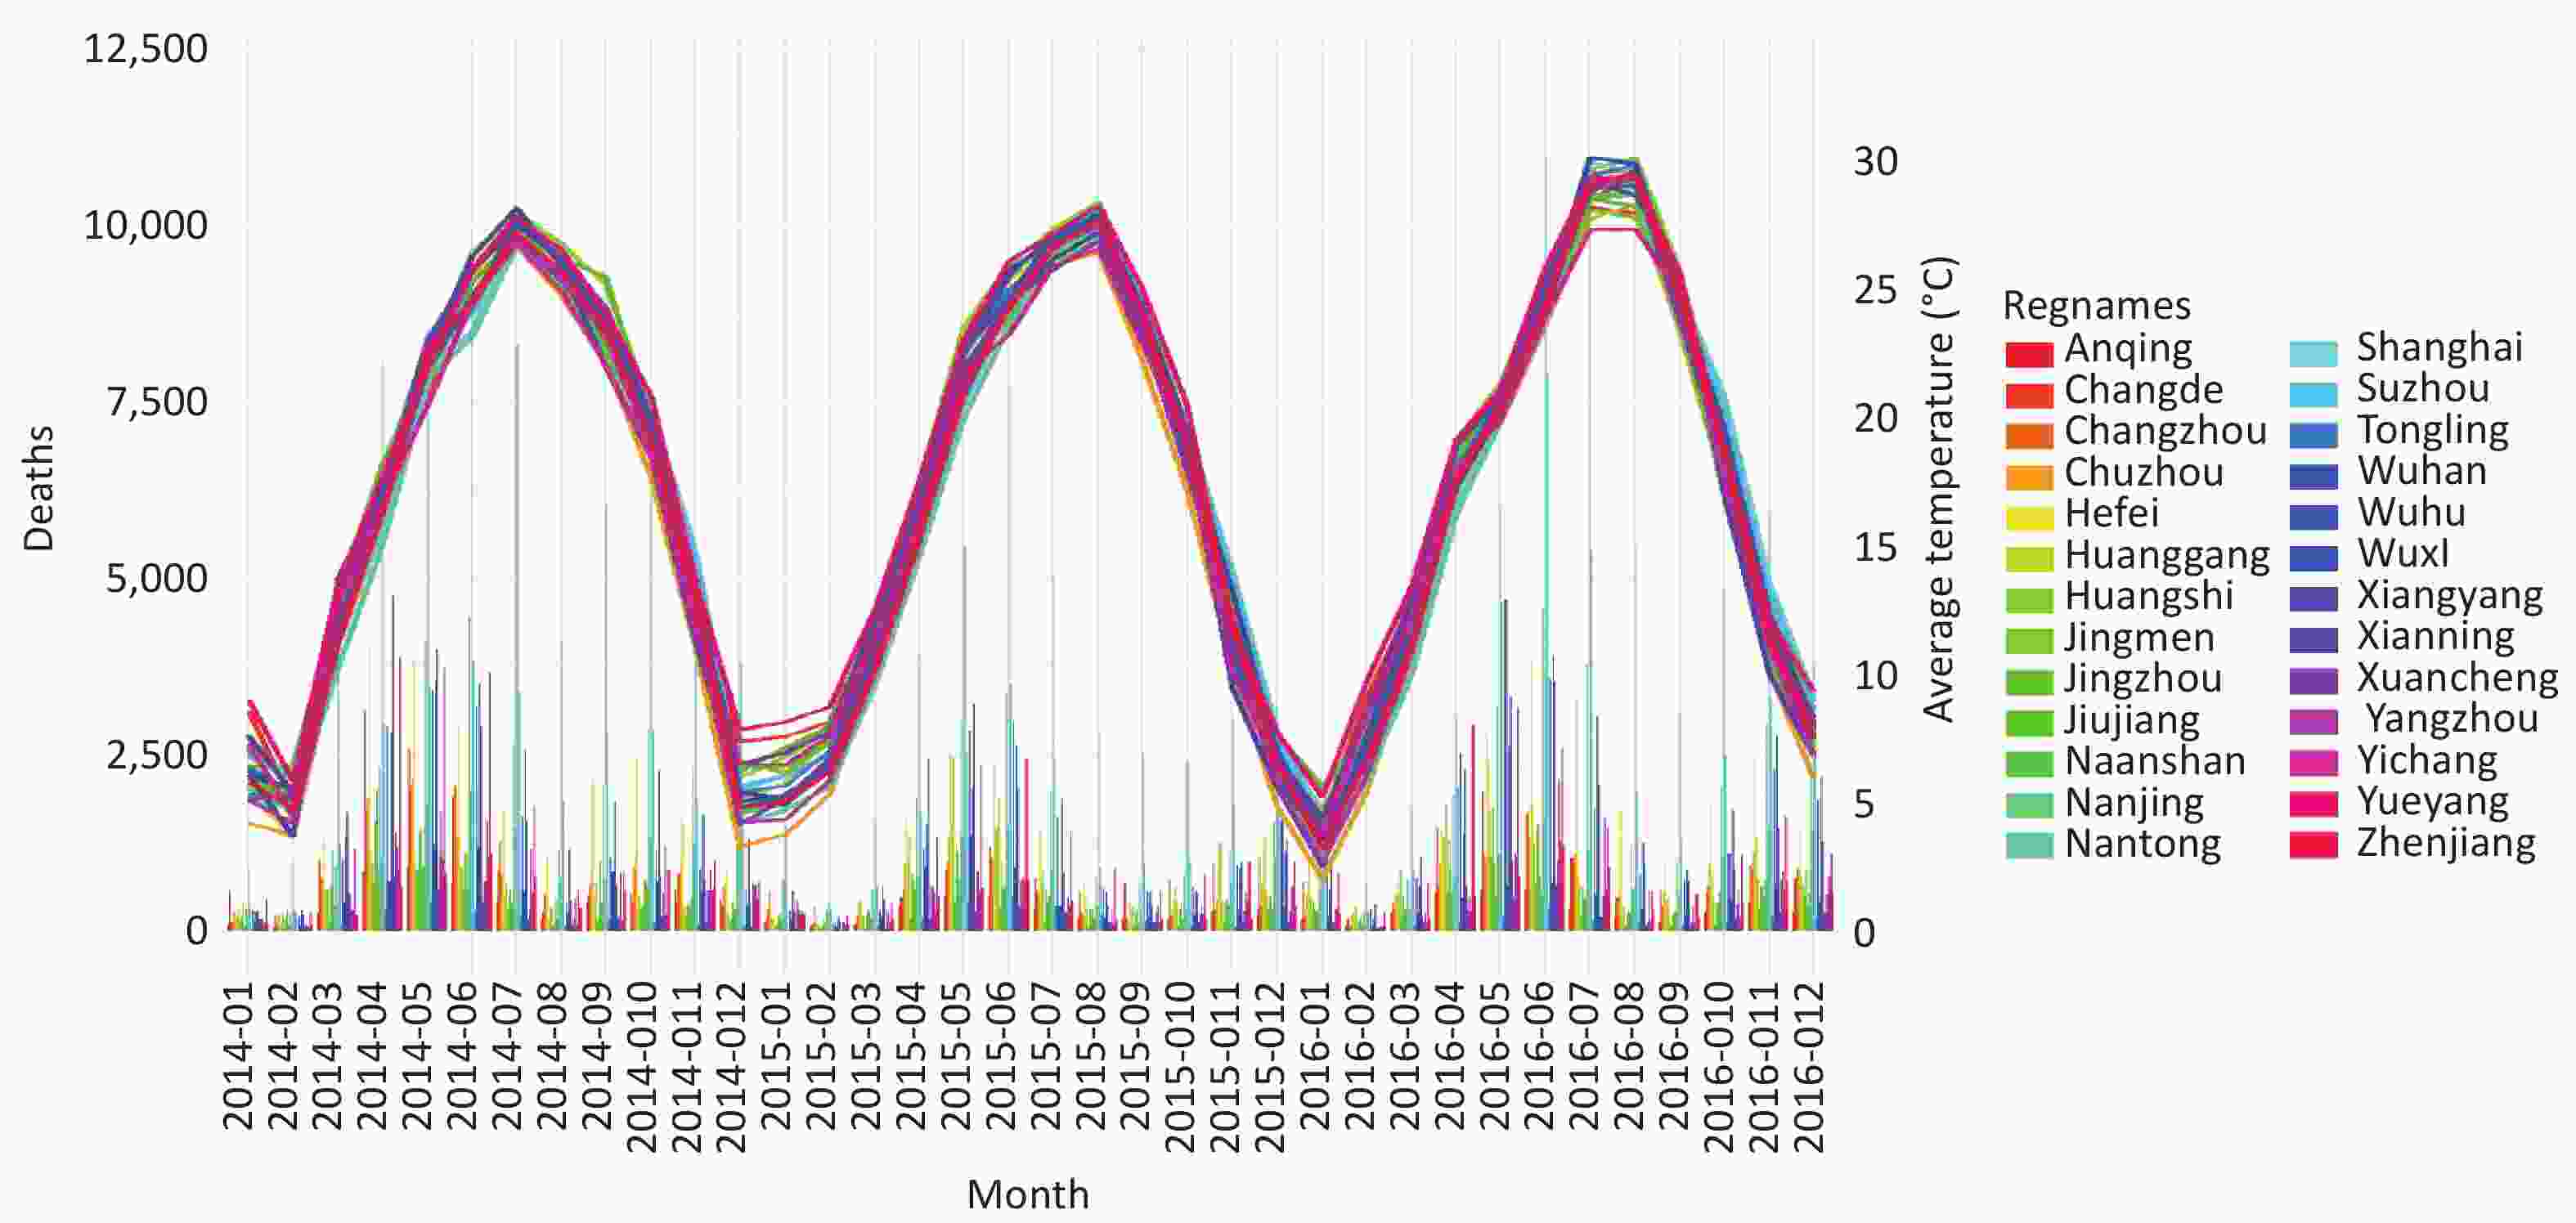
Figure S4. Temperature distribution and daily reported cases of hand, foot, and mouth disease in 26 research cities from 2014 to 2016.
-
The risk impact of all cities on the entire population based on temperature stratifications of 2.5%, 50.0%, and 97.5% is presented in Figures 4A, B and C. The results show that the risk impact was statistically significant in all cities except for Tongling and Xuancheng. The risk impact on females was significant for all cities and temperatures. For males, the risk impact was significant for Wuhan, Suzhou, and Jingmen, and not significant for Jiujiang, Nantong, and Tongling. For children under five years of age, the risk impact was significant for all cities and all three temperatures (Supplementary Table S3).
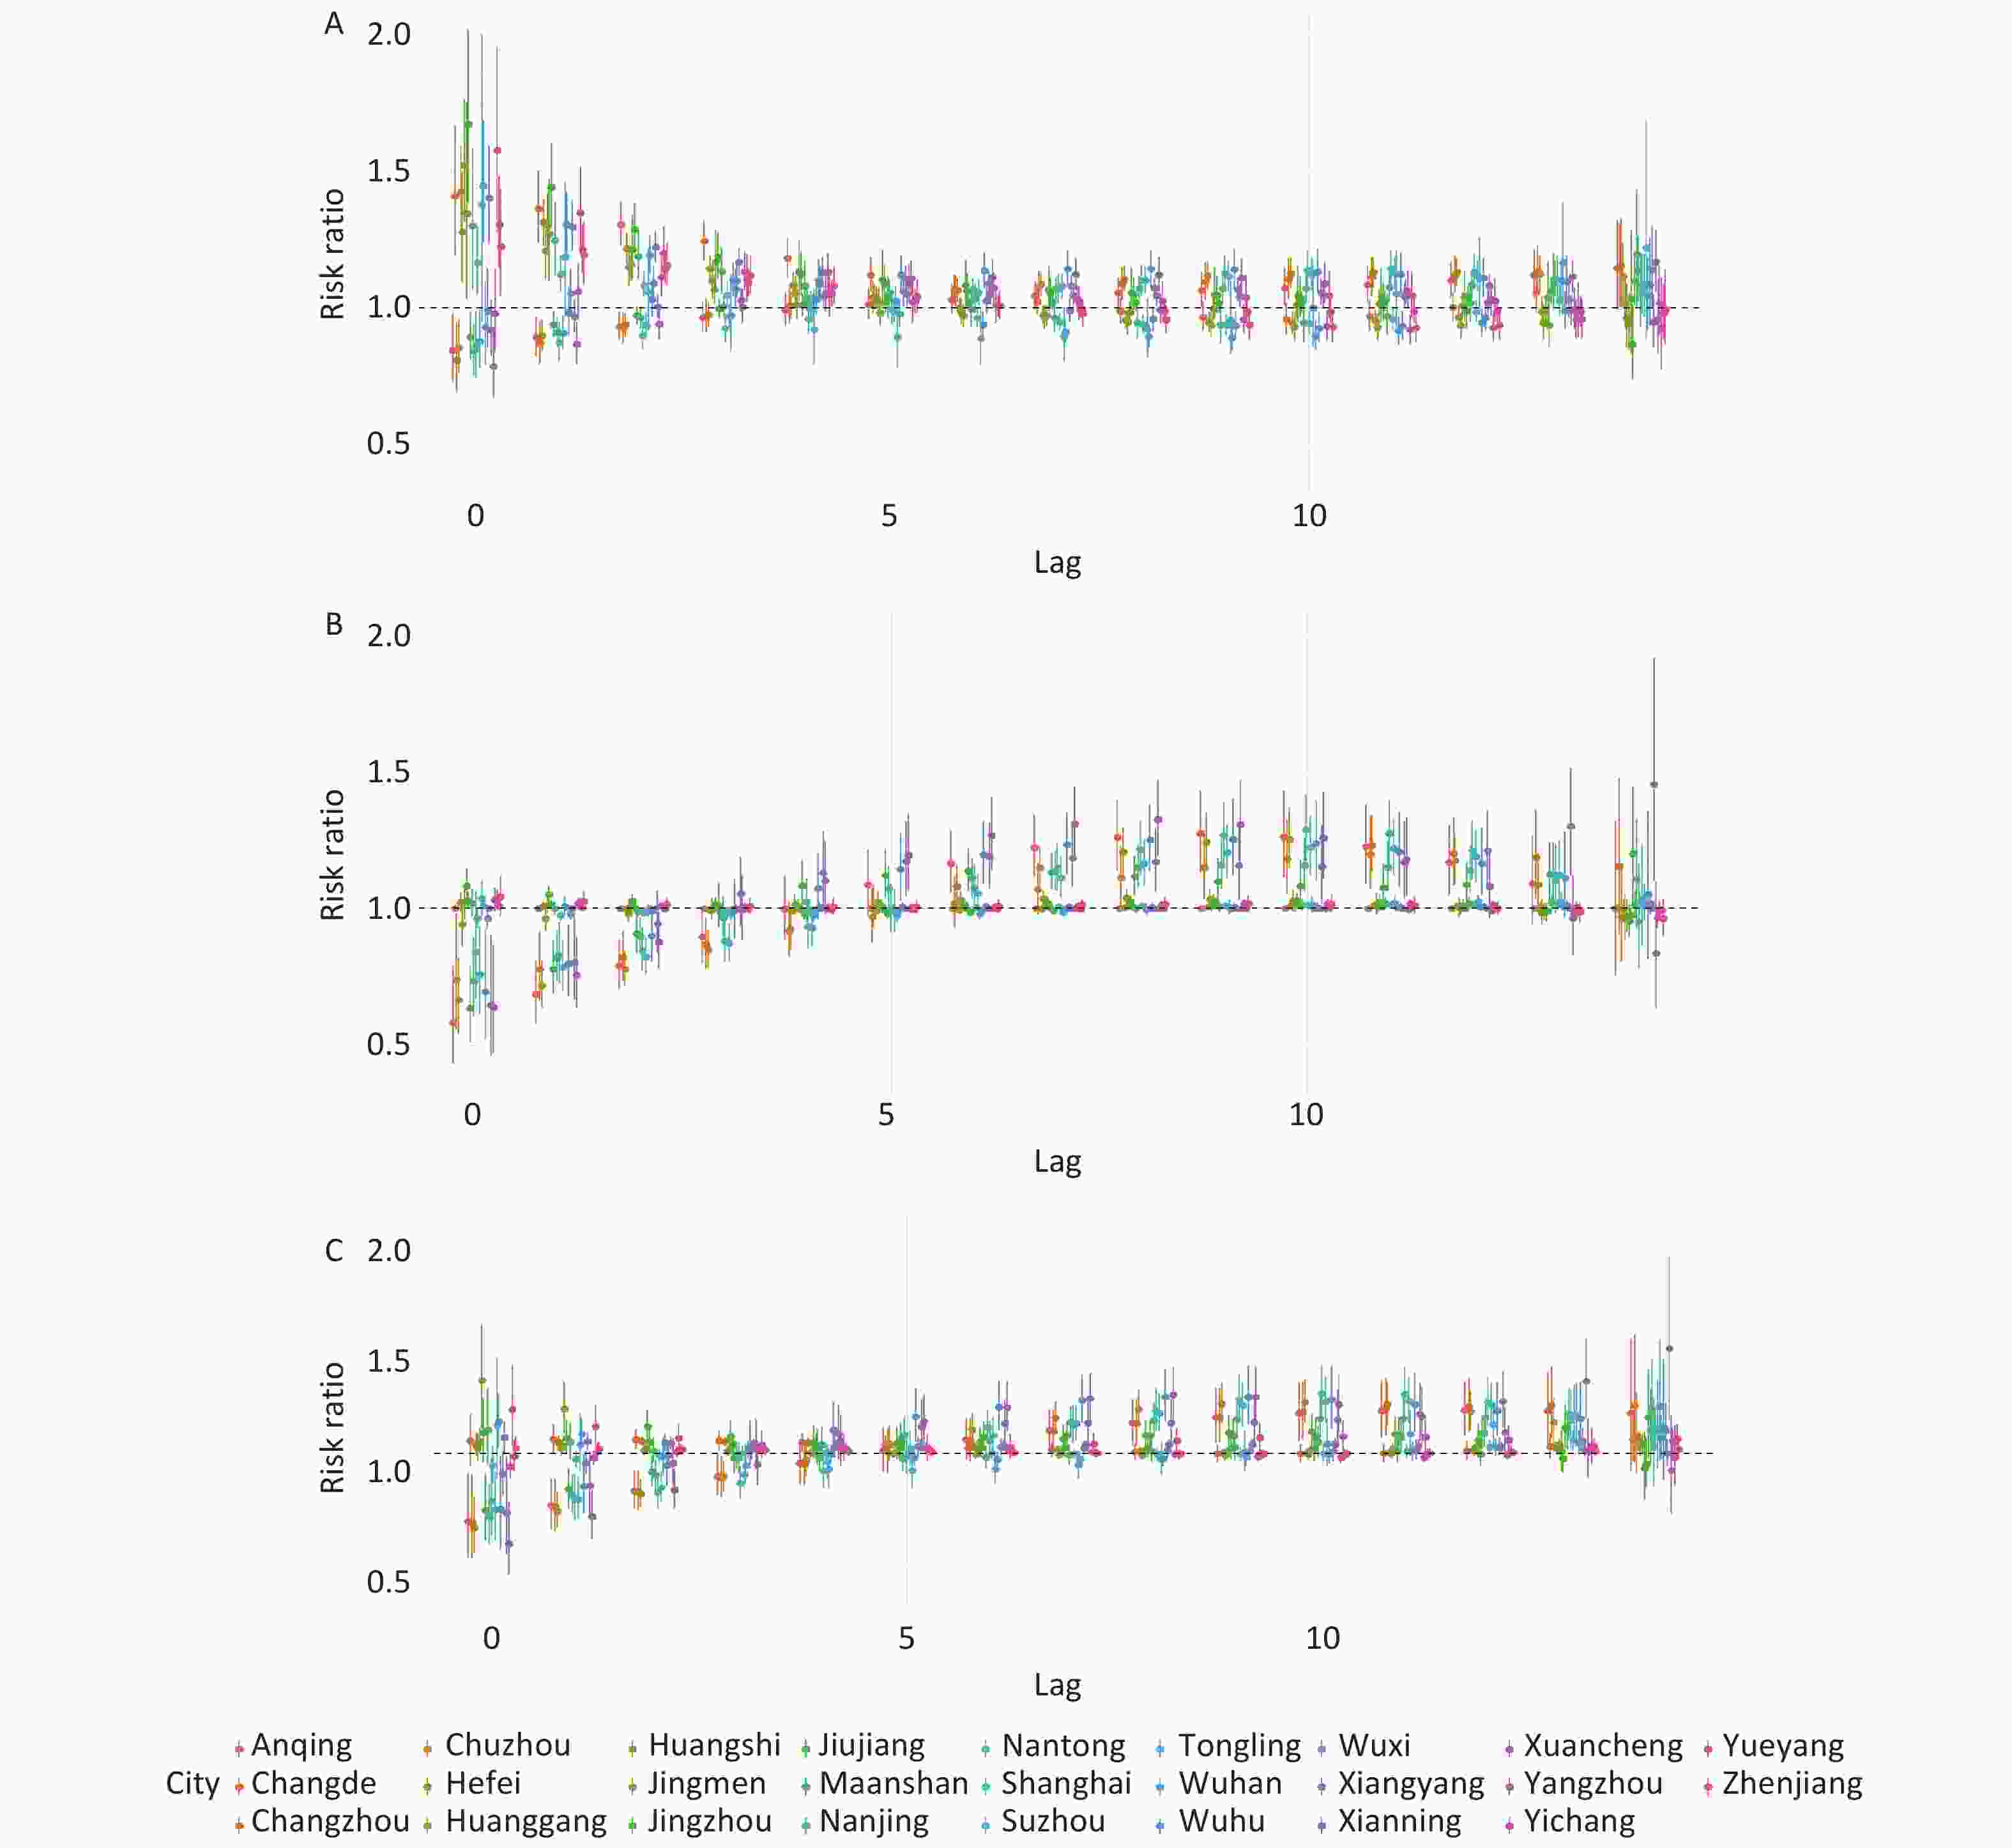
Figure 4. A, B, and C represent the impact of 0–14 day lags on different populations at the T average temperatures of 2.5%, 97.5%, and 50.0%.
City Temp (%) Total Population man woman Up to 5 years old City Temp (%) Total Population man woman Up to 5 years old Anqing 2.5 1.386
(0.838, 2.293)1.618
(0.867, 3.018)1.516
(0.617, 3.723)1.307
(0.783, 2.181)Shanghai 97.5 1.014
(0.91, 1.13)1.008
(0.895, 1.135)1.024
(0.907, 1.157)1.012
(0.908, 1.128)Changde 2.5 4.956
(2.872, 8.551)4.763
(2.796, 8.115)6.302
(3.074, 12.922)4.728
(2.73, 8.189)Suzhou 97.5 3.348
(1.594, 7.031)3.291
(1.463, 7.407)3.397
(1.412, 8.169)3.43
(1.62, 7.262)Changzhou 2.5 1.653 (0.949,2.879) 2.153 (1.103,4.2) 1.351 (0.62,2.943) 1.611 (0.917,2.83) Tongling 97.5 1.049
(0.879, 1.251)1.081
(0.876, 1.334)1.006
(0.781, 1.295)1.063
(0.885, 1.277)Chuzhou 2.5 1.928 (1.285, 2.892) 2.3 (1.331, 3.975) 2.16 (1.213, 3.848) 1.985 (1.235, 3.189) Wuhan 97.5 1.026
(0.972, 1.083)1.042
(0.981, 1.108)1
(0.967, 1.035)1.034
(0.979, 1.092)Hefei 2.5 2.272
(1.532, 3.37)2.188
(1.399, 3.424))2.407
(1.442, 4.018))2.469
(1.655, 3.682)Wuhu 97.5 2.938
(1.085, 7.952)4.779
(1.42, 16.081)1.434
(0.358, 5.744)2.64
(0.952, 7.323)Huanggang 2.5 1.332
(0.777, 2.285)1.271
(0.696, 2.32)1.462
(0.736, 2.904)1.392
(0.813, 2.383)Wuxi 97.5 1.019
(0.913, 1.137)1.048
(0.442, 2.484)1
(0.98, 1.021)1.016
(0.908, 1.136)Huangshi 2.5 2.198
(1.355, 3.564)1.892
(1.086, 3.297)2.939
(1.461, 5.91))2.18
(1.336, 3.558)Xiangyang 97.5 1(1, 1) 1.036
(0.946, 1.135)1.049
(0.929, 1.186)1
(1, 1)Jingmen 2.5 4.792
(2.087, 11.002)5.649
(1.997, 15.981)3.957
(1.219, 12.844)4.084
(1.748, 9.543)Xianning 97.5 4.141
(1.313, 13.066)3.276
(0.814, 13.191)6.316
(1.143, 34.897)4.27
(1.332, 13.687)Jingzhou 2.5 4.774
(2.623, 8.69)4.654
(2.478, 8.741)5.012
(2.219, 11.322)4.838
(2.647, 8.844)Xuancheng 97.5 2.112
(0.755, 5.909)2.585
(0.771, 8.67)1.596
(0.401, 6.348)1.998
(0.704, 5.667)Jiujiang 2.5 1.178
(0.881, 1.576)1.321
(0.928, 1.879))1.004
(0.827, 1.219)1.201
(0.897, 1.609)Yangzhou 97.5 1.007
(0.899, 1.127)1.062
(0.887, 1.271)1.084
(0.843, 1.394)1.004
(0.894, 1.127)Maanshan 2.5 2.574
(1.402, 4.725)2.154
(1.088, 4.265)3.600
(1.424, 9.102)2.541
(1.392, 4.635)Yichang 97.5 1.189
(1.056, 1.34)1.152
(0.991, 1.339)1.239
(1.053, 1.457)1.175
(1.04, 1.328)Nanjing 2.5 1.699
(1.156, 2.497)1.95
(1.265, 3.005)1.400
(0.878, 2.233)1.714
(1.151, 2.551)Yueyang 97.5 1.001
(0.958, 1.047)1.014
(0.93, 1.106)1.055
(0.837, 1.331)1.006
(0.923, 1.096)Nantong 2.5 1.424
(0.851, 2.383)1.240
(0.662, 2.321)1.705
(0.889, 3.27)1.344
(0.795, 2.274)Zhenjiang 97.5 1.159
(0.954, 1.41)1.099
(0.901, 1.34)1.293
(0.932, 1.795)1.138
(0.921, 1.407)Shanghai 2.5 1.215
(0.853, 1.73)1.259
(0.852, 1.859)1.153
(0.775, 1.716)1.23
(0.859, 1.759)Anqing 50 1.431
(0.565, 3.627)2.032
(0.645, 6.406)1.147
(0.84, 1.567)1.256
(0.488, 3.235)Suzhou 2.5 3.698
(2.397, 5.707))3.536
(2.198, 5.69)3.93
(2.358, 6.549)3.831
(2.468, 5.946)Changde 50 1.613
(1.099, 2.368)1.341
(1.1, 1.636)2.501
(1.501, 4.168)1.556
(1.057, 2.292)Tongling 2.5 1.639
(0.489, 5.492)1.789
(0.408, 7.841)1.454
(0.265, 7.97)2.109
(0.597, 7.449)Changzhou 50 1.463
(0.55, 3.89)1.937
(0.597, 6.283)1.176
(0.857, 1.614)1.45
(0.537, 3.917)Wuhan 2.5 1.401
(0.816, 2.407)1.425
(0.771, 2.633)1.353
(0.691, 2.646)1.463
(0.845, 2.534)Chuzhou 50 1.533
(0.752, 3.127)1.643
(1.28, 2.111)2.041
(0.741, 5.622)1.521
(1.264, 1.83)Wuhu 2.5 3.611
(2.055, 6.346)4.420
(2.217, 8.811)2.716
(1.244, 5.93)3.557
(1.996, 6.339)Hefei 50 1.585
(1.361, 1.847)1.634
(1.364, 1.956)1.516
(1.252, 1.837)1.601
(1.378, 1.859)Wuxi 2.5 1.313
(0.825, 2.09)1.240
(0.741, 2.076)1.457
(0.822, 2.586)1.440
(0.896, 2.314)Huanggang 50 1.135
(0.922, 1.398)1.13
(0.887, 1.441)1.152
(0.894, 1.484)1.137
(0.934, 1.385)Xiangyang 2.5 4.677
(3.16, 6.922)5.405
(3.327, 8.779)4.185
(2.575, 6.8)4.891
(3.289, 7.272)Huangshi 50 1.346
(1.116, 1.623)1.277
(1.051, 1.551)1.49
(1.105, 2.009)1.34
(1.108, 1.62)Xianning 2.5 1.907
(1.318, 2.761)1.755
(1.119, 2.752)2.227
(1.287, 3.852)1.964
(1.35, 2.857)Jingmen 50 3.342
(1.9, 5.878)2.949
(1.461, 5.954)3.975
(1.776, 8.893)3.14
(1.765, 5.587)Xuancheng 2.5 1.34
(0.783, 2.292)1.109
(0.587, 2.095)1.788
(0.876, 3.651)1.334
(0.775, 2.298)Jingzhou 50 1.446
(0.944, 2.217)1.211
(0.888, 1.653)1.931
(1.071, 3.484)1.482
(0.963, 2.28)Yangzhou 2.5 1.356
(0.751, 2.448)1.310
(0.673, 2.547)1.631
(0.702, 3.789)1.281
(0.7, 2.346)Jiujiang 50 1.365
(0.714, 2.607)1.521
(0.694, 3.33))1.199
(0.563, 2.551)1.412
(0.736, 2.707)Yichang 2.5 3.449
(1.762, 6.753)2.743
(1.171, 6.426)4.662
(1.861, 11.678)3.156
(1.583, 6.289)Maanshan 50 1.722
(1.134, 2.615)1.486
(1.042, 2.12)2.25
(1.182, 4.285)1.622
(1.109, 2.372)Yueyang 2.5 1.989
(1.298, 3.046)2.120
1.231, 3.652)1.954
(1.166, 3.272)1.922
(1.265, 2.92)Nanjing 50 2.175
(1.105, 4.28)3.059
(1.432, 6.535)1.331
(0.584, 3.032)2.09
(1.038, 4.205)Zhenjiang 2.5 1.485
(0.797, 2.768)1.666
(0.774, 3.587)1.295
(0.565, 2.967)1.316
(0.693, 2.5)Nantong 50 1.69
(0.737, 3.874)1.581
(0.576, 4.343)1.838
(0.644, 5.25)1.604
(0.688, 3.738)Anqing 97.5 1.416
(0.514, 3.903)2.027
(0.587, 7.002)1.118
(0.716, 1.745)1.292
(0.46, 3.625)Shanghai 50 1.116
(0.895, 1.392)1.152
(0.904, 1.469)1.067
(0.832, 1.369)1.113
(0.891, 1.391)Changde 97.5 1.014
(0.954, 1.077)1.087
(0.857, 1.377)1.094
(1.01, 1.185)1.012
(0.952, 1.075)Suzhou 50 6.529
(3.169, 13.454)6.198
(2.806, 13.691)6.983
(2.979, 16.367)6.891
(3.315, 14.322)Changzhou 97.5 1.209
(0.445, 3.282)1.568
(0.472, 5.208)1.003
(0.927, 1.084)1.209
(0.438, 3.341)Tongling 50 1.491
(0.783, 2.838)1.94
(0.901, 4.175)1.026
(0.407, 2.584)1.7
(0.87, 3.321)Chuzhou 97.5 1.065
(0.505, 2.249)1.011
(0.948, 1.079)1.716
(0.593, 4.968)1.049
(0.932, 1.18)Wuhan 50 1.379
(0.963, 1.976)1.51
(1.007, 2.264))1.2
(0.781, 1.844)1.49
(1.035, 2.146)Hefei 97.5 1.055
(0.958, 1.162)1.045
(0.949, 1.15)1.072
(0.931, 1.234)1.069
(0.958, 1.193)Wuhu 50 4.503
(1.727, 11.742)7.695
(2.386, 24.821)2.052
(0.542, 7.761)4.162
(1.559, 11.109)Huanggang 97.5 1.068
(0.79, 1.445)1.05
(0.77, 1.43)1.105
(0.728, 1.675)1.093
(0.793, 1.507)Wuxi 50 1.241
(0.935, 1.646)1.27
(0.547, 2.952)1.227
(0.922, 1.633)1.279
(0.958, 1.707)Huangshi 97.5 1.091
(0.898, 1.327)1.127
(0.866, 1.468)1.051
(0.838, 1.318)1.083
(0.888, 1.32)Xiangyang 50 (1.759
(1.421, 2.177)2.006
(1.455, 2.764)1.602
(1.325, 1.937)1.773
(1.428, 2.2)Jingmen 97.5 1.319
(1.078, 1.613)1.224
(0.953, 1.572)1.463
(1.096, 1.952)1.294
(1.054, 1.589)Xianning 50 4.152
(1.464, 11.772)3.443
(0.971, 12.213)5.849
(1.246, 27.467)4.405
(1.531, 12.673)Jingzhou 97.5 1.053
(0.954, 1.162)1.004
(0.909, 1.11)1.155
(1.007, 1.324)1.059
(0.958, 1.17)Xuancheng 50 1.443
(0.563, 3.699)1.37
(0.449, 4.182)1.588
(0.455, 5.535)1.452
(0.56, 3.763)Jiujiang 97.5 1.527(
0.736, 3.169)1.511
(0.628, 3.631)1.65
(0.653, 4.169)1.628
(0.781, 3.393)Yangzhou 50 1.043
(0.859, 1.265)1.057
(0.877, 1.274)1.186
(0.722, 1.945)1.018
(0.834, 1.242)Maanshan 97.5 1.031
(0.899, 1.182)1.000
(0.972, 1.029)1.121
(0.907, 1.384)1.005
(0.927, 1.089)Yichang 50 2.381
(1.456, 3.892)2.199
(1.181, 4.092)2.639
(1.346, 5.176)2.219
(1.34, 3.674)Nanjing 97.5 1.876
(0.93, 3.784)2.499
(1.139, 5.483)1.234
(0.525, 2.902)1.743
(0.844, 3.599)Yueyang 50 1.201
(0.954, 1.511)1.279
(0.878, 1.865)1.172
(0.981, 1.399)1.199
(0.98, 1.467)Nantong 97.5 1.972
(0.838, 4.64)2.144
(0.758, 6.064))1.753
(0.592, 5.19)1.936
(0.809, 4.637)Zhenjiang 50 1.151
(0.957, 1.385)1.254
(0.976, 1.611)1.053
(0.872, 1.27)1.103
(0.918, 1.324)Table S3. Effect values of a 0-14 day lag for different population groups at a TMean temperature of 2.5%, 50% and 97.5%
Variations in the effect values of the total population, males, females, and children under five years of age at different temperatures in each city were observed. The results showed that in cities, such as Changde and Wuhu, the RR of females was notably higher than that in other populations. Overall, there appeared to be discrepancies in the impact of temperature on HFMD across different regions. Particularly, in cities with temperatures at the median, such as JiuJiang and Changde, the effect of temperature on the incidence of HFMD was found to be significantly higher than that in other cities.
-
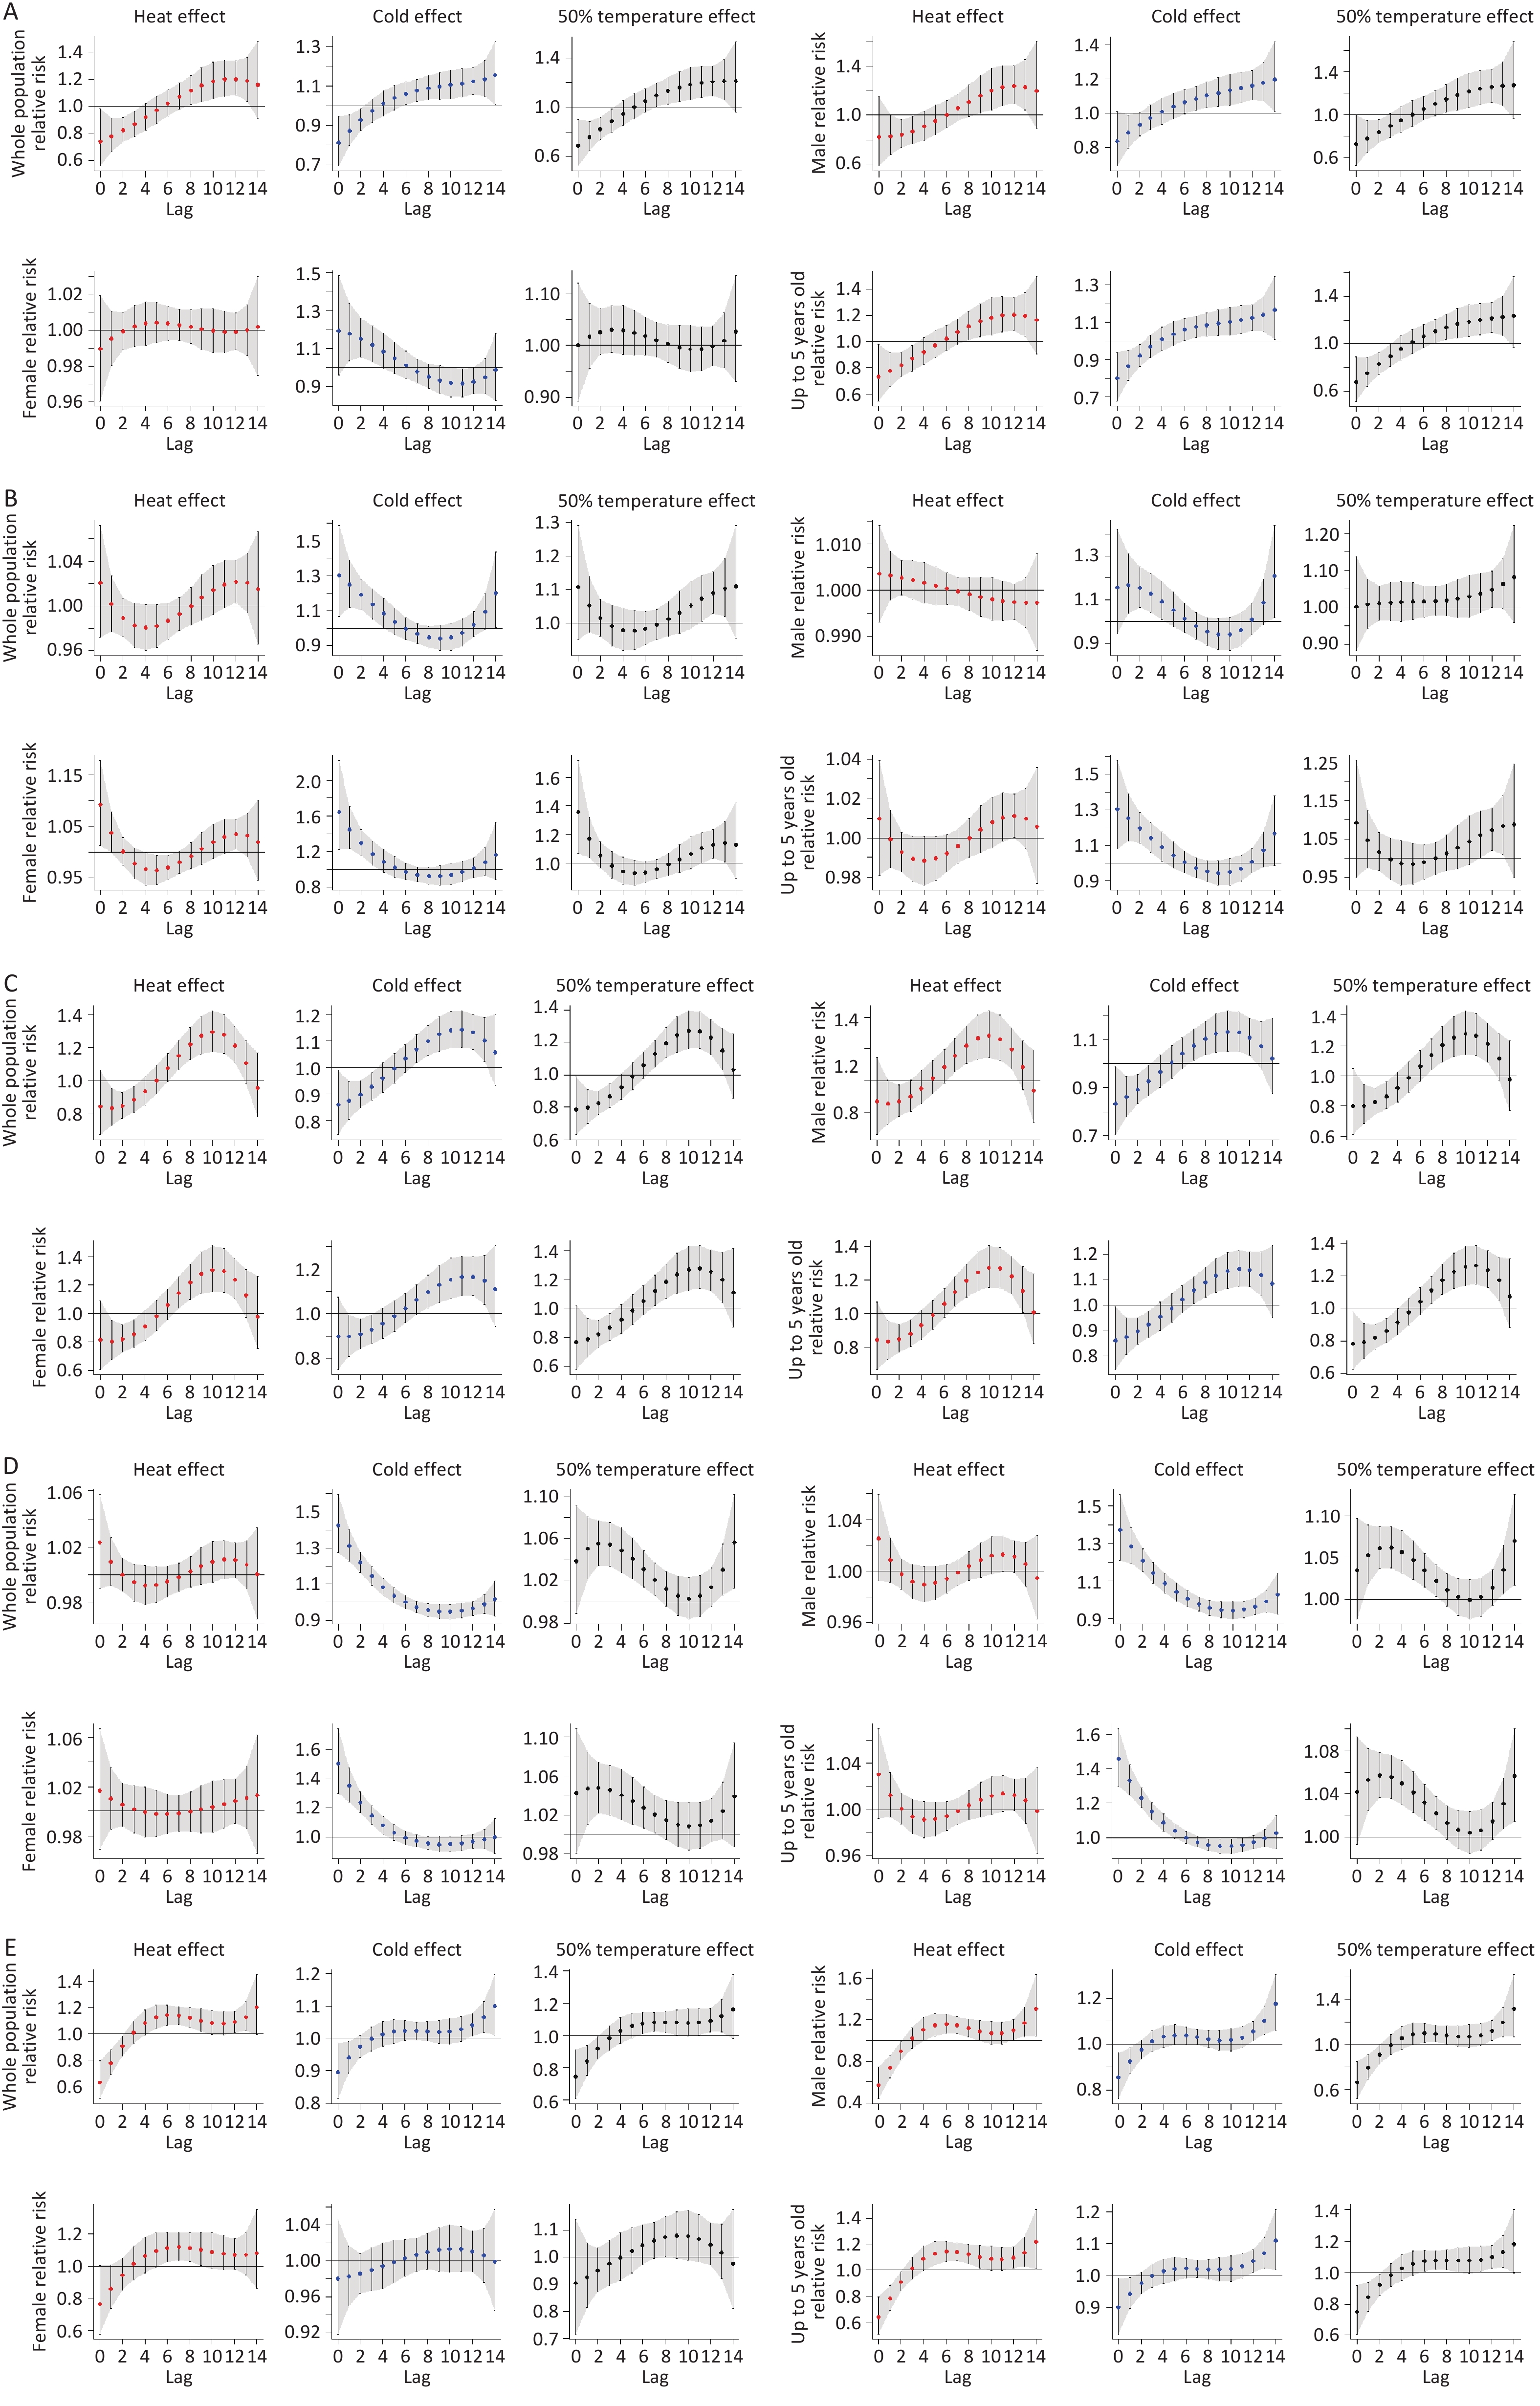
The 26 cities were divided into five groups based on the variation in RR with different lag times and temperatures (Supplementary Figure S4). Group 1 had an RR that initially increased with temperature and then decreased; the RR also decreased initially and then increased with an increase in lag days. This group included Zhenjiang, Yichang, Tongling, Shanghai, Ma’anshan, Jingzhou, Huangshi, and Changde (Figure 5A). Group 2 had an RR that first increased and then decreased with increasing temperature, and decreased as the lag days increased. This group mainly included Yueyang, Xiangyang, Huanggang, and Hefei (Figure 5B). Group 3 had an RR that initially increased with temperature and then decreased, and the RR also increased and then decreased as the number of lag days increased. This group included Jiujiang, Nanjing, Nantong, Suzhou, Wuhu, Xuancheng, Xianning, Chuzhou, Changzhou, and Anqing (Figure 5C). Group 4 had an RR that first decreased and then increased with temperature, and first decreased and then increased with an increase in lag days. This group mainly included Jingmen and Wuhan (Figure 5D). Group 5 had an RR that initially increased with temperature and then decreased, and the RR initially increased and then decreased with an increase in lag time. This group included Yangzhou and Wuxi (Figure 5E).
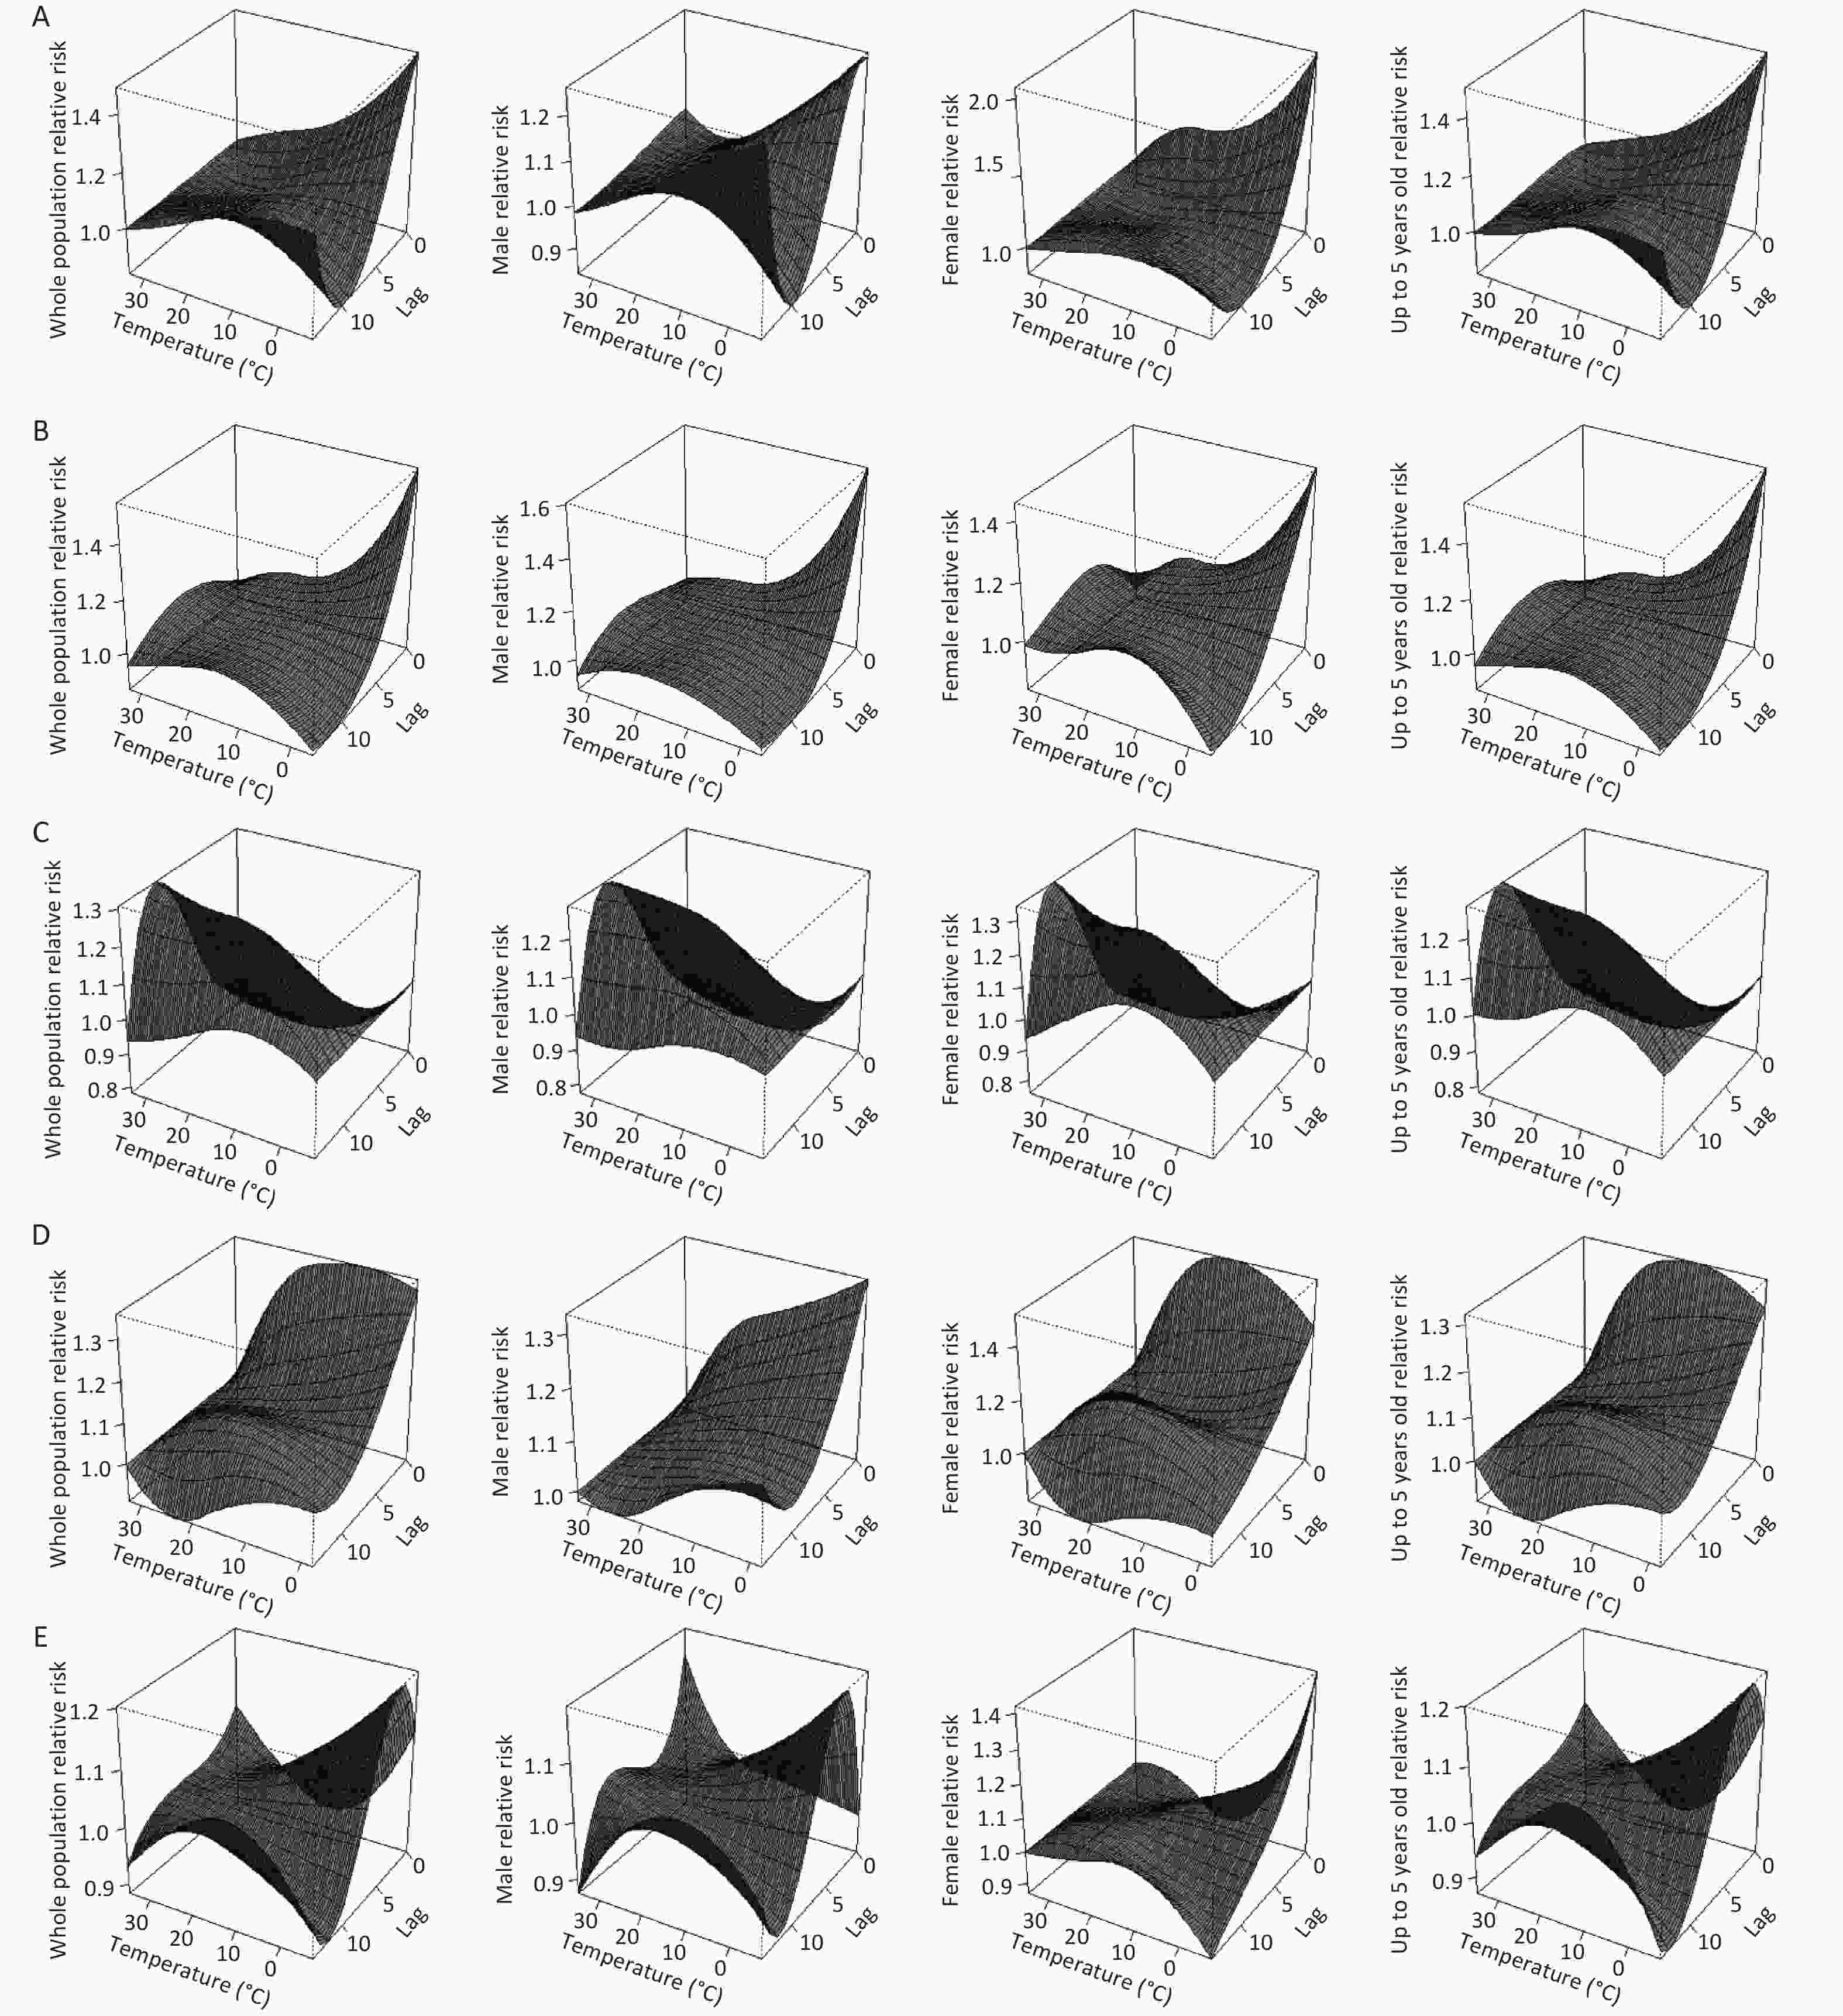
Figure 5. The total population, relative risks of males, females, and children under five years old in cities A, B, C, D, and E show different trends.
The Theil index based on the 26 cities is shown in Table 1. The overall Theil index was 0.0418, indicating a disparity in the incidence of HFMD between the 26 cities. The highest Theil index was 0.1808 in Group 6C, indicating a high incidence of HFMD in this group. The lowest Theil index was 0.0119 in Group 6A, indicating a relatively low risk of HFMD. The inter-group Theil index was 0.0065, indicating a lower risk of HFMD among the different groups in the 26 cities. The intra-group Theil index was 0.0112, which was higher than the inter-group index, suggesting that differences within a group had a greater impact on the risk of developing HFMD in children.
Variables 6A 6B 6C 6D 6E Group Inter Total Theil index 0.0119 0.0198 0.1808 0.0726 0.0261 0.0112 0.0065 0.0418 Table 1. Theil index of child mortality in the 26 cities
-
The 2.5th, 50th, and 97.5th percentiles of temperature were referred to as low, moderate, and high temperatures, respectively. Based on the changes in RR at different temperatures, the 26 cities were divided into five types, as shown in Annex 2 (Supplementary Figure S4). The first type had an RR that first increased and then decreased with the number of lag days, with an initial RR of < 1; females appeared to be affected by extremely cold and medium temperatures, and this type mainly included Anqing, Changzhou, and Chuzhou Wuxi (Figure 6A). The second type had an RR that first decreased and then increased with the number of lag days, with an initial RR of > 1; all studied populations were subjected to the effect of cold and hot temperatures in the same pattern, and this type mainly included Changde, Ma’anshan, Tongling, and Wuhan (Figure 6B). The third type had an RR that first increased and then decreased with the number of lag days, with an initial RR of < 1; all studied populations were subjected to the effects of cold and hot temperatures in the same pattern, which mainly included Huanggang, Nanjing, Nantong, Shanghai, Suzhou, Wuhu, Xiangyang, and Xuancheng (Figure 6C). The fourth type had an RR that first decreased, then increased, and decreased with the number of lag days, with an initial RR of > 1; all studied populations were subjected to the same effect of cold and hot temperatures. This type mainly included Hefei, Huangshi, Jingmen, Jingzhou, Yangzhou, Yichang, Yueyang, and Zhenjiang (Figure 6D). The fifth type had an RR that first increased, and then decreased and increased with the number of lagging days, with an initial RR of < 1; all studied populations were subjected to the same effect of cold and hot temperatures, and this type mainly included XianNing and JiuJiang (Figure 6E).
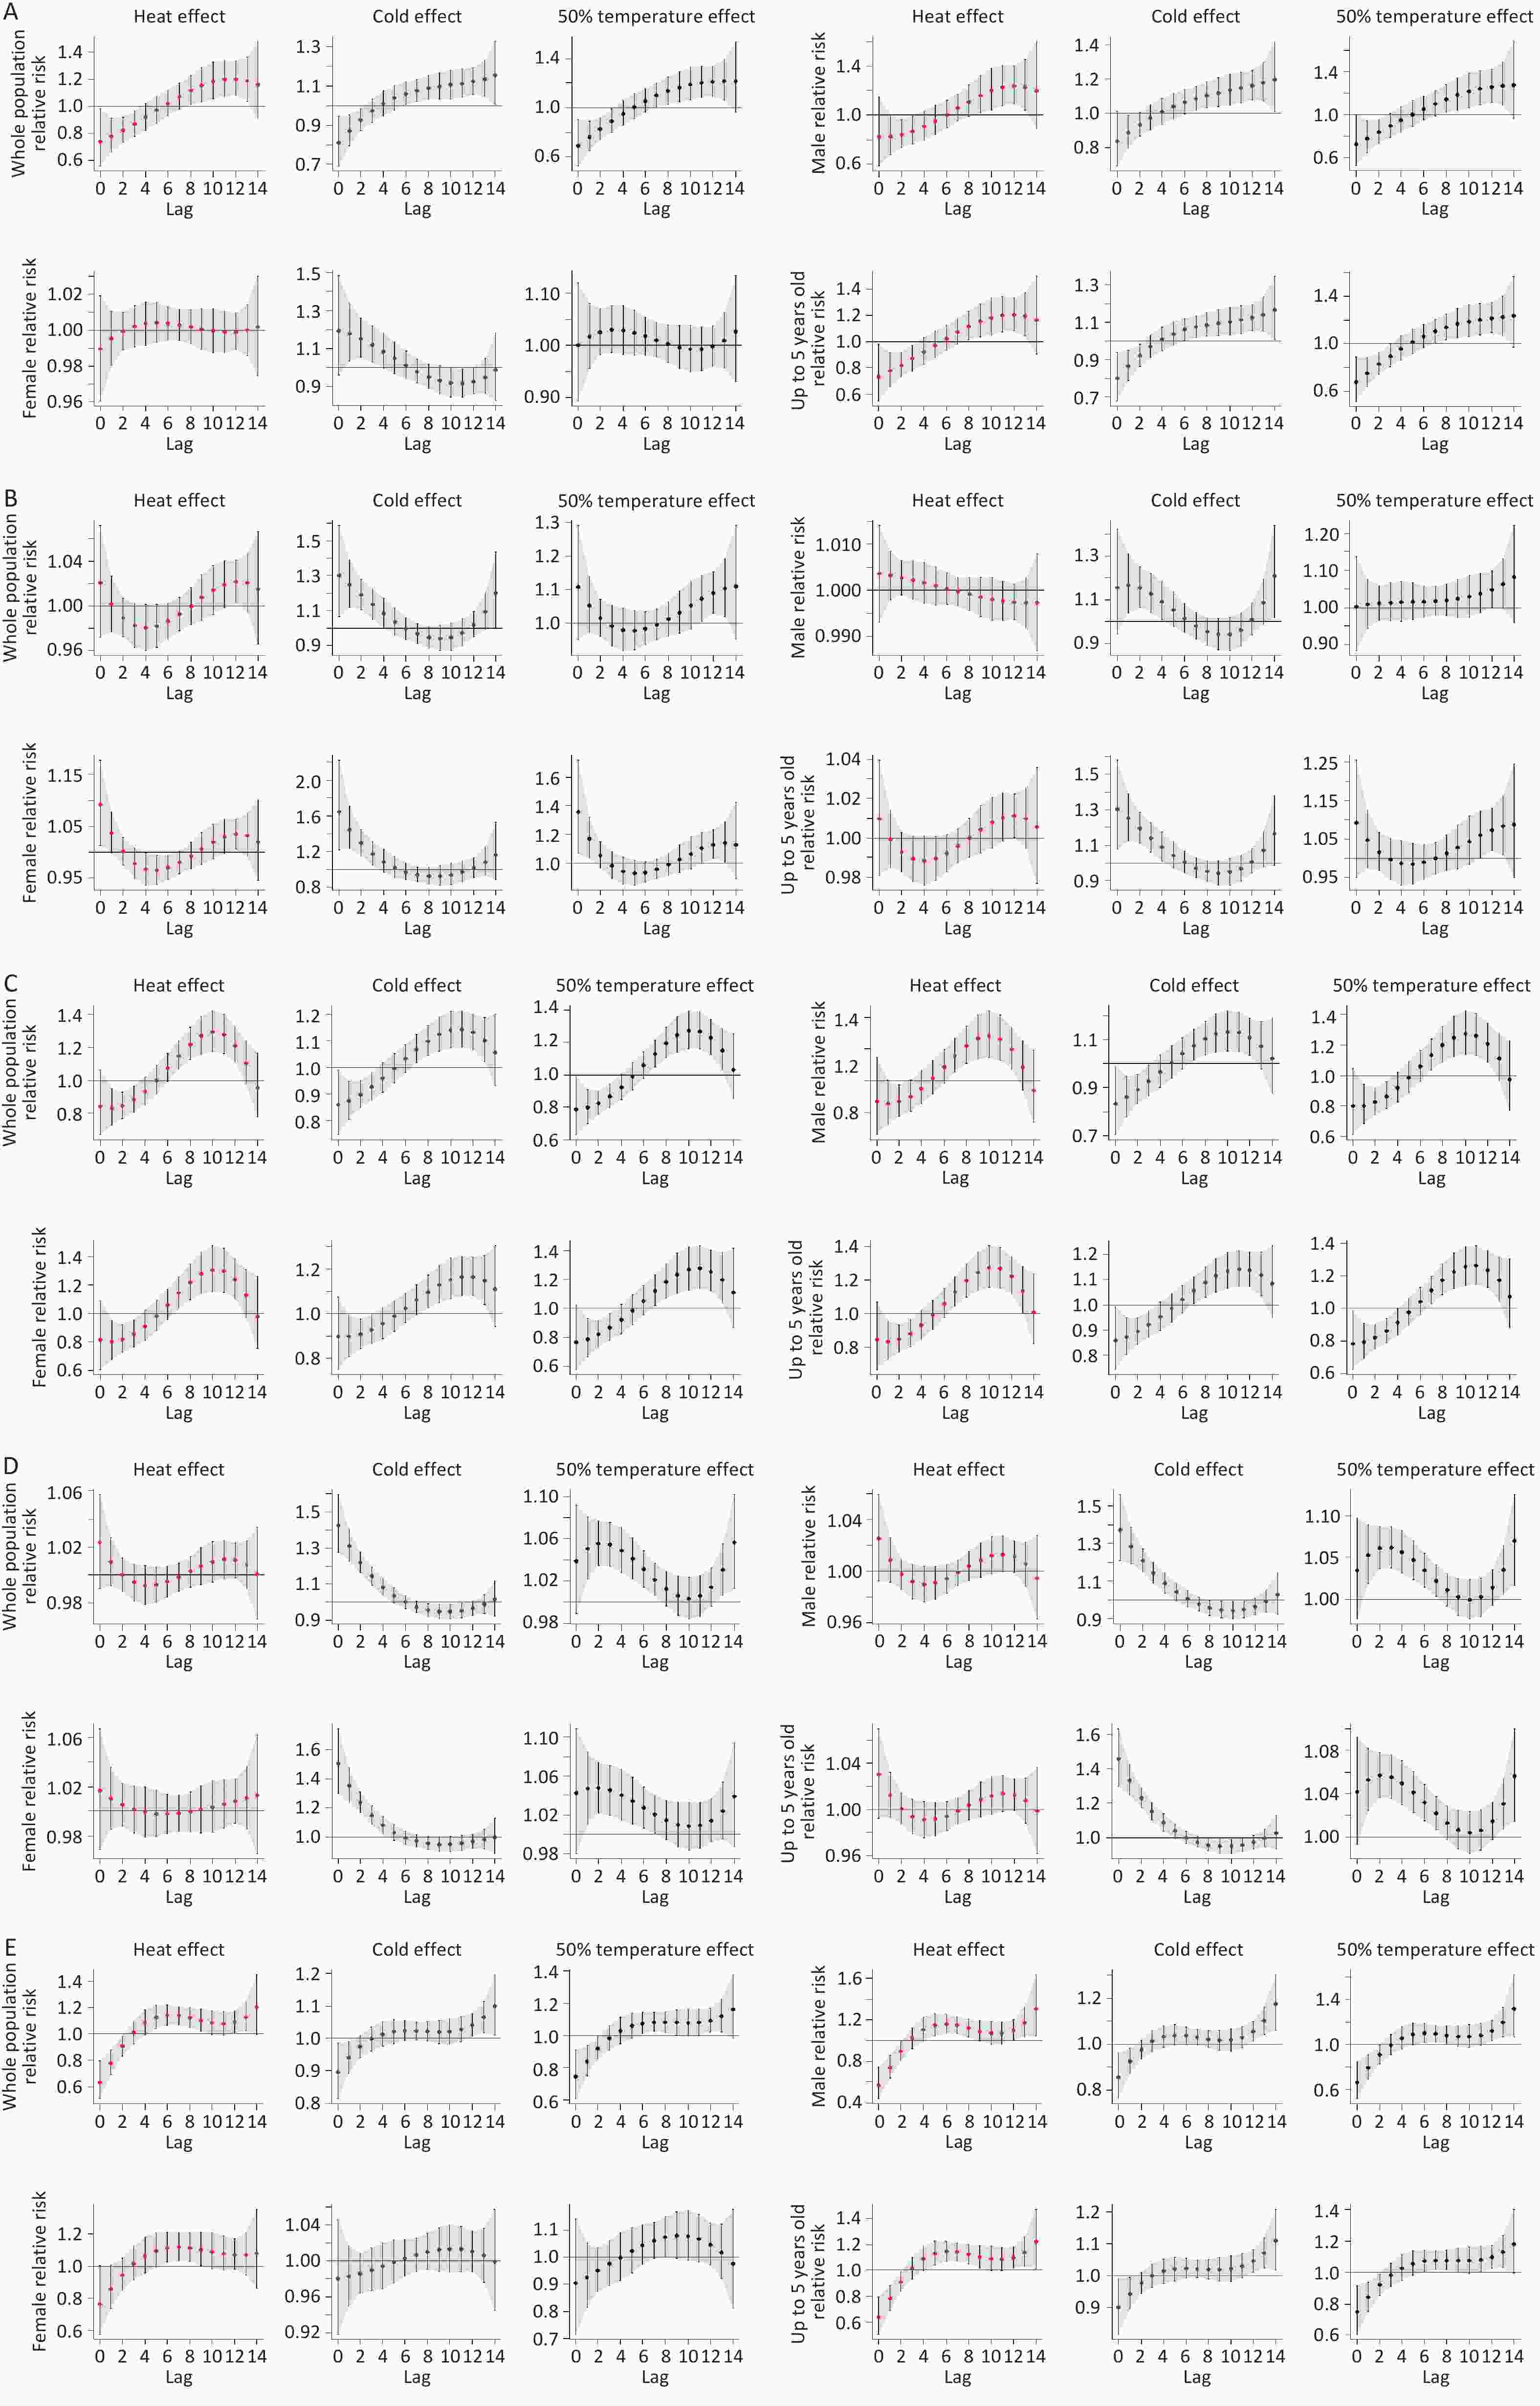
Figure 6. The different trends of relative risks in five cities, A, B, C, D, and E, at different temperatures affect the total population (including males, females, and children under 5 years old).
The Theil indices of all groups are shown in Table 2. The overall Theil index was 0.0418, indicating that the incidence of HFMD varied between the 26 cities. The highest Theil index was 0.1183 in Group 7A, indicating a high incidence of HFMD in this group. The lowest Theil index was 0.0076 in Group 7E, indicating a lower risk of HFMD in this group. The inter-group Theil index was 0.0156, indicating a higher risk of HFMD among different groups, and the inter-group Theil index was 0.0076, lower than the inter-group index, indicating a moderate risk of disease within the same group; thus, the inter-group differences were more significant.
Variables 7A 7B 7C 7D 7E Group Inter Total Theil index 0.1183 0.0092 0.0157 0.0150 0.0053 0.0079 0.0159 0.0418 Table 2. Thail index of child mortality in the 26 cities
-
The effect of the maximum lag time is shown in the cross-basis matrix in Figure 2. The maximum lag times were set at intervals of 7, 14, 21, and 28 d. The results indicated that, despite the variation in the maximum lag time, the overall effect remained stable and consistent.
-
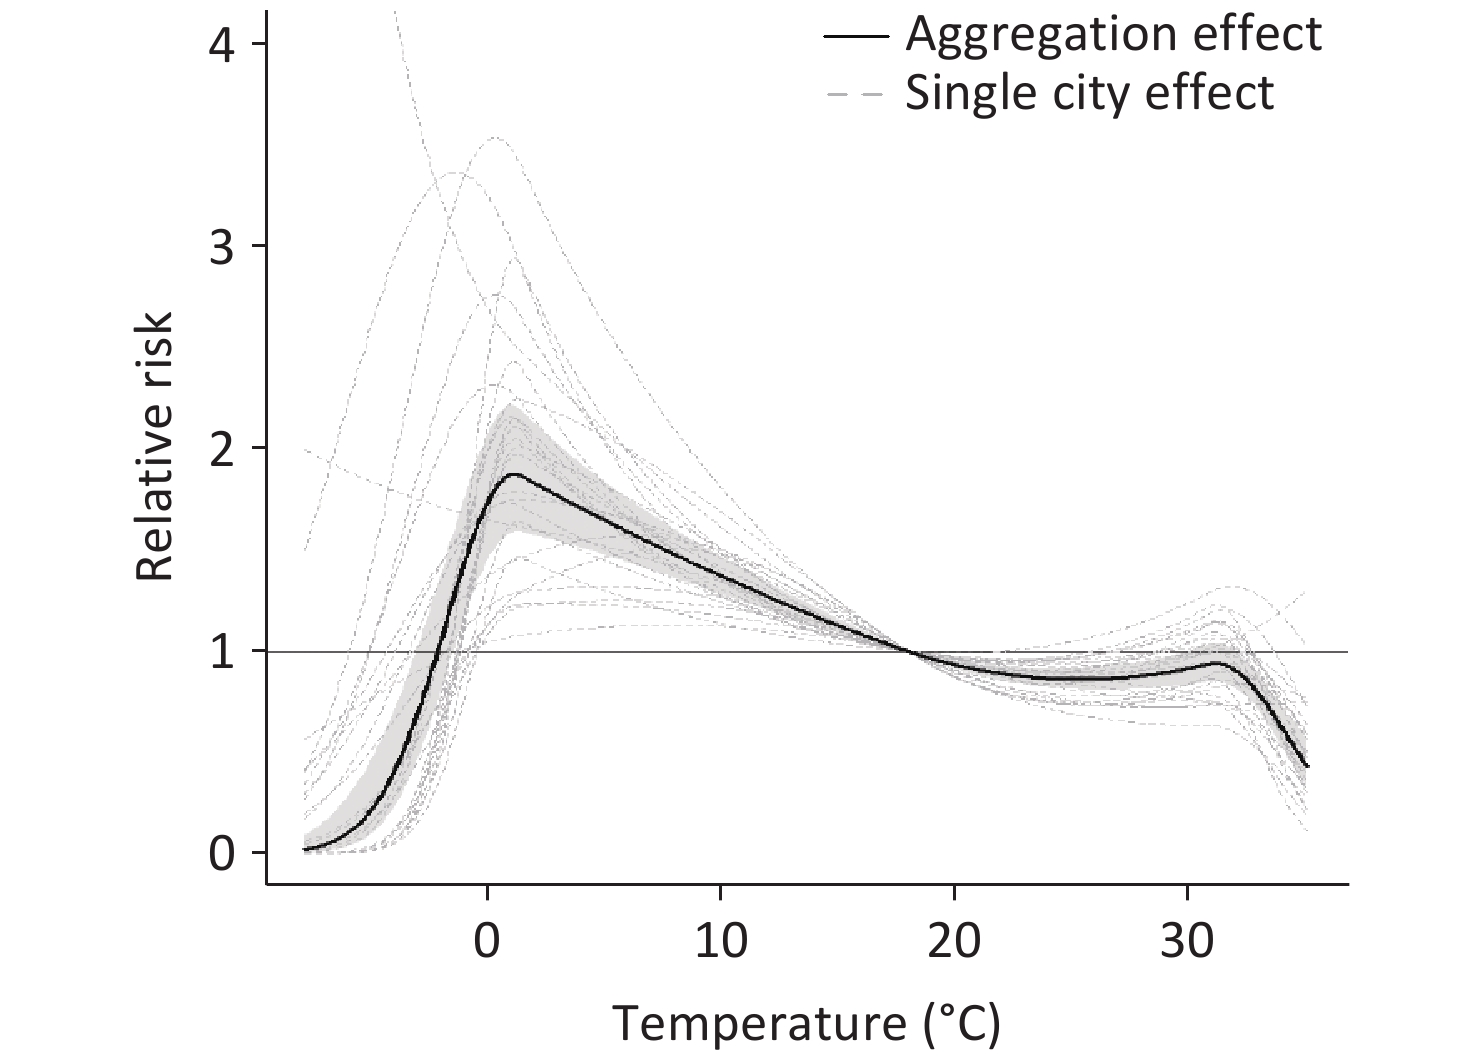
Cochran’s Q test and the I2 statistic for heterogeneity with Q = 418.296 (P < 0.001) indicating a high heterogeneity of the meta-regression model and a high degree of heterogeneity (I2 = 72.5%). The random-effects meta-analysis suggested a nonlinear relationship between temperature and HFMD transmission, with two peaks of RR at 1.30 °C (1.834, 95% CI: 1.204–2.794) and 31.4 °C (1.143, 95% CI: 0.901–1.451), forming an M shape (Figure 7). The exposure-response relationship in each city and the overall curve of the 26 cities showed a similar trend, with the first peak being higher than the latter. The most significant effect of temperature on HFMD was at –2 to 18.1 °C. Our analysis uncovered a striking consistency in the exposure-response relationship between temperature and HFMD, as evident in both the individual city summary curves and the combined curve encompassing all 26 cities. Notably, the initial peaks in these curves were markedly more pronounced than any subsequent peaks, suggesting a robust pattern of how temperature modulates the transmission dynamics of HFMD. Despite the heterogeneity observed across the study, this consistency underscores the existence of fundamental commonalities in the mechanisms by which temperature influences the spread of HFMD.
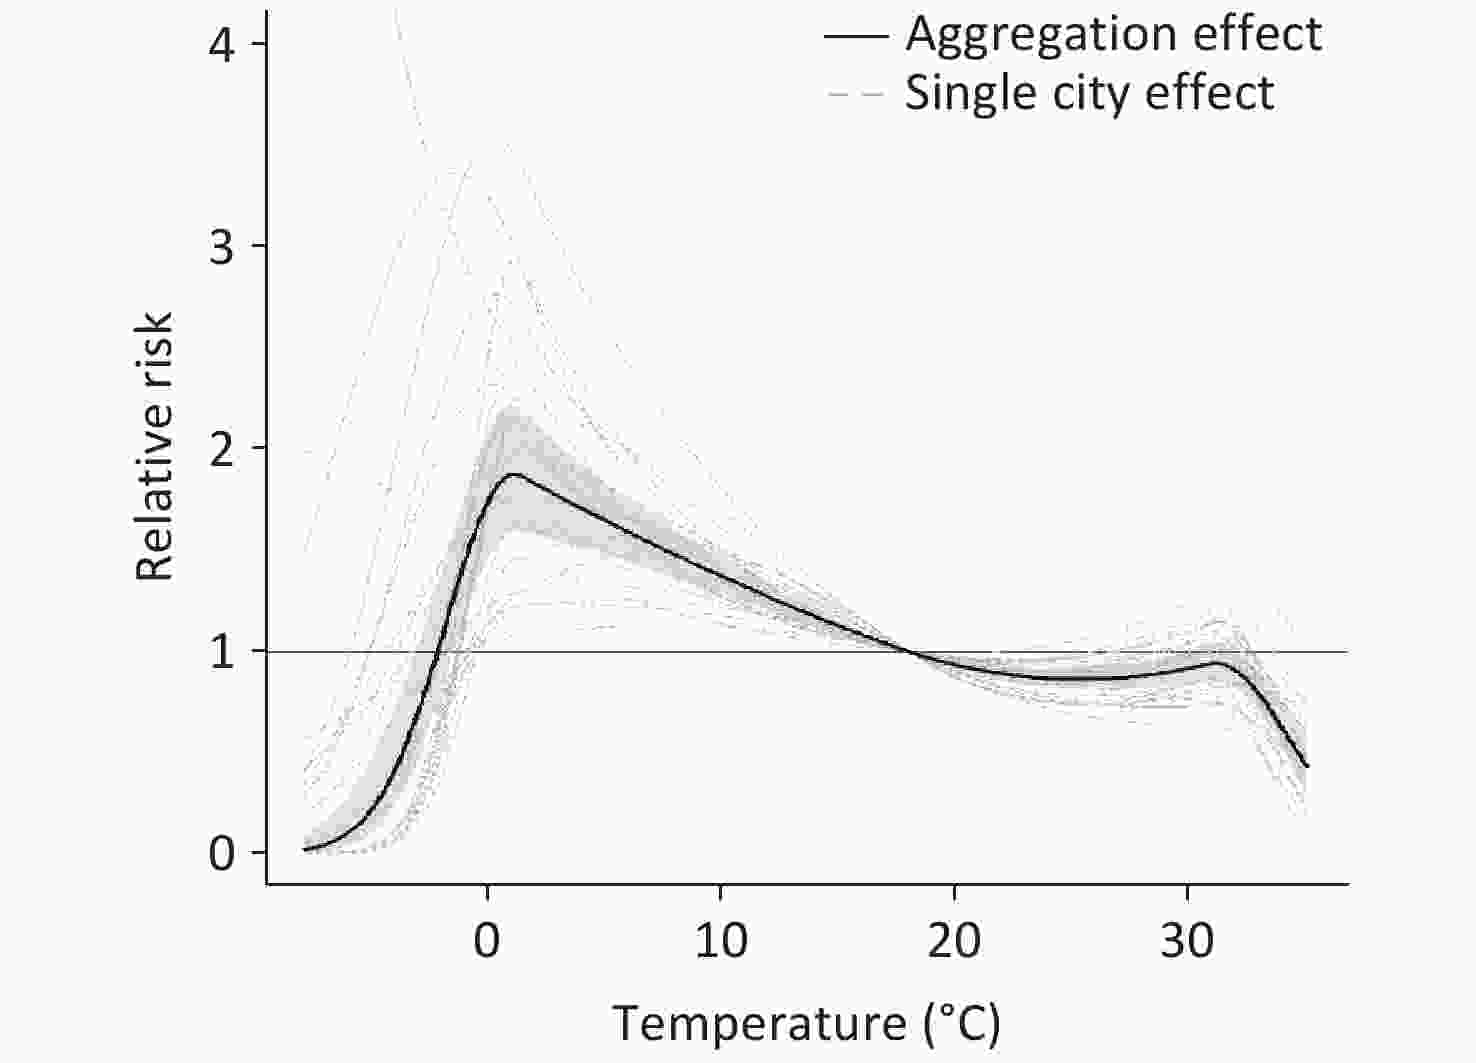
Figure 7. The city-specific effect of temperature over 0–14 lag days on the incidence of hand, foot, and mouth disease and the overall pooled estimates (2014–2016).
-
Although previous studies have suggested that the temperature has an important effect on the incidence of HFMD[14,29,30], those studies were limited to a single location. To quantify the impact of temperature on HFMD transmission in the middle and lower reaches of the Yangtze River and facilitate the development of integrated disease control and prevention at the regional level, data from 26 representative cities with different economic levels and population densities were included in the present study. Thus, these results provide additional evidence for local health authorities.
The seasonal distribution implies that meteorological factors may contribute to the transmission of HFMD. A possible explanation is that meteorological factors, including temperature, may affect the breeding, growth, and transmission of pathogens, as well as influence human behavior[31]. Similar to the results of studies based in tropical and subtropical regions, the present study found two-peaks as a feature of the HFMD distribution for cities in the middle and lower reaches of the Yangtze River, which was different from that in high-latitude regions, which showed only one or an unclear peak[7-11,18,30-33]. These differences may be attributed to different climatic characteristics and local socio-economic levels. For instance, the incidence of HFMD in high-latitude regions in China that have a temperate monsoon climate is different from that in southern regions with a subtropical or tropical monsoon climate. By monitoring temperature changes and predicting the period of high incidence of HFMD, relevant departments can take preventive measures, in advance, to effectively control the spread of HFMD.
In the present study, male sex was associated with a higher incidence of HFMD, which might be attributed to the behavioral features of boys in the kindergarten. For instance, boys tend to engage in more outdoor activities and pay less attention to hand hygiene. However, Xu et al. reported a higher incidence of HFMD among girls in Beijing[3]. This inconsistency may be due to the different socio-economic statuses of their families and different climate features in the regions[3].
Based on a confidence interval of 0.2479, a high incidence of HFMD was detected in economically prosperous areas. This might be attributed to the denser population, more convenient transportation, and higher standard of living in the more developed regions, all of which increase the risk of infectious disease transmission[34]. HFMD is an infectious disease primarily caused by enteroviruses. It is mainly transmitted through droplets and direct contact. Regions with high population densities, such as kindergartens, schools, and other areas densely populated with children, are particularly susceptible to the formation of infectious environments. Moreover, cities with the highest GDP typically demonstrate excellent personnel training and configuration in their disease control and healthcare systems, resulting in a more comprehensive and accurate case-reporting process, leading to higher rates of HFMD-related visits, diagnoses, and reports[32]. The difference in the concentration index between males and females suggests inequality in the distribution of health resources, with females experiencing unfavorable conditions. This difference could potentially be attributed to factors, such as different activity levels between boys and girls and different likelihoods of exposure to viruses[35]. In addition, economically developed regions have relatively abundant medical resources, resulting in superior diagnosis and management of HFMD. Collectively, the higher incidence of HFMD in economically developed areas may be attributed to these factors[36].
A higher incidence of HFMD was also associated with economic prosperity. For example, Suzhou had the highest per capita GDP of 137,400 CNY, whereas Huanggang had the lowest per capita GDP of 25,400 CNY, and the incidence of HFMD in Hefei was 3.23 times that in Anqing. However, this association does not apply to individual cities; for example, the per capita GDP of Chuzhou (32,700 yuan) is lower than that of Changde (46,700 yuan), but the incidence rate of HFMD in Chuzhou is 1.53 times that of Changde. While economic prosperity may contribute to a higher risk of HFMD, it is not a determining factor and may interact with other factors such as local policies[37].
Our findings show that temperature plays an important role in the transmission of HFMD. A multivariate random-effects meta-analysis suggested that the different sizes of the two peaks in the curve might result from different factors, such as ultraviolet exposure and sunshine hours[38]. Before the temperature reached its first peak, ultraviolet radiation may have been less effective against the virus[38], and the rising temperature facilitated the spread of the virus. With an increase in solar radiation intensity, the risk effect of ultraviolet radiation increased, gradually offsetting the temperature-related facilitation of HFMD spread. This might explain the downward trend observed after the first peak. In addition to natural environmental factors, the second peak within the range of 20 °C–30 °C may be related to an increase in specific human behaviors. For example, children engaging in more outdoor activities are more likely to be exposed to enterovirus[39,40]. The lower peak in early summer may have resulted from the rainy season from early June to mid-July in East Asia, which may have reduced the likelihood of disease transmission by affecting human activity. Our findings also suggest that higher temperatures might inhibit the transmission of HFMD, which might be attributed to the lower likelihood of children becoming infected due to engaging in fewer outdoor activities when the temperature was higher. Our findings are in agreement with those of studies conducted in northern and western China[6].
According to various grouping criteria, the Theil index should be used for testing. For comparison, typical cities with the largest disparity in grouping are selected, where the Theil index within a group is lower than that between the groups. For instance, the incidence rates of HFMD in Changzhou and Anqing differed by a factor of 4.9. A higher Theil index indicates that the incidence rate of HFMD in certain cities may be significantly higher than that in other cities, suggesting that some regions are more vulnerable to the impact of HFMD. Given the comparable prevalence of seasonal HFMD in the selected cities, a collaborative prevention and control strategy is required. The primary objective of this strategy will be to effectively reduce the incidence of HFMD in high-risk cities, while implementing preventive measures to ensure the healthy growth of children.
Although insightful, the current study had several limitations that underscore the need for further exploration in future studies. First, while the analysis encompassed 26 selectively sampled cities along the primary tributaries of the Yangtze River, the inherent diversity among these cities may not fully encapsulate the variability present across all riverine cities, thereby potentially constraining the depth of understanding of the influence of temperature on HFMD. Second, the ecological approach adopted in this study, which is devoid of individual-level exposure data and assessments, risks introducing ecological fallacies when attempting to correlate meteorological variables with population- or ecosystem-wide mortality rates. Furthermore, the absence of a predictive warning model for HFMD onset hinders proactive intervention and prevention strategies[41,42]. To mitigate these limitations and enrich our understanding, future studies should broaden the sample scope by embracing a wider array of cities along the Yangtze River and other significant river systems. This expanded coverage will facilitate a more comprehensive assessment of regional variations in the incidence of HFMD and the intricate interplay with socio-economic and meteorological determinants. Additionally, integrating surveys or alternative methodologies to collect granular data on individual behaviors, exposure, and health outcomes will enable a more refined examination of the multifaceted relationship between HFMD and diverse factors, such as temperature, humidity, and individual socio-economic status[43]. Finally, the overall model lacked air pollution data, which requires further study.
-
The incidence of HFMD is relatively high in cities with mildly cold and hot temperatures in the middle and lower reaches of the Yangtze River. Our findings indicate that it is important to focus on males and economically affluent areas and develop comprehensive preventive measures as early as possible. Health authorities also need to work closely with communities and early education centers to design a comprehensive prevention package to protect the health and well-being of children.
-
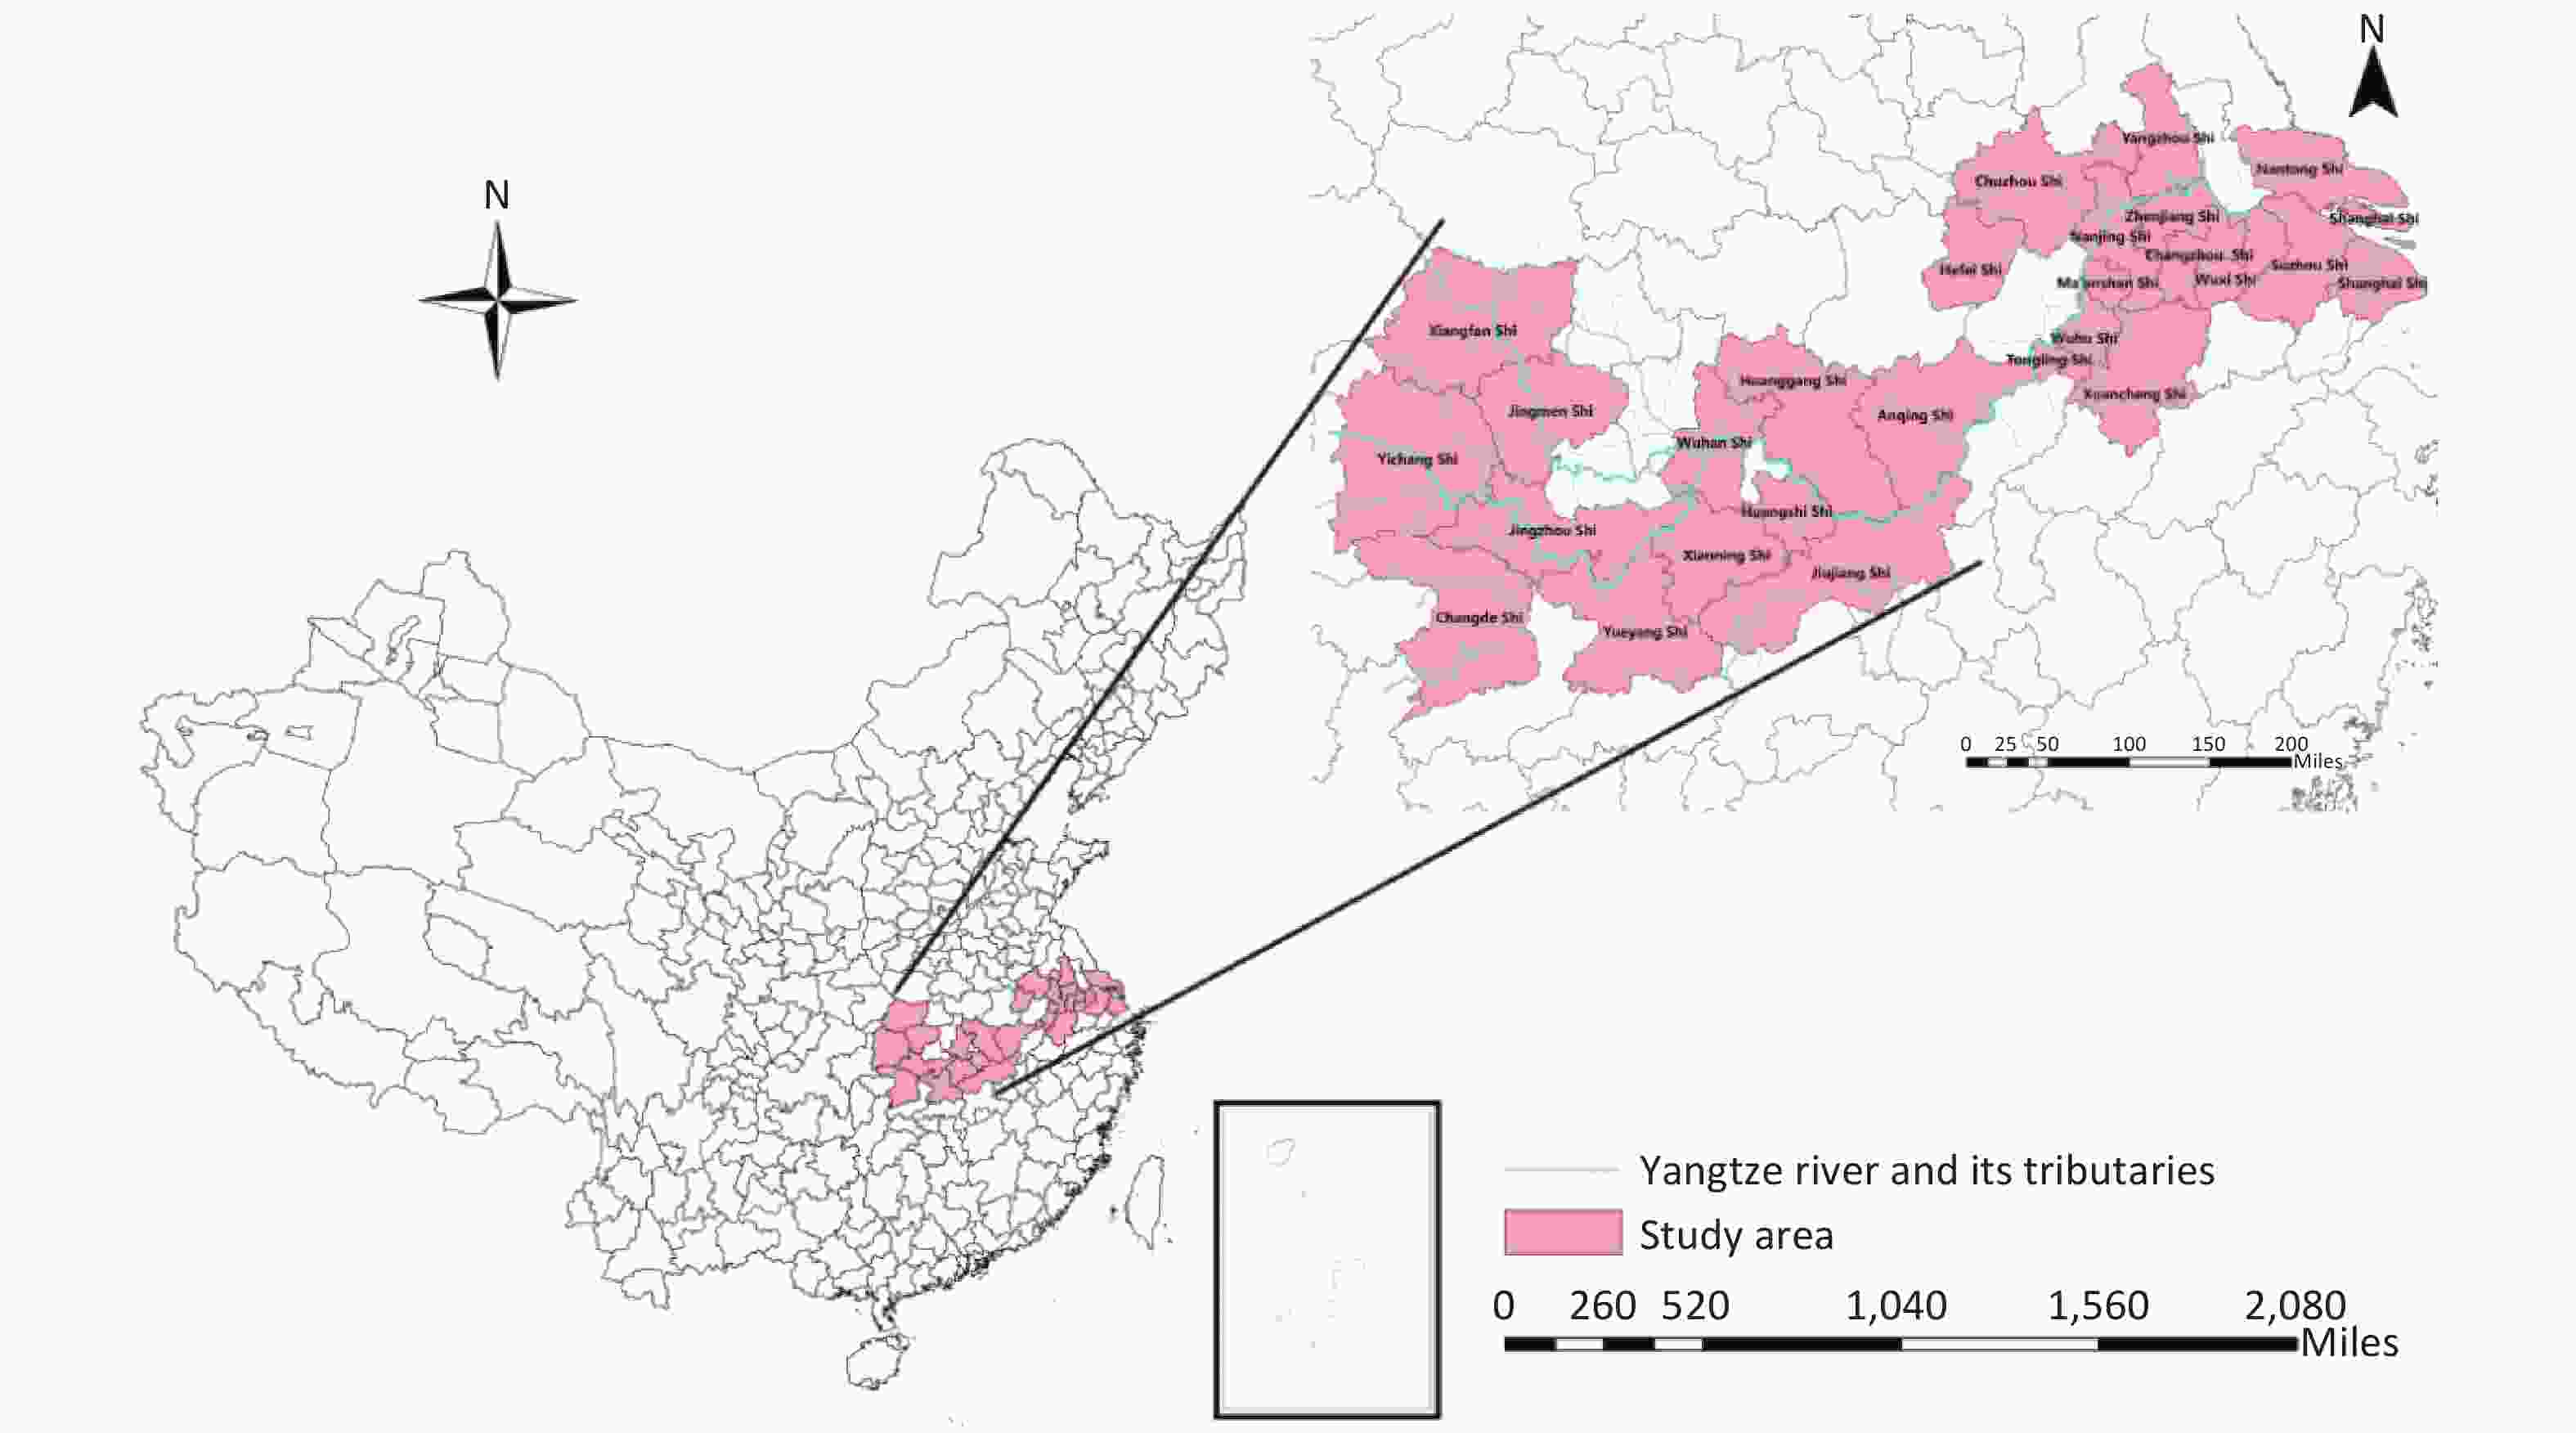
Figure S1. The geographical location of the 26 cities in China. Map approval number: GS(2020)4619.
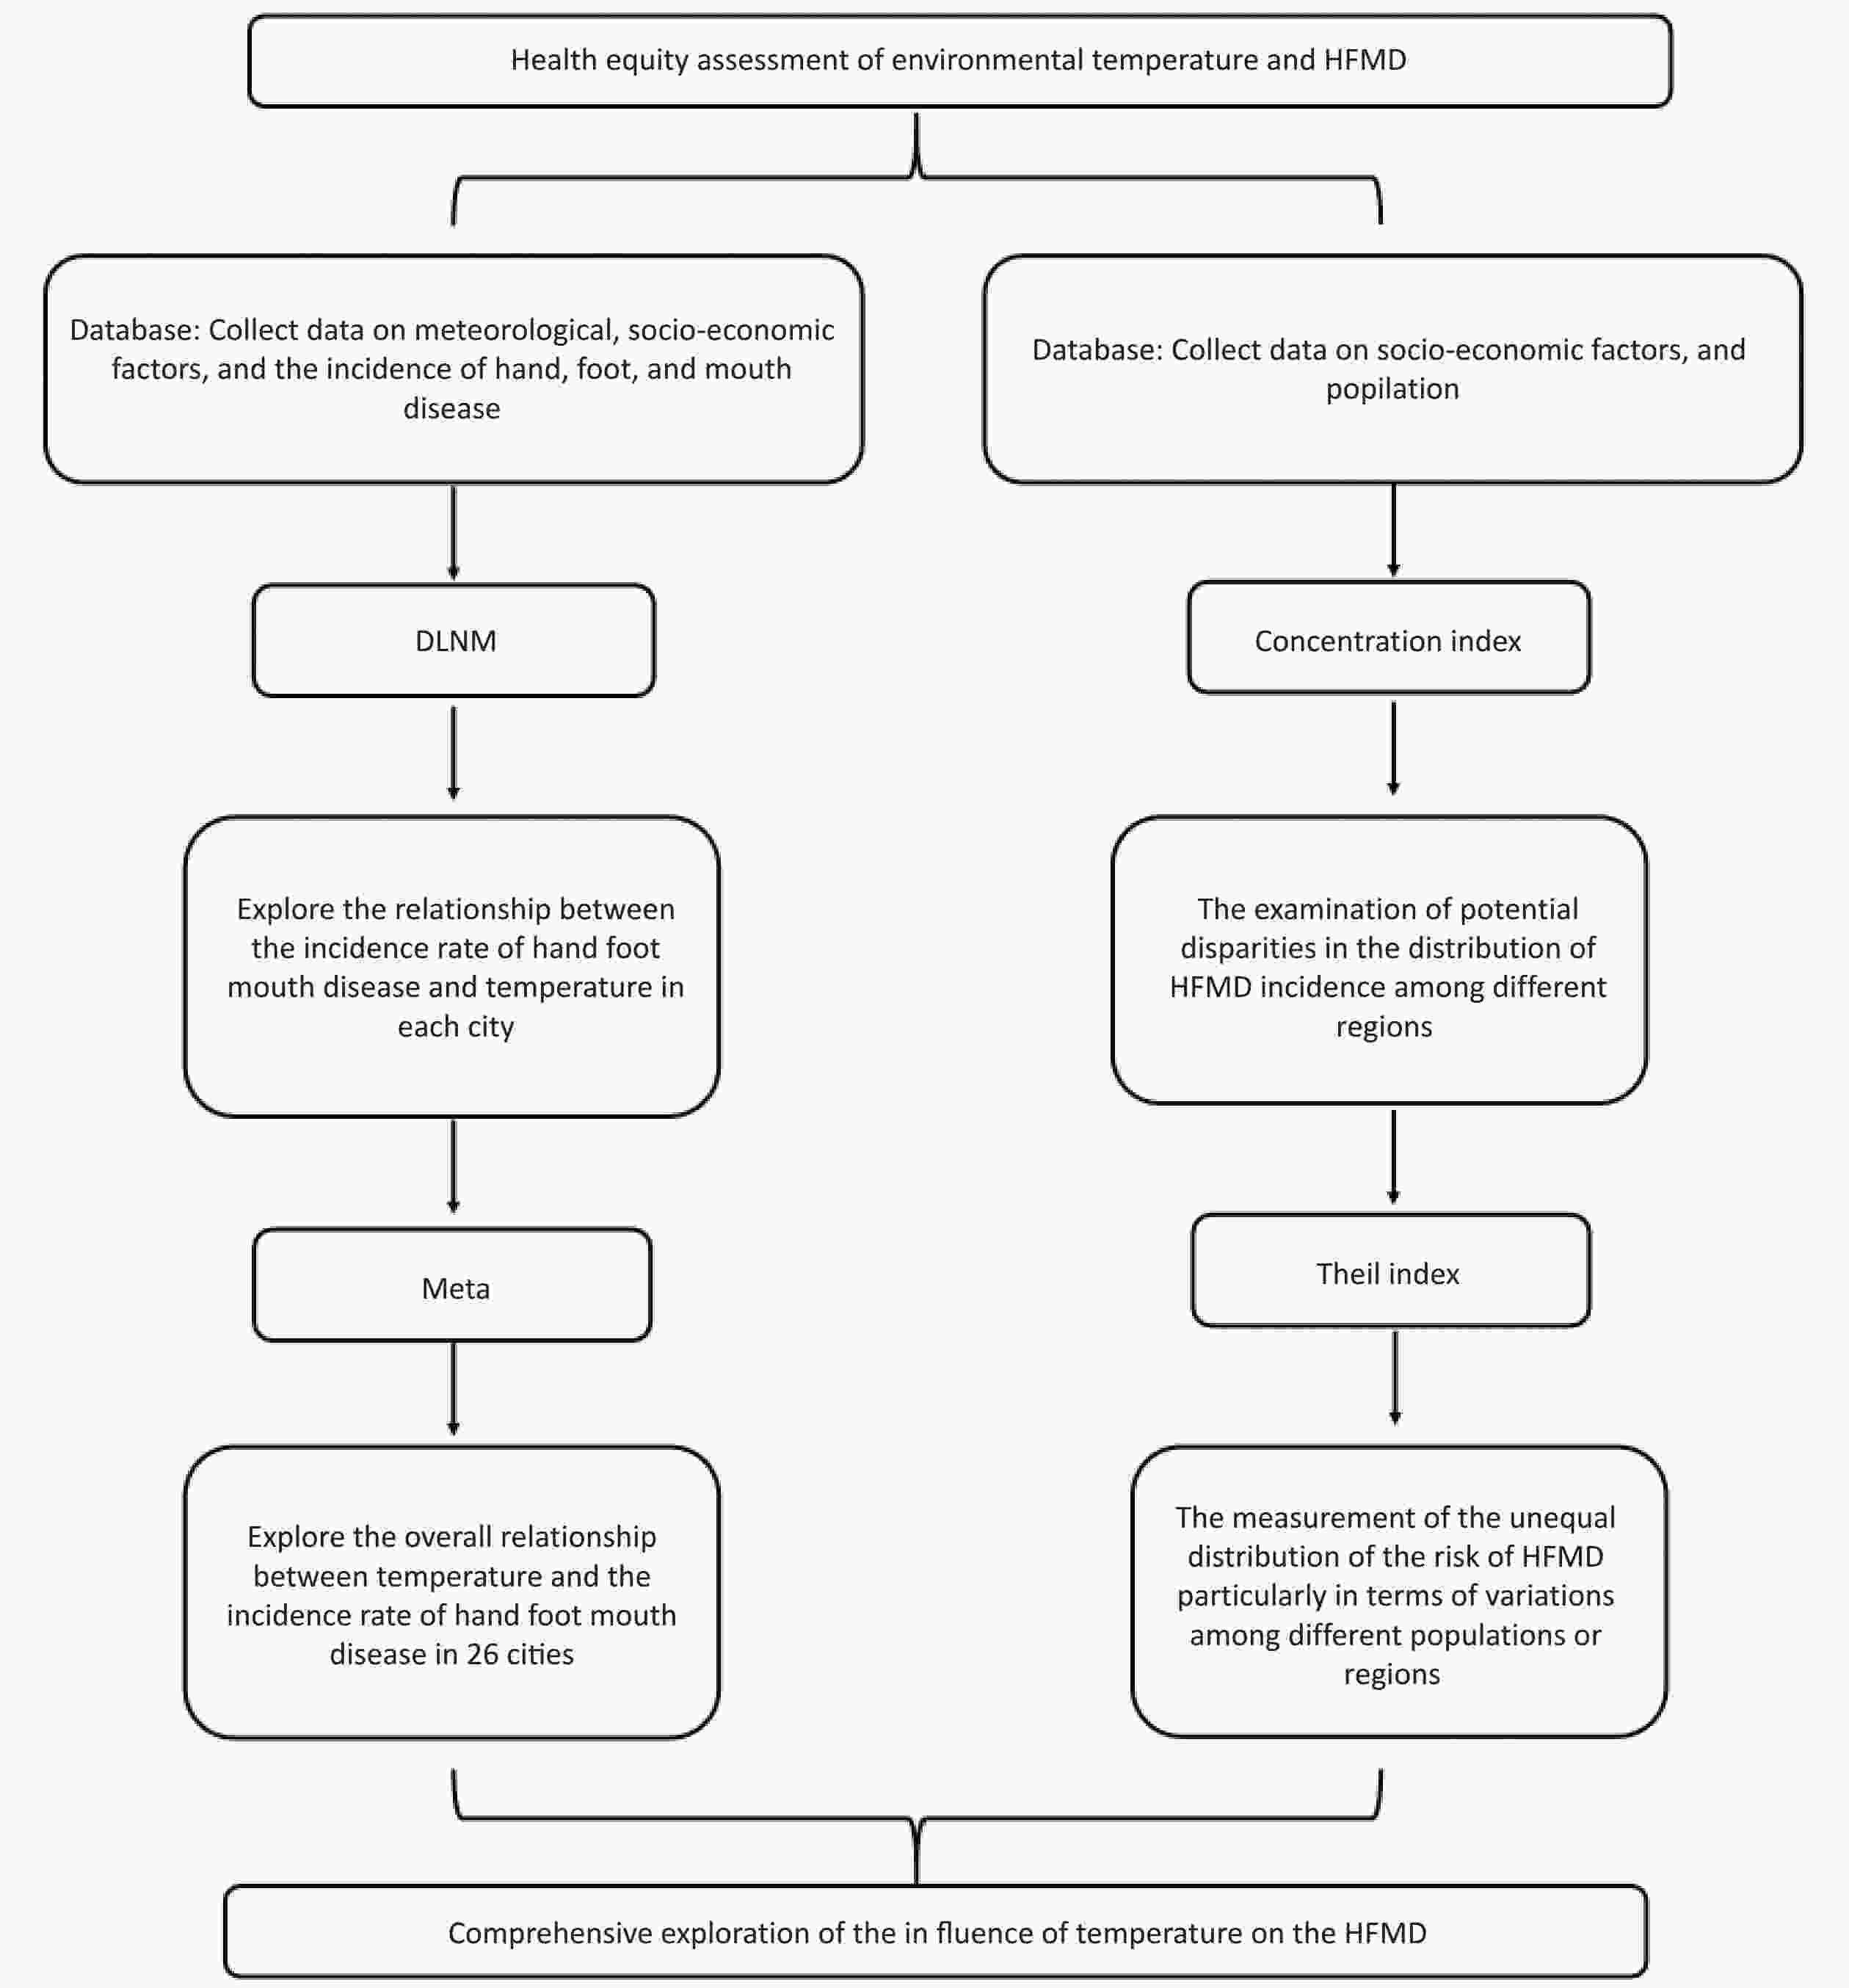
Figure S2. Study flowchart.
HTML
Study Area
Data Sources
Morbidity Data
Meteorological Data
Statistical Analysis
Descriptive Analysis
The Association between the Incidence of HFMD and Temperature for Each City
The Trend of RR Regarding Temperature in Different Cities with Different Lag Times
The Association between HFMD and Temperature
Sensitivity Analysis of Lag Time
Multivariate Cochran's Q test for Heterogeneity
Competing Interests The authors declare that there are no conflicts of interest.
&These authors contributed equally to this work.
 24292+Supplementary Materials.pdf
|

|

 Quick Links
 DownLoad: