


-
Tuberculosis (TB), a chronic infectious disease caused by Mycobacterium TB (Mtb), remains a significant global public health issue, especially in low- and middle-income countries (LMICs)[1-3]. In China, the smoking rate among adult males exceeds 50%, and among TB patients it is even higher, reaching approximately 50%–60%[4-6]. There is a synergistic effect between smoking and TB[7]. Smoking not only increases the risk of TB infection but also exacerbates its progression, resulting in more extensive lesions, increased pulmonary cavities, and poorer treatment outcomes[4,5,7,8]. Our previous research found that the chest radiographic scores of smokers with TB were significantly higher than those of non-smokers with TB, and after anti-TB treatment, lesion absorption was slower, with more severe residual chronic lung damage[9-11]. However, the mechanism through which smoking exacerbates TB remains unclear.
Recently, the role of tertiary lymphoid structures (TLS) in chronic inflammation and immune responses has garnered increasing attention. TLS are ectopic lymphoid structures formed by the aggregation of lymphocytes from peripheral tissues in response to inflammation or infection, and typically provide localized immune protection[12,13]. Studies have shown that TLS are widely present in the airways and lung parenchyma of patients with chronic pulmonary diseases such as chronic obstructive pulmonary disease (COPD). Furthermore, their numbers were positively correlated with lung function decline and COPD exacerbation, suggesting that TLS may play a critical role in the chronic pathogenesis of COPD[14,15]. COPD is a heterogeneous pulmonary condition characterized by persistent airway inflammation and airflow obstruction, mostly associated with cigarette smoking[16], but pulmonary TB is also an important risk factor for COPD in LMICS[16]. However, the mechanisms underlying TB-associated COPD remain largely unknown.
Based on our previous observation that cigarette smoking is associated with more severe lung lesions in TB[10], this study focused on analyzing the structural, cellular, and molecular characteristics of pulmonary TLS in the lung tissues of smokers with TB who underwent surgery. This study aimed to explore whether TLS formation is associated with exacerbated lung damage in pulmonary TB, and thereby provide new perspectives on the interactive mechanisms between TB and cigarette smoking, which may shed light on the pathobiology of TB-associated COPD.
-
We enrolled male patients who underwent lobectomy for pulmonary TB or lung nodules/masses at Beijing Chest Hospital between 2018 and 2024. The postoperative pathological diagnosis confirmed pulmonary TB in all patients in accordance with the 2018 Chinese TB diagnostic criteria[17]. Patients were divided in two groups based on smoking history: the smoking TB group (smoking index ≥ 10 pack-years) and the non-smoking TB group (no history of smoking). Patients were matched in a 1:1 case-control matching based on age, and 18 patients from each group were selected for analysis. Paraffin-embedded postoperative lung tissue samples were collected from all the enrolled patients.
-
Exclusion criteria were presence of other chronic respiratory diseases (such as asthma, bronchiectasis, interstitial lung disease, or other structural lung diseases), lung malignancies, human immunodeficiency virus infection, and autoimmune diseases.
-
Baseline information including age, body mass index (BMI), smoking history, pack-years smoked, and comorbidities was collected from all study participants. Preoperative chest computed tomography (CT) scans were collected and analyzed.
-
Preoperative chest CT images were evaluated for TB severity using a six-zone scoring method proposed by Casarini et al. in 1999[18]. The lungs were divided into six regions: upper (above the carina), middle (between the carina and lower pulmonary veins), and lower (below the lower pulmonary veins) regions for both lungs. Scoring was based on the percentage of lung parenchyma affected by abnormal findings in each region. The scores were as follows: 1 point for < 25% involvement, 2 points for 25%–50% involvement, 3 points for 50%–75% involvement, and 4 points for > 75% involvement. The total score was obtained by summing the scores of all regions, with a total score range from 0 to 24. Chest CT scoring was performed by two experienced pulmonologists and one radiologist.
-
Lung tissue samples were paraffin-embedded and sectioned into 4 µm thick slices for hematoxylin and eosin staining to observe the distribution and structural characteristics of pulmonary TLS. The analysis of TLS followed the standard methods described in the literature. Aggregates with 50 or more lymphocytes were defined as TLS[19], whereas areas with fewer than 50 cells were considered lymphocyte aggregates. For each patient sample, the number of TLS in the peribronchial and lung parenchymal regions was quantified. The infiltration in the peribronchial region was standardized by the number of bronchi in each lung section, whereas the infiltration in the lung parenchyma was standardized by the area of the parenchyma. All samples were examined by a pulmonologist and a pathologist.
-
Immunohistochemical staining was performed using cluster of differentiation 20 (CD20) (Abcam, USA) and C-X-C motif chemokine ligand 13 (CXCL13) (Abcam, USA) markers to further analyze the cellular composition and molecular characteristics of the TLS. CD20, a marker of B cells, was used to assess the distribution and number of B cells within the TLS. CXCL13, a chemokine that attracts B cells and T follicular helper cells (Tfh), was also examined. After immunohistochemical staining, each sample was photographed under a microscope, and the number of CXCL13-positive cells per unit area and the average size of the CD20+ B cell follicles were recorded for quantitative analysis.
-
To investigate the immune cell subsets within the TLS, multicolor immunofluorescence staining was performed. Markers included CD4 (Abcam, USA) and CD8 (Abcam, USA) for helper T cells and cytotoxic T cells, respectively; CD20 for B cells; and CD138 for plasma cells (activated B cells). Stained sections were analyzed under a fluorescence microscope, and the quantity and distribution patterns of different immune cell subsets were assessed. All samples were reviewed by a pulmonologist and a pathologist.
-
Data were statistically analyzed using the Statistical Package for the Social Sciences (SPSS) software. The differences in the number of TLS and the expression of immune markers between the smoking and non-smoking TB groups were compared using independent sample t-tests or Mann–Whitney U tests. Pearson correlation analysis was used to examine the relationship between CT scores and the number of TLS to explore the correlation between TLS and the severity of TB. A P-value of < 0.05 was considered statistically significant.
-
A total of 36 male patients with TB were included in this study, with 18 each in the smoking and non-smoking groups. There were no significant differences between the two groups in terms of age, BMI, or comorbidities, such as hypertension and diabetes. The baseline characteristics of the patients are summarized in Table 1.
Number of patients Smoker Non-smoker P Value 18 18 Age (years) 54.28 ± 4.00 54.28 ± 5.28 1.000 Smoking index (pack-year) 36.33 ± 21.15 0 < 0.001 BMI 24.60 ± 4.10 23.37 ± 2.64 0.088 Comorbidity Hypertension, n (%) 3 (16.7) 5 (27.8) 0.688 Diabetes mellitus, n (%) 8 (44.4) 4 (22.2) 0.157 Chest CT TB severity scoring Total score 10.44 ± 2.54 7.94 ± 1.63 0.001 Cavitation, n (%) 10 (55.6) 4 (22.2) 0.040 Note. BMI, Body Mass Index; CT, Computed Tomography; TB, Tuberculosis. Table 1. Baseline characteristics of 36 male patients with TB
-
Histopathological analysis of lung tissues revealed that the number of TLS was significantly higher in the smoking group (Figure 1A) than in the non-smoking group (Figure 1B), in both the lung parenchyma (Figure 1C, P < 0.001) and peribronchial regions (Figure 1D, P < 0.001). On average, the number of peribronchial TLS in each sample was 0.59 ± 0.09 in the smoking group, compared to 0.42 ± 0.14 in the non-smoking group. Similarly, the number of TLS in the lung parenchyma was 0.19 ± 0.03 in the smoking group, compared to 0.15 ± 0.04 in non-smoking group. The smoking group had significantly more TLS in both regions than that in the non-smoking group (both P < 0.001).
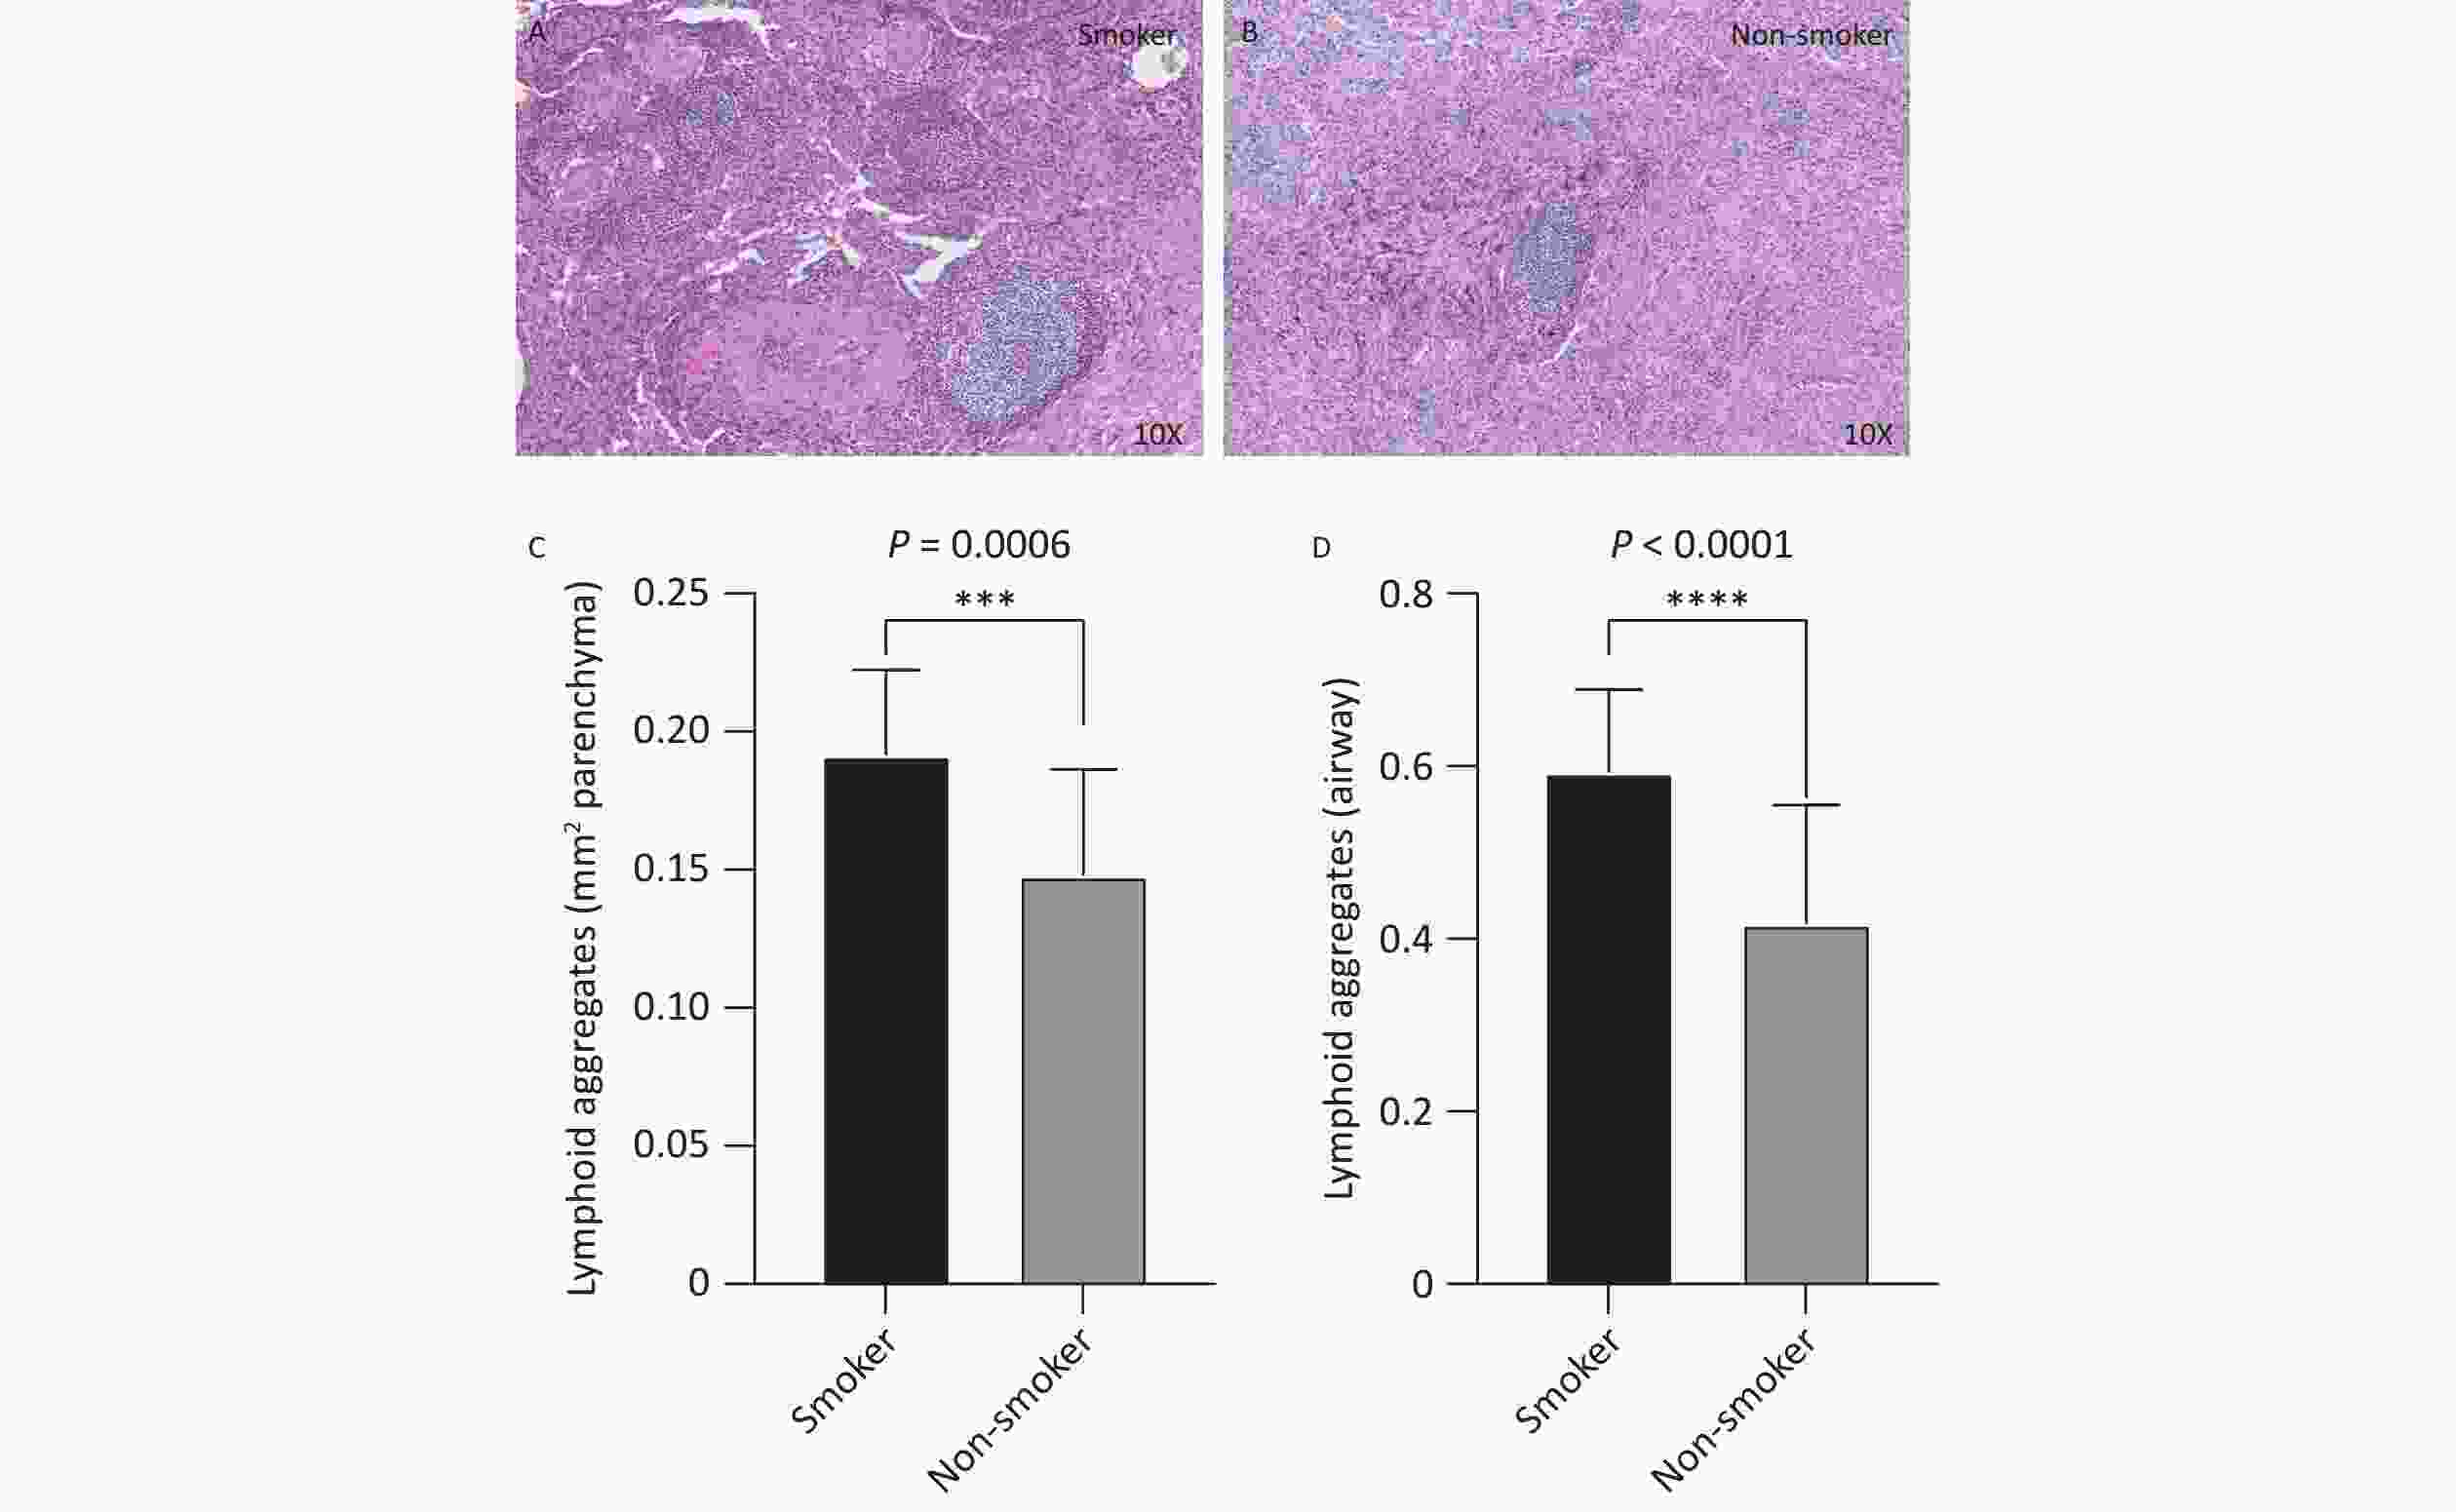
Figure 1. Distribution and quantity of airway and lung parenchyma TLS in smoking and non-smoking patients with TB. Smoking group n = 18, non-smoking group n = 18. (A, B) Representative images of lung parenchymal TLS in smoking and non-smoking TB patients (10X magnification). (C, D) Analysis of the number of lung parenchymal TLS and peribronchial TLS in smoking and non-smoking patients with TB. TLS, Tertiary Lymphoid Structures; TB, Tuberculosis.
-
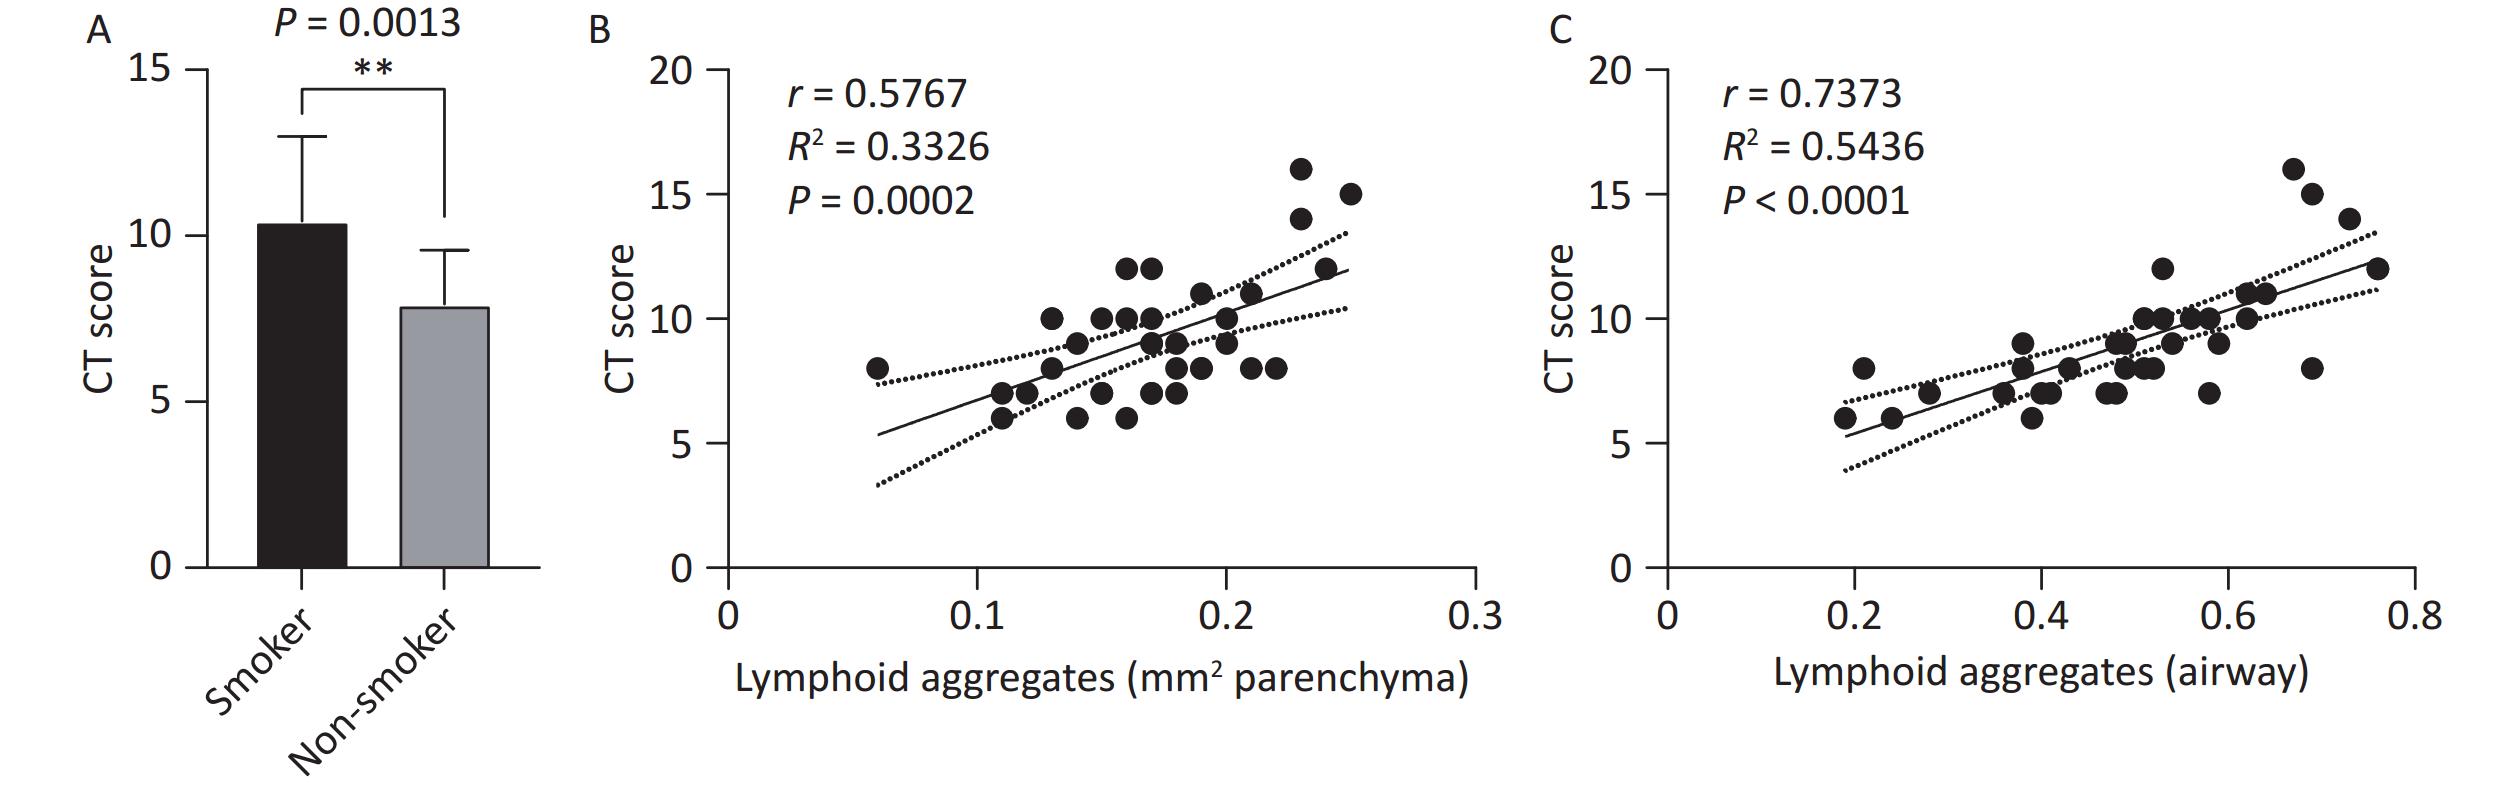
TB lesion severity, assessed using preoperative chest CT scans, revealed a significantly higher CT score in the smoking group than the non-smoking group (10.44 ± 2.54 vs. 7.94 ± 1.63, P < 0.01, Figure 2A). Correlation analysis between the number of TLS and CT severity scores demonstrated that the number of TLS in the lung parenchymal region (r = 0.5767, R² = 0.3326, P = 0.0002, Figure 2B) and peribronchial region (r = 0.7373, R² = 0.5436, P < 0.0001, Figure 2C) were positively correlated with the CT scores. This indicates that an increase in TLS is associated with greater disease severity, suggesting that TLS may play a role in the exacerbation of TB in smokers.
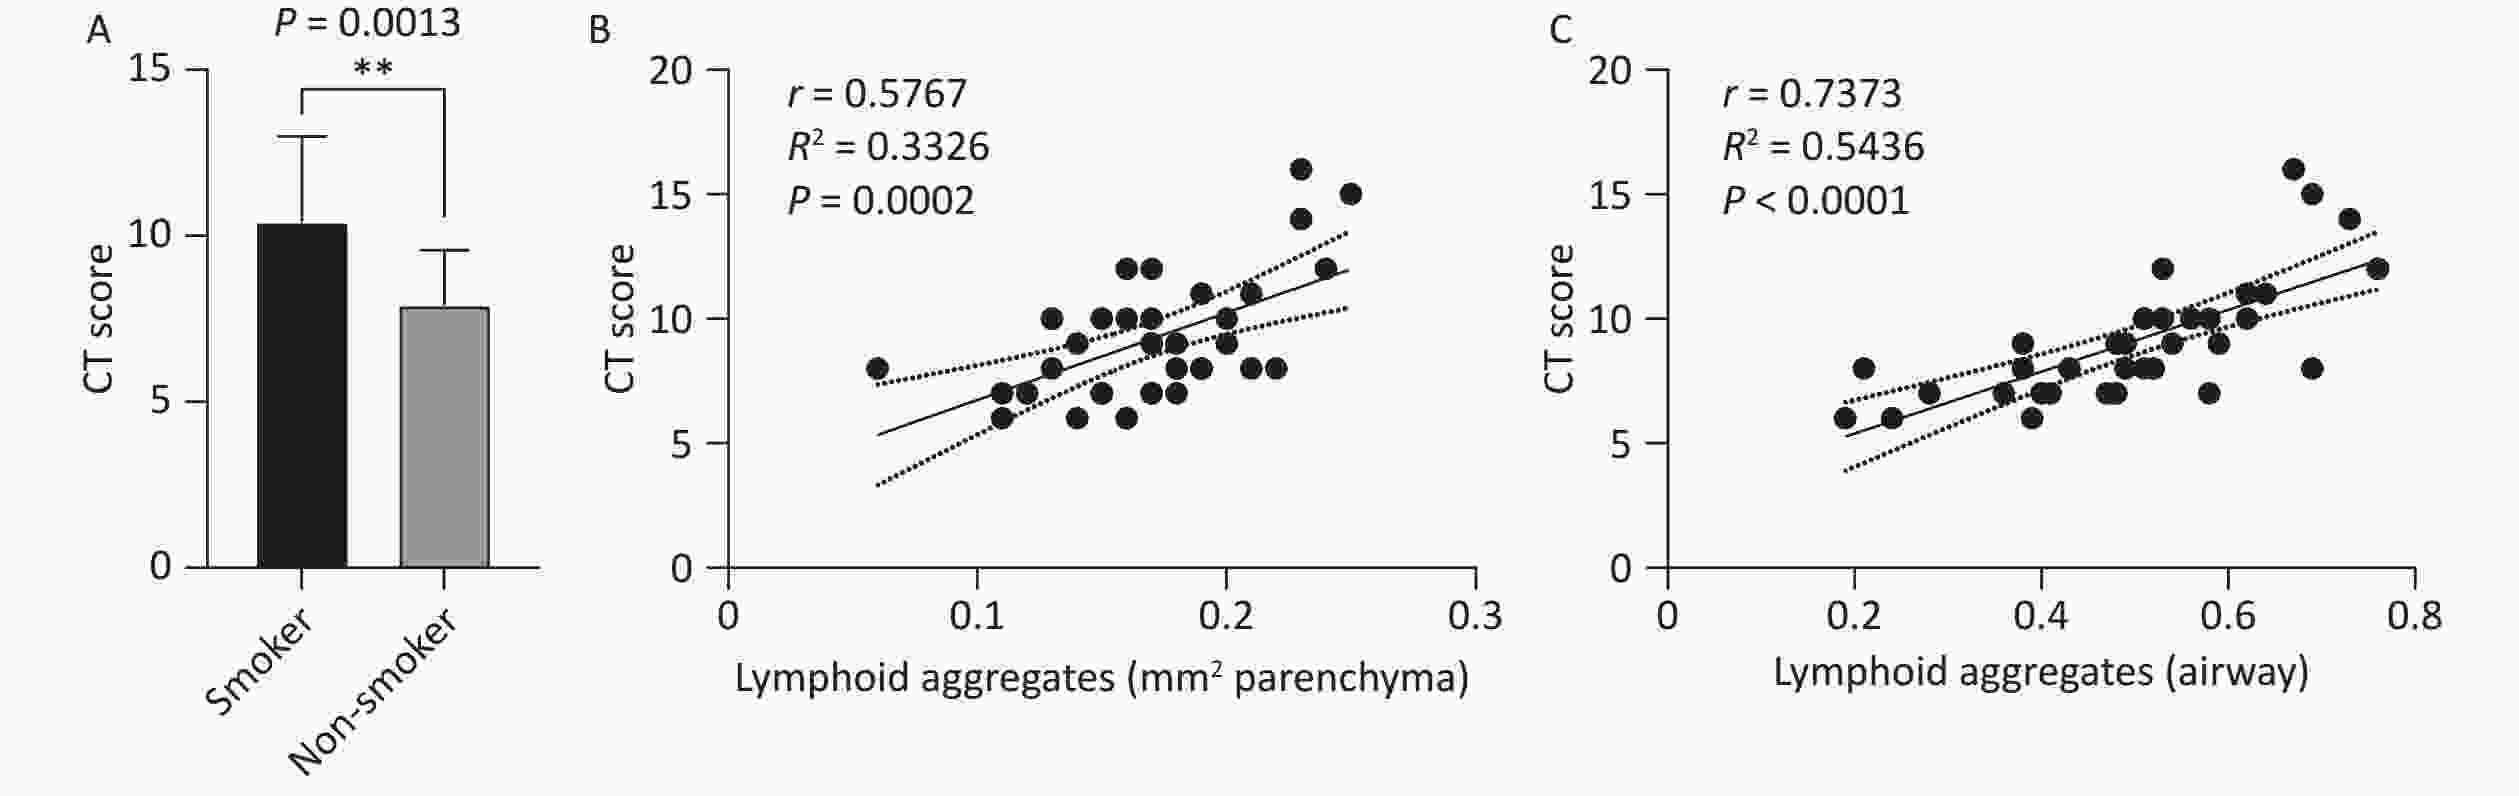
Figure 2. Correlation between lung TLS quantity and imaging TB severity scores in patients with TB. (A) Chest CT TB scores in smoking and non-smoking patients with TB. (B) Correlation between lung parenchymal TLS accumulation and imaging severity scores in patients with TB. (C) Correlation between peribronchial TLS accumulation and imaging severity scores in patients with TB. TLS, Tertiary Lymphoid Structures; TB, Tuberculosis; CT, Computed Tomography.
-
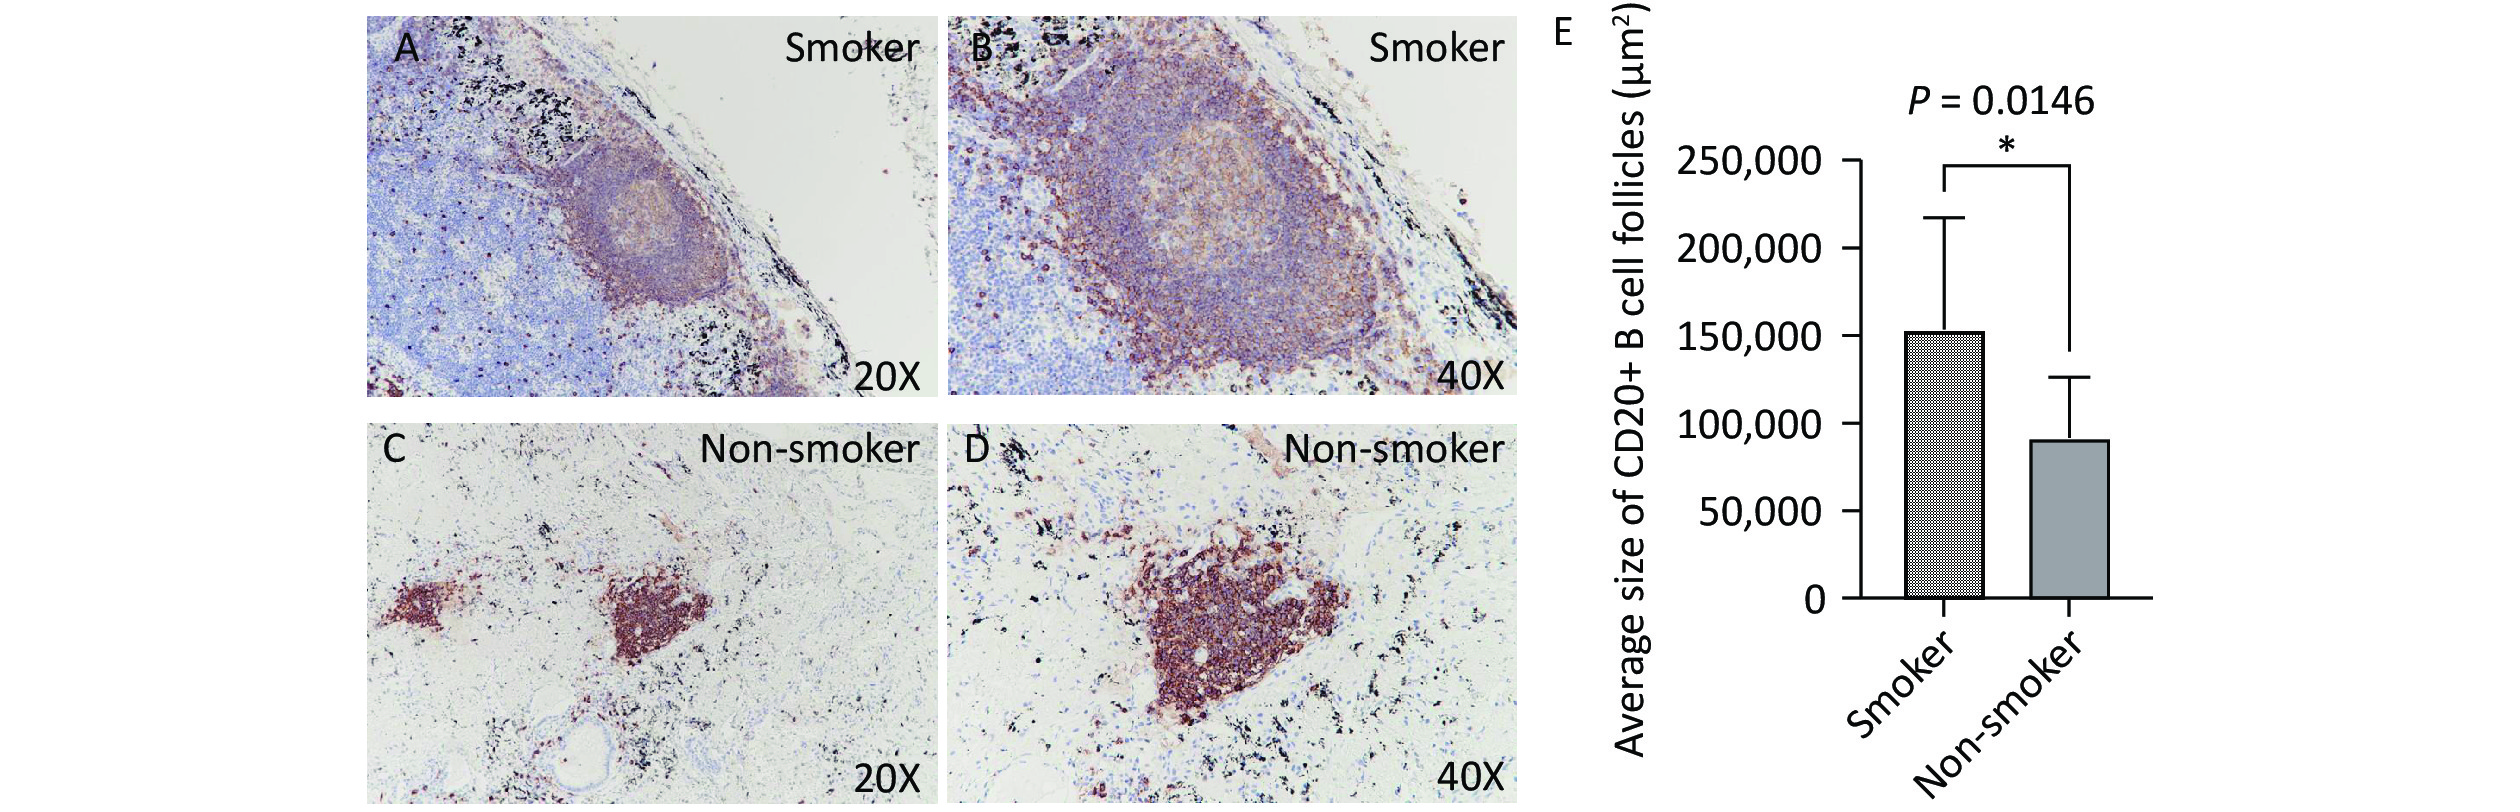
Immunohistochemical staining revealed that B cells were the predominant lymphocyte type in both smoking and non-smoking groups, with CD20-positive cells primarily located within the TLS regions. In the smoking group (Figure 3A, B), the average area of the CD20+ B cell follicles was significantly larger than that in the non-smoking group (153,445 vs. 91,501 μm², P = 0.0146, Figure 3C, D).
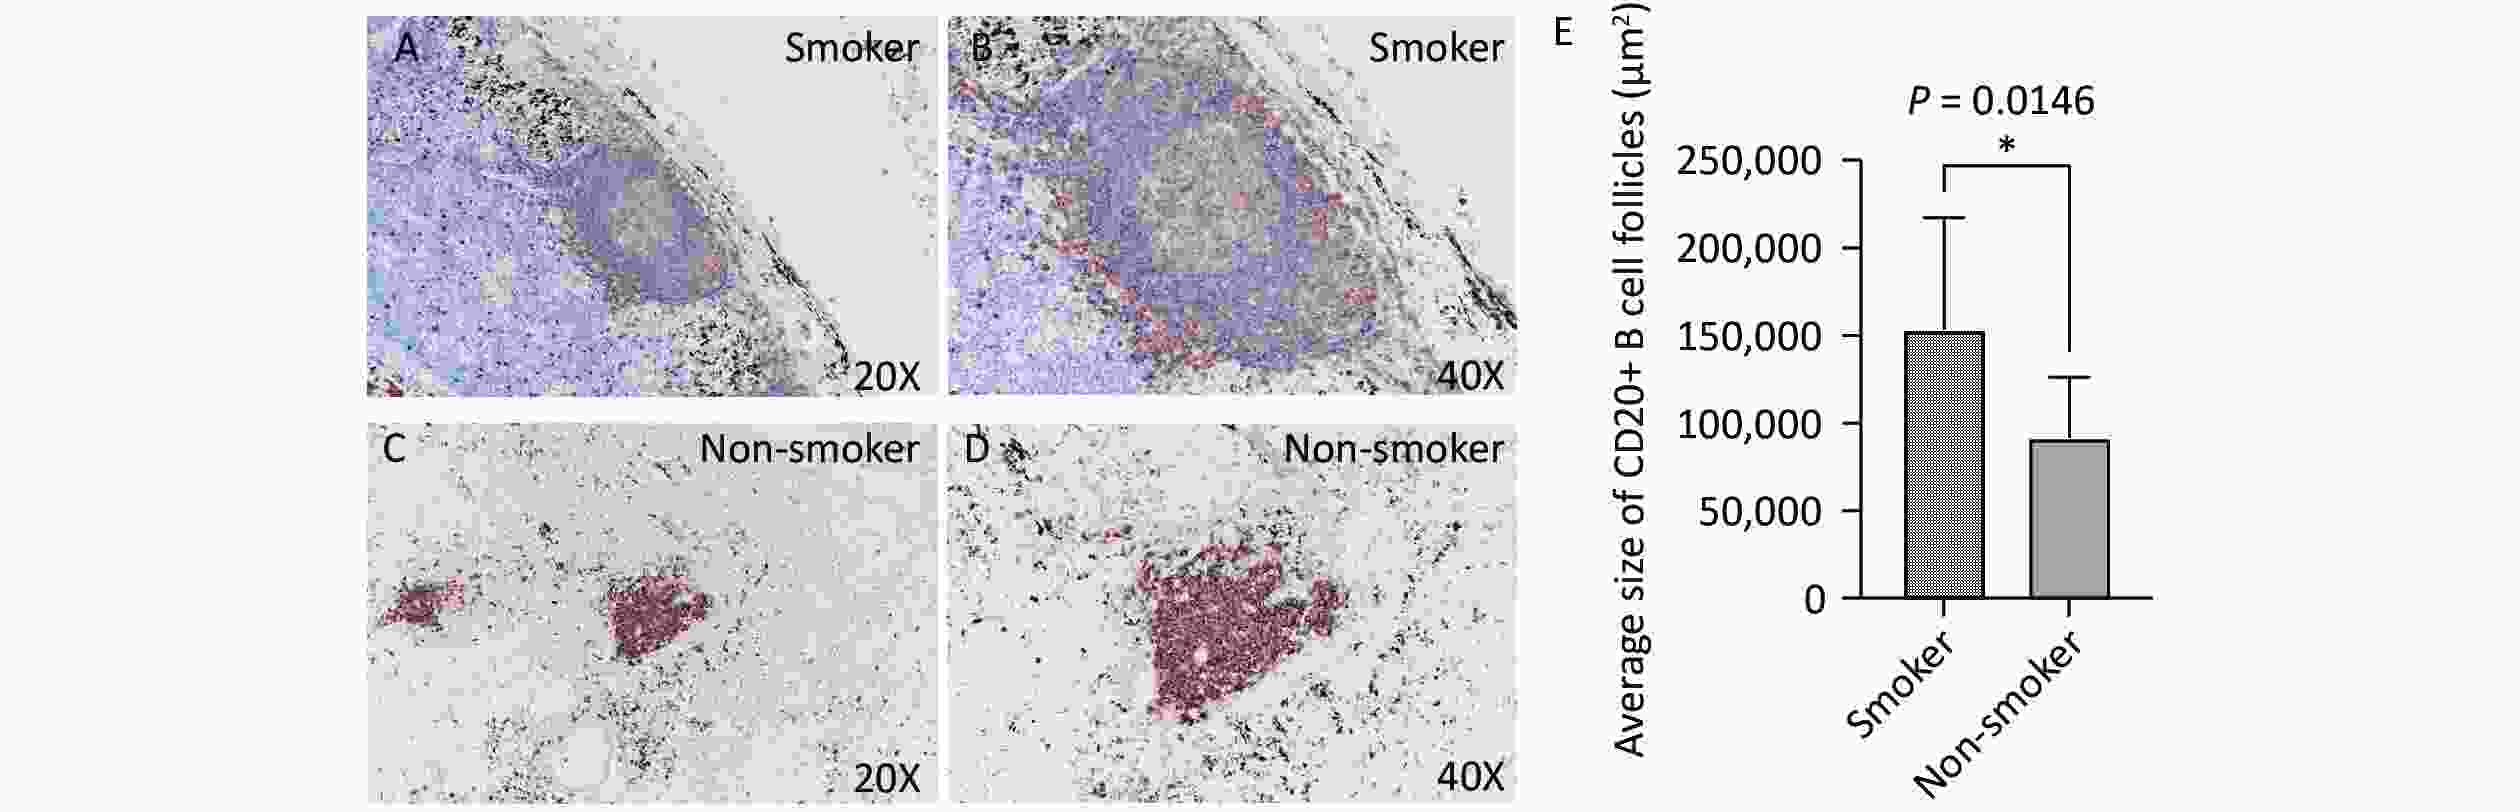
Figure 3. CD20 expression in lung TLS of TB patients. Brown represents CD20-positive staining. (A, B) Representative images of CD20 expression in lung TLS of smoking patients with TB (20X and 40X magnification, respectively). (C, D) Representative images of CD20 expression in lung TLS of non-smoking patients with TB (20X and 40X magnification, respectively). (E) Quantitative analysis. TLS, Tertiary Lymphoid Structures; TB, Tuberculosis; CD20, Cluster of Differentiation 20.
-
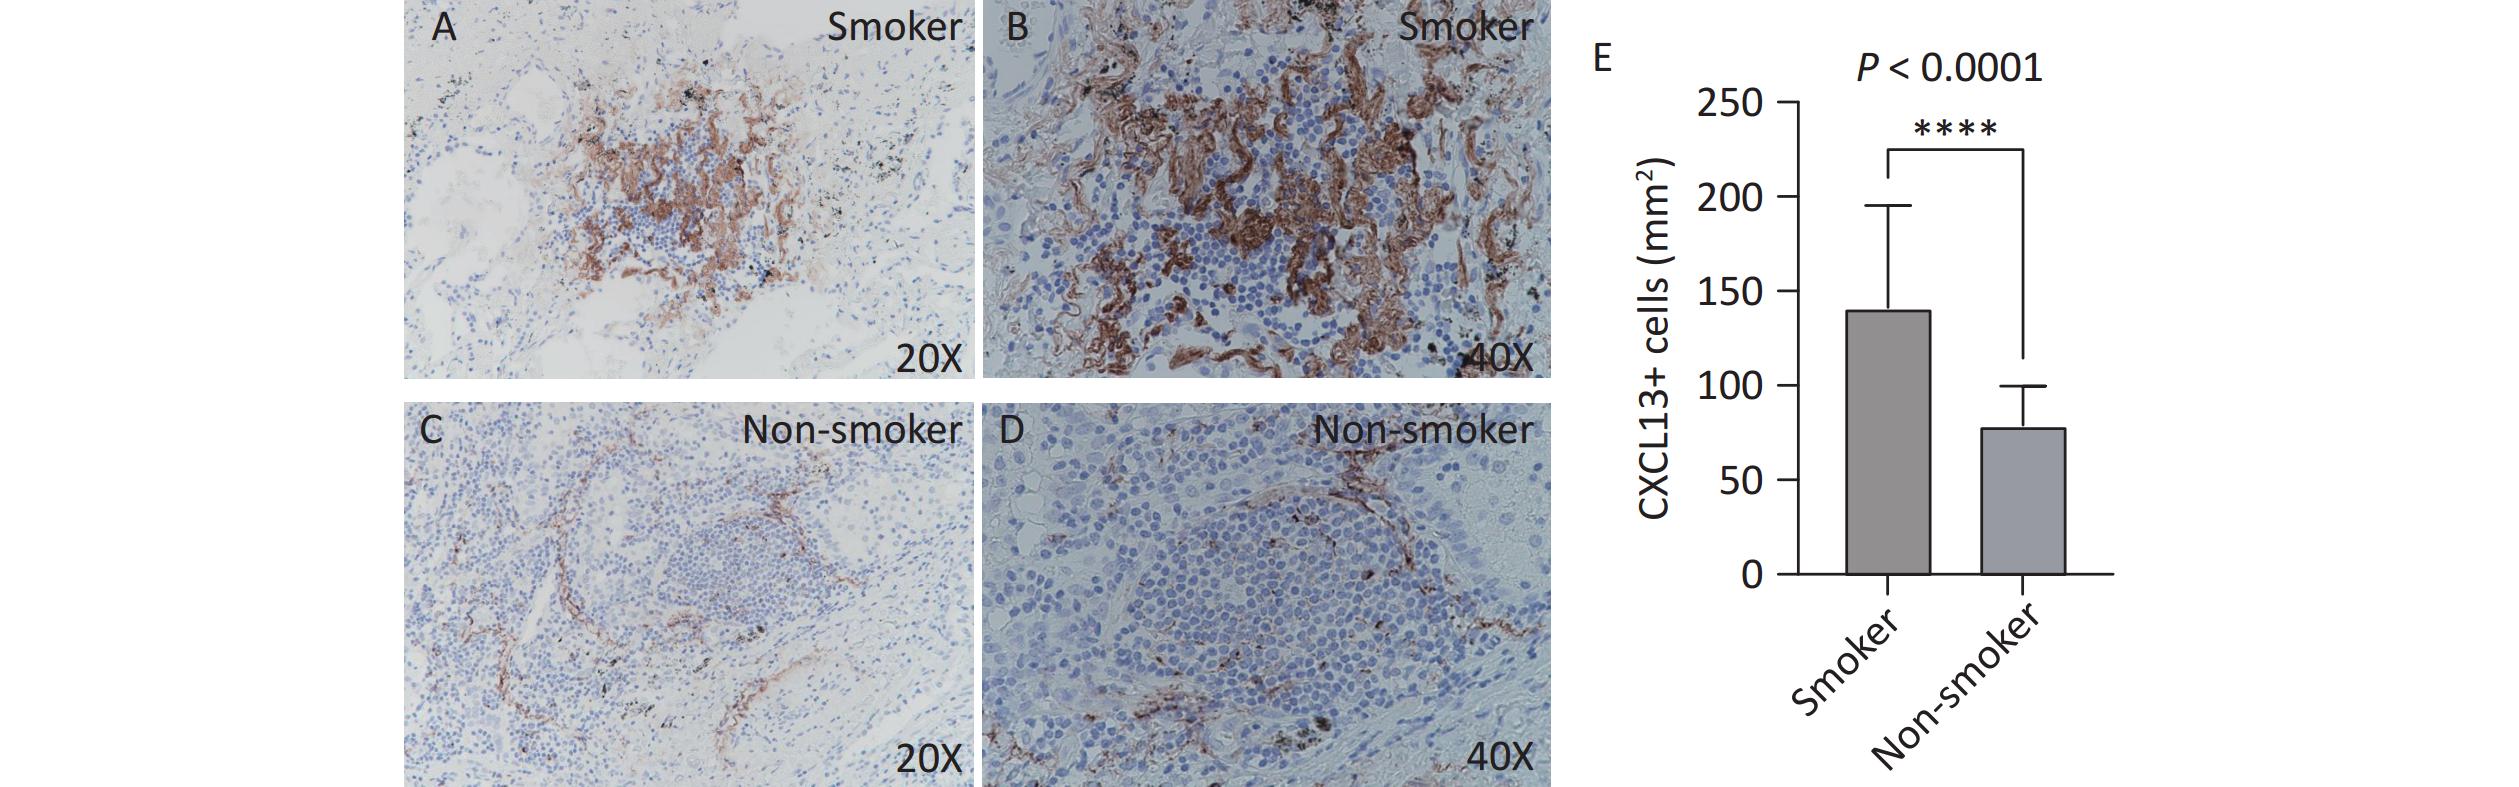
CXCL13 expression in TLS was assessed by immunohistochemistry. The number of CXCL13-positive cells per unit area was significantly higher in the smoking group (Figure 4A, B) than that in the non-smoking group (141.3 vs. 79.1, P < 0.0001; Figure 4C, D). Figure 4 illustrates increased CXCL13 expression in the TLS of smokers.
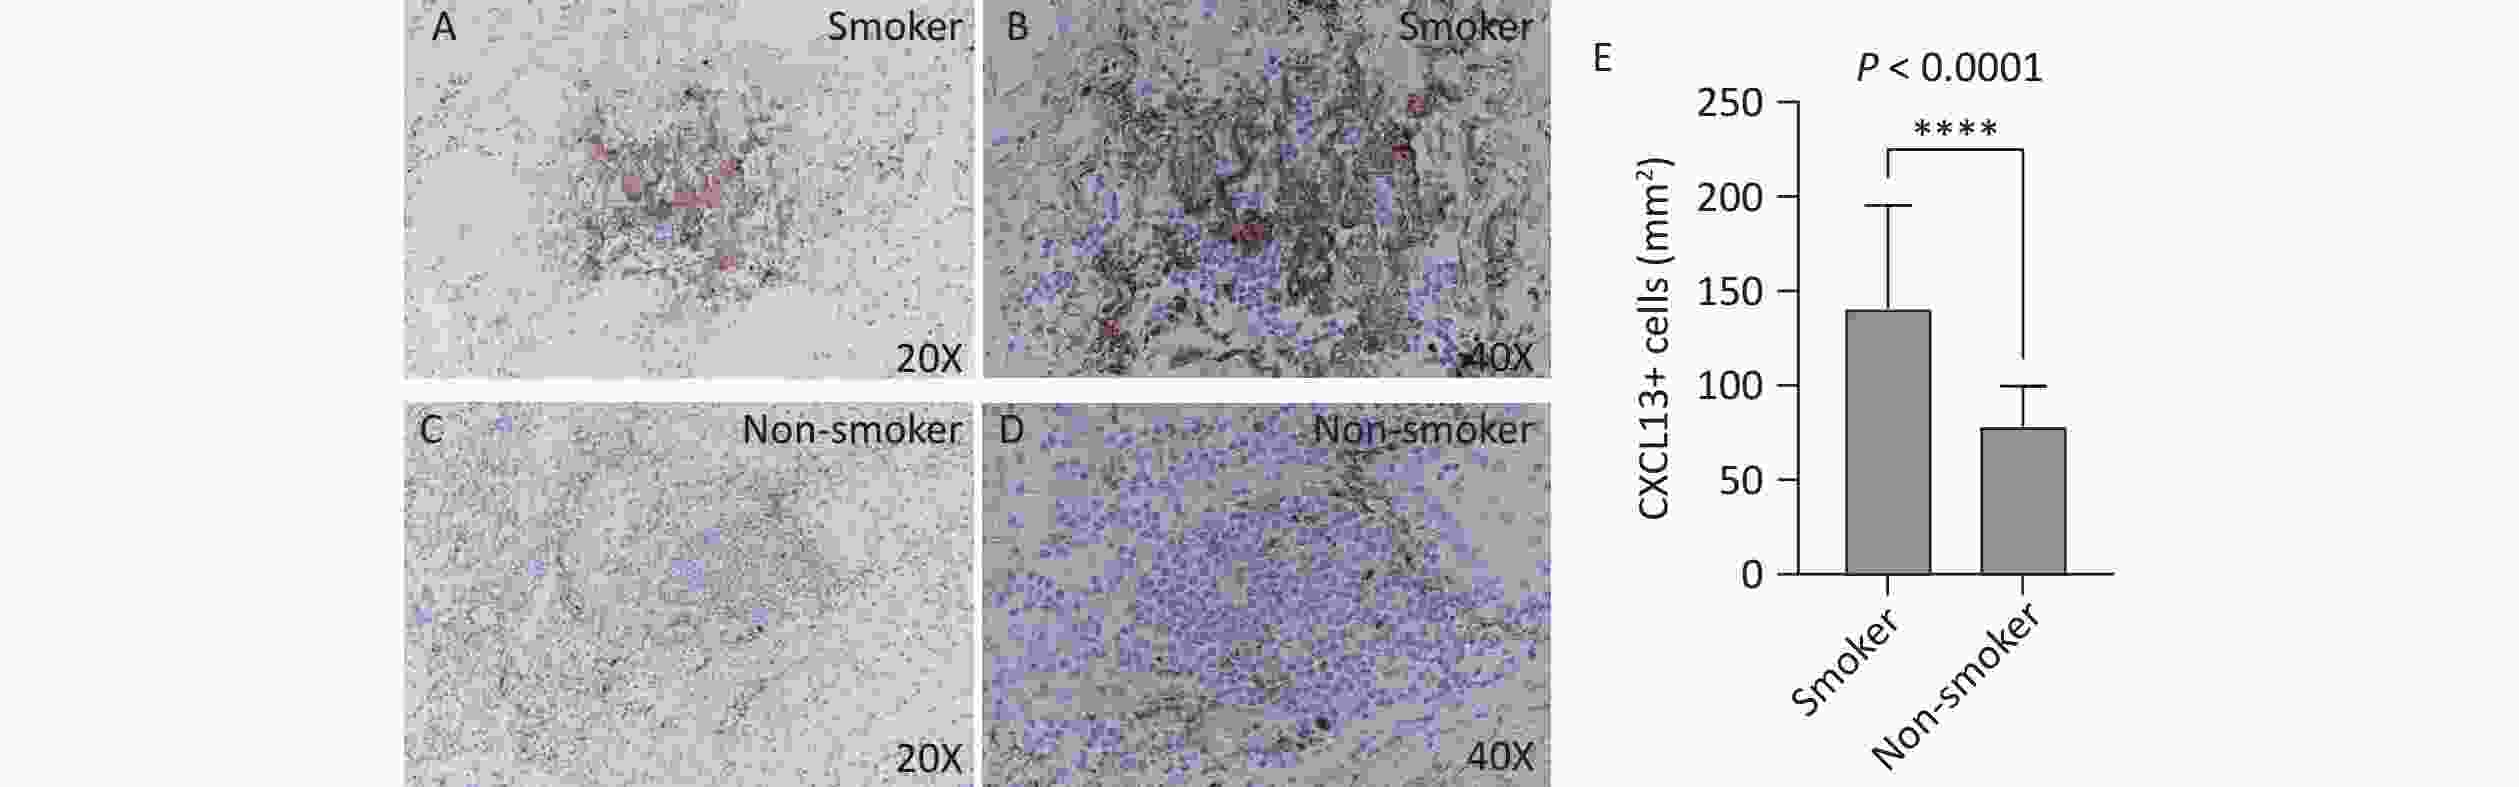
Figure 4. CXCL13 expression in lung TLS of patients with TB. Brown represents CXCL13-positive staining. (A, B) Smoking group (20X and 40X magnification, respectively). (C, D) Non-smoking group (20X and 40X magnification, respectively). (E) Quantitative analysis. TLS, Tertiary Lymphoid Structures; TB, Tuberculosis; CXCL13, C-X-C Motif Chemokine Ligand 13.
-
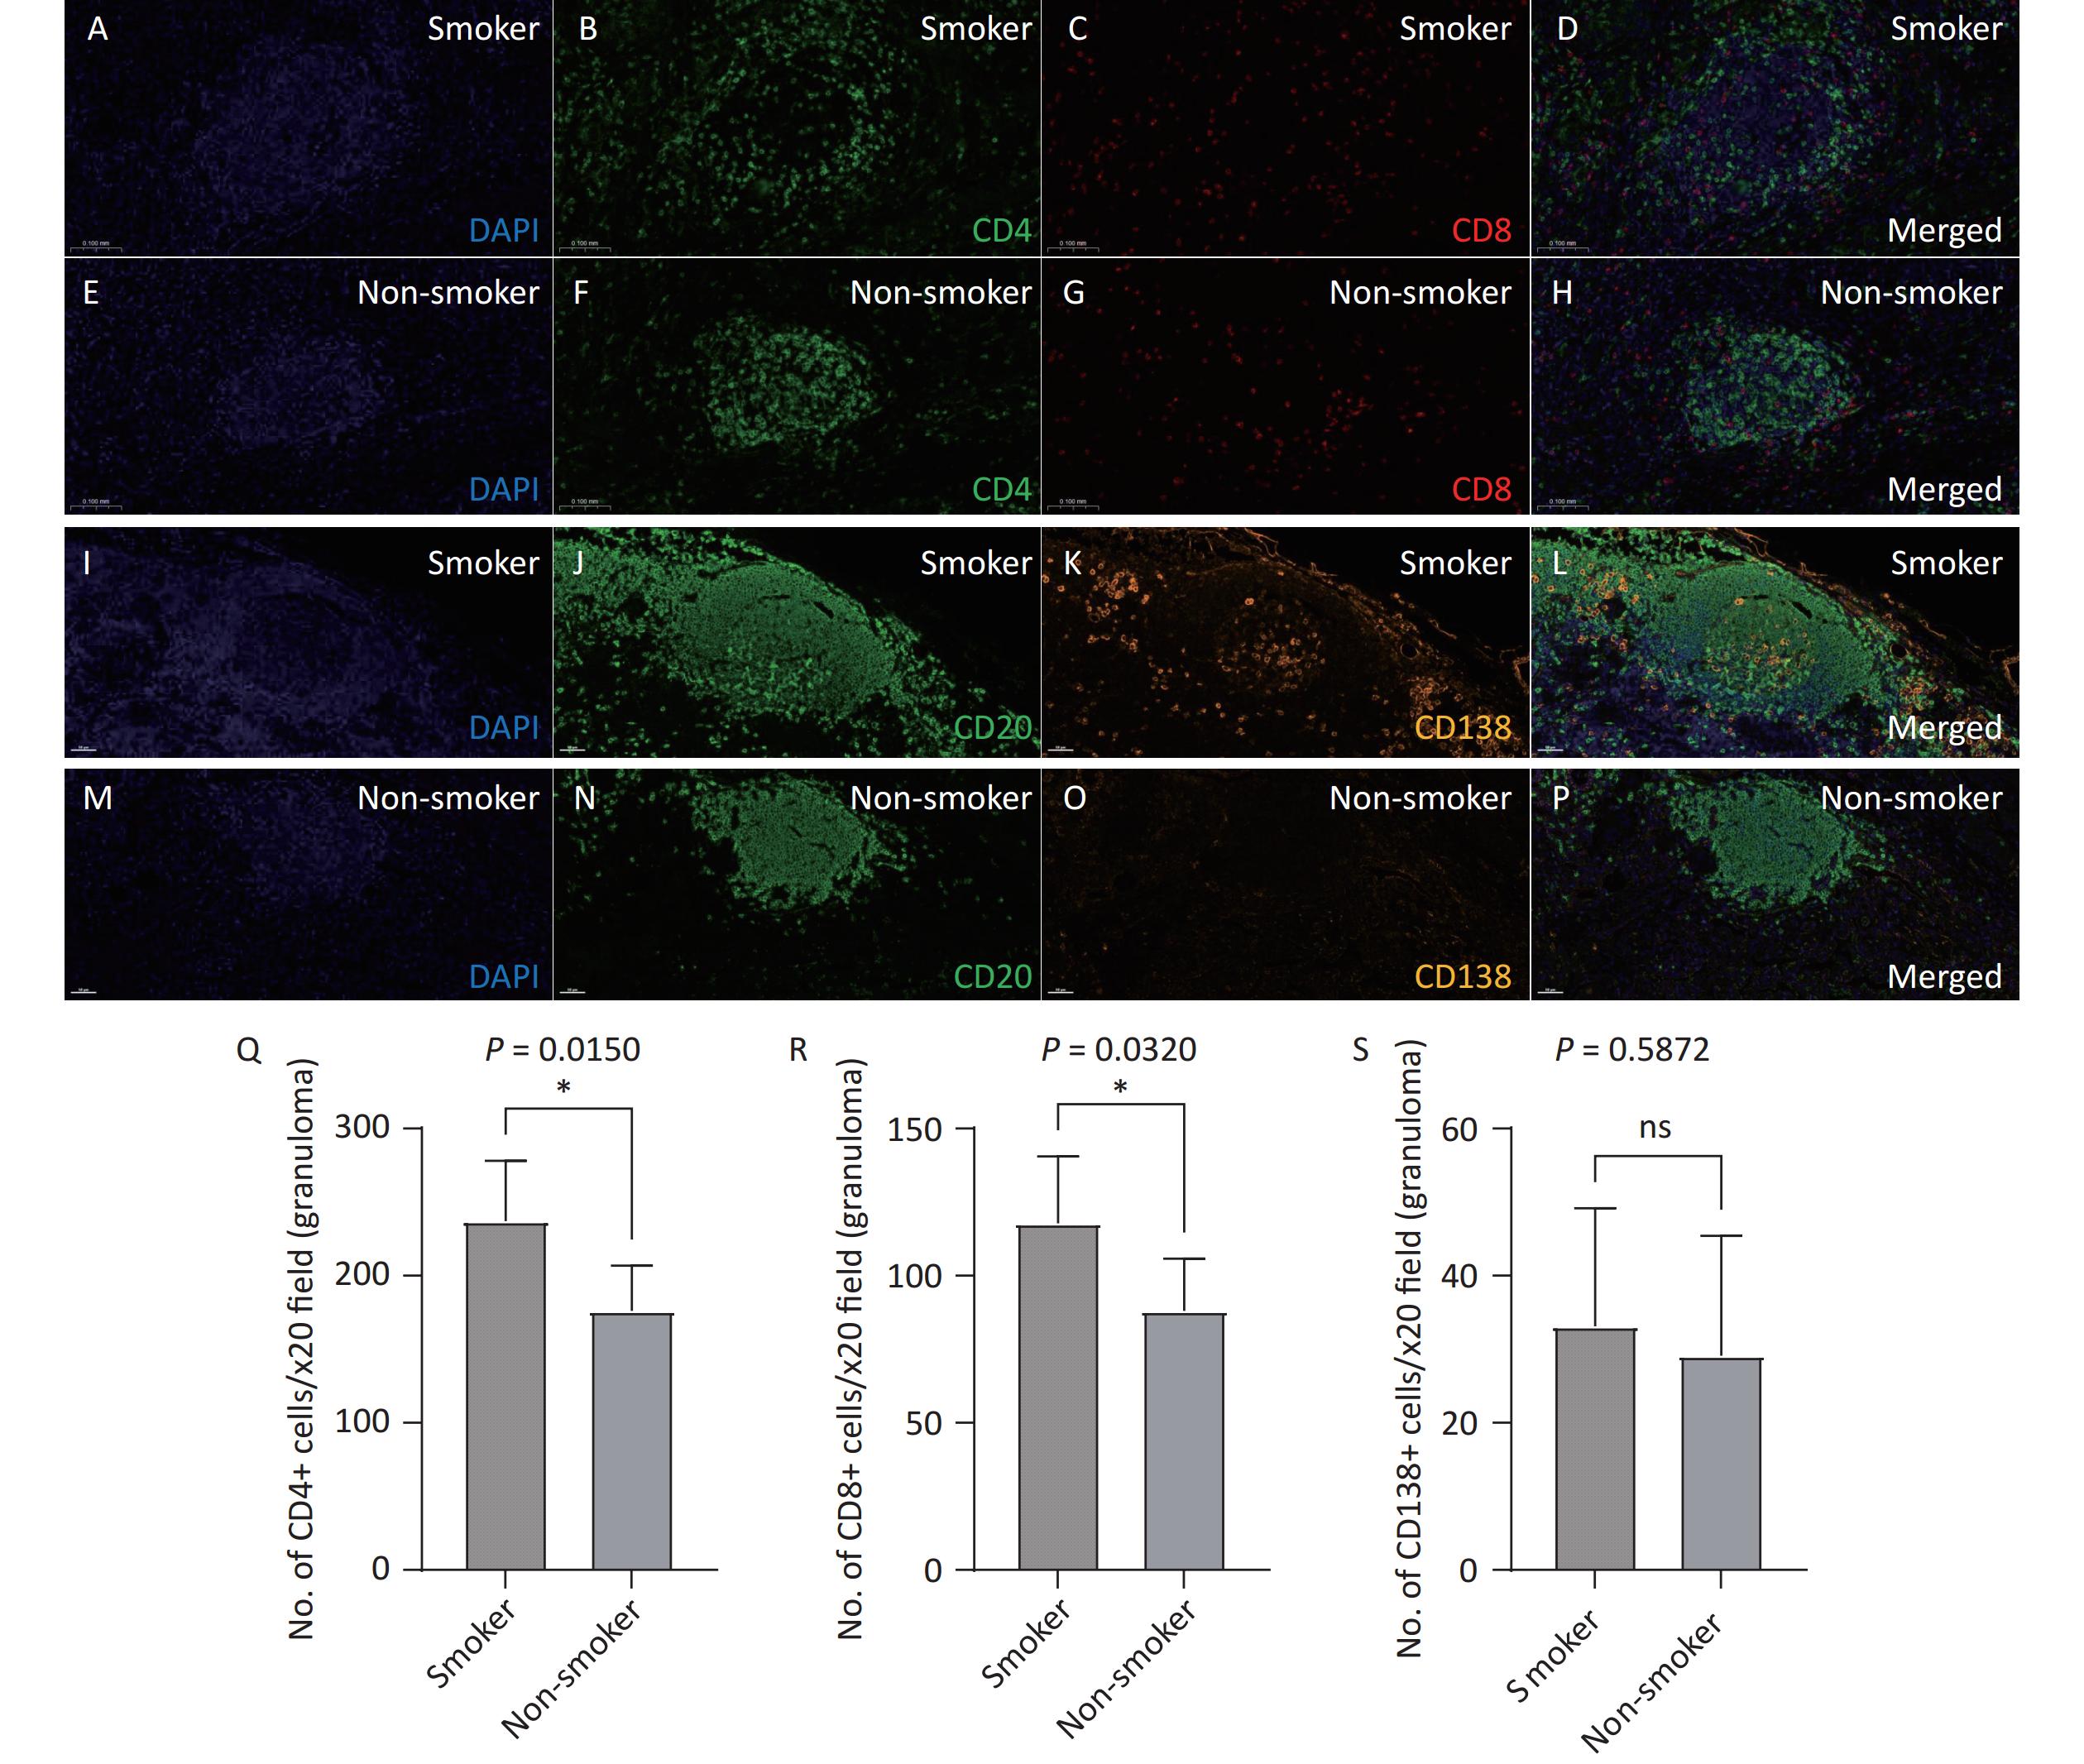
Opal multiplex staining was used to analyze the distribution of lymphocytes and plasma cells in the TLS. Both smoking patients with TB (Figure 5A–D, I-L) and non-smoking patients with TB (Figure 5E–H, M-P) exhibited a predominance of CD20+ B cells in their TLS, along with a substantial presence of CD4+ and CD8+ T cells and plasma cells (CD138+). Under 20X fluorescence microscopy, the number of CD4+ T cells (237.1 vs. 176.2, P = 0.0150) and CD8+ T cells (117.8 vs. 88.10, P = 0.0320) in the TLS was significantly higher in the smoking group than in the non-smoking group, while the number of CD138+ plasma cells did not differ significantly between the two groups (33.10 vs. 29.10, P = 0.5872). These findings suggest that smoking exacerbates immune responses within the TLS by promoting lymphocytes activation.
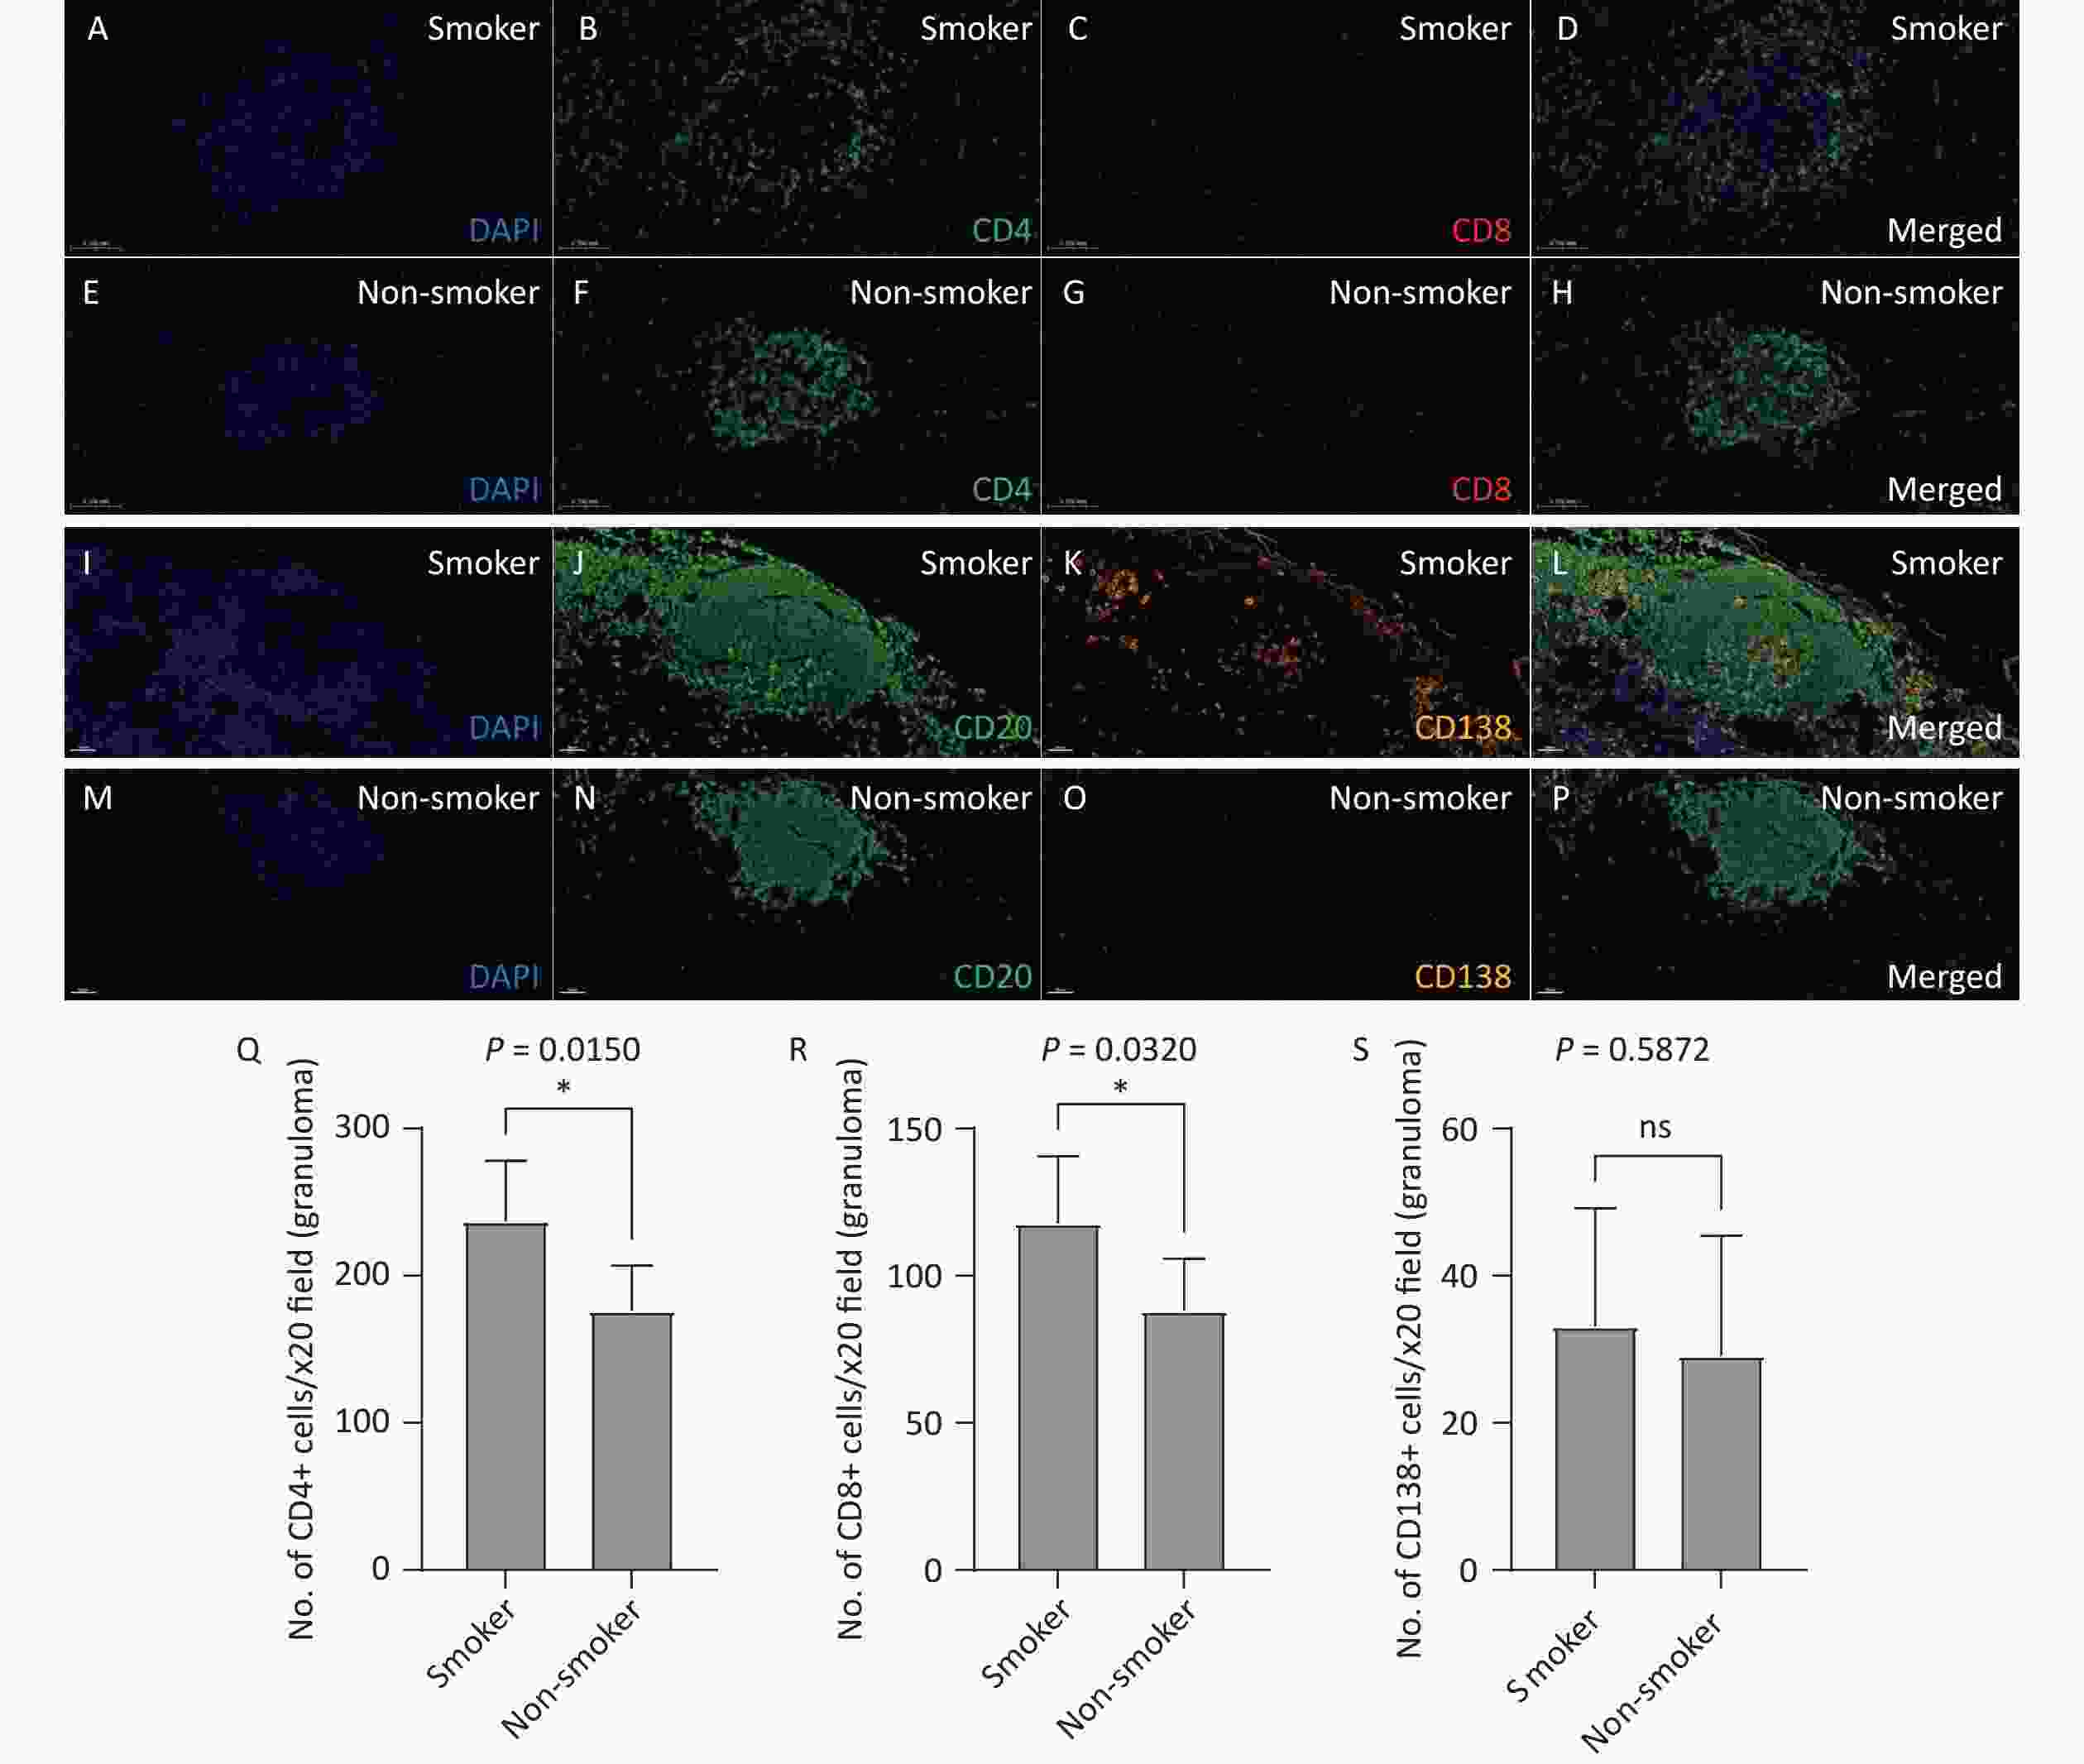
Figure 5. Analysis of T and B lymphocyte subpopulations in lung TLS of patients with TB. Lung tissue sections from smoking (A–D) and non-smoking (E-H) patients with TB were stained with CD4 (Q) and CD8 (R) antibodies. DAPI: blue; CD4: green; CD8: red. Lung tissue sections from smoking (I-L) and non-smoking (M-P) patients with TB were stained with CD20 and CD138 (S) antibodies. DAPI: blue; CD20: green; CD138: orange. (20X magnification). TLS, Tertiary Lymphoid Structures; TB, Tuberculosis; CD4, Cluster of Differentiation 4; CD8, Cluster of Differentiation 8; CD20, Cluster of Differentiation 20; CD138, Cluster of Differentiation 138.
-
To our knowledge, the current study is the first to demonstrate that the number of lung TLS significantly increased and was associated with increased severity of lung lesions on chest CT in smokers with TB. The positive correlation between the number of lung TLS and TB severity score highlights the potential role of lung TLS in TB disease progression. Immunohistochemical analysis revealed a significant increase in the expression of B cells, CXCL13, and T cells within the TLS in the smoking TB group. These findings suggest that smoking may exacerbate pathological lung inflammation and damage in patients with TB by promoting TLS formation and immune activation.
After Mtb infection, B cells aggregate in the lungs to form B cell follicles. The lung TLS, a localized immune structure, plays dual roles in TB. TLS enhance local immune responses by aggregating immune cells such as B cells, T cells, and dendritic cells to combat pathogen invasion, thereby offering protective effects. In patients with TB, lung TLS contribute to the development of anti-TB immunity through mechanisms involving B cell activation, antibody production, and T cell regulation[19-21]. However, excessive immune responses may lead to immune-mediated tissue damage, resulting in pulmonary destruction and exacerbating TB[22]. Previous studies have shown that lung TLS play a protective role during latent TB infection, as evidenced by higher TLS numbers in patients with latent TB than in those with active pulmonary TB[21]. Additionally, the duration of TLS in the lungs differs between the susceptible and drug-resistant Mtb strain-infected mice. Research has shown that the number of TLS peaks at week 8 post-Mtb infection, after which it gradually declines, with notable strain-specific differences. Mice infected with susceptible strains showed a sharp decrease in TLS numbers by week 16, whereas mice infected with relatively drug-resistant strains showed a more gradual decline, with no significant reduction until week 45[23]. These observations suggest that lung TLS play a more complex and dual role in chronic TB infections. In our study, however, we found that lung TLS quantity were significantly higher in smokers with TB, and these numbers correlated positively with TB severity as assessed by chest CT. This suggests that, in the context of smoking, an increase in lung TLS may not represent a simple protective immune response but rather an overactivated immune process. Immunohistochemical analysis revealed a significant increase in the number of B cells, T cells, and CXCL13 within the TLS in smokers with TB. This excessive lung TLS formation likely intensifies local inflammatory responses and promotes sustained inflammatory responses, possibly by inducing the continued release of inflammatory factors, such as CXCL12, CXCL13, CCL19, CCL21, and IL-23, leading to overactive immunity and ultimately causing pathogenic tissue damage[24].
Although the role of lung TLS formation and its impact on lung damage in smoking patients with TB has not been previously reported, studies have shown that exposure to cigarette smoke can induce airway inflammation and promote TLS formation[25]. In COPD, TLS, primarily composed of B cells, are found in small airways and lung parenchyma, and their presence is correlated with disease severity and lung function decline[14,15,26]. Smoking-induced chronic airway inflammation and oxidative stress may disrupt lung immune tolerance, promoting persistent activation of immune cells and the formation of lung TLS. Harmful substances produced by smoking, such as toxic chemicals, may influence immune cell function and migration through various pathways, thereby stimulating the proliferation of lung TLS[27].
Regarding the upstream mechanisms that promote lung TLS formation, previous studies have highlighted CXCL13 as a key chemokine involved in recruiting B and Tfh cells to TLS[25]. We hypothesize that the interleukin-17 (IL-17)/CXCL13 axis is a critical pathway in smoking-induced TLS formation. IL-17, secreted by Th17 cells during early TB infection, can induce CXCL13 production, attracting B cells and Tfh cells to the TLS regions, thus driving continuous aggregation and activation of immune cells[24]. Smoking may enhance the activity of IL-17-related pathways through oxidative stress, inflammation, and other mechanisms. For example, reactive oxygen species induced by smoking can activate NF-κB and MAPK signaling pathways, promoting the expression and release of IL-17[14,28]. Under smoking conditions, this chronic immune activation leads to persistent lung TLS formation, potentially triggering pathological inflammation and causing destructive damage to lung tissue[19].
In addition to TB, lung TLS play dual roles in other chronic inflammatory diseases[12,13,29]. In autoimmune diseases, TLS may play a protective role in the early stages, whereas in the chronic phase, excessive production of pro-inflammatory cytokines and antibodies by B cells and T cells within TLS may lead to over-inflammation and fibrosis, further impairing organ function[13,30,31]. Whether TLS formation plays a dual role in TB pathogenesis, particularly in the context of concurrent cigarette smoking, requires further investigation.
-
This study was based on clinical data and lung tissue samples from patients with TB without in vitro cell experiments or animal model validation. The specific functions of lung TLS and the molecular signaling pathways involved in the course of TB infection warrant further investigation.
-
In summary, our study demonstrated increased TLS formation in the lung tissues of smokers with TB, and that the number of TLS was positively associated with the severity of lung lesions on chest CT. Cigarette smoking was also associated with the upregulated expression of B-cell chemokines in TB, suggesting that cigarette smoking may exacerbate lung damage by promoting TLS formation during TB pathogenesis.
HTML
Study Design and Patients Selection
Inclusion Criteria
Exclusion Criteria
Data Collection
Baseline Information
TB Severity Scoring on Chest CT
Histological and Immunohistochemical Analysis
Histological Analysis
Immunohistochemical Staining
Multicolor Immunofluorescence Staining
Statistical Analysis
Baseline Characteristics
Lung TLS Quantity and Distribution
Number of TLS in the Peribronchial and Lung Parenchymal Regions
Correlation between TLS Quantity and CT Score
Immune Phenotype and Cytokine Expression in Lung TLS
Lymphocyte Distribution in Lung TLS
CXCL13 Expression
Distribution of T Cells and Plasma Cells in Lung TLS
Study Limitations
Competing Interests There are no conflicts of interest to declare.
Ethics This study was approved by the Medical Ethics Committee of Peking University Third Hospital (ethics approval number: M2022296) and the Medical Ethics Committee of Beijing Chest Hospital (ethics approval number: YJS-2022-043). Written informed consent was obtained from all the patients.
&These authors contributed equally to this work.

 Quick Links
 DownLoad: