
-
Frailty is characterized by a decline in the functioning of various physiological systems and an increased vulnerability to stressors[1]. As the global aging population increases, the prevalence of frailty is gradually growing[2]. China, a country experiencing rapid aging, has already reached a frailty prevalence rate of 10% among its older-adult population, with a similar prevalence observed in middle-aged adults[3-5]. Numerous studies have indicated that frailty increases the risk of multiple adverse health outcomes, including cognitive decline, loneliness, falls, disability, and death[6-11]. Furthermore, recent evidence suggests that frailty can be reversed by effective interventions[12]. Therefore, identifying frailty risk factors is essential to facilitate targeted interventions.
In recent years, research has increasingly focused on the potential risk of frailty associated with exposure to household air pollution (HAP)[13,14]. Studies have found that people's daily exposure to HAP is primarily due to the burning of solid cooking fuel[15,16]. Although solid fuel use is known to cause HAP and the expanded use of clean fuel has been promoted for many years, approximately 2.5 billion people worldwide continue to be exposed to HAP from cooking with solid fuel, including 242 million people in China[17,18]. The inefficient combustion of solid cooking fuel produces numerous air pollutants, such as carbon monoxide, nitrogen dioxide, organic compounds, and particulate matter. In poorly ventilated kitchens, the concentration of these pollutants is shown to be 10–20 times higher than that specified in health guidelines[19]. Exposure to high pollutant concentrations can trigger oxidative stress and other pathophysiological processes, potentially leading to frailty[20-23]. Epidemiological evidence also indicates the impact of solid cooking fuel on frailty in middle-aged and older adults[24]. Although these findings provide evidence of the relationship between solid cooking fuel use and frailty, most previous studies are cross-sectional and fail to illustrate the impact of solid cooking fuel use on the development of frailty. Additionally, these studies focus primarily on short-term exposure, making the specific effects of long-term exposure and transitions in solid fuel use on the development of frailty unclear.
To address these research gaps, this study used data from the China Health and Retirement Longitudinal Study (CHARLS) for the period 2011–2018. Our study aimed to identify frailty trajectories during a 7-year follow-up and to examine the effects of baseline solid cooking fuel use, duration of solid cooking fuel use, and switching cooking fuel types on frailty trajectories. In addition, we estimated the burden of frailty development that could be attributed to solid fuel use. The results enhance our understanding of the development of frailty in middle-aged and older adults, thus providing new insights into the potential mechanisms underlying the association between solid cooking fuel usage and frailty.
-
We used data from the baseline and follow-up surveys of the CHARLS conducted in 2011, 2013, 2015, and 2018. The CHARLS is a prospective national cohort study initiated in China in 2011 that represents a nationally representative sample of Chinese residents aged 45 years and older. To ensure a representative sample, the CHARLS baseline survey covered 150 counties or districts and 450 villages or urban communities across 28 provinces, using multistage stratified probability-proportionate-to-size sampling. In each survey, well-trained interviewers collected information on demographics, household fuel use, and health status through face-to-face interviews using structured questionnaires. Further details about the CHARLS can be found in Zhao et al[25]. The present study was approved by the Ethical Review Committee of Peking University (approval number: IRB 00001052-11015), and all participants provided written informed consent.
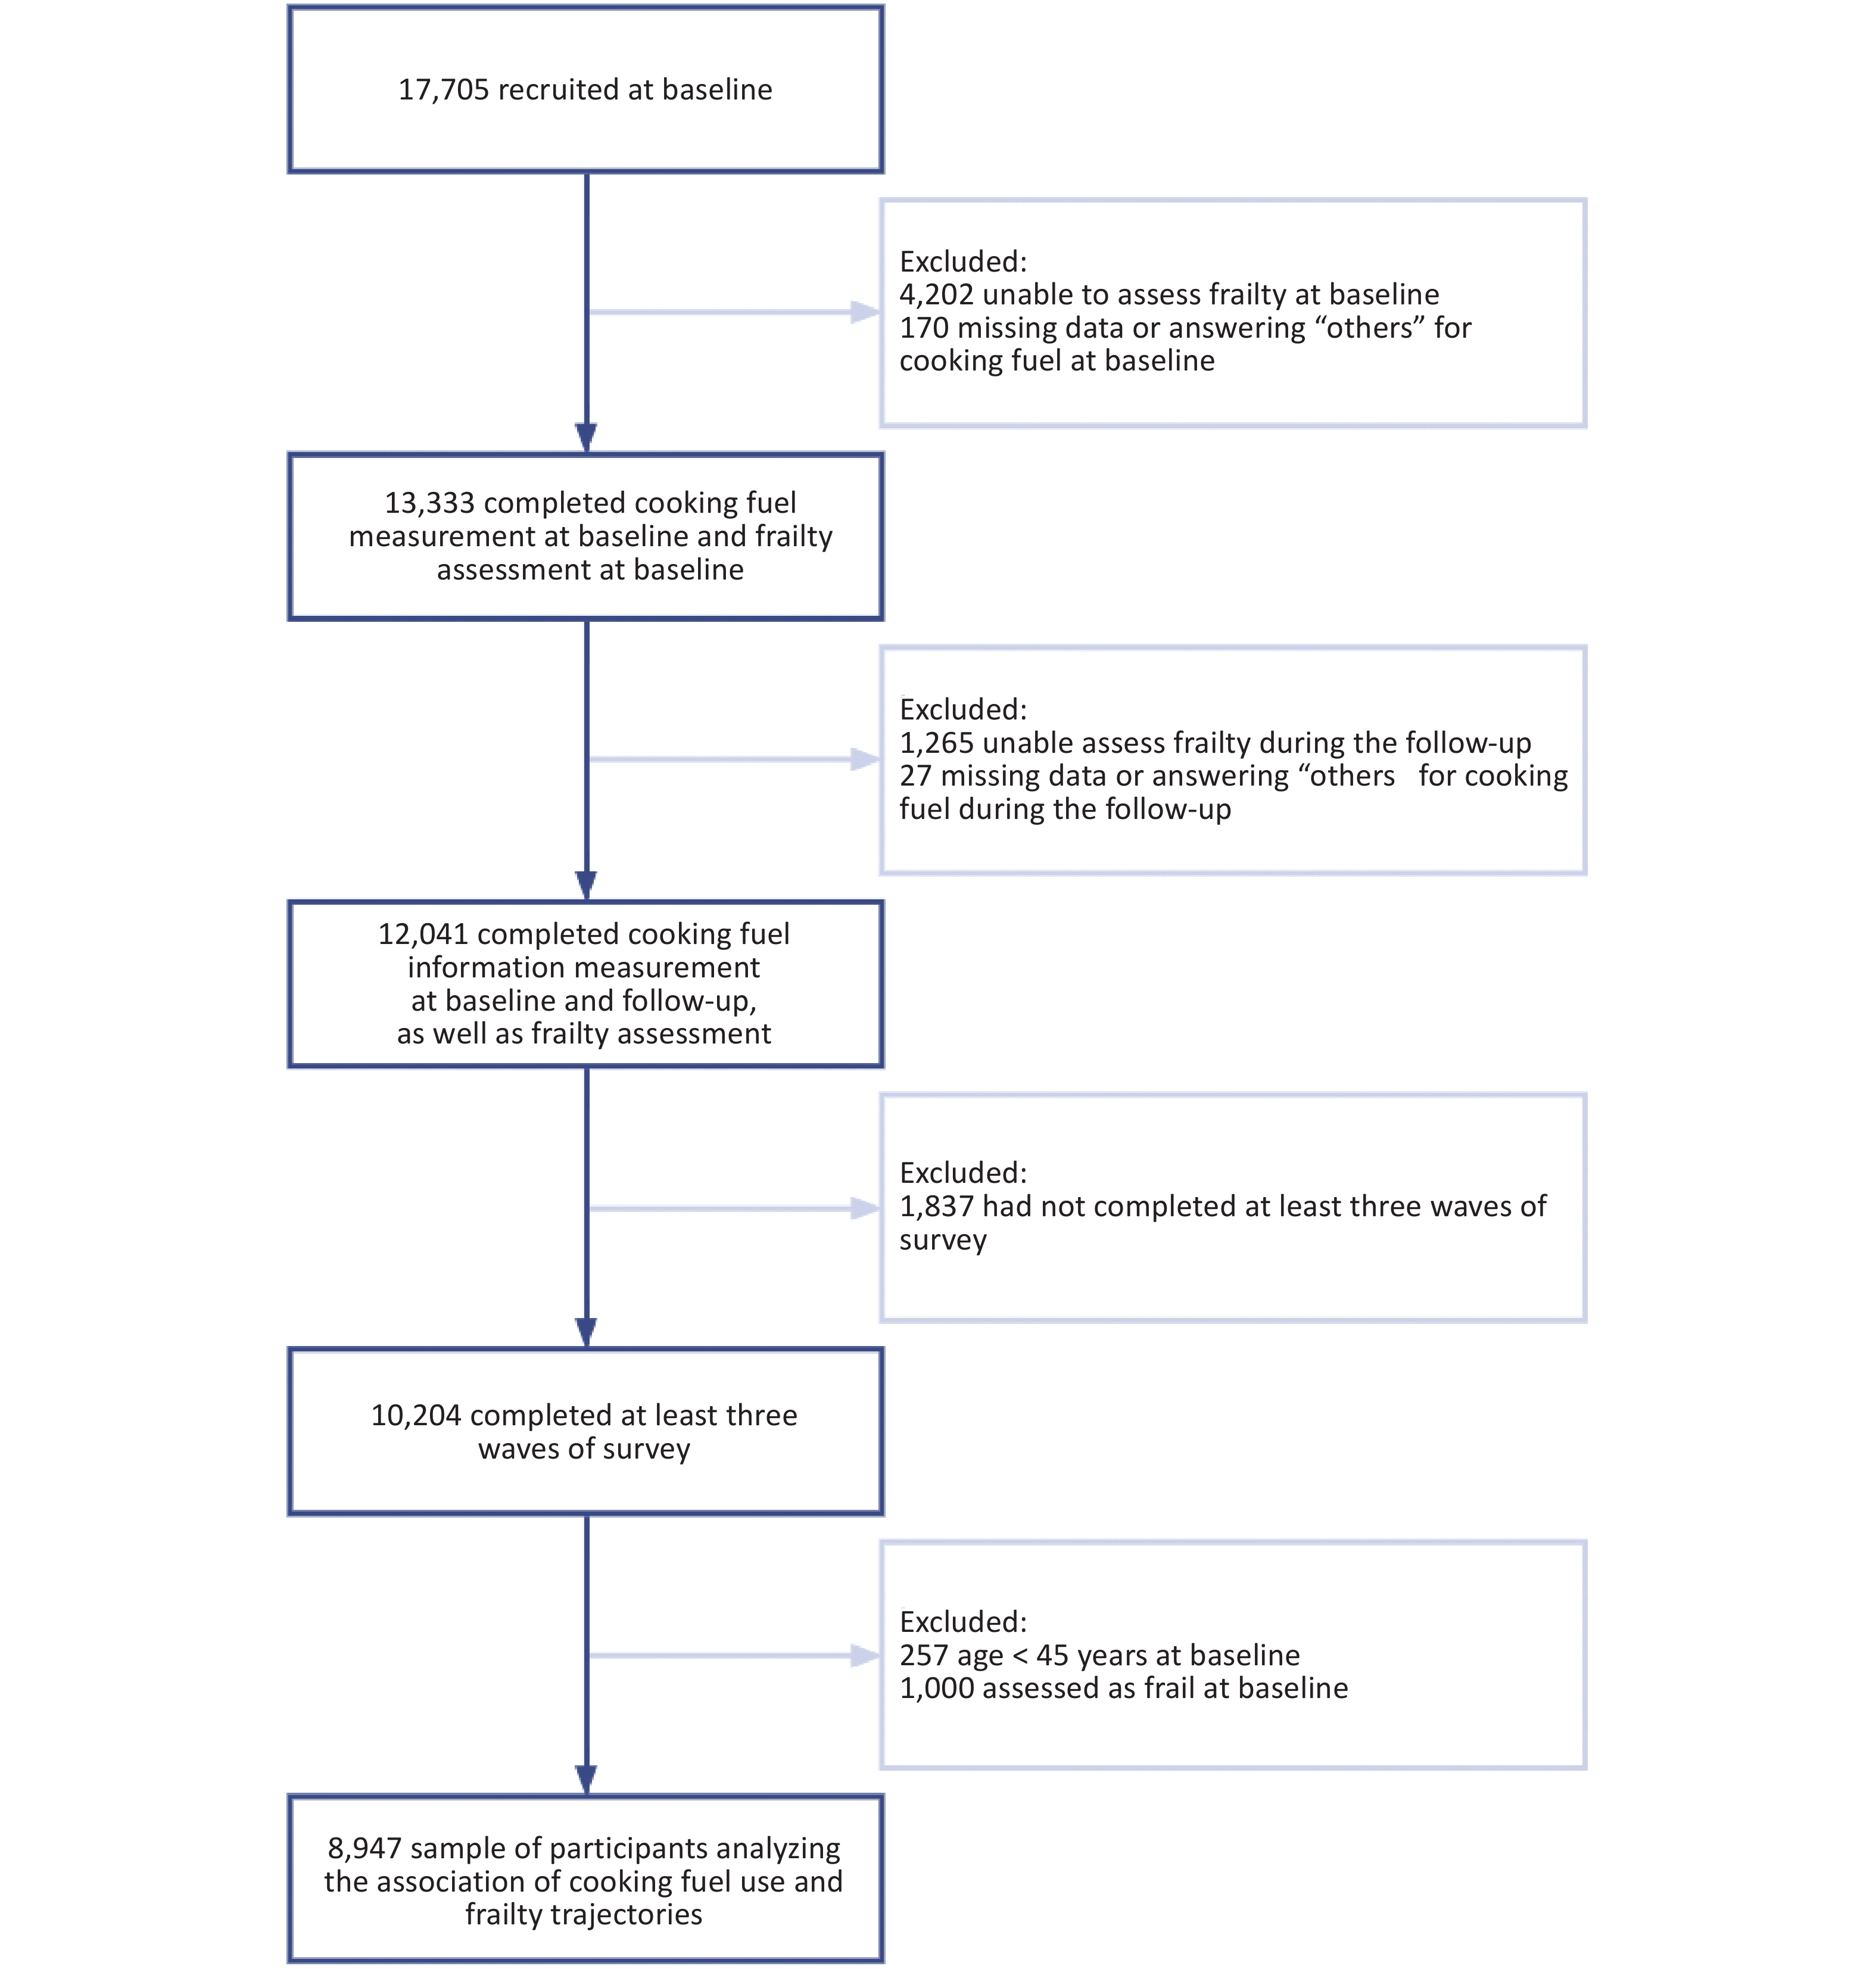
This study retrospectively analyzed 7-year data from CHARLS (2011–2018). A total of 17,705 participants were recruited at baseline. We excluded participants with missing data to determine frailty at baseline and during follow-up (n = 5,467). Participants with missing data or answering “other” for cooking fuel at baseline and during the follow-up were further excluded (n = 197). Participants who did not complete at least three waves of the survey were excluded (n = 1,837). After excluding participants aged less than 45 years at baseline and those who were assessed as frail at baseline (n = 1,257), we finally recruited 8,947 respondents and obtained 32,740 repeated measurements. Figure 1 shows a flowchart of the participant enrolment process. Supplementary Table S1 summarizes the baseline characteristics of included and excluded participants.
Figure 1. Flowchart of the process of the participants’ enrolment.
-
In CHARLS, the types of cooking fuel used were assessed using the question “What is the main source of cooking fuel?” For each wave, participants who reported coal, wood, or crop residues as their primary cooking fuel source were categorized as using solid fuel, while those who reported using natural gas, marsh gas, liquefied petroleum gas, or electricity as their primary cooking fuel source were categorized as using clean fuel. This classification was based on the understanding that clean fuel generally produces fewer air pollutants than solid fuel. A few respondents who answered “other” as their main cooking fuel type were excluded because of uncertainty regarding the specific type of fuel they used. We further divided solid fuel into biomass fuel (e.g., crop residual/wood) and fossil fuel (e.g., coal) to examine the effects of different solid fuel types.
-
To evaluate the short-term and long-term effects of solid fuel usage, we followed previous studies by estimating the self-reported duration of use based on individuals’ frequency of solid fuel usage[26]. For example, participants who self-reported using clean fuel in all survey waves were categorized as having a duration of solid fuel use of 0 years, while those who used solid fuel in all survey waves were categorized as having a duration of solid fuel use of 7 years or more. Accordingly, we classified the duration of solid fuel use into 0 years, 1–6 years, and ≥ 7 years. The definition for the duration of solid fuel use is shown in Supplementary Table S2.
-
Cooking fuel type switching was determined by comparing the primary cooking fuel at baseline with the main cooking fuel during the follow-up. For example, participants who mainly used solid fuel for cooking at baseline but self-reported using mainly clean fuel for cooking in the follow-up surveys were considered to have switched from solid to clean fuel. Based on this processing, we classified cooking fuel type switching into persistent clean fuel, persistent solid fuel, clean-to-solid fuel, and solid-to-clean fuel. The definitions are shown in Supplementary Table S3.
-
Based on the deficit accumulation model[27], we selected 28 items to construct the Frailty index (FI), including functional limitations, self-reported health status, depressive symptoms, medical conditions, and cognitive status (details of the item definitions are shown in the Supplement Methods and Supplementary Table S4). Different waves were included in the same items, and each item was dichotomized or mapped from 0 (healthiest status) to 1 (unhealthiest status). The FI was calculated as the ratio of the item scores for each participant to the total number of items, ranging from 0 to 1. A higher FI indicated greater frailty, and frailty status was defined as a score of 0.25 or greater on the FI. To illustrate the development of frailty, we referred to Li et al. and calculated each participant’s FI to fit frailty trajectories[28].
-
According to prior knowledge, the following covariates were considered in our study: age (continuous variable), body mass index (BMI) (continuous variable), sex (male or female), residential location (urban or rural), marital status (not married or married), smoking status (no or yes), drinking status (no or yes), and education (low education, middle education, or high education).
Age, sex, and residential location were obtained from each module of the standardized questionnaire. Weight and height were measured on-site using standardized procedures. BMI was calculated as weight (kg) divided by height squared (m2). By asking participants about their current marital status, we classified those who were married or partnered as “married”. Participants who were separated, divorced, widowed, or had never been married were categorized as “not married”. Non-smokers were defined as participants who had smoked fewer than 100 cigarettes in their lifetime, whether currently or in the past. Non-drinkers were defined as participants who had not consumed any alcoholic beverages in the past year. Education level was assessed by asking the question, “What is the highest level of education completed?” Low education level was defined as less than 6 years of education (graduating from elementary school or below), middle education level was defined as 6 to 12 years of education (graduating from middle school, high school, or vocational school), and high education level was defined as having more than 12 years of education (associate’s degree or higher).
-
The Atmospheric Composition Analysis Group computed the ground-level concentrations of ambient PM2.5 in the participants’ residential addresses. The details of these calculations are available in the prior literature[29,30]. In summary, ambient PM2.5 at a spatial resolution of 0.01 × 0.01 (1 km × 1 km) was obtained by incorporating aerosol optical depth data combined with the GEOS-Chem chemical transport model and ground monitoring data into the geographically weighted regression model. This process involved the use of aerosol optical depth data retrieved from multiple satellites, such as the Twin MODerate Resolution Imaging Spectroradiometer, Multiangle Imaging SpectroRadiometer, and Sea-viewing Wide Field-of-view Sensor. Additionally, our estimations of ambient PM2.5 were consistent with cross-validated concentrations from another exposure dataset in China (R2 = 0.81)[31]. In this study, we calculated the average annual concentration of ambient PM2.5 at the city level from 2011 to 2018 as a covariate.
-
Because solid heating fuel is another potential source of indoor air pollutants that could increase frailty risk, we included heating fuel types as a covariate[21,32]. The types of heating fuel were assessed using two standardized questions: “Does your residence have heating?” and “What is the main heating energy source?” The classification of heating fuel was similar to that of cooking fuel. Coal, wood, and crop residues were categorized as solid fuel, while solar power, natural gas, liquefied petroleum gas, electricity, and central heating were classified as clean fuel.
-
Considering the potential impact of the building environment[33,34], we included house area (continuous variable) and household building type (one-story or multi-story) as covariates in the analysis. These data were obtained from the housing characteristics module of the standardized questionnaire.
-
Early-life fuel exposure was assessed by the main household cooking fuel in the past, which was obtained through the question “From your birth, what have been the main sources of cooking fuel?” in the CHARLS survey. Participants who self-reported using coal in the past were classified as solid fuel users, whereas those who reported using electricity or not cooking were classified as clean fuel users.
-
We divided the population into subgroups based on baseline cooking fuel type, duration of solid fuel use, and changes in cooking fuel type. Locally weighted smoothed regression was used to assess trends in each subgroup, and linear mixed models were used to explore whether the fixed-effect coefficients for cooking fuel × time were statistically significant across different subgroups. The coefficients were interpreted as the average slopes of the trajectories across different subgroups. In this analysis, we compared the effect of different cooking fuel types on frailty trajectories across the overall population without accounting for trajectory heterogeneity.
Based on the previous analysis, we further considered the heterogeneity of frailty trajectories within the population using group-based trajectory modeling (GBTM). GBTM is a latent class growth analysis model that hypothesizes the existence of heterogeneous subgroups within a population, each with unique developmental trajectories[35]. Specifically, GBTM uses repeated measurements of each individual’s FI as a variable to fit individual curves. These curves are then clustered to obtain heterogeneous trajectories, which describe the heterogeneity in frailty development over the observation period. Furthermore, the shape of these developmental trajectories are identified using model parameters obtained through maximum likelihood estimation[36]. Because GBTM is an unsupervised clustering model, determining the optimal number of subgroups and their respective trajectories (i.e., the optimal model) requires specific selection criteria[37]. Selection criteria of the optimal model have been reported in previous studies[38,39] as follows: (1) lowest Bayesian information criteria value; (2) acceptable proportion of the population (≥ 5.0%); and (3) mean posterior probabilities greater than 0.70. We then traversed models with up to five latent classes and up to cubic polynomials, selecting the optimal model based on the following criteria for model selection (details of GBTM are shown in the Supplement Methods). The optimal model was the cubic trajectories for all three groups. Supplementary Table S5 lists the results of the GBTM fitting process. Supplementary Table S6 lists the estimated parameters for the best-fitting GBTM model.
Multinomial logistic regression models were used to identify the association between cooking fuel use and frailty trajectories. This study considered four analytical perspectives to explain the impact of cooking fuel use on these trajectories: (1) the relationship between baseline cooking fuel types and frailty trajectories; (2) the relationship between fossil fuel and biomass fuel and the trajectories; (3) the correlation between solid fuel use duration and the trajectories; and (4) the impact of switching cooking fuel types on the trajectories.
Stratified and interaction analyses were conducted to evaluate the modifying role of baseline characteristics in the association between baseline cooking fuel types and the frailty trajectories. Subgroups were based on age (45–59 or ≥ 60 years), obesity (BMI < 25 kg/m2 or ≥ 25 kg/m2), sex, residential location, material status, smoking status, drinking status, education, ambient PM2.5 (< median or ≥ median), and heating fuel types. Furthermore, we investigated whether the building environmental covariates, such as house area (< median or ≥ median) and household building types, influenced the associations.
Population-attributable fractions (PAF) are the proportion of adverse outcomes that can be attributed to a certain exposure[40]. In this study, we calculated PAF by using the R package “AF” (version 0.1.5) to quantify the burden of frailty development attributed to the usage of solid cooking fuel (details of PAF are shown in the Supplement Methods). The PAF of frailty development represents the proportion of individuals within their trajectory who could demonstrate a stable FI when not exposed to solid cooking fuel. Because of the more straightforward interpretation of the PAF with binary exposure variables, we considered only the type of cooking fuel used at baseline as the exposure variable[41].
Several sensitivity analyses were performed. (1) We repeated the analyses using data with multiple imputed values for baseline covariates. The R package “mice” (version 3.14.0) was used to impute missing values, and the quality of the filled data was statistically tested (Supplementary Table S7). Specific details of the missing covariate information are shown in Supplementary Table S8. (2) We considered sampling weights to evaluate the impact of the sampling probabilities on the primary analysis results. (3) We additionally adjusted for early-life exposure to solid cooking fuel.
The following variables were adjusted for confounding factors in all analyses: age, BMI, sex, residential location, marital status, smoking status, drinking status, education, ambient PM2.5, and heating fuel type. Descriptive statistics for continuous variables are presented as means ± standard deviations or medians [interquartile range], while categorical variables are reported as frequencies (percentages). GBTM was used the SAS (version 9.4) add-on package “PROC TRAJ”, and other statistical analyses were conducted using R (version 4.2.1). In this study, a two-tailed P < 0.05 was considered statistically significant.
-
Table 1 presents the baseline characteristics of the participants divided according to their frailty trajectories. Overall, compared to members of the low-stable trajectory, members of the moderate-increasing and fast-increasing trajectories were associated with being older, more likely to be female, living in rural areas, being single, non-smokers, non-drinkers, having lower education levels, living in areas with lower ambient PM2.5, and using solid heating fuel. Supplementary Table S9 summarizes the baseline characteristics of participants using solid and clean cooking fuel. Individuals using solid fuel were older, lived in rural areas, were more likely to be male and nonsmokers, had lower education levels, used solid heating fuel, and lived in a multi-story building.
Characteristics Low-stable Moderate-increasing Fast-increasing P value N 5789 2603 555 Baseline solid cooking fuel, n (%) 2801 (48.38) 1576 (60.55) a 378 (68.11) a < 0.001 Age, years 56.42 (8.09) 58.92 (8.65) a 61.20 (8.54) a < 0.001 BMI, kg/m2 23.50 (3.71) 23.86 (4.39) a 23.46 (4.06) 0.001 Males, n (%) 3234 (55.90) 1074 (41.28) a 205 (37.07) a < 0.001 Rural, n (%) 4396 (75.96) 2134 (81.98) a 465 (83.94) a < 0.001 Married, n (%) 5379 (92.92) 2309 (88.71) a 477 (85.95) a < 0.001 Smoker, n (%) 2530 (43.70) 958 (36.80) a 185 (33.39) a < 0.001 Drinker, n (%) 2559 (44.22) 927 (35.63) a 189 (34.05) a < 0.001 Education, n (%) < 0.001 Low education 3193 (55.16) 1901 (73.03) a 453 (81.62) a Middle education 2416 (41.73) 668 (25.66) 99 (17.84) High education 180 (3.11) 34 (1.31) 3 (0.54) Ambient PM2.5, μg /m3 50.71 (16.49) 49.46 (16.37) a 47.06 (16.49) a < 0.001 Baseline solid heating fuel, n (%) 2933 (60.81) 1587 (72.10) a 378 (78.91) a < 0.001 House area, m2 100.00 [72.00, 150.00] 100.00 [70.00, 140.00] a 100.00 [65.00, 130.00] a < 0.001 Multi-story building, n (%) 2384 (41.18) 913 (35.10) a 154 (27.75) a < 0.001 Note. aP < 0.05 compared to the low-stable trajectory. BMI, body mass index; FI, frailty index. Table 1. Baseline characteristics of the study population by the frailty trajectories
-
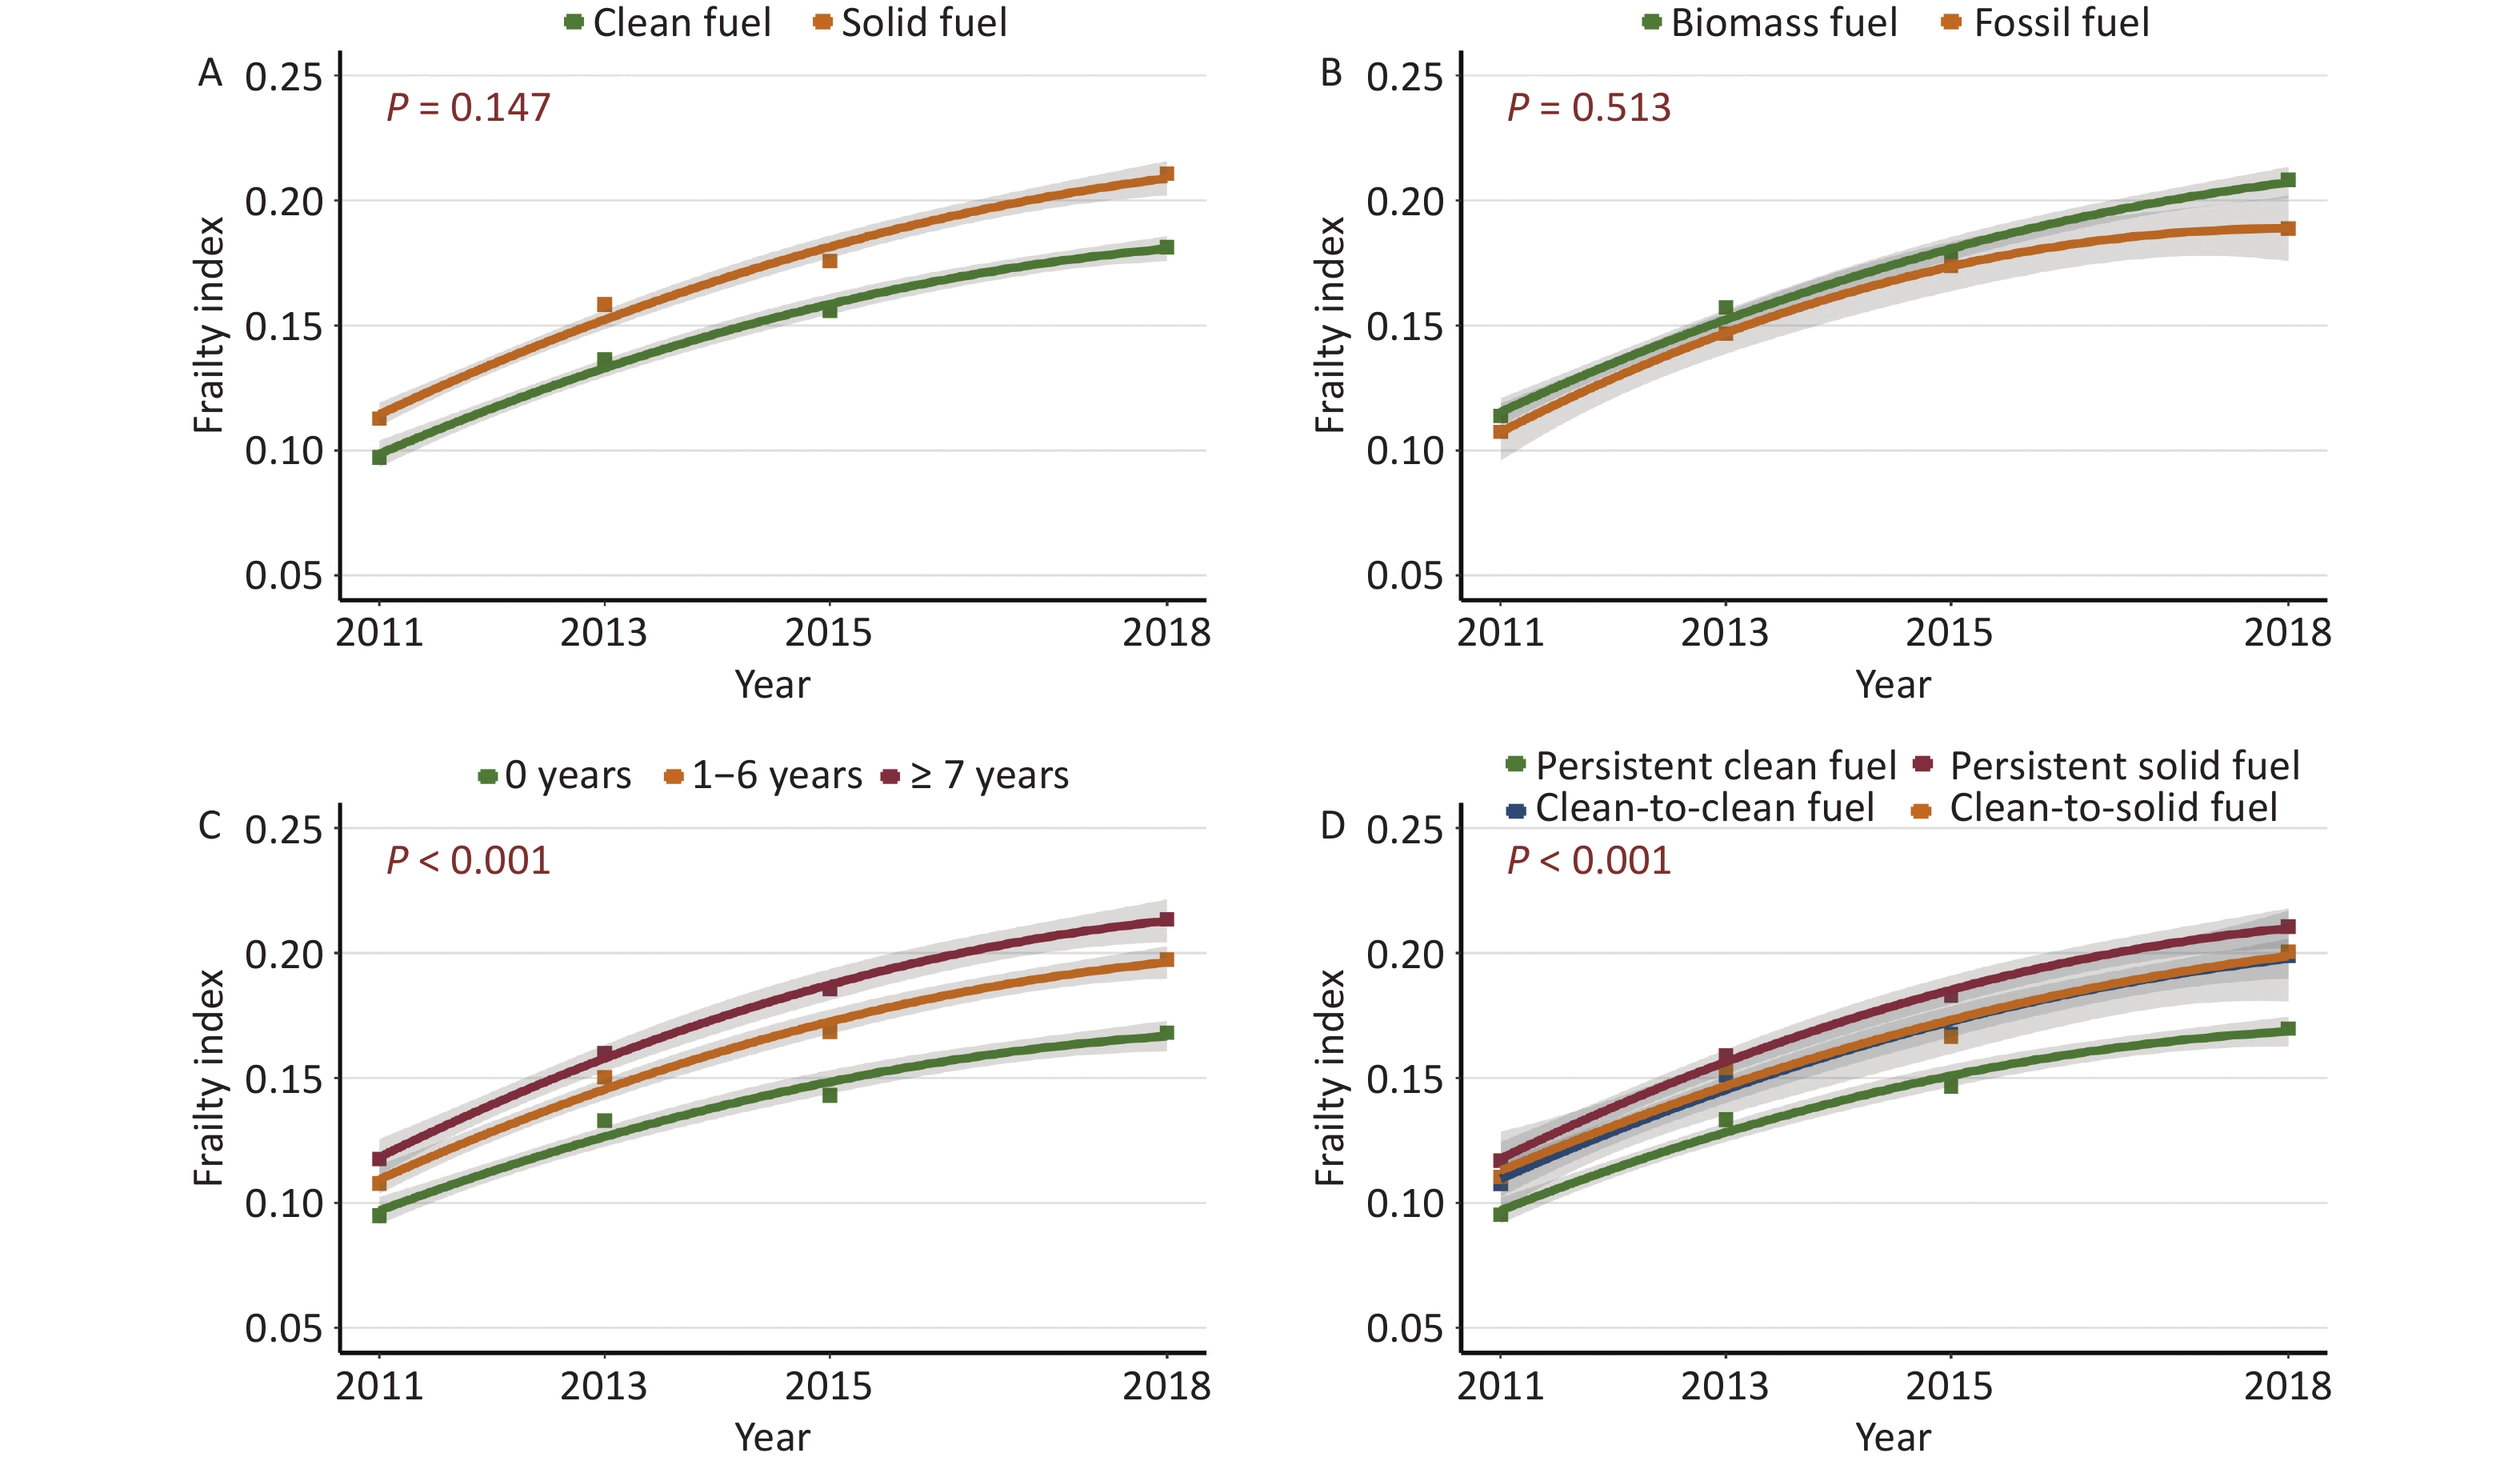
Figure 2 shows the overall frailty trajectories for each subgroup by cooking fuel type. Over time, the FI continued to increase in all subgroups (Figure 2A-2D). Specifically, Figure 2A shows that the average slope of the trajectories for the solid fuel group was significantly higher than that of the clean fuel group (P < 0.001). Figure 2B shows that the trajectories of the biomass and fossil fuel groups almost overlapped (P = 0.989). Figure 2C shows that the subgroup with more prolonged self-reported duration of solid fuel consumption had a higher slope (P < 0.001). In addition, Figure 2D shows that, the clean-to-solid fuel group and the solid-to-clean fuel group both maintained a lower FI than the persistent solid fuel subgroup across all waves (P < 0.001).
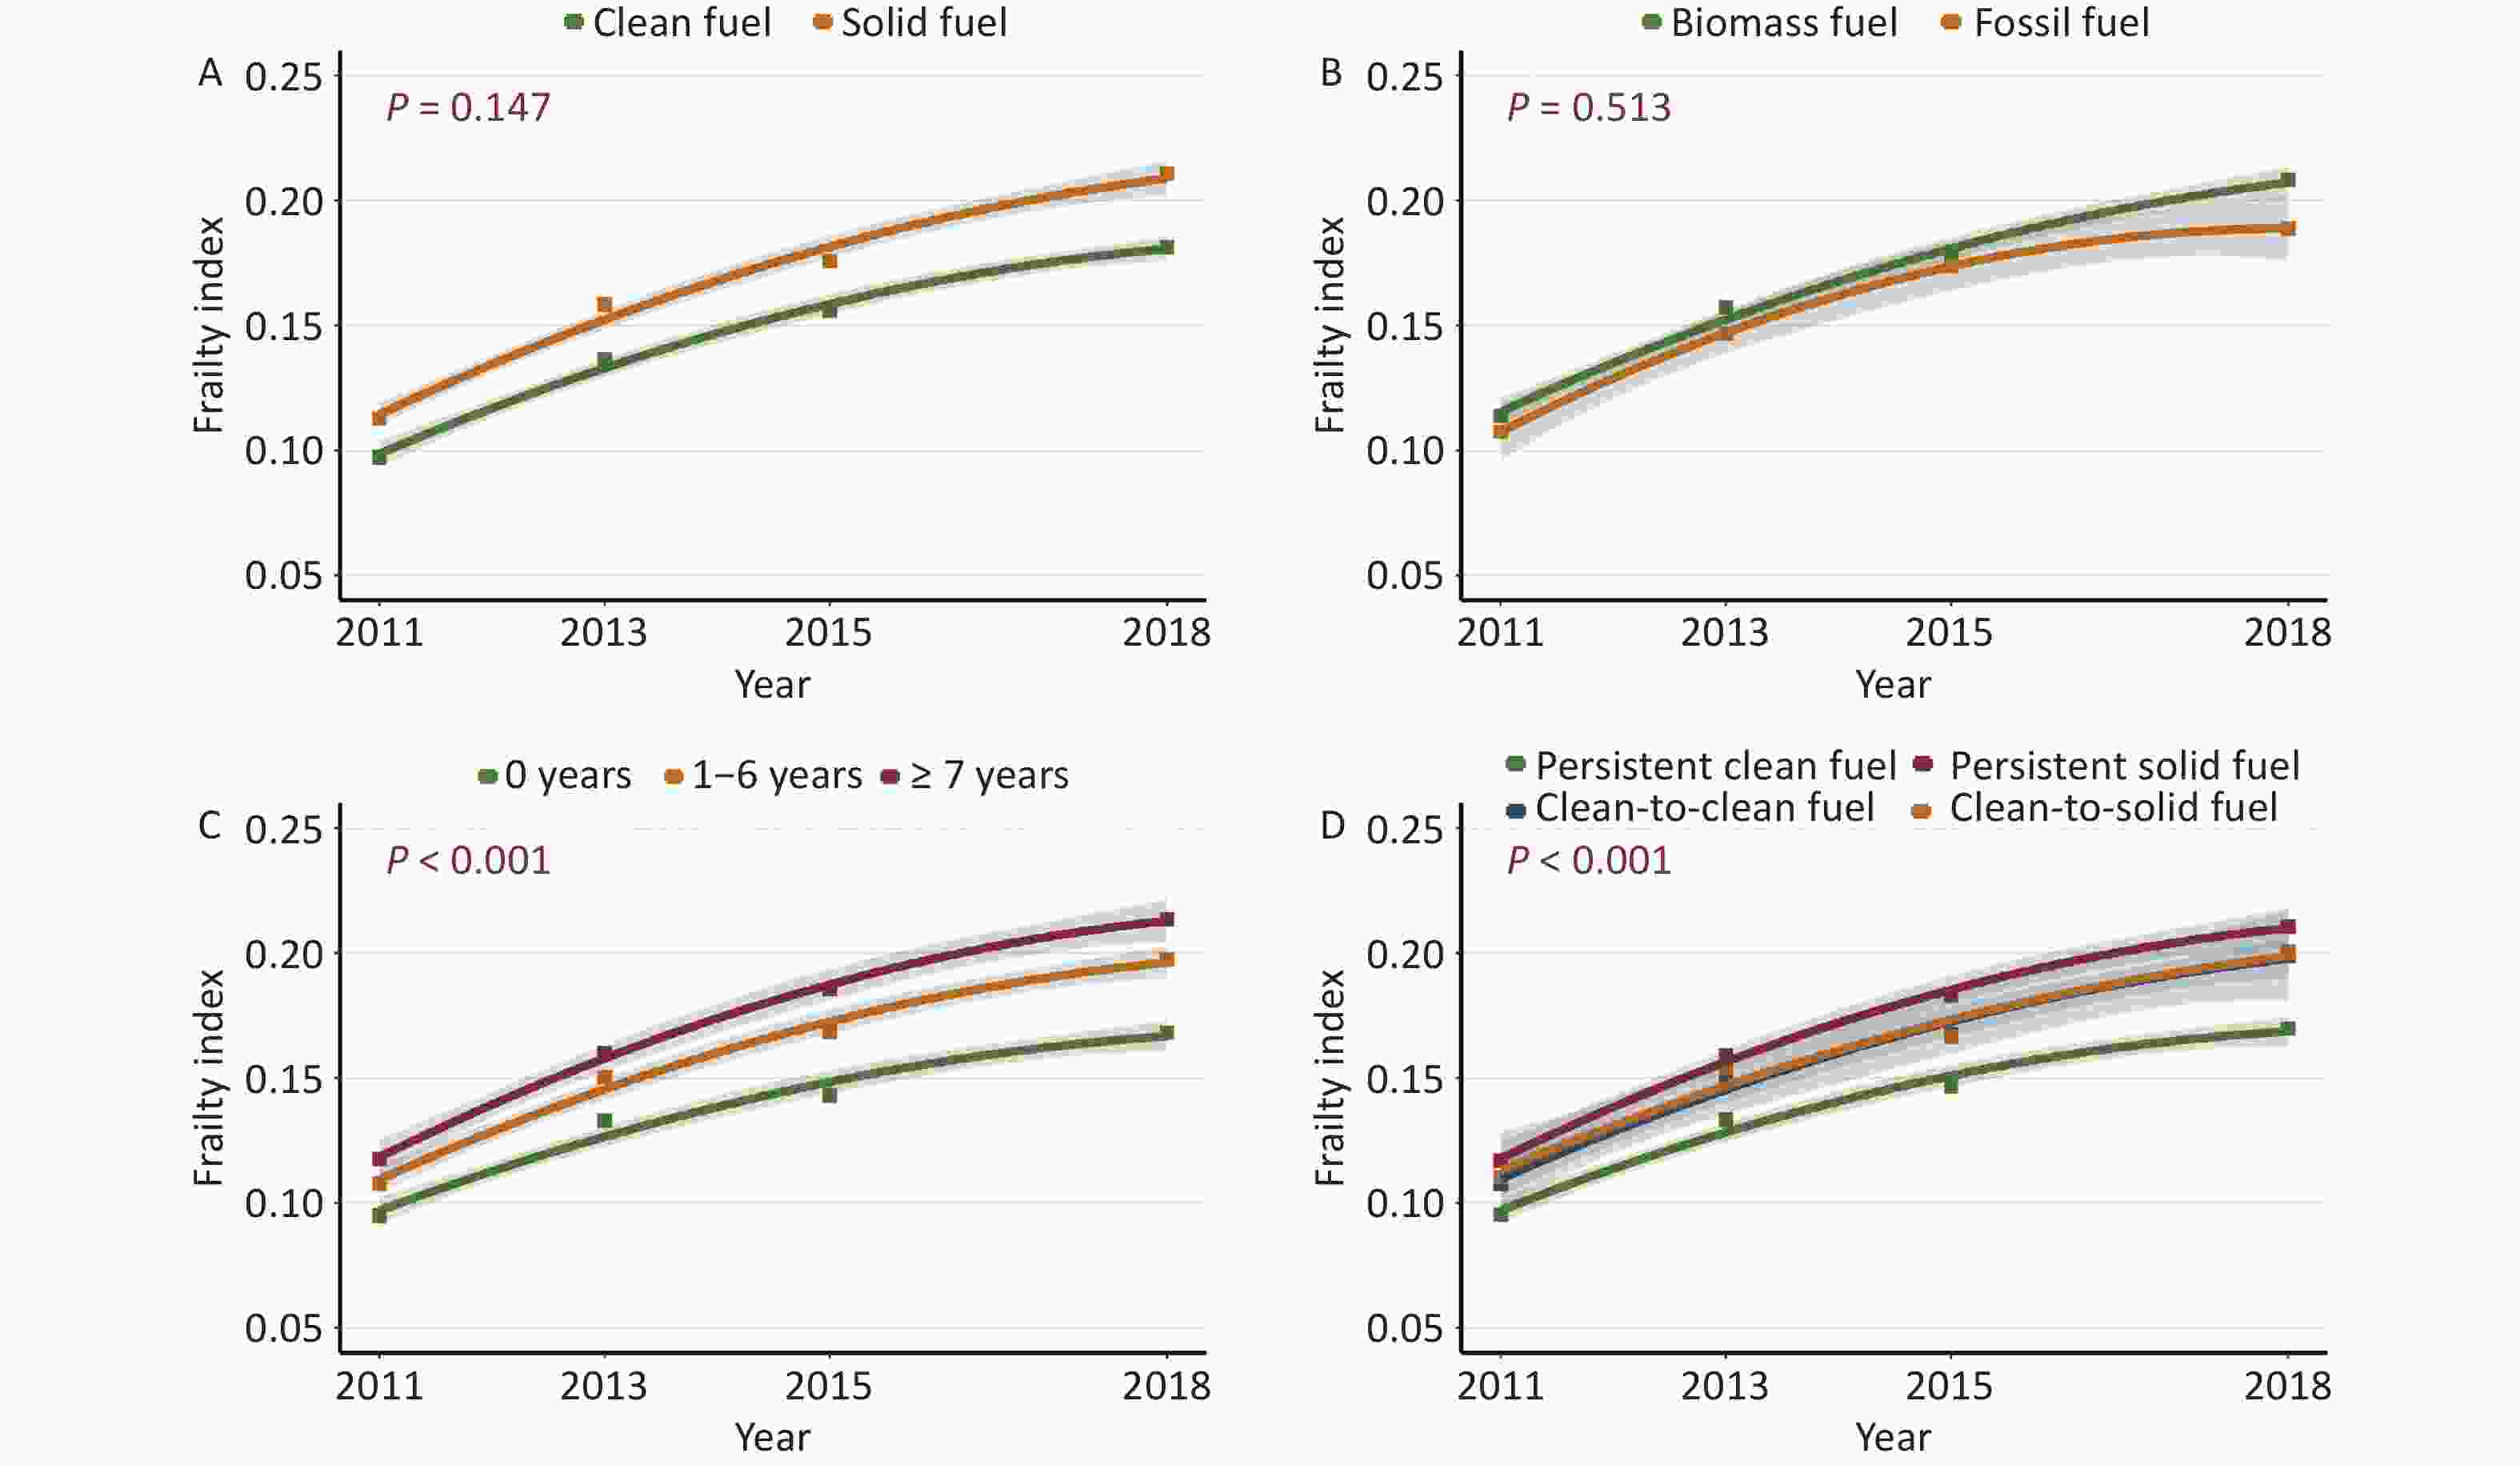
Figure 2. Comparison of overall frailty trajectories for subgroups by cooking fuel. (A) The total population was divided into clean fuel and solid fuel groups, where P represents the significance of the fixed-effects coefficients for baseline cooking fuel types (clean fuel as reference) × time. (B) The total population was divided into biomass fuel and fossil fuel groups; P represents the significance of the fixed-effects coefficients for baseline solid cooking fuel types (biomass fuel as reference) × time. (C) The total population was divided into 0 years group, 1–6 years group, and ≥ 7 years group. P represents the significance of the fixed-effects coefficients for the duration of solid fuel use (0 years as a reference) × time. (D) The total population was divided into persistent clean fuel, persistent solid fuel, clean-to-solid fuel, and solid-to-clean fuel groups. P represents the significance of the fixed-effects coefficients for switching cooking fuel types (persistent clean fuel as a reference) × time.
-
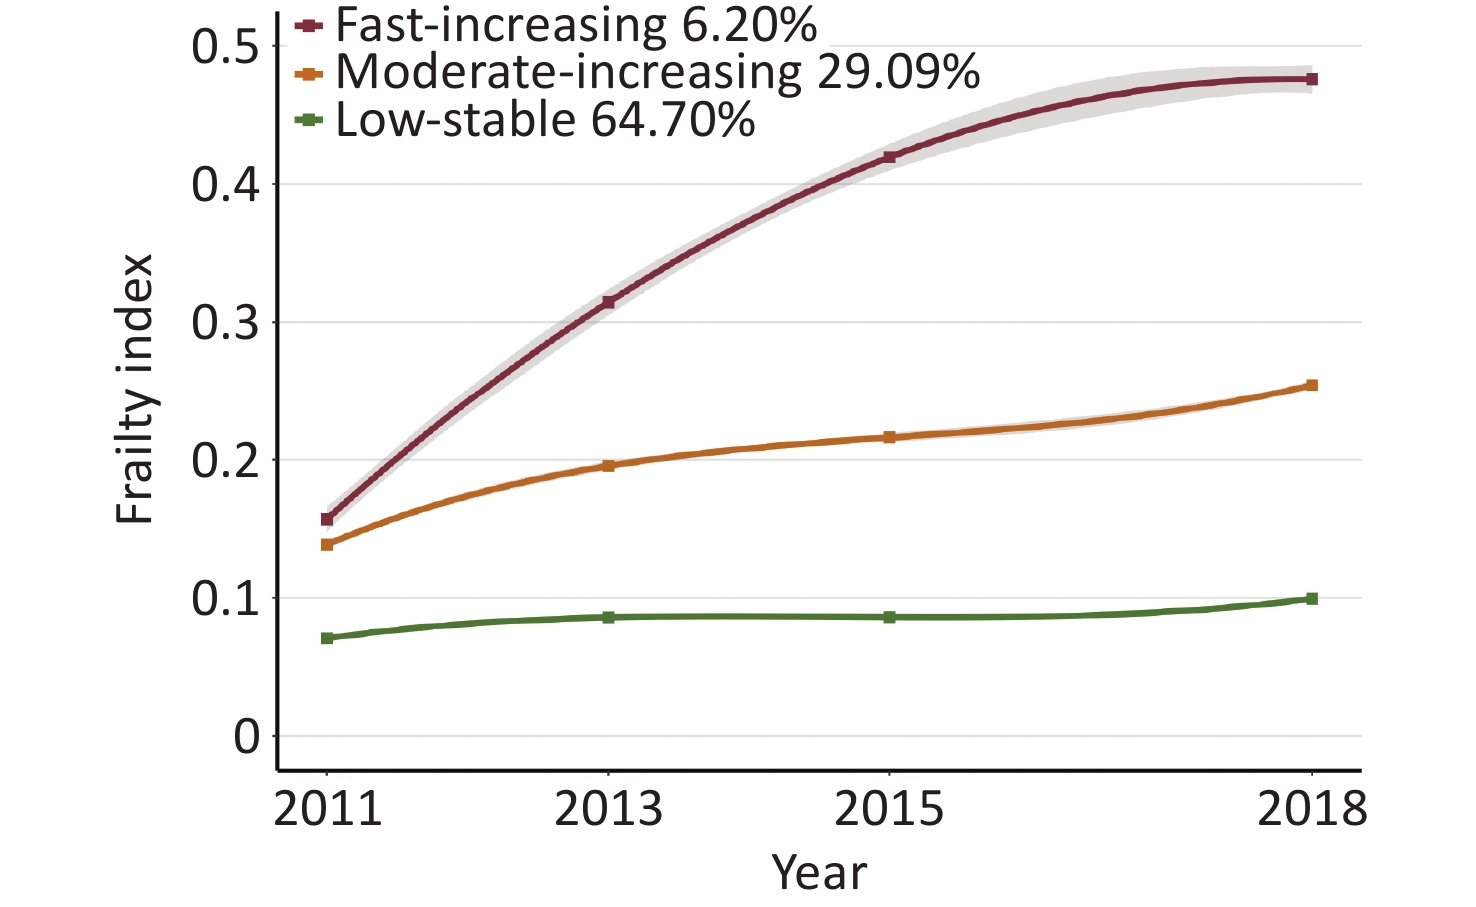
Figure 3 shows three distinct frailty trajectories, labeled as low-stable trajectory (n = 5,789, 64.70%), moderate-increasing trajectory (n = 2,603, 29.09%), and fast-increasing trajectory (n = 555, 6.20%). In the low-stable trajectory, the FI persisted at a low level of 0.07 in the early surveys, and then increased slowly to 0.1 in the later surveys. In the moderate-increasing trajectory, the FI rose steadily from 0.14 to 0.25 throughout the 4-wave survey. Additionally, in the fast-increasing trajectory, the FI surged rapidly from 0.16 to 0.42 in the early surveys, then climbed gradually to 0.48 in the later surveys.
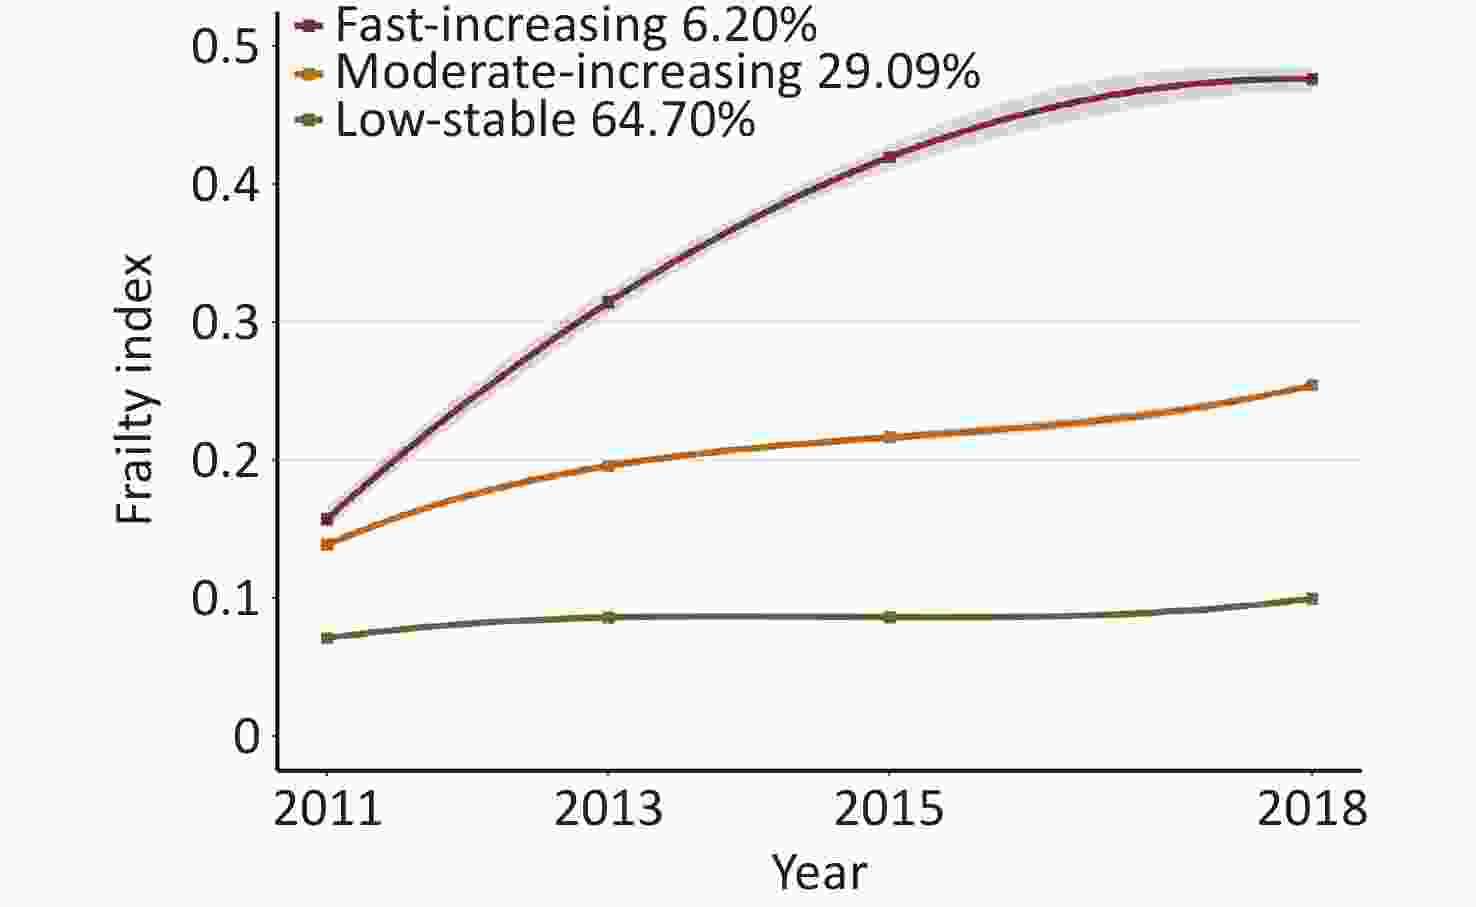
Figure 3. Frailty trajectories for middle-aged and older-adult population. Trajectories are represented by solid lines, with the 95% confidence intervals (95% CIs) shaded, and the dots representing the mean at each time. The labels and percentages of participants in each trajectory group are presented in the legends.
-
Table 2 shows the association between cooking fuel use and frailty trajectories. For the baseline cooking fuel types, compared with the low-stable trajectory, the odds ratio (OR) and 95% confidence interval (CI) for the moderate-increasing trajectory and fast-increasing trajectory were 1.24 (1.08, 1.42) and 1.48 (1.14, 1.92), respectively. Similar significant associations were observed for the different types of solid cooking fuel. Notably, after adjusting for covariates, the risk of moderate- and fast-increasing trajectories was higher for fossil fuel users than for biomass fuel users. Participants who used solid fuel during the survey consistently had a higher risk of being in the moderate- and fast-increasing trajectories, and this risk generally increased as the duration of solid fuel use increased (P for trend < 0.001). The OR and CI for the moderate- and fast-increasing trajectories in the ≥ 7 years group were 1.71 (1.43, 2.04) and 2.73 (1.92, 3.88), respectively. For the switching cooking fuel types, compared with participants with persistent clean fuel, switching to solid fuel showed a higher risk of being in the moderate- and fast-increasing trajectories (OR = 1.41, 95 % CI = 1.09 to 1.81 and OR = 1.79, 95 % CI = 1.13 to 2.84), while persistent use of solid fuel had a greater impact than transitioning from clean fuel to solid fuel (OR = 1.55, 95 % CI = 1.31 to 1.84 and OR = 2.13, 95 % CI = 1.55 to 2.93). Conversely, compared with participants with persistent solid fuel, switching to clean fuel significantly reduced the risk of being in the moderate- and fast-increasing trajectories (OR = 0.75, 95 % CI = 0.64 to 0.86 and OR = 0.63, 95 % CI = 0.49 to 0.82).
Variables Events n (%) Moderate-increasing vs. Low-stable a Fast-increasing vs. Low-stable OR (95% CI) b P value OR (95% CI) P value Baseline cooking fuel types Clean fuel 4192 (46.85) 1.00 (Reference) 1.00 (Reference) Solid fuel 4755 (53.15) 1.24 (1.08, 1.42) 0.002 1.48 (1.14, 1.92) 0.004 Baseline cooking solid fuel types Clean fuel 4192 (46.85) 1.00 (Reference) 1.00 (Reference) Biomass fuel 3776 (42.20) 1.21 (1.04, 1.40) 0.011 1.46 (1.11, 1.92) 0.007 Fossil fuel 979 (10.94) 1.34 (1.11, 1.62) 0.002 1.54 (1.07, 2.21) 0.019 Duration of solid fuel use 0 years 3344 (37.38) 1.00 (Reference) 1.00 (Reference) 1–6 years 3509 (39.22) 1.23 (1.05, 1.43) 0.011 1.71 (1.24, 2.36) 0.001 ≥ 7 years 2094 (23.40) 1.71 (1.43, 2.04) < 0.001 2.73 (1.92, 3.88) < 0.001 P for trend c < 0.001 < 0.001 Switching cooking fuel types Persistent clean fuel 3704 (41.40) 1.00 (Reference) 1.00 (Reference) Solid-to-clean fuel 2261 (25.27) 1.16 (0.98, 1.37) 0.081 1.35 (0.97, 1.87) 0.075 Persistent solid fuel 2494 (27.88) 1.55 (1.31, 1.84) < 0.001 2.13 (1.55, 2.93) < 0.001 Clean-to-solid fuel 488 (5.45) 1.41 (1.09, 1.81) 0.008 1.79 (1.13, 2.84) 0.013 Persistent solid fuel 2494 (27.88) 1.00 (Reference) 1.00 (Reference) Solid-to-clean fuel 2261 (25.27) 0.75 (0.64, 0.86) < 0.001 0.63 (0.49, 0.82) < 0.001 Persistent clean fuel 3704 (41.40) 0.64 (0.54, 0.76) < 0.001 0.47 (0.34, 0.65) < 0.001 Clean-to-solid fuel 488 (5.45) 0.90 (0.71, 1.16) 0.428 0.84 (0.54, 1.30) 0.433 Note. a“Low Stable” as the reference trajectory. bOR (95% CI) was estimated using multinomial logistic regression. Adjusted covariates include age, BMI, sex, residential location, marital status, smoking status, drinking status, education, ambient PM2.5, and heating fuel types. cP for trend: trend test with the exposure treated as an ordered variable. OR, odds ratio; CI, confidence interval. Table 2. Association between cooking fuel use and the frailty trajectories
-
Figure 4 shows the relationship between baseline cooking fuel use and the frailty trajectories across different subgroups. Stratified analysis confirmed that solid cooking fuel use was associated with an increased risk of being in the frailty trajectories. Interaction analyses revealed that almost none of the baseline characteristics significantly modified this association. Moreover, compared to the subgroup using clean heating fuel, the association between solid cooking fuel use and the moderate-increasing trajectory decreased in the subgroup using solid heating fuel (OR = 1.38, 95% CI = 1.05 to 1.81 for the clean heating fuel subgroup; OR = 1.21, 95% CI = 1.03 to 1.42 for the solid heating fuel subgroup). However, the association with the fast-increasing trajectory increased (OR = 1.35, 95% CI = 0.78 to 2.34 for the clean heating fuel subgroup; OR = 1.51, 95% CI = 1.12 to 2.04 for the solid heating fuel subgroup).
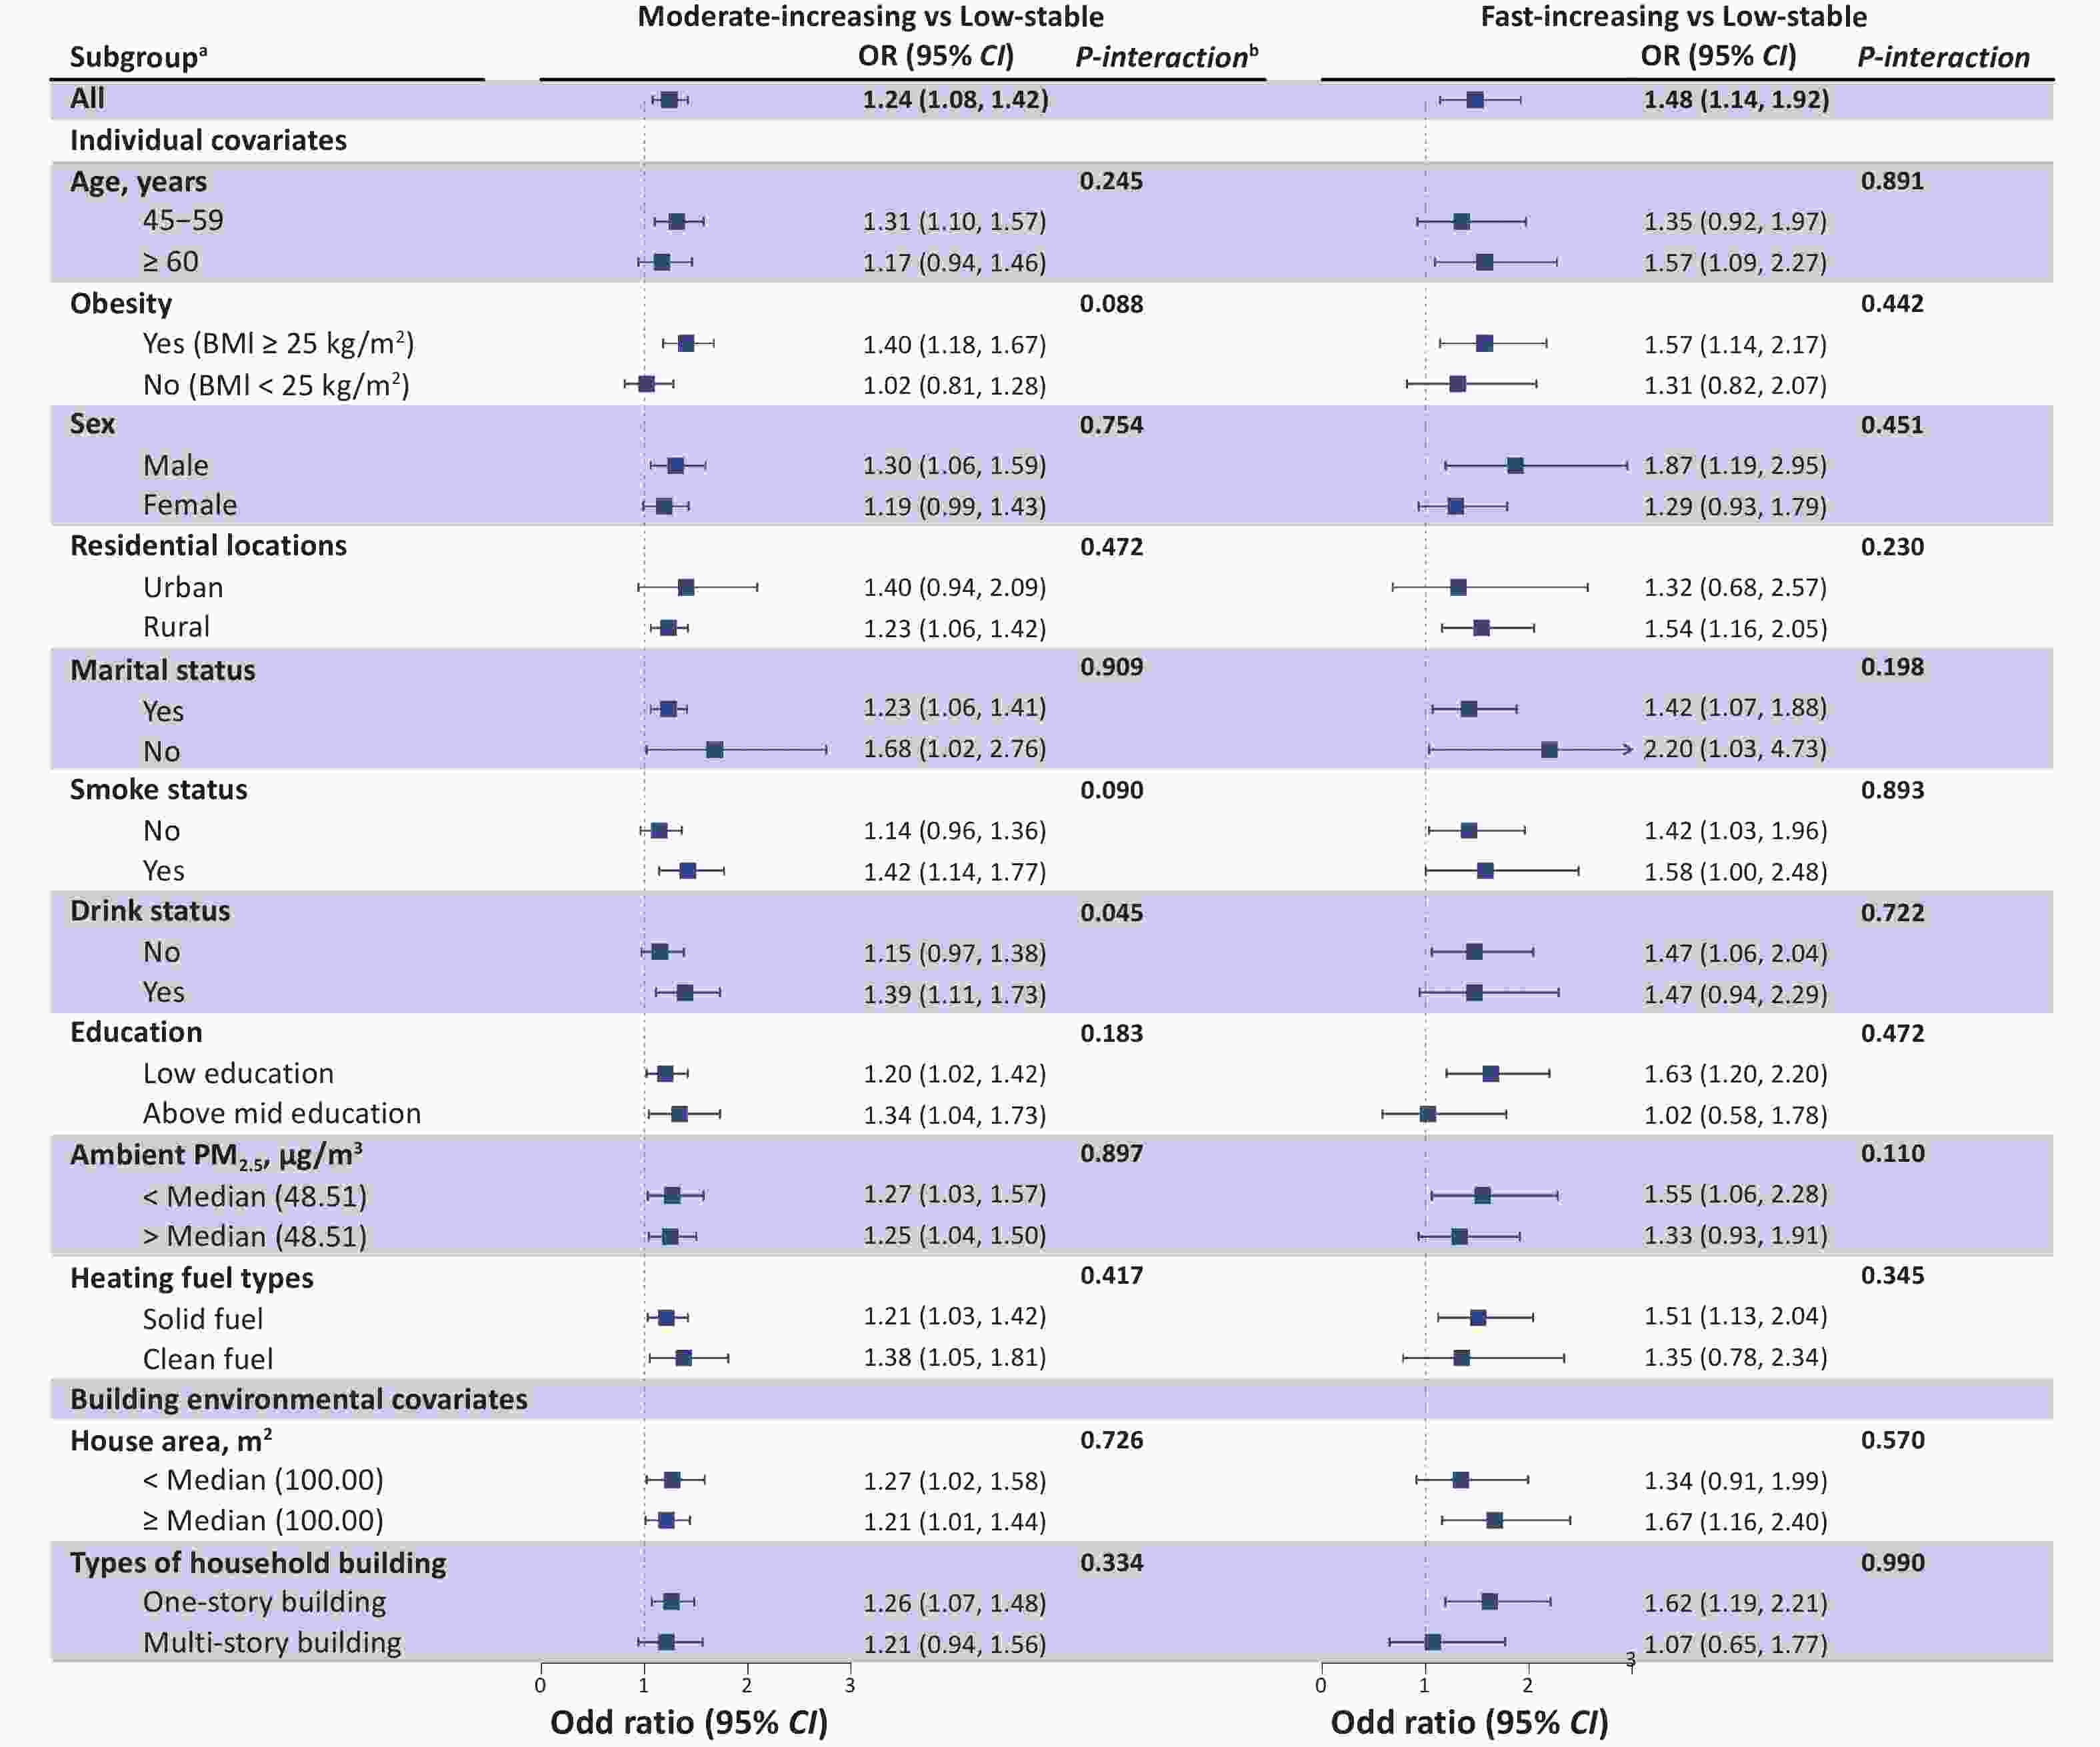
Figure 4. Association of baseline cooking fuel use with the frailty trajectories stratified by baseline characteristics. aEach stratification was adjusted for all factors (age, BMI, sex, residential location, marital status, smoking status, drinking status, education, ambient PM2.5, and heating fuel type), except for the stratification factor itself. bP for interaction was assessed by combining the variables’ cross-product term (baseline cooking fuel types × baseline characteristics) in the same model. OR, odds ratio; CI, confidence interval.
-
Table 3 shows the burden of frailty development attributed to solid fuel use. If the exposure to solid cooking fuel were eliminated, 8.02% (3.05%, 12.99%) of members of the moderate-increasing trajectory and 19.30% (6.86%, 31.73%) of the fast-increasing trajectory could demonstrate stable FI similar to those in the low-stable trajectory.
Variables No. of case Population attributable fraction % (95% CI) b Moderate-increasing vs. Low-stable a 1945 8.02 (3.05, 12.99) Fast-increasing vs. Low-stable 423 19.30 (6.86, 31.73) Note. a“Low Stable” as the reference trajectory. bAdjusted covariates include age, BMI, sex, residential location, marital status, smoking status, drinking status, education, ambient PM2.5, and heating fuel types. FI, frailty index; CI, confidence interval. Table 3. Estimated the burden of frailty development attributed to solid cooking fuel use
-
Supplementary Table S10-S15 and Supplementary Figure S1-S3 presents the results of the sensitivity analyses. First, the results after multiple imputations are consistent with those of the main analyses. Second, after considering the sampling weights, the results are similar to those that were not weighted. Third, with the inclusion of early-life exposure to solid cooking fuel as an additional covariate, the results are not substantially altered compared with the main analyses.
-
In this nationwide longitudinal cohort study of Chinese older adults aged 45 years and above, we identified three distinct frailty trajectories, labeled low-stable, moderate-increasing, and fast-increasing. We also explored, for the first time, the association between cooking fuel use and these trajectories. Compared with the low-stable trajectory, solid cooking fuel use was significantly associated with the moderate- and fast-increasing trajectories, and this association increased with the duration of use. Notably, participants who switched from solid to clean fuel had a significantly lower risk of being in the moderate- and fast-increasing trajectories than those who persistently used solid fuel. Conversely, those who switched from clean to solid fuel showed a higher risk of being in these trajectories than participants with persistent clean fuel use. Stratified analysis further demonstrated that the association between solid fuel consumption and frailty trajectories was significant across almost all subgroups, confirming our primary findings. Additionally, our study indicated that without the use of solid fuel, 8% of the moderate-increasing and 19% of the fast-increasing trajectory members could demonstrate FI stability similar to that in the low-stable trajectory.
Several studies have investigated the relationship between solid fuel consumption and frailty. A prospective cohort study in China recruited 4,643 participants aged ≥ 65 years, and assessed their frailty status using both the FI and the FRAIL scale. The results indicated that the use of biomass fuel was associated with a higher risk of frailty[14]. Another study focusing on individuals aged ≥ 60 years reported that solid cooking fuel significantly increased the risk of frailty[32]. Although these studies showed similar results, they primarily focused on frailty status and did not consider the development of frailty. Our study extended these findings by exploring the relationship between solid fuel use and frailty trajectories. We identified three distinct frailty trajectories and demonstrated the differential risks associated with solid fuel use across these trajectories. By grouping participants into different trajectories, we not only captured the dynamic changes in frailty development more effectively but also improved the accuracy of identifying high-risk individuals.
Although the exact mechanism underlying the association between solid cooking fuel and the development of frailty remains unclear, the proposed mechanism can explain this association. First, the inefficient combustion of solid fuel produces harmful pollutants, such as polycyclic aromatic hydrocarbons, black carbon, and particulate matter. Second, these pollutants are associated with pathophysiological processes, such as inflammation, oxidative stress, DNA methylation, and immune damage[21-23]. Third, the cumulative progression of these pathophysiological mechanisms eventually leads to FI growth[20,42,43]. Furthermore, our findings indicate that the effects of solid fuel usage on frailty trajectories vary depending on the type of solid fuel, with fossil fuel users having a higher risk than biomass fuel users. This may be because fossil fuel combustion releases pollutants with higher concentrations of oxidants, transition metals, and sulfur, leading to more severe oxidative stress and other pathophysiological processes[44].
Notably, our study focused on the impact of the duration of solid cooking fuel use and fuel switching on frailty trajectories. We further observed a more significant association between long-term solid fuel use and frailty trajectories than that for short-term exposure. Studies have shown that longer exposure to nanoparticles increases the risk of frailty, with nanoparticles being the primary substance produced by the inefficient combustion of household solid fuel[45,46]. This finding further explains the effect of long-term solid fuel use on frailty. Additionally, compared to those who persistently used solid fuel, those who switched to clean fuel had a lower risk of being in the moderate- and fast-increasing trajectories. Supporting our findings, previous studies have demonstrated that when the concentration of nanoparticles in the air decreases, it helps improve the frailty of middle-aged and older adults[47]. Therefore, the use of clean fuel could reduce the concentration of pollutants, such as nanoparticles, in the air, which could in turn improve frailty. Our study also found that 25.57% of households had switched from using solid fuel to clean fuel. However, a nationwide study on residential energy transition showed that from 2013 to 2017, the proportion of households switching from solid fuel to clean energy reached 43.00%, which is higher than our findings[48]. A possible reason is that despite the increasing popularity of clean cooking fuel in China owing to rapid social and economic development, many middle-aged and older adults, especially those in rural areas, still use solid cooking fuel because of their traditional lifestyles[49,50].
In stratified analysis, compared to the subgroup using clean heating fuel, participants using solid cooking fuel had a higher risk of being in the fast-increasing trajectory within the subgroup using solid heating fuel. These results indicate that the use of solid heating fuel and solid cooking fuel might have had a synergistic effect on the rapid FI growth. Similarly, the prospective study of Jin et al. found that the association between frailty and the use of both solid heating fuel and cooking fuel was more significant[24]. Therefore, we need to pay attention to high-risk groups that use solid fuel for both heating and cooking, particularly middle-aged and older adults within this group, as they are more susceptible to the harmful substances produced by the combustion of solid fuel because they spend extended periods indoors[51]. Additionally, rapid FI growth not only leads to adverse health outcomes, but also increases the burden of care for families and society[52]. To alleviate these negative impacts and reduce the economic and social burdens of frailty among the aging population, measures should be implemented to promote the use of clean energy, improve indoor air quality, and help high-risk groups adopt healthier lifestyles.
Using the same data, Jin et al. quantified the link between solid cooking fuel and frailty, finding that about 22% of frailty cases were attributed to solid fuel use[24]. Our study quantitatively analyzed the heterogeneous impact of cooking fuel use on frailty in different individuals. It is noteworthy that the PAF of the moderate- and fast-increasing trajectory members were significantly higher than those of the low-stable trajectory members. Our study showed that 8% of the moderate-increasing trajectory members and 19% of the fast-increasing trajectory members were attributable to solid fuel use, and its burden on frailty development should not be underestimated. Given the widespread global use of solid fuel[53], urgent efforts are required to promote clean energy and develop cost-effective interventions.
The strengths of our study include its prospective design, large sample size, and use of data from nationally representative cohorts in China. This study has several other strengths. First, by using repeated FI measurements and GBTM, we identified distinct trajectory subgroups and filled the gap in research on the relationship between cooking fuel use and frailty trajectories. Second, our study used data from China, the world’s largest developing country, where a large proportion of the population relies on solid fuel. This suggests that our findings have broad implications for other developing countries. Third, our findings quantified the burden of frailty development caused by solid fuel use, highlighting the need to reduce solid fuel usage. However, this study has some limitations. First, because we used self-reported cooking fuel types instead of direct measurements of personal exposure, we could not determine exact exposure levels. Thus, we could only qualitatively analyze the relationship between solid fuel use and frailty trajectories. Second, because of limited information, this study did not analyze such factors as the frequency of solid cooking fuel use, duration of early-life exposure to solid cooking fuel, ventilation habits, time spent at home, use of stove types during cooking, and other HAP sources, such as secondhand tobacco smoke, all of which could affect exposure levels to HAP caused by the use of solid fuel. Third, we could not analyze the mechanisms behind the impact of solid cooking fuel on frailty, and further experimental studies are needed to clarify this.
-
Based on a nationally representative longitudinal aging survey, our study concluded that using solid cooking fuel increased the risk of being in the frailty trajectories among middle-aged and older adults, with this risk increasing with longer usage duration. The study suggested that this risk may decrease when individuals switch from solid to clean fuel for cooking. These results further support the benefits of using clean fuel and highlight the importance of controlling fuel type to improve frailty.
Association between Solid Cooking Fuel Use and Frailty Trajectories: Findings from a Nationwide Cohort in China
doi: 10.3967/bes2025.022
- Received Date: 2024-09-09
- Accepted Date: 2025-01-20
-
Key words:
- Solid fuel /
- Ageing /
- Frailty /
- Longitudinal studies
Abstract:
The authors declare that they have no known competing financial interests or personal relationships that could have appeared to influence the work reported in this paper.
&These authors contributed equally to this work.
| Citation: | Yang Liu, Bingjie Wu, Bingbing Fan, Chunxia Li, Chang Su, Aidong Liu, Tao Zhang. Association between Solid Cooking Fuel Use and Frailty Trajectories: Findings from a Nationwide Cohort in China[J]. Biomedical and Environmental Sciences. doi: 10.3967/bes2025.022

|

 Quick Links
 DownLoad: