
-
Sleep duration is an important index of sleep hygiene, and both insufficient and excessive sleep duration are associated with adverse health outcomes. In 2015, a consensus report concluded that a sleep duration of 7–9 hours per day is appropriate for optimal health in adults, whereas ≤ 6 hours is inappropriate[1,2]. In recent years, a growing body of research has shown that long sleep duration can contribute to adverse health outcomes, an increased incidence of chronic diseases[3-6], cognitive decline[7], and all-cause and major-cause mortality[4,8]. A J-shaped pattern has been observed between sleep duration and mortality, indicating that the risk associated with long sleep duration is relatively higher than that of short sleep duration[9,10]. Therefore, in addition to short sleep duration, long sleep duration should also be taken seriously at the national level, and its prevalence and trends need to be clarified.
Regarding national trends in sleep duration, a report involving ten countries showed that the prevalence of short sleep duration (≤ 6 hr/d) increased in Australia, Finland, Sweden, the UK, and the USA, but decreased in Canada and Italy; long sleep duration (> 9 hr/d) increased in Italy and Norway, but decreased in Sweden, the UK, and the USA[11]. In China, the Chinese Family Panel Survey (CFPS) reported that from 2010 to 2016, the average sleep duration gradually decreased, and the prevalence of short sleep duration gradually increased[12], with no trends in long sleep duration reported. However, the inconsistency of survey methodologies and the imbalance of subgroup sampling in CFPS research limit comparability across surveys and reduce the accuracy of nationally representative estimates. Therefore, nationally representative surveys using consistent methodology and large-scale data are required to explore trends in sleep duration, which are influenced by many factors.
The Healthy China Initiative (2019–2030) proposed a clear goal for sleep duration as part of its sleep promotion efforts. Before the official implementation of this initiative, there was limited national information on trends in sleep duration, particularly among urban and rural residents, subgroups by sex, and populations with common chronic diseases such as hypertension and diabetes. The lack of sleep health data at the national level has limited the development of policies for targeted prevention and control. In this study, we used datasets from four rounds of a national survey to describe trends in sleep duration in China from 2010 to 2018.
-
We used datasets from a repeated national cross-sectional survey, the China Chronic Disease and Risk Factors Surveillance (CCDRFS) Program, conducted in mainland China starting in 2004. To date, six rounds of nationwide surveillance data have been collected in 2004, 2007, 2010, 2013, 2015, and 2018. The CCDRFS adopted a multistage stratified cluster randomized sampling method to obtain a nationally representative sample of the general Chinese adult population[13]. The study design, sampling methods, dataset details, and related research from the CCDRFS have been described in previous publications[14-17]. The overall response rate in the CCDRFS series was 96.1%. In 2010, the CCDRFS first introduced sleep duration in face-to-face interviews conducted by trained local health workers, and the same questionnaire design continued through the 2018 survey. Therefore, data from four consecutive surveys conducted in 2010, 2013, 2015, and 2018 were used in the present study.
Across these four rounds, a total of 648,768 participants (98,120 in 2010; 176,543 in 2013; 189,605 in 2015; and 184,509 in 2018) aged 18 years and older were included in the datasets. After excluding participants with missing or invalid sleep duration data, 645,420 participants (97,741 in 2010; 175,749 in 2013; 187,777 in 2015; and 184,153 in 2018) were included in this analysis (Supplementary Figure S1).
-
The same self-reported sleep duration questionnaire was used in all four rounds of the CCDRFS. During the interview, participants were asked, “How long do you sleep in total on a typical day?” Responses were recorded to the minute. Based on joint consensus guidelines[1,2] and other epidemiological studies[11,18], short sleep duration was defined as ≤ 6 hours per day (a unified boundary with < 7 when sleep duration is rounded to the nearest hour), and long sleep duration was defined as > 9 hours per day. Optimal sleep duration was defined as 7–9 hours per day. The outcomes included mean sleep duration and the prevalence of short and long sleep durations during each survey year. Trends over time were also analyzed.
-
Trained local health workers conducted interviews and physical measurements. The following demographic variables were collected and included in stratified analyses: sex (female, male); age (18–29, 30–39, 40–49, 50–59, 60–69, ≥70 years); residence (rural, urban); geographic region (eastern, central, western China); education (primary or less, junior high, senior high, college or above); occupation (agriculture-related, other manual work, non-manual work, not working, retired); and marital status (single, married, separated/divorced/widowed).
Height, weight, and blood pressure were measured during field investigations. According to Chinese standards[19], body mass index (BMI) was categorized as: underweight (< 18.5), normal weight (18.5–23.9), overweight (24–27.9), and obesity (≥ 28 kg/m2). Hypertension was defined according to Chinese guidelines[20] as systolic blood pressure ≥ 140 mmHg and/or diastolic blood pressure ≥ 90 mmHg, or self-reported diagnosis and current use of antihypertensive medication. Diabetes was defined based on the American Diabetes Association criteria[21] or self-reported diagnosis.
-
Mean sleep duration and the prevalence of short and long sleep durations were calculated for each survey year, incorporating stratification, clustering, and sample weights (computed as the product of multistage sampling weights, non-response weights, and post-stratification weights based on the 2010 China census population). These calculations were also performed separately by demographic variables such as sex, residence, age, education, occupation, and geographic region. Sleep duration data were recorded in minutes, and converted to hours. Weighted mean sleep duration was calculated using the PROC SURVEYMEANS procedure in SAS, and the weighted prevalence of short and long sleep durations, with 95% confidence intervals (CIs), was calculated using PROC SURVEYFREQ.
To examine the distribution of sleep duration in the 2018 survey, analysis of variance (ANOVA) was used for mean sleep duration and chi-square tests for the proportions of short and long sleep durations. Temporal trends in mean sleep duration from 2010 to 2018 were tested using linear regression models (PROC SURVEYREG) in the total population and in subgroups stratified by demographic and health factors. The survey cycle was treated as an ordered categorical independent variable. Logistic regression models (PROC SURVEYLOGISTIC) were used to assess trends in the prevalence of short and long sleep durations, with survey cycle as the independent variable. All analyses were performed using SAS version 9.4 (SAS Institute Inc.). A two-sided P-value of < 0.05 was considered statistically significant.
-
A total of 645,420 participants were included in this study. The weighted mean age of participants was 42.88 years (standard deviation [SD]: 16.32) in 2010; 43.43 (SD: 16.16) in 2013; 43.34 (SD: 16.13) in 2015; 43.43 (SD: 16.08) in 2018. The weighted proportions of females and rural residents were 49.5% and 53.6% in 2010; 49.5% and 54.0% in 2013; 49.4% and 48.2% in 2015; and 49.6% and 48.3% in 2018, respectively (Supplementary Table S1).
-
In 2018, the mean sleep duration among Chinese adults was 7.58 hours per day (SD: 1.45), and the prevalence of short and long sleep durations was 18.5% (95% CI: 17.7%–19.3%) and 9.0% (95% CI: 8.2%–9.9%), respectively (Table 1). There were significant differences in mean sleep duration by residence, age, geographic location, occupation, and marital status (all P < 0.001). However, no significant differences were observed by sex or education. For the prevalence of short sleep duration, there were significant differences by age, education, occupation, and marital status (all P < 0.001), but not by sex, residence, or geographic location. The weighted prevalence of long sleep duration showed significant differences across all the demographic factors mentioned above. Interestingly, unlike the increase in short sleep duration with age, the standardized prevalence of long sleep duration followed a U-shaped curve: decreasing from ages 18–29 to 40–49, then increasing from 50–59 and peaking among those aged 70 years or above. Notably, the weighted prevalence of both short and long sleep durations decreased with increasing educational level. Compared to other marital statuses (single and married), separated/divorced/widowed individuals had the highest prevalence of short and long sleep durations.
Characteristics Sleep durationa Short sleep durationb Long sleep durationc Hr/d, mean ± SD P value % (95% CI) P value % (95% CI) P value Overall 7.58 ± 1.45 NA 18.5 (17.7 – 19.3) NA 9.0 (8.2 – 9.9) NA Sex Male 7.56 ± 1.39 0.14 18.3 (17.4 – 19.1) 0.29 8.6 (7.7 – 9.4) 0.003 Female 7.59 ± 1.50 18.7 (17.8 – 19.7) 9.5 (8.6 – 10.4) Residence Urban 7.50 ± 1.33 < 0.001 18.5 (17.4 – 19.6) 0.92 7.1 (6.3 – 7.8) < 0.001 Rural 7.66 ± 1.56 18.5 (17.4 – 19.5) 11.2 (9.9 – 12.4) Age, years 18 – 29 7.91 ± 1.27 < 0.001 9.6 (8.5 – 10.7) < 0.001 11.0 (9.5 – 12.6) < 0.001 30 – 39 7.69 ± 1.20 12.4 (11.4 – 13.3) 7.4 (6.6 – 8.3) 40 – 49 7.49 ± 1.32 19.0 (18.1 – 20.0) 6.7 (5.9 – 7.6) 50 – 59 7.29 ± 1.53 26.9 (25.7 – 28.1) 7.4 (6.6 – 8.3) 60 – 69 7.28 ± 1.75 30.2 (28.8 – 31.6) 10.3 (9.3 – 11.4) ≥ 70 7.34 ± 2.04 32.3 (30.4 – 34.1) 15.2 (13.6 – 16.8) Geographic location East 7.47 ± 1.34 < 0.001 19.2 (18.0 – 20.4) 0.11 6.8 (5.7 – 7.9) < 0.001 Central 7.60 ± 1.52 18.7 (17.1 – 20.3) 10.1 (8.7 – 11.6) West 7.72 ± 1.52 17.1 (15.5 – 18.6) 11.4 (9.8 – 13.1) Education Primary or less 7.55 ± 1.75 0.22 23.6 (22.2 – 25.0) < 0.001 12.9 (11.6 – 14.2) < 0.001 Junior high 7.61 ± 1.40 18.2 (17.0 – 19.3) 9.0 (8.0 – 10.0) Senior high 7.57 ± 1.27 16.4 (15.3 – 17.5) 7.0 (6.0 – 7.9) College or above 7.57 ± 1.07 12.1 (10.9 – 13.2) 4.4 (3.7 – 5.0) Occupation Agriculture-related 7.63 ± 1.59 < 0.001 19.9 (18.7 – 21.2) < 0.001 11.5 (10.2 – 12.9) < 0.001 Other manual work 7.51 ± 1.21 17.9 (15.6 – 20.1) 5.5 (4.3 – 6.8) Non-manual work 7.57 ± 1.33 16.4 (15.6 – 17.3) 7.6 (6.7 – 8.5) Not working 7.76 ± 1.50 15.2 (13.3 – 17.1) 11.1 (9.6 – 12.7) Retired 7.03 ± 1.48 33.8 (31.3 – 36.2) 5.6 (4.9 – 6.3) Marital status Single 7.85 ± 1.24 < 0.001 10.1 (8.7 – 11.5) < 0.001 9.5 (7.8 – 11.3) 0.003 Married 7.54 ± 1.45 19.3 (18.5 – 20.2) 8.8 (7.9 – 9.6) Separated/divorced/widowed 7.31 ± 1.89 30.9 (28.4 – 33.4) 12.7 (10.9 – 14.5) BMI (kg/m2)d < 18.5 (underweight) 7.84 ± 1.52 < 0.001 13.2 (10.9 – 15.5) < 0.001 13.4 (11.0 – 15.9) < 0.001 18.5 – 23.9 (normal weight) 7.63 ± 1.44 17.4 (16.5 – 18.3) 9.4 (8.3 – 10.5) 24.0 – 27.9 (overweight) 7.50 ± 1.46 20.4 (19.4 – 21.3) 8.3 (7.4 – 9.2) ≥ 28.0 (obesity) 7.49 ± 1.43 20.0 (18.8 – 21.3) 8.2(7.2 – 9.3) Hypertensione No 7.63 ± 1.37 < 0.001 16.2 (15.4 – 16.9) < 0.001 8.6 (7.9 – 9.4) 0.001 Yes 7.41 ± 1.64 25.2 (24.0 – 26.5) 9.9 (8.8 – 11.1) Diabetesf No 7.59 ± 1.42 < 0.001 17.8 (17.0 – 18.5) < 0.001 8.9 (8.1 – 9.7) < 0.001 Yes 7.37 ± 1.62 25.9 (24.5 – 27.2) 9.5 (8.3 – 10.7) Note. A total of 184,153 participants in 2018 was remained in this analysis, and standardized to the 2010 China census population. a Data of sleep duration were recorded in minutes, then converted to hours and calculated to mean values. b Short sleep duration was defined as whose total sleep duration ≤ 6 hours per day. c Long sleep duration was defined as whose total sleep duration > 9 hours per day. d Weight status was defined by Chinese BMI standard. e Defined as whose systolic blood pressure ≥ 140 mmHg and/or diastolic blood pressure ≥ 90 mmHg at the time of physical measurement according to Chinese guidelines for prevention and treatment of hypertension, or self-reported diagnosis of hypertension by a hospital at the township level or above and taking medication in the past two weeks. f Defined as whose fasting plasma glucose level ≥ 126 mg/dL, 2-hour plasma glucose level ≥ 200 mg/dL after a 75-g oral glucose challenge, or hemoglobin A1c level ≥ 6.5% according to the American Diabetes Association criteria, or self-reported diagnosis of diabetes by a hospital at the township level or above. SD, standard deviation; CI, confidence interval; NA, not applicable; BMI, body mass index. Table 1. Distributions of sleep duration among adults in China in 2018
In addition, overweight and obese individuals had shorter sleep durations and a higher prevalence of short sleep duration compared to normal-weight individuals. Adults with hypertension and diabetes also had a higher prevalence of both short and long sleep durations compared to those without these conditions.
-
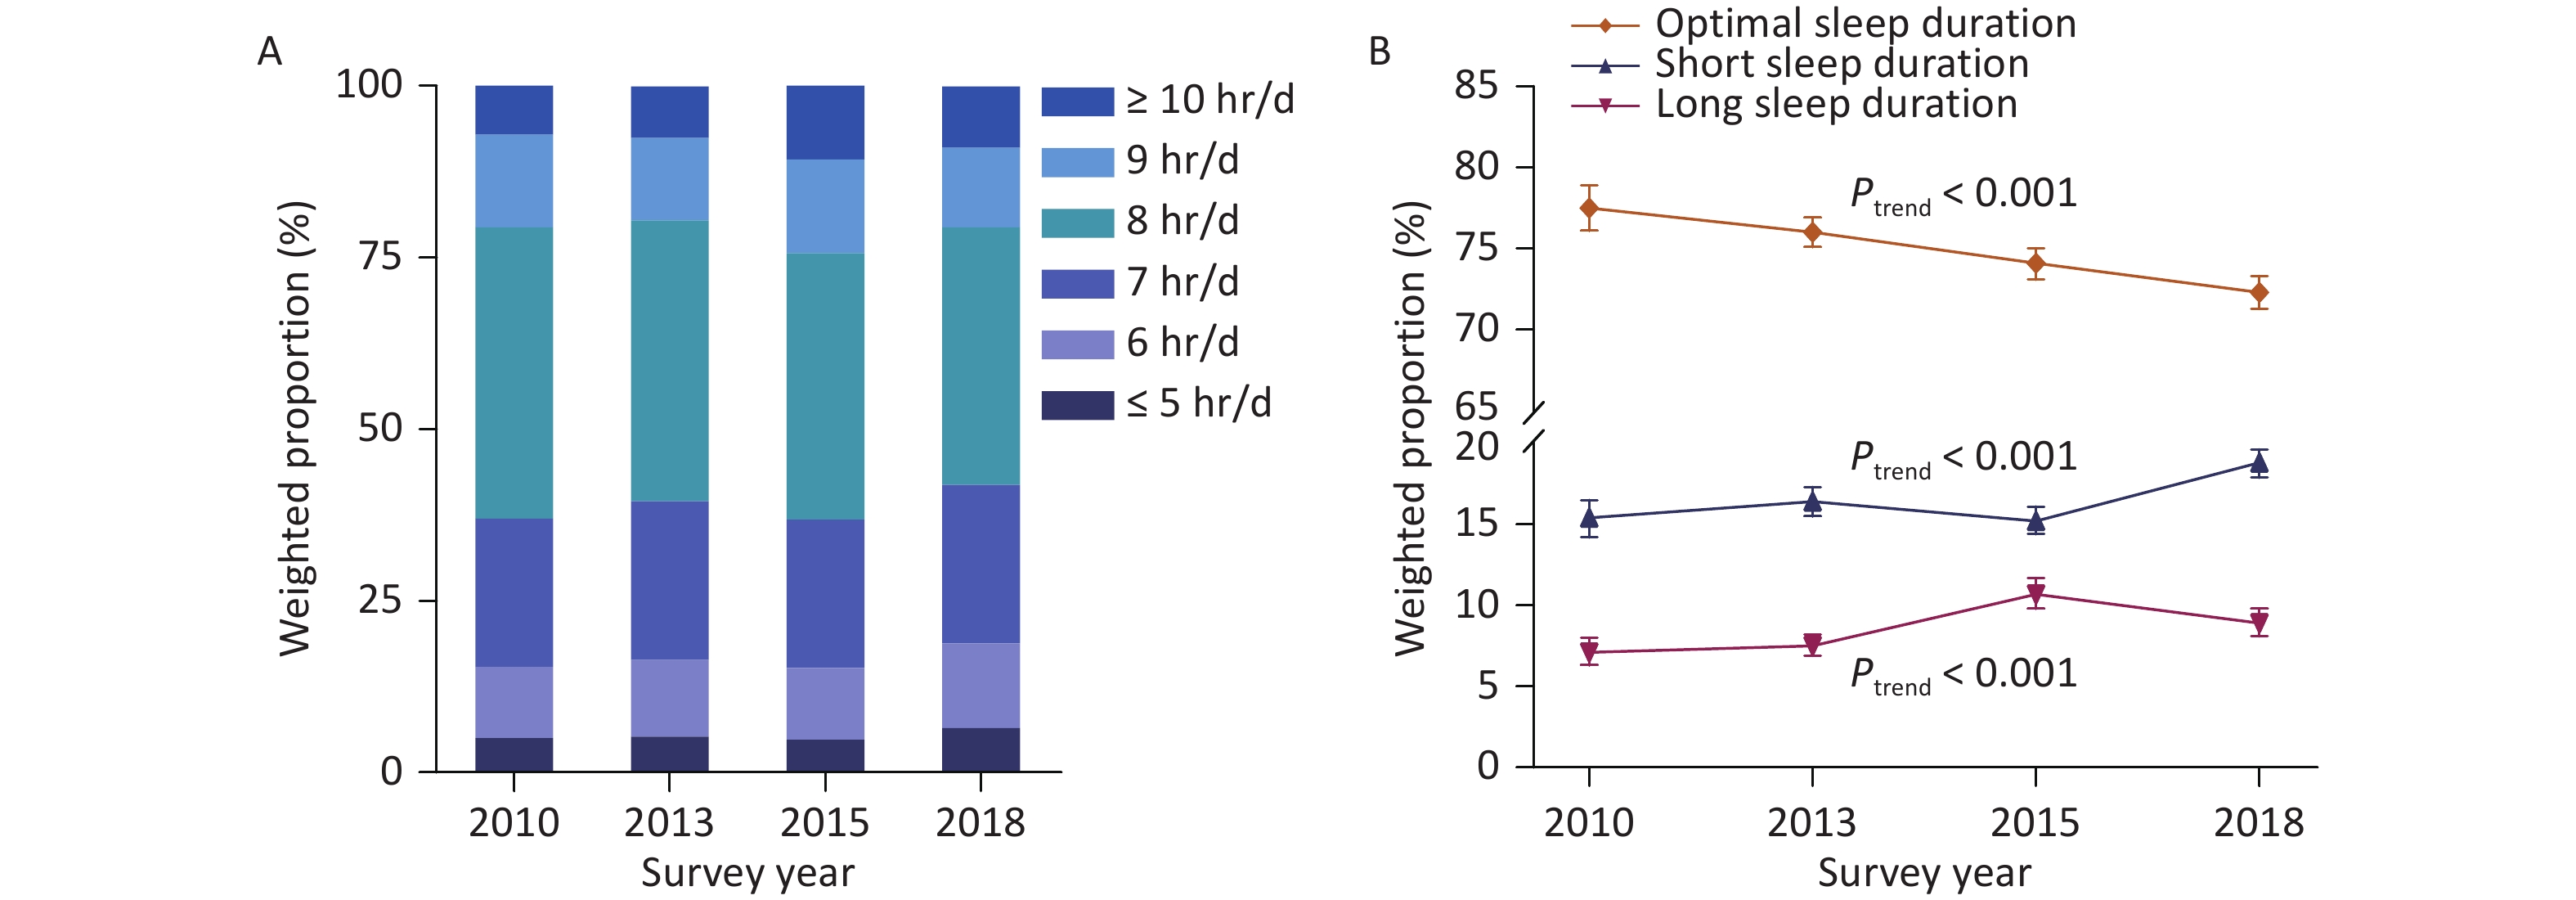
From 2010 to 2018, the mean sleep duration in China remained within the range recommended for optimal health. However, the proportion of adults reporting optimal sleep duration (7–9 hours) significantly declined from 77.5% in 2010 to 72.3% in 2018 (P < 0.001) (Figure 1).
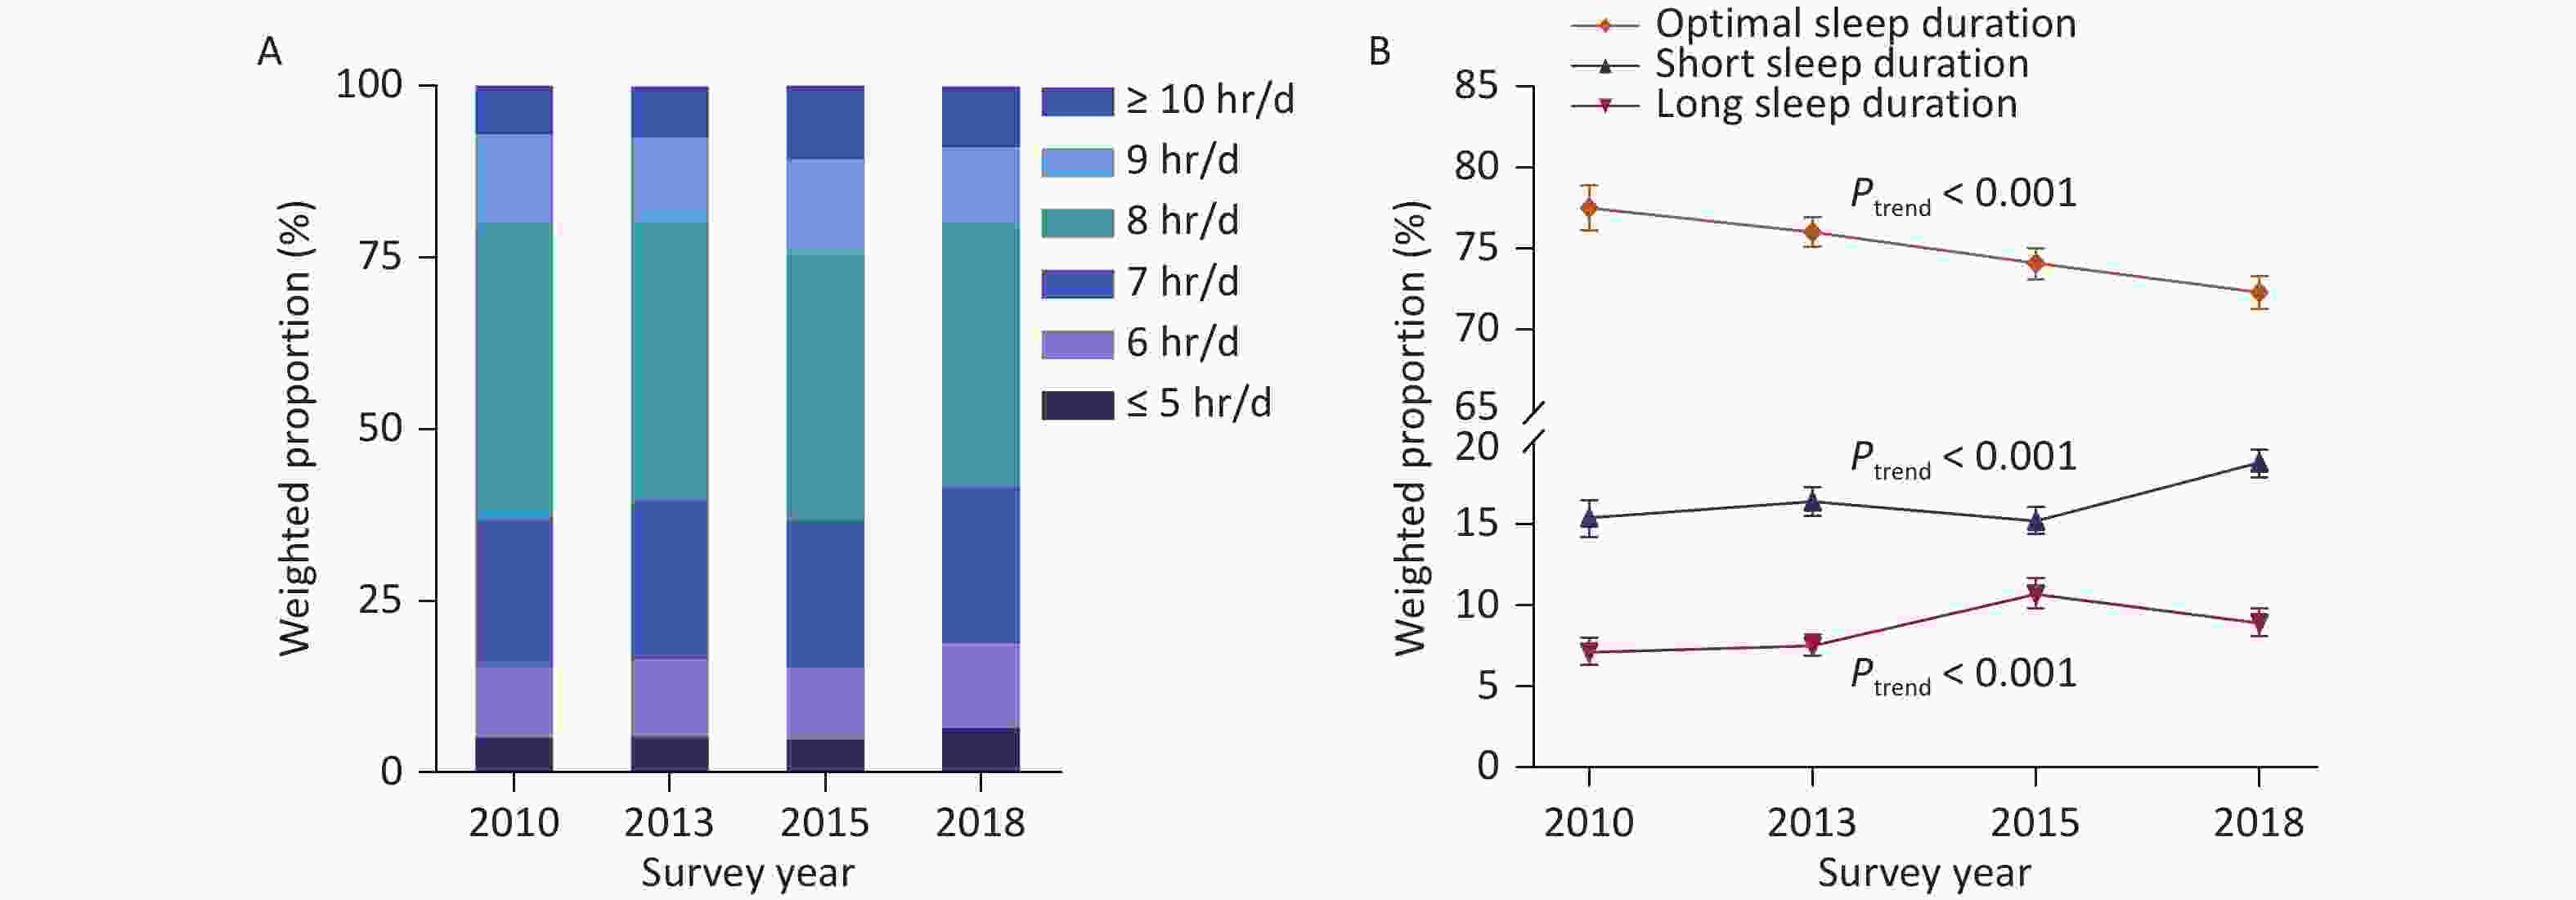
Figure 1. Trends in weighted proportions of sleep duration among Chinese adults from 2010 to 2018. (A) Hours of sleep duration. (B) Optimal, short, and long sleep duration. Error bar indicates % (95% CI). Sleep duration data were rounded to whole numbers of hours. Proportions were standardized to the 2010 China census population. Optimal sleep duration (7–9 hr/d) showed a significant decreasing trend during the study period. The proportions of both short (≤ 6 hr/d) and long (> 9 hr/d) sleep duration increased significantly from 2010 to 2018. CI, confidence interval.
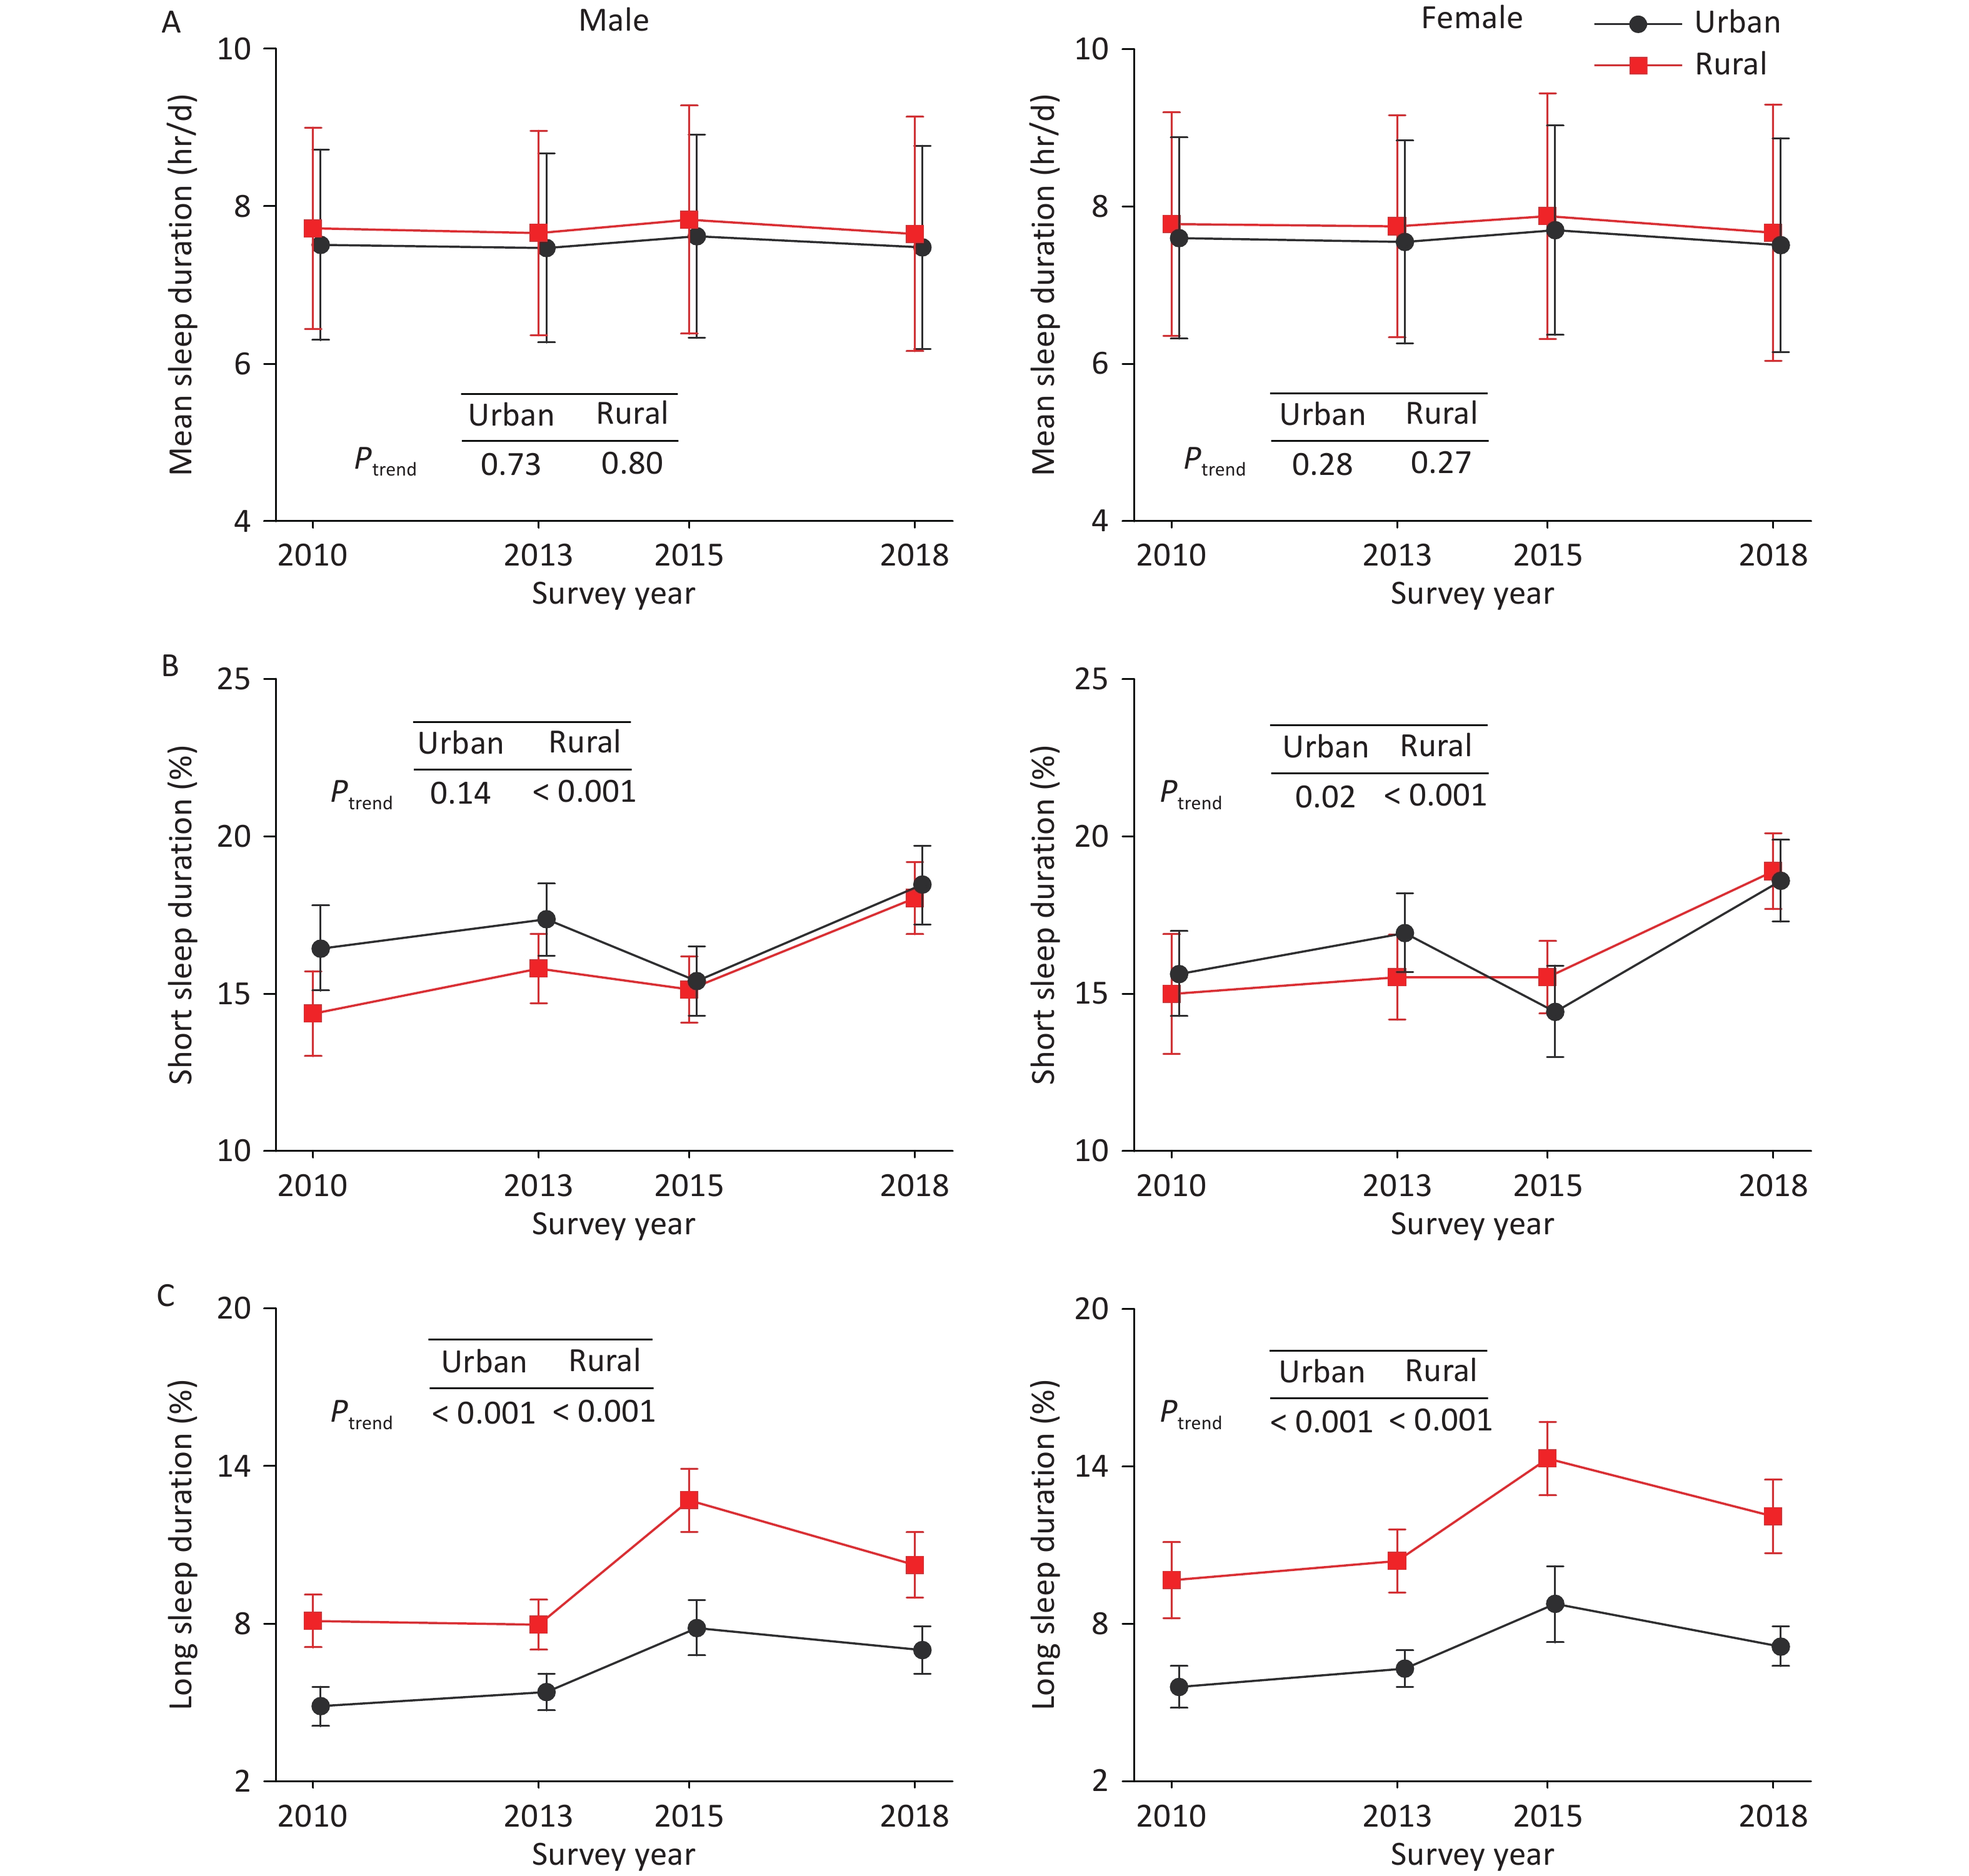
The overall mean sleep duration among Chinese adults did not show a significant trend over this period (P = 0.25) (Table 2). Trends in mean sleep duration were also not significant when stratified by sex (female or male), residence (rural or urban), or geographic location (eastern, central, or western China). Similarly, no significant trends were found in sleep duration among either females or males in rural or urban areas (Figure 2A). However, significant decreasing trends in mean sleep duration were observed among adults aged 30–59 years, those with junior high education, individuals engaged in non-agricultural manual work, retirees, and individuals diagnosed with diabetes.
Characteristics Hr/d, mean ± SDb P trend 2010
(n = 97,741)2013
(n = 175,749)2015
(n = 187,777)2018
(n = 184,153)Overall 7.66 ± 1.31 7.62 ± 1.31 7.76 ± 1.41 7.58 ± 1.45 0.25 Sex Male 7.63 ± 1.25 7.58 ± 1.26 7.72 ± 1.37 7.56 ± 1.39 0.68 Female 7.70 ± 1.36 7.66 ± 1.36 7.79 ± 1.45 7.59 ± 1.50 0.09 Residence Urban 7.56 ± 1.25 7.51 ± 1.25 7.66 ± 1.31 7.50 ± 1.33 0.68 Rural 7.75 ± 1.35 7.71 ± 1.36 7.86 ± 1.50 7.66 ± 1.56 0.45 Age, years 18 – 29 7.94 ± 1.12 7.93 ± 1.15 8.07 ± 1.22 7.91 ± 1.27 0.66 30 – 39 7.80 ± 1.12 7.73 ± 1.13 7.80 ± 1.17 7.69 ± 1.20 0.02 40 – 49 7.60 ± 1.23 7.54 ± 1.21 7.64 ± 1.31 7.49 ± 1.32 0.02 50 – 59 7.42 ± 1.36 7.37 ± 1.37 7.48 ± 1.49 7.29 ± 1.53 0.02 60 – 69 7.38 ± 1.52 7.33 ± 1.52 7.52 ± 1.66 7.28 ± 1.75 0.53 ≥ 70 7.37 ± 1.85 7.35 ± 1.78 7.74 ± 2.03 7.34 ± 2.04 0.19 Geographic location East 7.56 ± 1.26 7.52 ± 1.24 7.65 ± 1.32 7.47 ± 1.34 0.31 Central 7.69 ± 1.34 7.59 ± 1.37 7.79 ± 1.47 7.60 ± 1.52 0.76 West 7.79 ± 1.33 7.80 ± 1.32 7.89 ± 1.46 7.72 ± 1.52 0.53 Education Primary or less 7.62 ± 1.53 7.57 ± 1.50 7.79 ± 1.66 7.55 ± 1.75 0.91 Junior high 7.74 ± 1.21 7.68 ± 1.25 7.79 ± 1.35 7.61 ± 1.40 0.007 Senior high 7.63 ± 1.13 7.61 ± 1.16 7.71 ± 1.27 7.57 ± 1.27 0.56 College or above 7.59 ± 1.02 7.57 ± 1.01 7.65 ± 1.02 7.57 ± 1.07 0.90 Occupation Agriculture-related 7.72 ± 1.38 7.68 ± 1.35 7.84 ± 1.51 7.63 ± 1.59 0.60 Other manual work 7.66 ± 1.11 7.59 ± 1.14 7.64 ± 1.25 7.51 ± 1.21 0.02 Non-manual work 7.63 ± 1.24 7.59 ± 1.26 7.72 ± 1.31 7.57 ± 1.33 0.46 Not working 7.77 ± 1.28 7.76 ± 1.35 8.01 ± 1.44 7.76 ± 1.50 0.47 Retired 7.25 ± 1.39 7.08 ± 1.40 7.28 ± 1.52 7.03 ± 1.48 < 0.001 Marital status Single 7.85 ± 1.14 7.85 ± 1.12 8.00 ± 1.17 7.85 ± 1.24 0.35 Married 7.65 ± 1.29 7.60 ± 1.31 7.72 ± 1.41 7.54 ± 1.45 0.25 Separated/divorced/widowed 7.47 ± 1.65 7.34 ± 1.66 7.69 ± 1.96 7.31 ± 1.89 0.86 BMI (kg/m2)c < 18.5 (underweight) 7.83 ± 1.41 7.81 ± 1.37 8.02 ± 1.47 7.84 ± 1.52 0.10 18.5 – 23.9 (normal weight) 7.71 ± 1.30 7.67 ± 1.31 7.79 ± 1.41 7.63 ± 1.44 0.89 24.0 – 27.9 (overweight) 7.60 ± 1.29 7.55 ± 1.31 7.67 ± 1.40 7.50 ± 1.46 0.39 ≥ 28.0 (obesity) 7.56 ± 1.32 7.54 ± 1.30 7.67 ± 1.39 7.49 ± 1.43 0.85 Hypertensiond No 7.70 ± 1.24 7.68 ± 1.25 7.79 ± 1.33 7.63 ± 1.37 0.11 Yes 7.49 ± 1.43 7.46 ± 1.45 7.65 ± 1.59 7.41 ± 1.64 0.74 Diabetese No 7.67 ± 1.30 7.64 ± 1.30 7.76 ± 1.40 7.59 ± 1.42 0.88 Yes 7.54 ± 1.44 7.45 ± 1.41 7.58 ± 1.57 7.37 ± 1.62 0.005 Note. a Data of sleep duration were recorded in minutes, then converted to hours and calculated to mean values. b Standardized to the 2010 China census population. c Weight status was defined by Chinese BMI standard. d Defined as whose systolic blood pressure ≥ 140 mmHg and/or diastolic blood pressure ≥ 90 mmHg at the time of physical measurement according to Chinese guidelines for prevention and treatment of hypertension, or self-reported diagnosis of hypertension by a hospital at the township level or above and taking medication in the past two weeks. e Defined as whose fasting plasma glucose level ≥ 126 mg/dL, 2-hour plasma glucose level ≥ 200 mg/dL after a 75-g oral glucose challenge, or hemoglobin A1c level ≥ 6.5% according to the American Diabetes Association criteria, or self-reported diagnosis of diabetes by a hospital at the township level or above. SD, standard deviation; BMI, body mass index. Table 2. Trends in mean sleep durationa among adults in China from 2010 to 2018
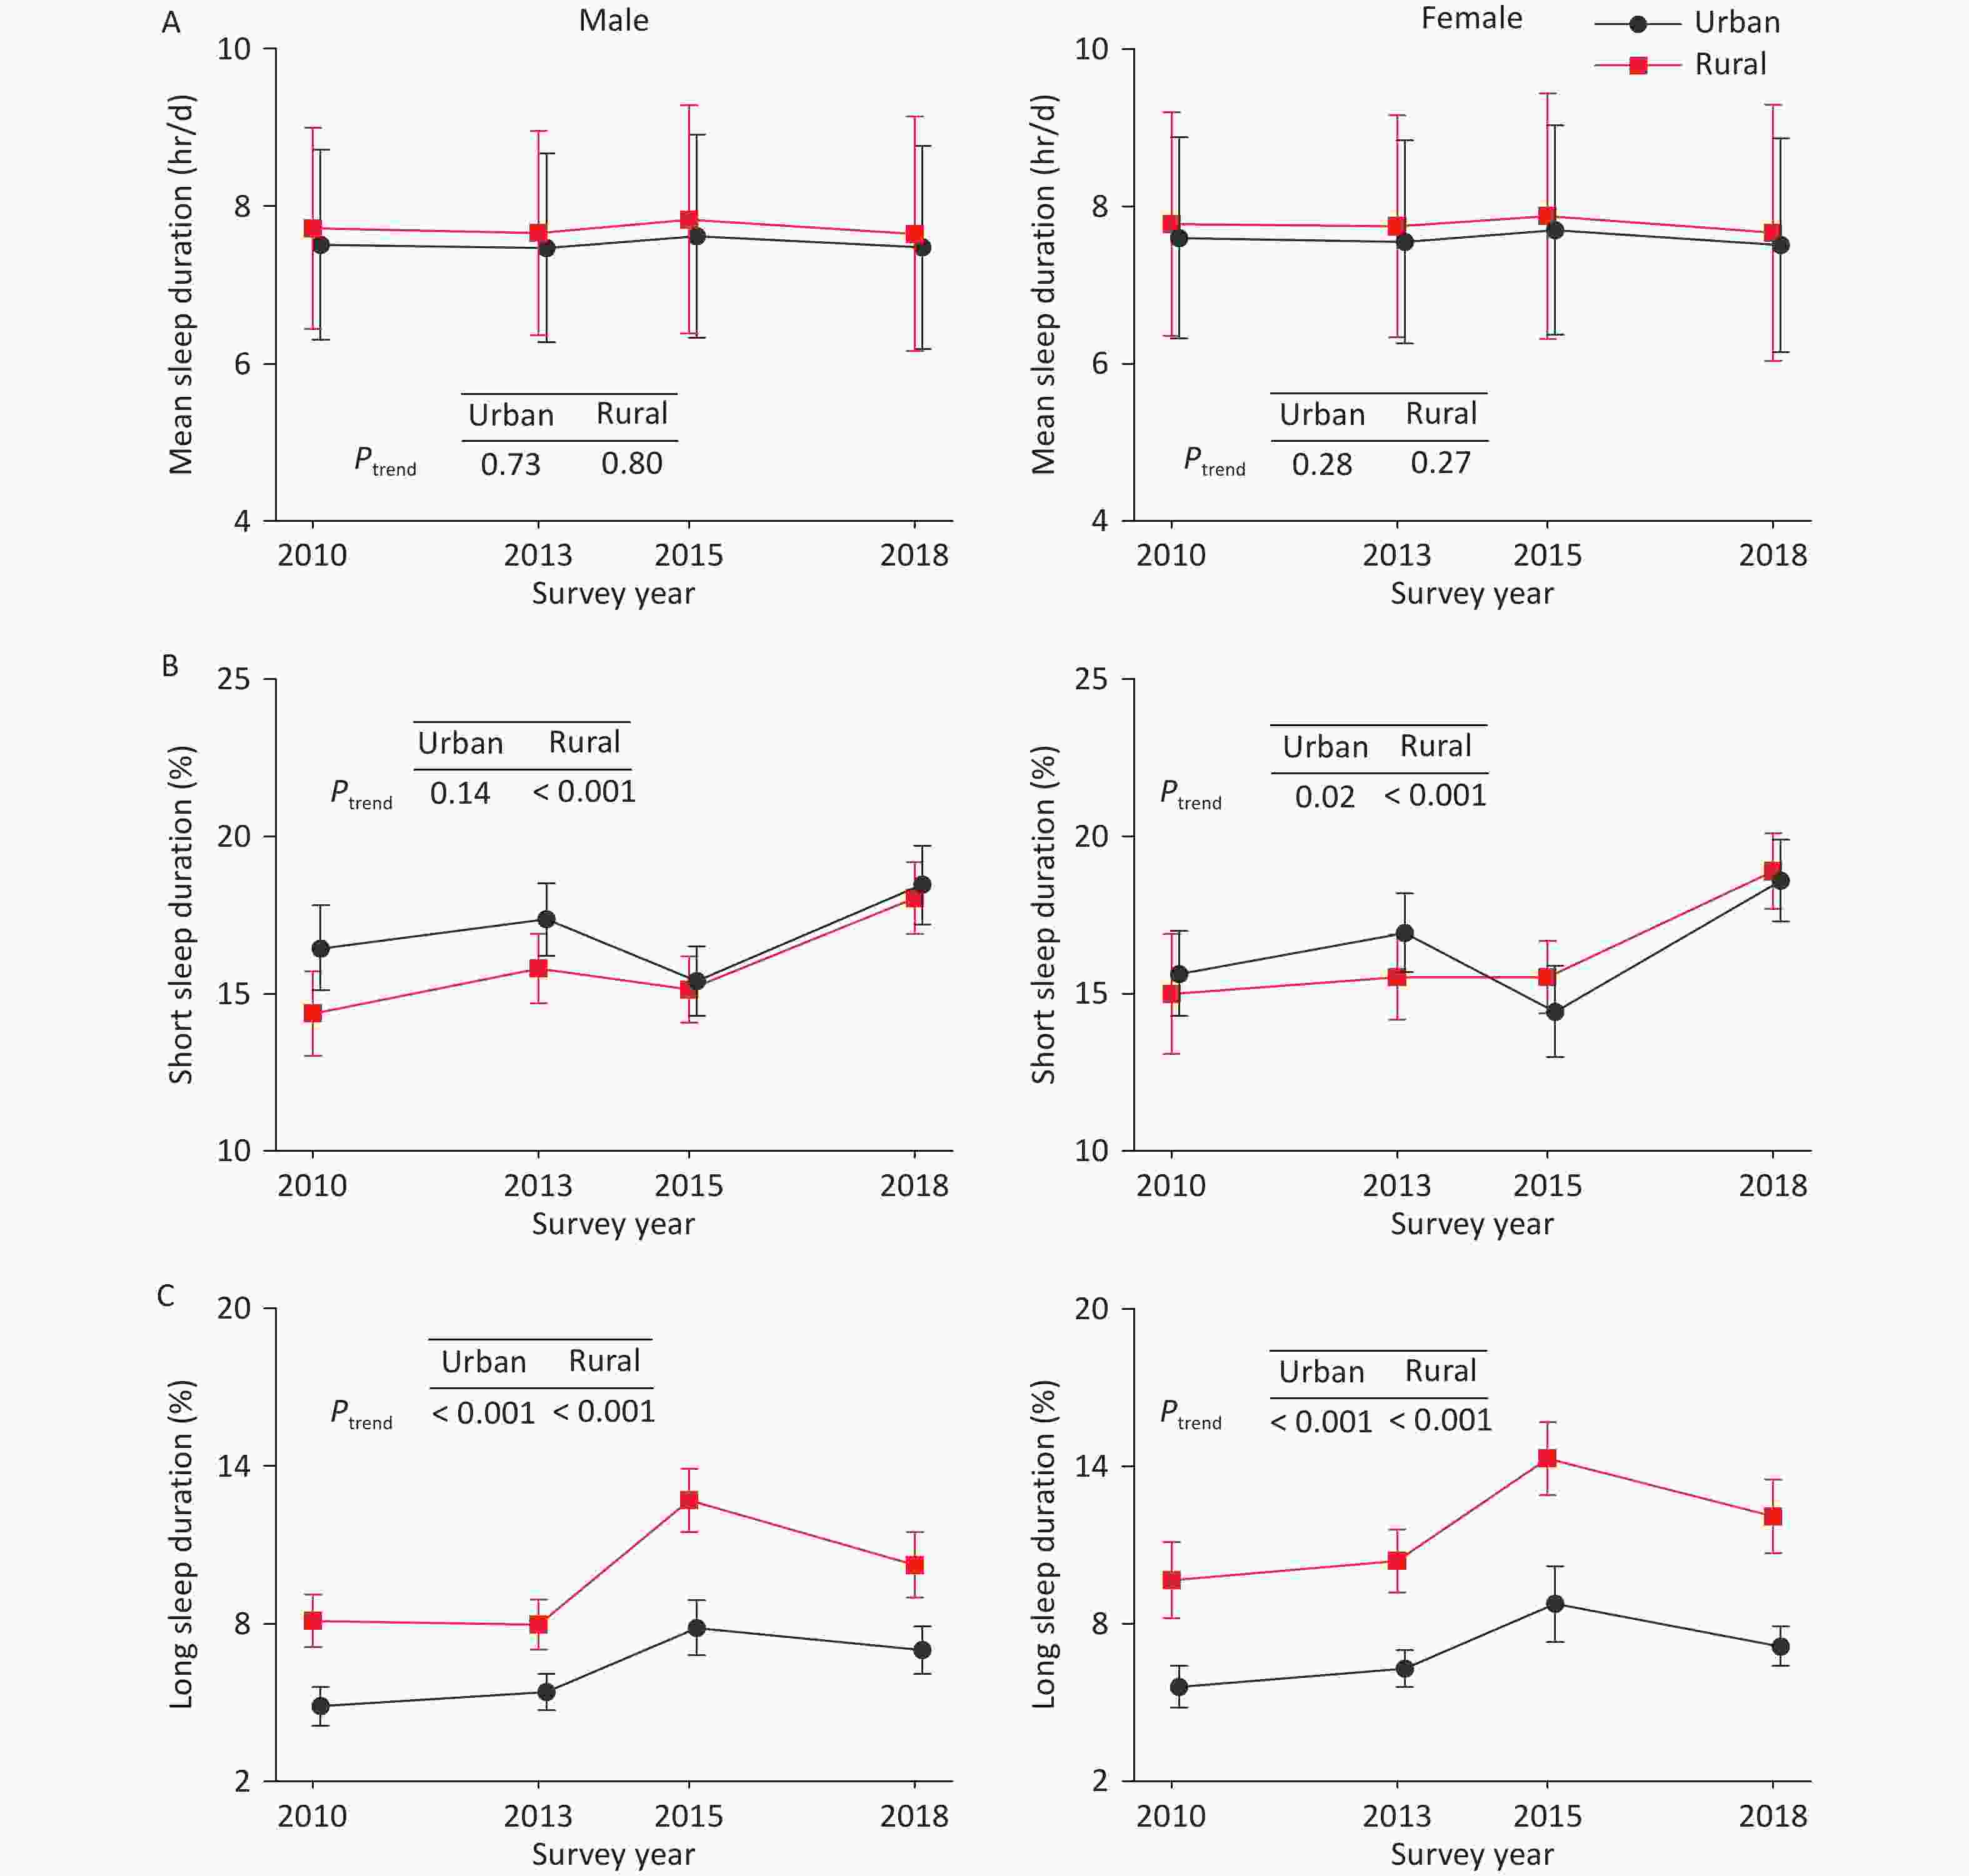
Figure 2. Trends in sleep duration among Chinese adults from 2010 to 2018, by residence and sex. (A) Mean sleep duration. (B) Prevalence of short sleep duration (≤ 6 hr/d). (C) Prevalence of long sleep duration (> 9 hr/d). Error bars indicate mean ± SD or % (95% CI). Sleep duration data were recorded in minutes, then converted to hours and calculated as mean values. All estimates were standardized to the 2010 China census population. There were no significant trends in mean sleep duration for either females or males in rural or urban China. The prevalence of short sleep duration among rural residents increased significantly in both males and females, while among urban residents, a significant trend was observed only in females. The prevalence of long sleep duration increased significantly in both males and females in rural and urban areas. SD, standard deviation; CI, confidence interval.
-
The weighted prevalence of short sleep duration (≤ 6 hr/d) among Chinese adults significantly increased from 15.3% (95% CI: 14.1%–16.5%) in 2010 to 18.5% (95% CI: 17.7%–19.3%) in 2018 (P < 0.001) (Table 3). When sleep duration was rounded down to whole hours, the results were nearly identical (Figure 1). An increasing prevalence of short sleep duration was observed across a wide range of demographic subgroups. More specifically, the increasing trends were significant across sex and residence groups. Among rural residents, the prevalence of short sleep duration increased significantly in both males and females. Among urban residents, a significant trend was observed only in females, not in males (P = 0.14) (Figure 2B). In addition, the prevalence of short sleep duration increased regardless of hypertension or diabetes status.
Characteristics Prevalence, % (95% CI)b P trend 2010
(n = 97,741)2013
(n = 175,749)2015
(n = 187,777)2018
(n = 184,153)Overall 15.3 (14.1 – 16.5) 16.4 (15.5 – 17.2) 15.1 (14.3 – 16.0) 18.5 (17.7 – 19.3) < 0.001 Sex Male 15.3 (14.2 – 16.4) 16.5 (15.6 – 17.4) 15.3 (14.4 – 16.1) 18.3 (17.4 – 19.1) 0.001 Female 15.3 (13.9 – 16.6) 16.2 (15.1 – 17.2) 15.0 (13.9 – 16.0) 18.7 (17.8 – 19.7) < 0.001 Residence Urban 16.0 (14.8 – 17.3) 17.2 (16.1 – 18.2) 14.9 (13.8 – 16.1) 18.5 (17.4 – 19.6) 0.03 Rural 14.7 (13.1 – 16.2) 15.7 (14.6 – 16.8) 15.3 (14.3 – 16.3) 18.5 (17.4 – 19.5) < 0.001 Age, years 18 – 29 7.5 (6.7 – 8.4) 7.9 (7.0 – 8.8) 6.8 (6.1 – 7.5) 9.6 (8.5 – 10.7) 0.02 30 – 39 9.8 (8.7 – 10.8) 11.3 (10.4 – 12.2) 10.7 (9.9 – 11.5) 12.4 (11.4 – 13.3) 0.002 40 – 49 15.4 (14.0 – 16.8) 16.4 (15.4 – 17.4) 16.0 (14.9 – 17.0) 19.0 (18.1 – 20.0) < 0.001 50 – 59 21.5 (19.6 – 23.3) 23.4 (22.1 – 24.7) 22.3 (21.2 – 23.5) 26.9 (25.7 – 28.1) < 0.001 60 – 69 25.8 (23.7 – 27.8) 26.6 (25.0 – 28.3) 25.2 (23.7 – 26.6) 30.2 (28.8 – 31.6) 0.001 ≥ 70 30.6 (27.8 – 33.4) 31.2 (29.1 – 33.4) 26.2 (24.2 – 28.2) 32.3 (30.4 – 34.1) 0.99 Education Primary or less 20.0 (18.1 – 21.9) 20.7 (19.4 – 22.1) 19.0 (17.8 – 20.3) 23.6 (22.2 – 25.0) 0.01 Junior high 12.8 (11.6 – 14.0) 14.3 (13.3 – 15.3) 14.1 (13.3 – 15.0) 18.2 (17.0 – 19.3) < 0.001 Senior high 13.2 (12.0 – 14.4) 14.5 (13.3 – 15.7) 13.8 (12.5 – 15.0) 16.4 (15.3 – 17.5) < 0.001 College or above 10.5 (9.2 – 11.9) 11.6 (10.2 – 13.0) 9.8 (8.6 – 11.1) 12.1 (10.9 – 13.2) 0.20 Geographic location East 16.4 (14.5 – 18.3) 17.2 (15.9 – 18.5) 15.7 (14.2 – 17.1) 19.2 (18.0 – 20.4) 0.06 Central 15.6 (13.6 – 17.6) 17.8 (16.4 – 19.2) 15.7 (13.9 – 17.4) 18.7 (17.1 – 20.3) 0.04 West 13.2 (10.9 – 15.4) 13.4 (11.3 – 15.4) 13.5 (12.4 – 14.7) 17.1 (15.5 – 18.6) 0.004 Occupation Agriculture-related 15.6 (13.8 – 17.3) 16.0 (14.8 – 17.3) 15.9 (14.9 – 16.9) 19.9 (18.7 – 21.2) < 0.001 Other manual work 13.6 (12.0 – 15.3) 13.8 (12.0 – 15.7) 14.6 (13.2 – 15.9) 17.9 (15.6 – 20.1) 0.002 Non-manual work 14.3 (13.1 – 15.5) 15.7 (14.7 – 16.7) 13.7 (12.6 – 14.7) 16.4 (15.6 – 17.3) 0.06 Not working 12.1 (10.0 – 14.2) 14.0 (11.9 – 16.1) 11.8 (10.3 – 13.2) 15.2 (13.3 – 17.1) 0.09 Retired 26.0 (23.7 – 28.4) 31.6 (29.5 – 33.7) 27.9 (25.9 – 29.9) 33.8 (31.3 – 36.2) < 0.001 Marital status Single 8.8 (7.6 – 10.1) 8.3 (7.3 – 9.4) 6.7 (5.5 – 8.0) 10.1 (8.7- 11.5) 0.43 Married 15.4 (14.2 – 16.6) 16.7 (15.8 – 17.6) 15.9 (15.1 – 16.8) 19.3 (18.5 – 20.2) < 0.001 Separated/divorced/widowed 25.0 (22.2 – 27.7) 29.2 (27.2 – 31.3) 25.6 (23.2 – 27.9) 30.9 (28.4 – 33.4) 0.04 BMI (kg/m2)c < 18.5 (underweight) 13.4 (11.6 – 15.2) 13.4 (11.6 – 15.1) 11.7 (9.5 – 13.8) 13.2 (10.9 – 15.5) 0.19 18.5 – 23.9 (normal weight) 14.3 (13.1 – 15.5) 15.1 (14.2 – 16.1) 14.1 (13.3 – 15.0) 17.4 (16.5 – 18.3) 0.07 24.0 – 27.9 (overweight) 16.4 (15.1 – 17.6) 17.8 (16.8 – 18.8) 16.9 (16.0 – 17.9) 20.4 (19.4 – 21.3) < 0.001 ≥ 28.0 (obesity) 17.6 (16.1 – 19.2) 18.3 (17.1 – 19.4) 16.8 (15.8 – 17.9) 20.0 (18.8 – 21.3) 0.009 Hypertensiond No 13.2 (12.2 – 14.3) 14.2 (13.4 – 15.0) 13.3 (12.4 – 14.1) 16.2 (15.4 – 16.9) < 0.001 Yes 20.8 (19.2 – 22.4) 21.8 (20.6 – 23.0) 20.2 (19.2 – 21.3) 25.2 (24.0 – 26.5) < 0.001 Diabetese No 14.8 (13.7 – 16.0) 15.8 (14.9 – 16.6) 14.8 (13.9 – 15.7) 17.8 (17.0 – 18.5) 0.03 Yes 19.9 (18.0 – 21.7) 21.7 (20.2 – 23.1) 22.0 (20.4 – 23.5) 25.9 (24.5 – 27.2) < 0.001 Note. a Short sleep duration was defined as whose total sleep duration ≤ 6 hours per day. b Standardized to the 2010 China census population. c Weight status was defined by Chinese BMI standard. d Defined as whose systolic blood pressure ≥ 140 mmHg and/or diastolic blood pressure ≥ 90 mmHg at the time of physical measurement according to Chinese guidelines for prevention and treatment of hypertension, or self-reported diagnosis of hypertension by a hospital at the township level or above and taking medication in the past two weeks. e Defined as whose fasting plasma glucose level ≥ 126 mg/dL, 2-hour plasma glucose level ≥ 200 mg/dL after a 75-g oral glucose challenge, or hemoglobin A1c level ≥ 6.5% according to the American Diabetes Association criteria, or self-reported diagnosis of diabetes by a hospital at the township level or above.
CI, confidence interval; BMI, body mass index.Table 3. Trends in prevalence of short sleep durationa among adults in China from 2010 to 2018
By subpopulation, no substantial increases in short sleep duration were observed among adults aged ≥ 70 years, those with college education or above, those living in eastern China, individuals engaged in non-manual work, or those not working. After stratifying by sex and residence, results for these subgroups remained stable with no significant changes (Supplementary Tables S2, S3, S4, and S5).
-
Similarly, the standardized prevalence of long sleep duration (> 9 hr/d) also significantly increased from 7.2% (95% CI: 6.3%–8.1%) in 2010 to 9.0% (95% CI: 8.2%–9.9%) in 2018 (P < 0.001) (Table 4). Increasing trends were observed across most subgroups classified by sex, residence, age, geographic location, and education. Among rural residents, the prevalence of long sleep duration increased significantly in both males and females, as did the prevalence among their urban counterparts (Figure 2C). However, by occupation, no substantial increases were observed among retired adults or those in non-agricultural manual work. After stratification by sex and residence, the results for subgroups classified by age, geographic location, education level, and occupation remained consistent (Supplementary Tables S6, S7, S8, and S9). Similar to short sleep duration, the prevalence of long sleep duration increased regardless of the presence of hypertension or diabetes.
Characteristics Prevalence, % (95% CI)b P trend 2010
(n = 97,741)2013
(n = 175,749)2015
(n = 187,777)2018
(n = 184,153)Overall 7.2 (6.3 – 8.1) 7.6 (7.0 – 8.3) 10.8 (9.9 – 11.7) 9.0 (8.2 – 9.9) < 0.001 Sex Male 6.6 (5.8 – 7.4) 6.8 (6.2 – 7.4) 10.2 (9.2 – 11.1) 8.6 (7.7 – 9.4) < 0.001 Female 7.8 (6.7 – 8.8) 8.5 (7.7 – 9.3) 11.4 (10.3 – 12.6) 9.5 (8.6 – 10.4) < 0.001 Residence Urban 5.2 (4.5 – 6.0) 5.9 (5.3 – 6.4) 8.3 (7.3 – 9.3) 7.1 (6.3 – 7.8) < 0.001 Rural 8.9 (7.7 – 10.0) 9.2 (8.2 – 10.1) 13.5 (12.3 – 14.7) 11.2 (9.9 – 12.4) < 0.001 Age, years 18 – 29 8.6 (7.4 – 9.7) 9.8 (8.6 – 11.1) 12.5 (11.1 – 13.9) 11.0 (9.5 – 12.6) 0.001 30 – 39 6.2 (5.3 – 7.2) 6.4 (5.7 – 7.0) 8.6 (7.5 – 9.6) 7.4 (6.6 – 8.3) 0.005 40 – 49 5.5 (4.7 – 6.4) 5.7 (5.1 – 6.3) 8.3 (7.3 – 9.3) 6.7 (5.9 – 7.6) 0.001 50 – 59 5.7 (4.9 – 6.5) 5.9 (5.4 – 6.5) 9.0 (8.0 – 9.9) 7.4 (6.6 – 8.3) < 0.001 60 – 69 8.1 (6.4 – 9.8) 7.7 (6.9 – 8.6) 11.9 (10.6 – 13.2) 10.3 (9.3 – 11.4) < 0.001 ≥ 70 11.9 (9.9 – 14.0) 12.6 (11.0 – 14.3) 20.5 (18.3 – 22.6) 15.2 (13.6 – 16.8) < 0.001 Education Primary or less 9.6 (8.2 – 11.1) 9.5 (8.6 – 10.5) 15.0 (13.5 – 16.5) 12.9 (11.6 – 14.2) < 0.001 Junior high 7.1 (6.3 – 7.9) 7.7 (6.9 – 8.6) 10.8 (9.7 – 11.8) 9.0 (8.0 – 10.0) < 0.001 Senior high 4.7 (4.1 – 5.4) 5.7 (5.0 – 6.5) 8.1 (6.6 – 9.5) 7.0 (6.0 – 7.9) < 0.001 College or above 2.8 (2.2 – 3.5) 4.0 (3.3 – 4.7) 4.3 (3.5 – 5.1) 4.4 (3.7 – 5.0) 0.004 Geographic location East 5.7 (4.7 – 6.8) 6.0 (5.2 – 6.8) 8.4 (7.2 – 9.5) 6.8 (5.7 – 7.9) 0.04 Central 7.8 (6.2 – 9.5) 8.0 (6.8 – 9.3) 12.4 (10.4 – 14.3) 10.1 (8.7 – 11.6) < 0.001 West 8.8 (7.1 – 10.4) 9.7 (8.2 – 11.3) 12.9 (11.3 – 14.6) 11.4 (9.8 – 13.1) 0.005 Occupation Agriculture-related 8.5 (7.4 – 9.5) 8.7 (7.8 – 9.6) 13.4 (12.2 – 14.6) 11.5 (10.2 – 12.9) < 0.001 Other manual work 5.1 (3.9 – 6.3) 5.5 (4.5 – 6.4) 7.0 (5.5 – 8.5) 5.5 (4.3 – 6.8) 0.25 Non-manual work 6.0 (5.0 – 7.0) 6.7 (6.0 – 7.4) 8.9 (7.9 – 10.0) 7.6 (6.7 – 8.5) < 0.001 Not working 8.6 (6.8 – 10.4) 10.6 (8.4 – 12.8) 14.8 (11.9 – 17.6) 11.1 (9.6 – 12.7) 0.01 Retired 5.4 (4.5 – 6.3) 5.1 (4.1 – 6.2) 7.8 (6.5 – 9.1) 5.6 (4.9 – 6.3) 0.09 Marital status Single 7.7 (6.4 – 9.1) 8.7 (7.2 – 10.1) 10.7 (9.0 – 12.3) 9.5 (7.8 – 11.3) 0.13 Married 6.9 (6.0 – 7.8) 7.3 (6.7 – 7.9) 10.5 (9.5 – 11.5) 8.8 (7.9 – 9.6) < 0.001 Separated/divorced/widowed 9.2 (7.7 – 10.8) 10.5 (9.0 – 12.0) 18.2 (15.7 – 20.7) 12.7 (10.9 – 14.5) < 0.001 BMI (kg/m2)c < 18.5 (underweight) 11.2 (9.1 – 13.3) 11.1 (9.1 – 13.2) 15.7 (13.6 – 17.8) 13.4 (11.0 – 15.9) 0.18 18.5 – 23.9 (normal weight) 7.4 (6.5 – 8.4) 8.0 (7.2 – 8.8) 11.0 (10.0 – 12.1) 9.4 (8.3 – 10.5) < 0.001 24.0 – 27.9 (overweight) 6.4 (5.6 – 7.2) 7.0 (6.2 – 7.8) 10.0 (8.9 – 11.1) 8.3 (7.4 – 9.2) < 0.001 ≥ 28.0 (obesity) 6.5 (5.5 – 7.5) 6.7 (5.9 – 7.4) 9.6 (8.5 – 10.7) 8.2 (7.2 – 9.3) < 0.001 Hypertensiond No 6.9 (6.0 – 7.8) 7.5 (6.9 – 8.2) 10.0 (9.2 – 10.9) 8.6 (7.9 – 9.4) < 0.001 Yes 7.3 (6.3 – 8.3) 7.9 (7.0 – 8.8) 12.4 (11.1 – 13.6) 9.9 (8.8 – 11.1) < 0.001 Diabetese No 7.2 (6.3 – 8.0) 7.7 (7.0 – 8.4) 10.6 (9.7 – 11.5) 8.9 (8.1 – 9.7) < 0.001 Yes 7.5 (6.1 – 8.9) 7.4 (6.4 – 8.4) 11.3 (9.9 – 12.8) 9.5 (8.3 – 10.7) 0.001 Note. aLong sleep duration was defined as whose total sleep duration > 9 hours per day. bStandardized to the 2010 China census population. cWeight status was defined by Chinese BMI standard. dDefined as whose systolic blood pressure ≥ 140 mmHg and/or diastolic blood pressure ≥ 90 mmHg at the time of physical measurement according to Chinese guidelines for prevention and treatment of hypertension, or self-reported diagnosis of hypertension by a hospital at the township level or above and taking medication in the past two weeks. eDefined as whose fasting plasma glucose level ≥ 126 mg/dL, 2-hour plasma glucose level ≥ 200 mg/dL after a 75-g oral glucose challenge, or hemoglobin A1c level ≥ 6.5% according to the American Diabetes Association criteria, or self-reported diagnosis of diabetes by a hospital at the township level or above. CI, confidence interval; BMI, body mass index. Table 4. Trends in prevalence of long sleep durationa among adults in China from 2010 to 2018
-
Based on four rounds of the CCDRFS survey conducted between 2010 and 2018 and involving a large-scale sample of 645,420 participants, we reported the distributions and temporal trends of sleep duration among Chinese adults. In 2018, the estimated overall mean sleep duration was 7.58 hours per day, and the standardized prevalence of short and long sleep durations was 18.5% and 9.0%, respectively. Sleep durations varied by sex, residence, age, geographic location, and occupation. While the mean sleep duration among Chinese adults did not change substantially from 2010 to 2018, significant increasing trends in the prevalence of both short and long sleep durations were observed.
To the best of our knowledge, limited health information is available on sleep duration and its trends in the Chinese population, with only the CFPS recently reporting on this topic. That report showed a gradual decline in sleep duration, from 8.2 hr/d in 2010 to 7.6 hr/d in 2016, and a rise in short sleep duration from 11.8% in 2010 to 24.1% in 2016[12]. Unfortunately, trends in long sleep duration—also a risk factor for numerous adverse health outcomes—have not yet been reported. The accuracy of the CFPS trend estimates is questionable due to changes in the sleep duration questionnaires and response rates across years[12]. The average sleep duration in 2010 appeared higher than expected, so the reported decline may be a false-positive result. This limitation may also have exaggerated the reported increase in the prevalence of short sleep duration. Evidence from the CCDRFS suggests that while average sleep duration in the Chinese population has not changed significantly in recent years, this does not indicate that the goal of sleep hygiene has been achieved. In fact, the proportion of individuals with optimal sleep duration has decreased, while both long and short sleep durations have increased.
An increasing trend in the prevalence of short sleep duration has also been observed in other countries[11]. For example, among adults in the USA, short sleep duration increased from 22.3% in 1985 to 32.9% in 2017, based on National Health Interview Survey (NHIS) data[22,23]. However, information on long sleep duration remains limited. One NHIS-based study reported a decrease in the prevalence of sleeping ≥ 9 hours per day, from 11.9% in 1985 to 7.3% in 2017[22,23]. To our knowledge, no previous studies have reported temporal trends in long sleep duration in the Chinese population. A few cross-sectional studies have provided earlier data, but differences in definition criteria limit direct comparison. For instance, the China Kadoorie Biobank (CKB) study reported a long sleep prevalence (≥ 9 hr/d) of 15.9% between 2004 and 2008[24]. In our study, using the same criteria, the prevalence was 17.7% in 2018 (data not shown), slightly higher than that reported in the CKB. This finding suggests that the increasing trend in long sleep duration may have begun before the earliest years covered by our study, possibly as early as 2008. Collectively, these findings highlight the increasing prevalence of poor sleep hygiene globally in recent years—especially in China—underscoring the need for greater efforts to address this issue.
Our study also illustrated the demographic patterns of sleep duration in China and found disparities by sex, residence, age, geographic location, and occupation. Regarding sex and residence, the prevalence of insufficient sleep has remained high among urban males since 2010, narrowing rural-urban differences by 2018. This may indicate that urban males experienced sleep loss earlier. In addition, the prevalence of long sleep duration followed a U-shaped curve across age groups, with both short and long sleep durations peaking among those aged ≥ 70 years. Another interesting finding was that both short and long sleep durations decreased with increasing educational level, suggesting that individuals with higher education may have greater awareness of sleep hygiene, potentially promoting healthier sleep. These results are consistent with findings from another study in a Chinese population[12].
Over the past few decades, China has undergone profound changes in population structure, urbanization, and digitalization—all of which may have contributed to the rise in insufficient sleep. Contributing factors include a faster pace of life and work, increased perceived stress, overuse of electronic devices, and a general neglect of sleep hygiene. Long sleep duration, also an indicator of poor sleep hygiene, has increased alongside short sleep and may stem from the same contributing factors. Therefore, average sleep duration alone is insufficient to assess sleep hygiene at the national level. The proportion of individuals with optimal sleep duration may be a more appropriate index.
This study has several important public health implications. Assessing the trends in sleep duration among the Chinese population is essential before implementing the Healthy China Initiative and will provide an important baseline for evaluating its outcomes. Interestingly, while average sleep duration appeared stable, a substantial decline in the proportion of healthy sleep was masked by the simultaneous rise in both long and short sleep durations. These changes may contribute significantly to the burden of cognitive decline, chronic diseases (e.g., cardiovascular disease, stroke, diabetes), and mortality in China. Therefore, sleep-promoting initiatives are urgently needed. These should include improving rural healthcare, integrating sleep promotion into chronic disease management, and raising public awareness of sleep hygiene. Additionally, research has shown that adult sleep patterns are established during adolescence and shaped by social, behavioral, and environmental factors[25,26]. Therefore, education on sleep hygiene should begin early, with a proactive approach to cultivating healthy sleep habits during adolescence.
This study has several strengths. We used consistent questions to assess sleep duration across a series of nationally representative cross-sectional surveys, providing strong comparability and robust estimates from large sample sizes. However, there are some limitations. First, self-reported sleep duration and demographic variables (e.g., education and occupation) are subject to recall bias. Second, the questions and definitions used for short and long sleep duration were not fully consistent with those in previous studies, limiting comparability. Nonetheless, we also applied thresholds of ≤ 5 and ≥ 10 hr/d—used in some other studies—and still found a significant upward trend. Third, sleep duration was measured as total daily sleep without distinguishing between nighttime and other periods, or between weekdays and weekends, which may limit the interpretability of our estimates under different conditions.
-
Between 2010 and 2018, this repeated national cross-sectional survey showed no substantial change in the mean sleep duration among Chinese adults. However, the prevalence of both short and long sleep durations increased significantly during this period. These increasing trends may contribute to higher incidences of chronic diseases and mortality. The findings highlight the urgent need for health initiatives to optimize sleep duration in China. Future studies should focus on the prevention and control of sleep disturbances among Chinese adults—especially in rural and female populations and patients with chronic diseases—which may help improve sleep hygiene nationwide.
The Increasing Trends of Short and Long Sleep Duration among Chinese Adults from 2010 to 2018: A Repeated Nationally Representative Cross-sectional Survey
doi: 10.3967/bes2025.093
- Received Date: 2025-04-22
- Accepted Date: 2025-06-30
-
Key words:
- Sleep duration /
- Trend analysis /
- Repeated cross-sectional study /
- Nationally representative survey /
- CCDRFS
Abstract:
None declared.
The CCDRFS 2010, 2013, and 2018 protocols were approved by the ethical review committees of the National Center for Chronic and Noncommunicable Disease Control and Prevention, Chinese Center for Disease Control and Prevention (China CDC). The CCDRFS 2015 protocol was approved by the ethical review committee of the China CDC. All participants provided written informed consent before the formal investigation.
&These authors contributed equally to this work.
| Citation: | Yun Chen, Lan Wang, Mei Zhang, Sifan Hu, Yan Shao, Xiao Zhang, Chun Li, Jie Chen, Zhenping Zhao, Yanhong Dong, Lin Lu, Maigeng Zhou, Limin Wang, Junliang Yuan, Hongqiang Sun. The Increasing Trends of Short and Long Sleep Duration among Chinese Adults from 2010 to 2018: A Repeated Nationally Representative Cross-sectional Survey[J]. Biomedical and Environmental Sciences. doi: 10.3967/bes2025.093

|

 Quick Links
 DownLoad: