
-
Stroke is the leading cause of death and disability globally[1]. Ischemic stroke (IS), which accounts for about 87% of the stroke cases in China[2], imposes a substantial health and economic burden on individuals and society[3,4]. A better understanding of the mechanisms of IS will help advance the window for early intervention and enable more precise prevention and treatment strategies. Atherosclerosis is a major pathological mechanism underlying IS, with key features including cholesterol deposition and chronic inflammation[5]. According to the lipid theory of atherosclerosis, lipid peroxidation and the oxidation of low-density lipoprotein (LDL) trigger the initiation and progression of atherosclerosis[5,6]. The traditional lipid profile, which includes total cholesterol, triglycerides, high-density lipoprotein cholesterol, and LDL cholesterol, is a well-established tool for assessing the risk of IS and has been widely used in clinical practice for the prevention and management of this debilitating disorder[7,8]. However, other non-traditional lipids have emerged as possible alternative predictors of IS risk in addition to traditional single or panel lipids, as they better reflect the overall interaction between the lipid/lipoprotein fractions.
Several studies have shown that individual lipids or lipid species are associated with IS and its main risk factors. For example, a lipidomic analysis of 86 obese individuals found that phospholipids were associated with insulin resistance[9]. A prospective cohort study that included 1,192 Mexican Americans identified that diacylglycerols at baseline were associated with a future risk of hypertension[10]. A nested case-control study found that LDL particle levels were higher in 1,146 IS cases compared to 1466 healthy controls[11]. However, these studies mainly applied a metabolomic approach, which cannot extensively capture lipid profiles because of the lack of lipid extraction, a key process in lipid profiling. Lipid biomarkers and the underlying molecular mechanisms of IS remain unclear. Lipidomics, the systematic study of whole lipids and their interacting molecules and functions, has obvious advantages in identifying lipid-specific biomarkers and mechanisms[12] that may provide targeted treatment and early prevention of IS. However, lipidomic studies on IS are limited. Here, we conducted a pilot lipidomic study to examine whether lipid metabolites, species, and structures are associated with IS.
-
Forty participants, including 20 patients with IS and 20 healthy controls, were included in this pilot case-control study. Specifically, 20 patients with first-time IS were consecutively recruited from the Second Affiliated Hospital of Soochow University in March of 2017. IS was diagnosed based on clinical symptoms and imaging examinations, including cranial computed tomography scan and/or magnetic resonance imaging within 24 h after hospital admission. Twenty age- and sex-matched healthy controls free of cardiovascular disease were randomly selected from the Gusu cohort, a 2014 study involving 2,498 community members residing in Suzhou City. The study protocols were approved by the Ethics Committee of Soochow University (Approval No. 2007IRB1) and performed in accordance with the Declaration of Helsinki. Written informed consent was obtained from all participants.
-
Information on sociodemographic data, lifestyle, and medical history was obtained using standard questionnaires administered by trained staff members. Participants were categorized as current smokers or non-smokers. Current smoking was defined as having smoked at least 100 cigarettes in one’s lifetime or as a regular and current smoker. Alcohol consumption was defined as current drinking or non-drinking. Current drinking was defined as having consumed any type of alcoholic beverage ≥ 12 times during the past year. Medications for dyslipidemia, diabetes, and hypertension were also obtained.
-
Blood samples were obtained after overnight fasting (at least 8 h) and plasma was separated and stored at –80 °C until assay. Sixty microliters of each plasma sample was used to extract lipids following the Methyl-tert-Butyl Ether (MTBE) extraction procedure[13]. Then, the dried samples were reconstituted with 100 μL of dichloromethane/MeOH (1:1, v/v) and subjected to UHPLC-MS/MS analysis. Finally, 10 μL of each prepared sample was taken and pooled to create the QC sample.
-
Lipid profiling was performed using a UHPLC system (1290 series, Agilent Technologies, USA) coupled with a Q-TOF mass spectrometer (Triple TOF 6600, AB SCIEX, USA), according to the typical protocol[14]. In specific, using Phenomen Kinetex C18 100A column (1.7 um, 100 mm × 2.1 mm), the separation of lipid extracts was processed at 25 °C with elution gradient mobile phases A and B (0 min: 60% A + 40% B; 12 min: 100% B; 13.5 min: 100% B; 13.7 min: 60% A + 40% B; 18 min: 60% A + 40% B) delivered at a flow rate of 300 μL/min. Mobile phase A consisted of a mixture of 10 mmol/L HCOONH4, 40% H2O, and 60% ammonium acetate. Mobile phase B was comprised of a mixture of 10 mmol/L HCOONH4, 10% ammonium acetate, and 90% isopropanol. The injection volume was 0.5 μL and 4 μL in positive and negative ion modes, respectively, for each testing sample with QC inserted. A Triple TOF mass spectrometer was used to acquire MS/MS spectra. The source parameters were set as follows: ion source gas 1 as 60 Pa, ion source gas 2 as 60 Pa, curtain gas as 30 Pa, source temperature as 550 °C, ion spray voltage floating as 5,500 V in positive model and −4,500 V in negative mode, and collision energy as 35 eV. Data acquisition and processing were performed using Analyst TF software (version 1.7, AB Sciex). Chromatograms of the QC and tested samples in the positive and negative ion models are shown in the Supplementary files.
-
Data were processed using an absolute quantitative lipidomics method[15]. In specific, MS raw data files were converted to the mzXML format using the “msconvert” program from ProteoWizard (version 3.0.6150), and processed by the R package XCMS (version 1.41.0). The preprocessed results generated a data matrix consisting of RT, m/z, and peak intensity. The cut-off for the match score was set at 0.8, and minfrac was set at 0.5. Metabolic features detected in less than 50% of the QC samples were discarded. Lipid identification was achieved by spectral matching using an in-house MS/MS spectral library. Absolute quantitation of lipids can be achieved based on the peak area of the identified lipid and the internal standard in a sample. Lipids with missing values in more than 50% of the samples or relative standard deviations > 30% were excluded. The remaining missing values were filled in with half the minimum value of the corresponding lipid molecules.
-
The clinical characteristics of the study participants for IS cases and their matched healthy controls are presented. The concentrations of lipid molecules were normalized to maximize the normality of data distribution using the R package “bestNormaliaze” and the generated values were used in downstream analyses. Univariate and multivariate analyses were simultaneously performed to identify potential IS-related lipid molecules. For univariate analysis, group differences in lipid molecules were evaluated using Student’s t-test. Multiple testing was controlled for using a false discovery rate (FDR) approach. For multivariate analysis, principal component analysis (PCA) and orthogonal partial least squares discriminant analysis (OPLS-DA) were used to visualize differential lipid molecules between patients with IS and healthy controls. A 7-fold cross-validation method was used to estimate the robustness and predictive ability of the OPLS-DA model, and variable importance in the projection (VIP) coefficients was generated. Differential lipid molecules with both an FDR-adjusted P value less than 0.05 and a VIP greater than 1.0, were considered potential IS-related lipids that were then used in enrichment analysis to further uncover lipid metabolic pathways using MetaboAnalyst 5.0 (www.metaboanalyst.ca). Because of their common chemical structures and similar biological roles in specific lipid species, we used the summed concentrations of all molecules to represent the level of their constituent lipid species. Additionally, the summed concentrations were weighted by the number of carbon atoms and the number of double bonds, which have been reported to be associated with phenotypes such as cardiovascular disease[16], using the following formula: lipid concentration × no. for the carbon atoms × (no. of double bonds + 1). The group differences in the average level of each lipid species were compared using Student’s t-test.
-
To reduce potential confounding effects, age, sex, cigarette smoking, alcohol consumption, hypertension, diabetes, and hyperlipidemia were controlled by constructing logistic regression models, although IS cases and healthy controls were relatively comparable. All statistical analyses were performed using R version 4.2.1. All tests were two-tailed, and the results were considered statistically significant at P < 0.05.
-
Twenty patients with IS and 20 age- and sex-matched healthy controls were included in the analysis. The clinical characteristics of the patients are summarized in Table 1. Almost all variables listed did not differ significantly between the two groups (all P > 0.05), except for cigarette smoking status (P = 0.047). The cases and controls selected seemed to be relatively comparable.
Characteristics IS cases Healthy controls P value No. of participants 20 20 Age, years, mean ± SD 64.3 ± 8.8 62.9 ± 9.4 0.629 Sex, males (%) 16 (80.0) 15 (75.0) 1.000 Current smoking, n (%) 4 (20.0) 10 (50.0) 0.047 Current drinking, n (%) 3 (15.0) 7 (35.0) 0.144 Hypertension, n (%) 5 (25.0) 11 (55.0) 0.053 Diabetes mellitus, n (%) 1 (5.0) 0 (0.0) 1.000 Atrial fibrillation, n (%) 1 (5.0) 0 (0.0) 1.000 Hyperlipidemia, n (%) 2 (10.0) 4 (20.0) 0.658 Note. The percentages were compared using Fisher’s tests. IS: ischemic stroke. Table 1. The clinical characteristics of study participants
-
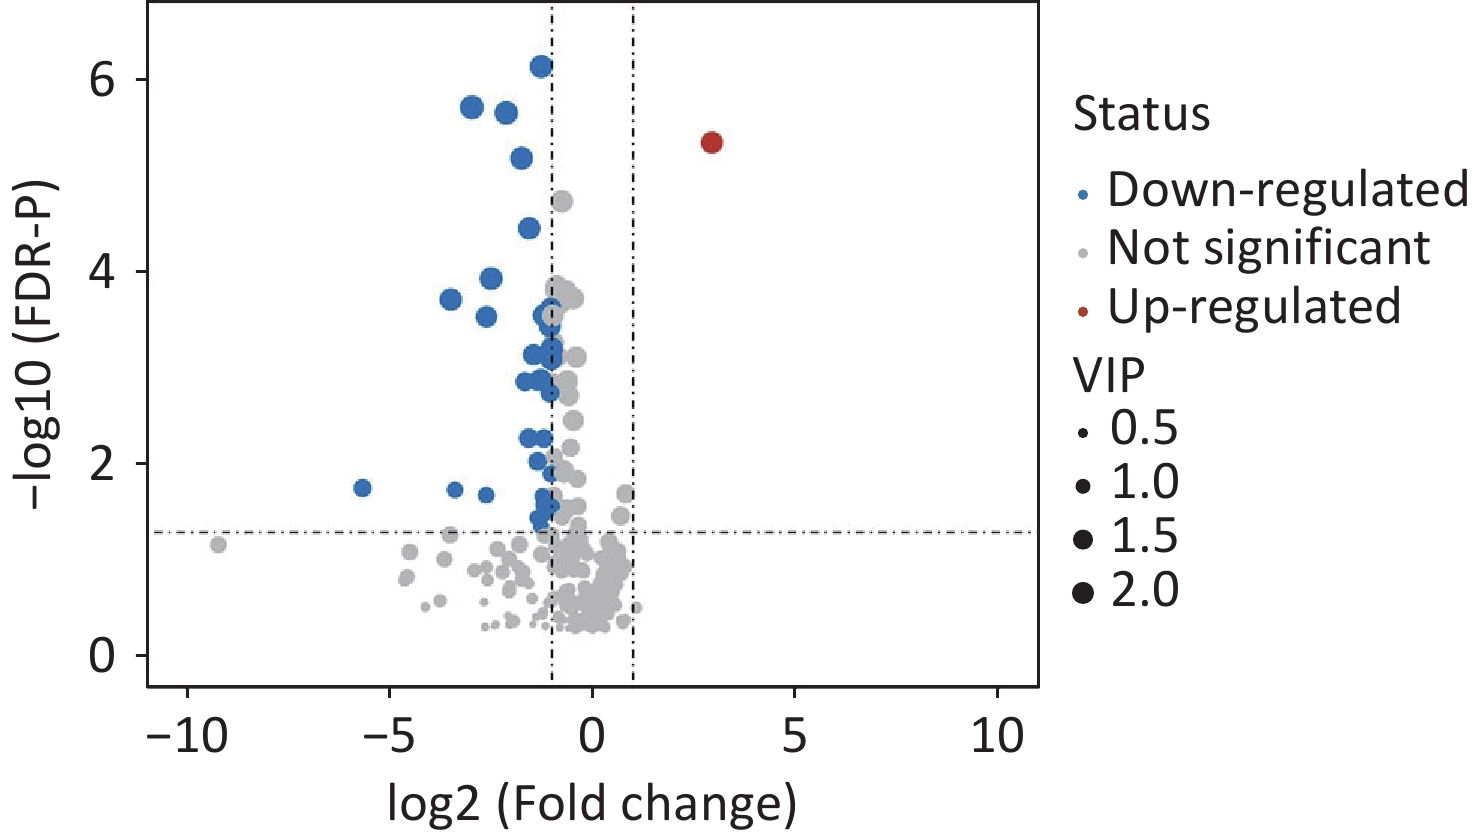
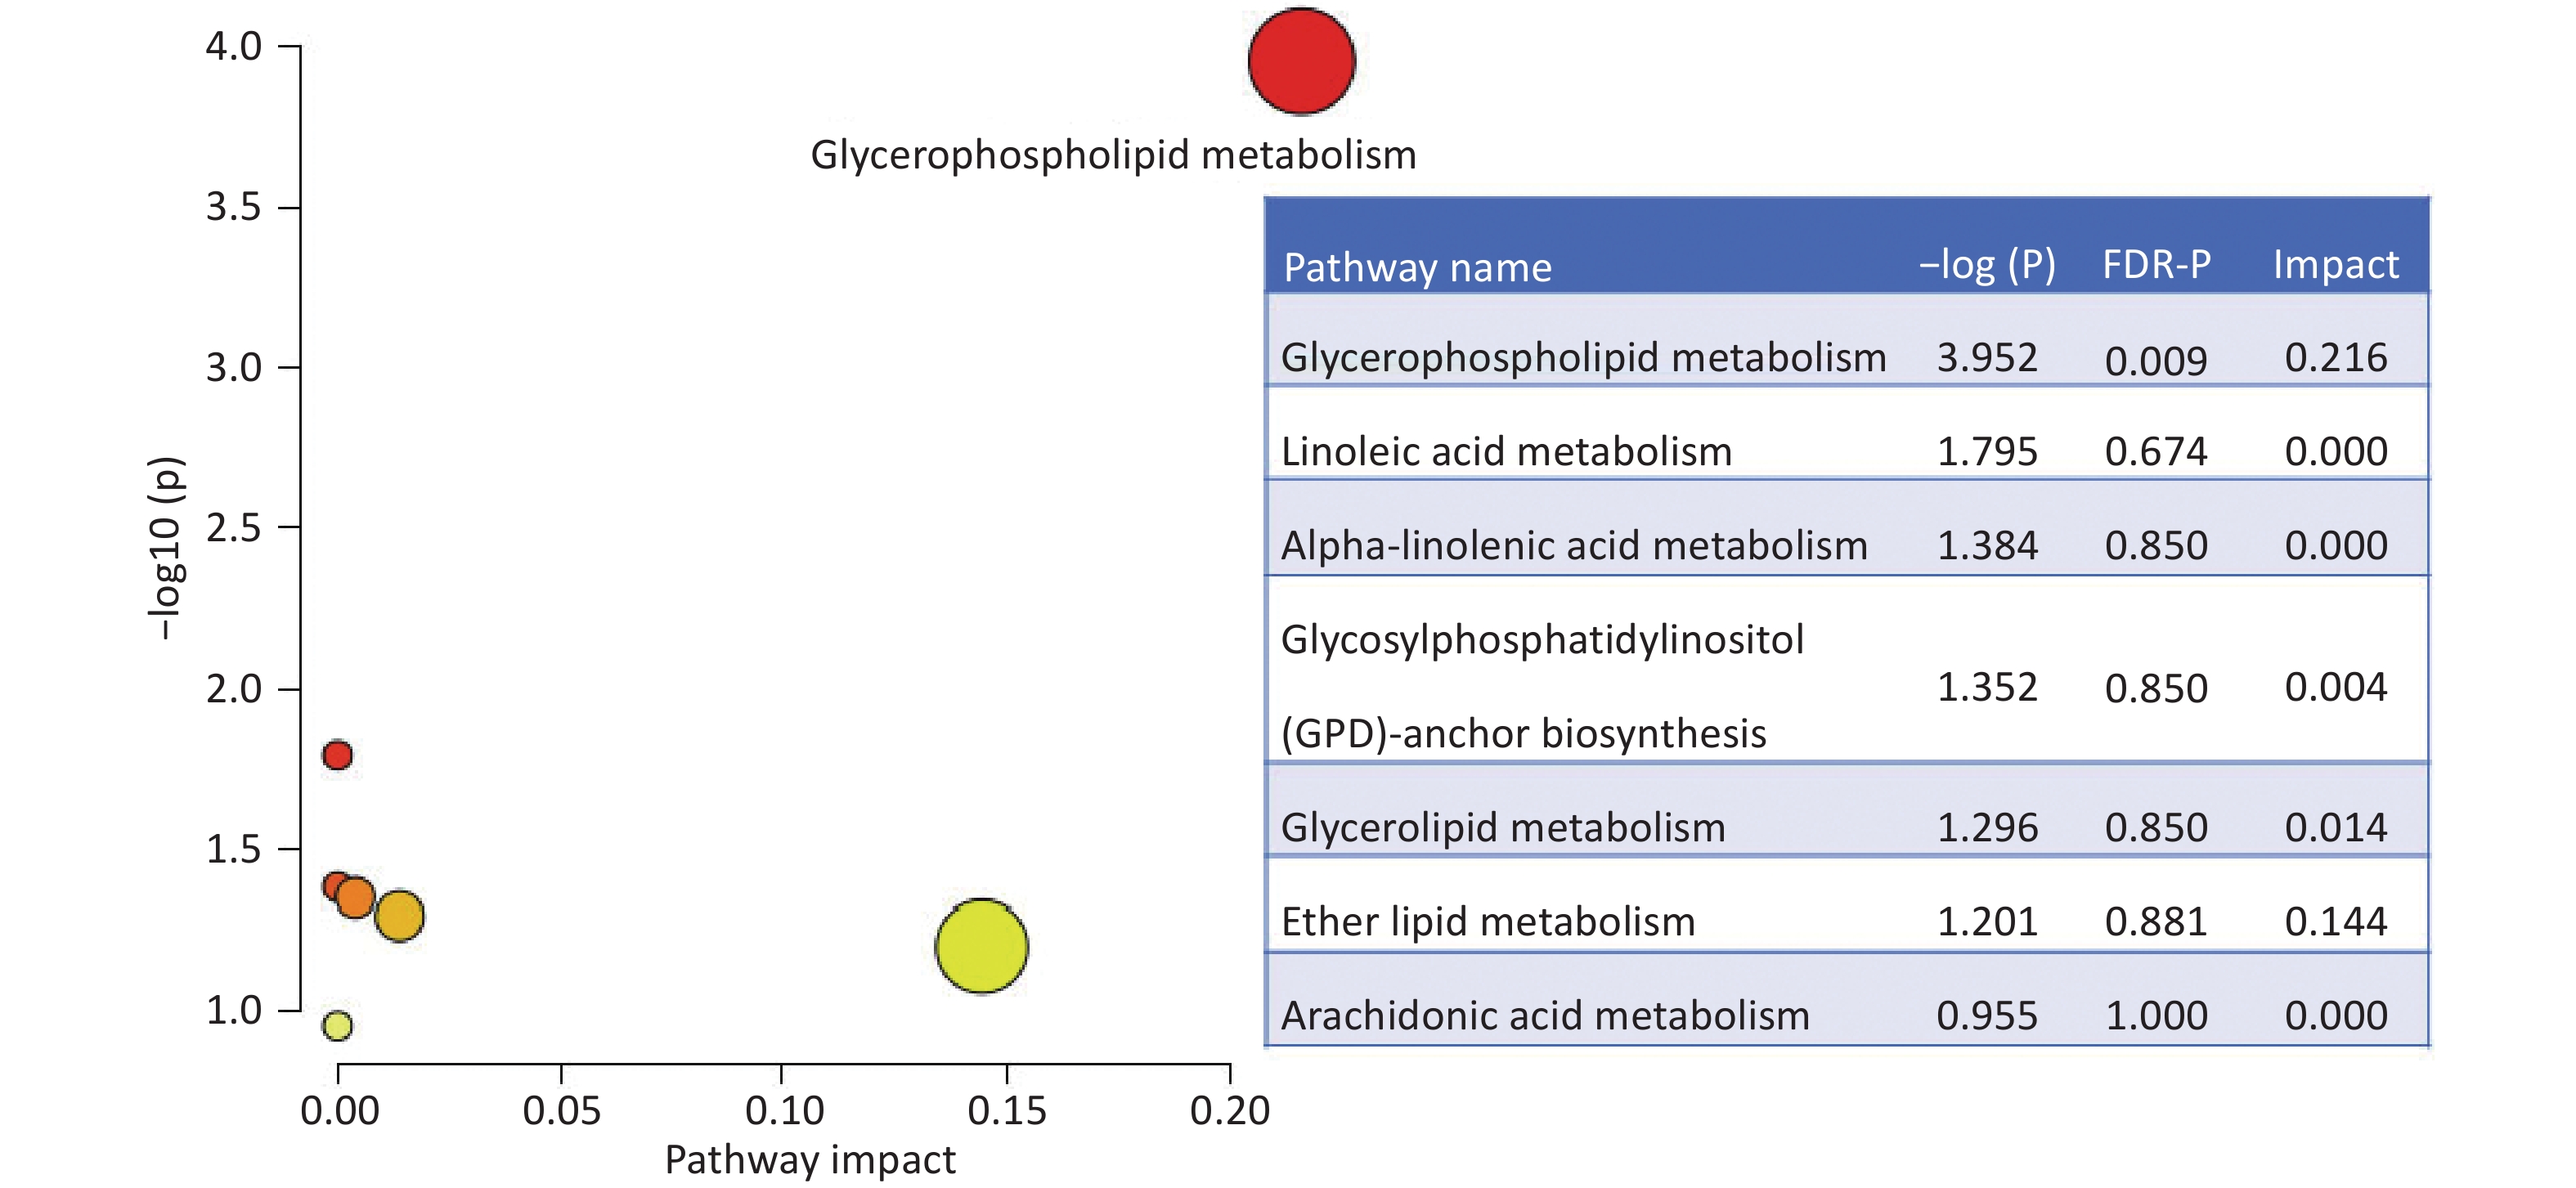
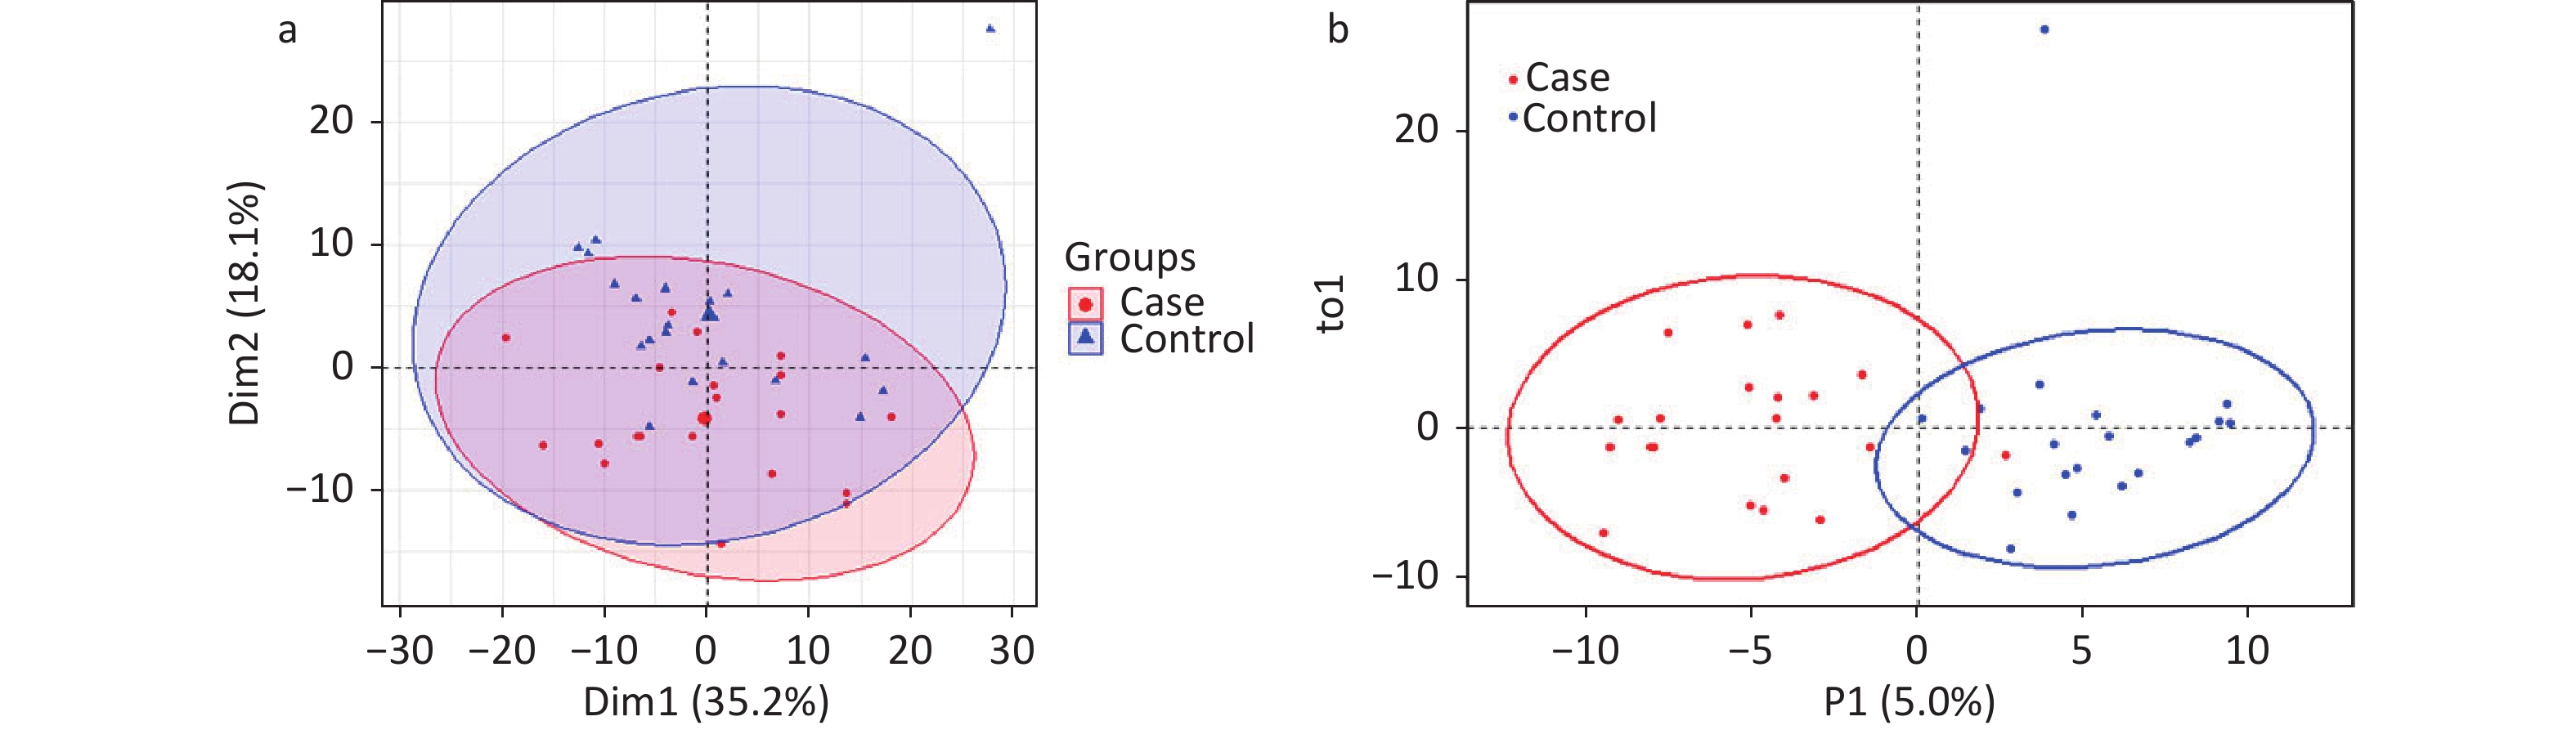
A total of 294 assayed lipid molecules were included in the analysis. Based on these molecules, the score scatter plot of the PCA model showed that all samples, including the QC samples (Supplementary Figure S1), were within Hotelling’s T-squared ellipse at a 95% confidence interval (CI), suggesting acceptable quality of lipidomics analysis (Figure 1A). The score scatter plot of the OPLS-DA model showed that patients with IS and healthy controls were clearly separated (Figure 1B). The VIP values and parameters of group differences, including fold change, raw P values, and FDR-adjusted P values estimated for all lipid molecules, are shown in a volcano plot (Figure 2) and Supplementary Table S1. A total of 56 lipid molecules with both an FDR-adjusted P value less than 0.05 and a VIP greater than 1.0 were identified (Table 2). Of these, three molecules showed increased levels and 53 showed decreased levels in patients with IS compared to healthy controls. These differentially expressed lipid molecules were significantly enriched in the glycerophospholipid metabolism pathway (FDR-adjusted P = 0.009, impact score = 0.216; Figure 3).
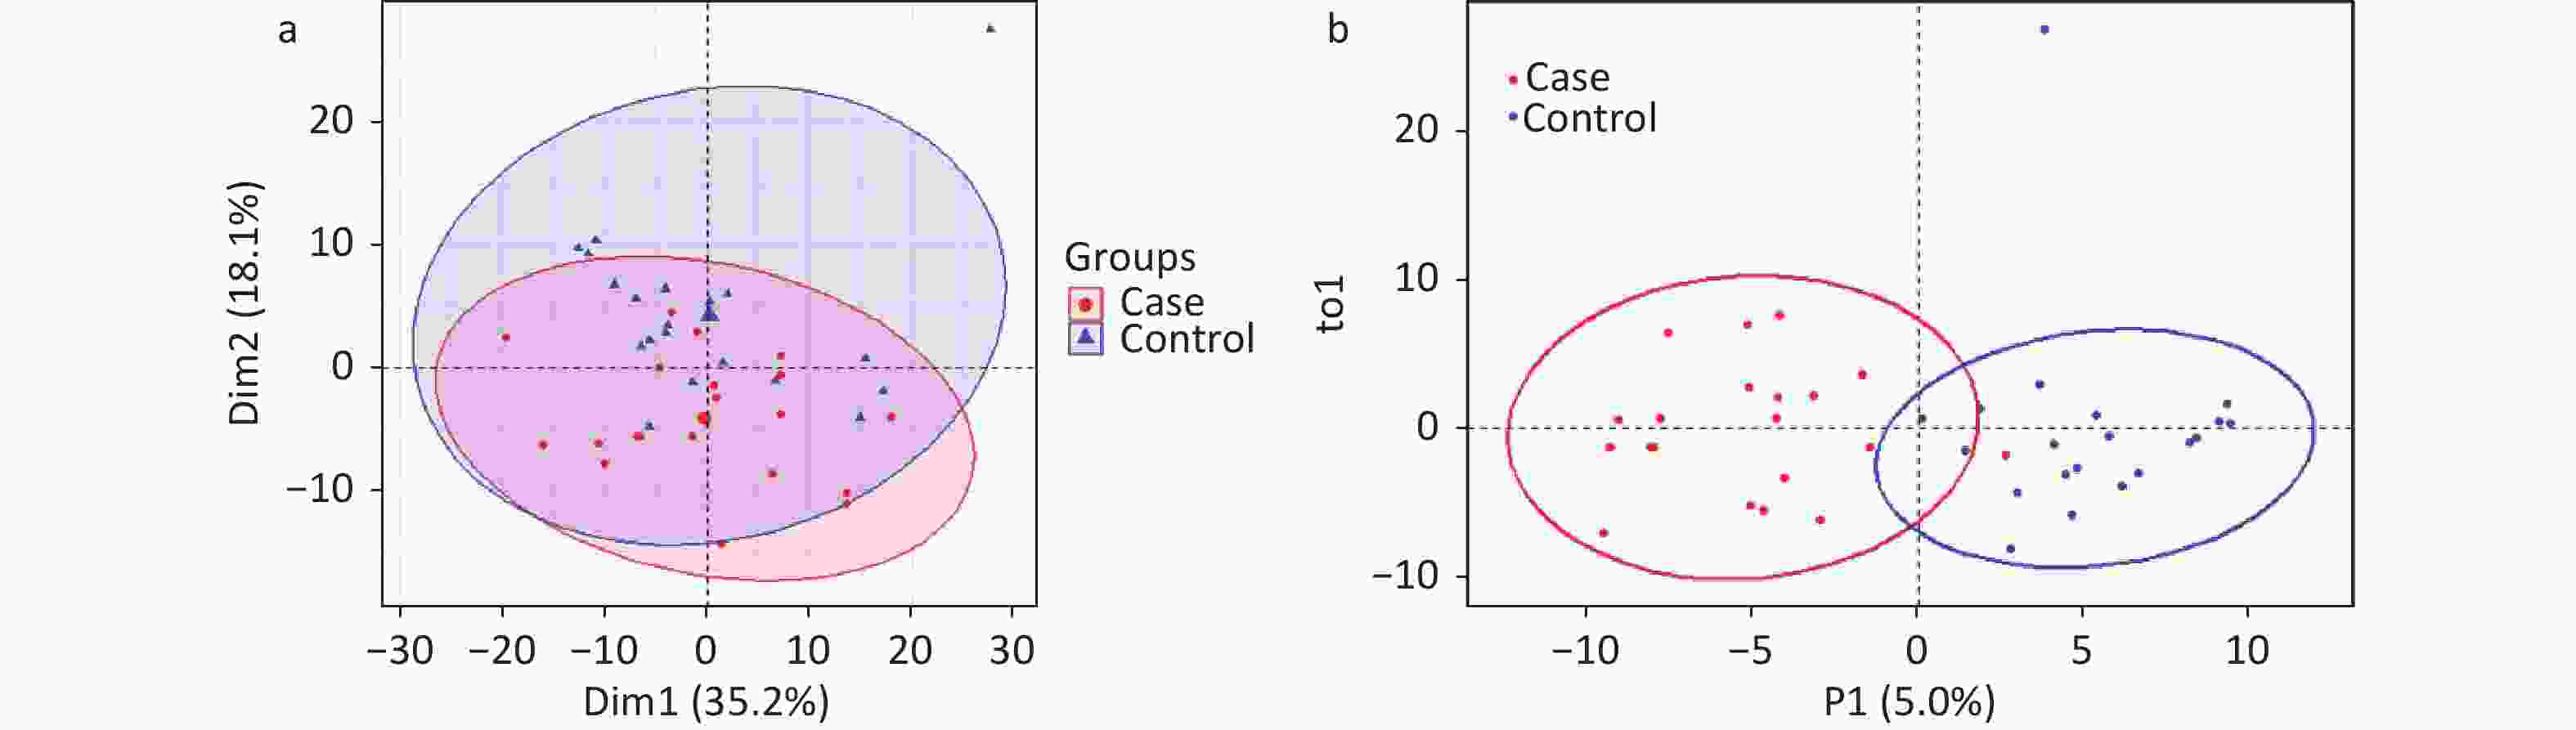
Figure 1. Score scatter plots of PCA and OPLS-DA models for patients with IS and healthy controls. PCA plot (A) shows that all samples were within Hotelling’s T-squared ellipse at a 95% confidence interval. The OPLS-DA plot (B) shows that the IS cases and healthy controls were clearly separated. Blue dots or triangles represent healthy controls, and red dots represent patients with IS. The OPLS-DA model showed good validation, as suggested by R2Y=0.767 and Q2=0.627. IS, ischemic stroke; PCA, principal component analysis; OPLS-DA, orthogonal partial least squares discriminant analysis.
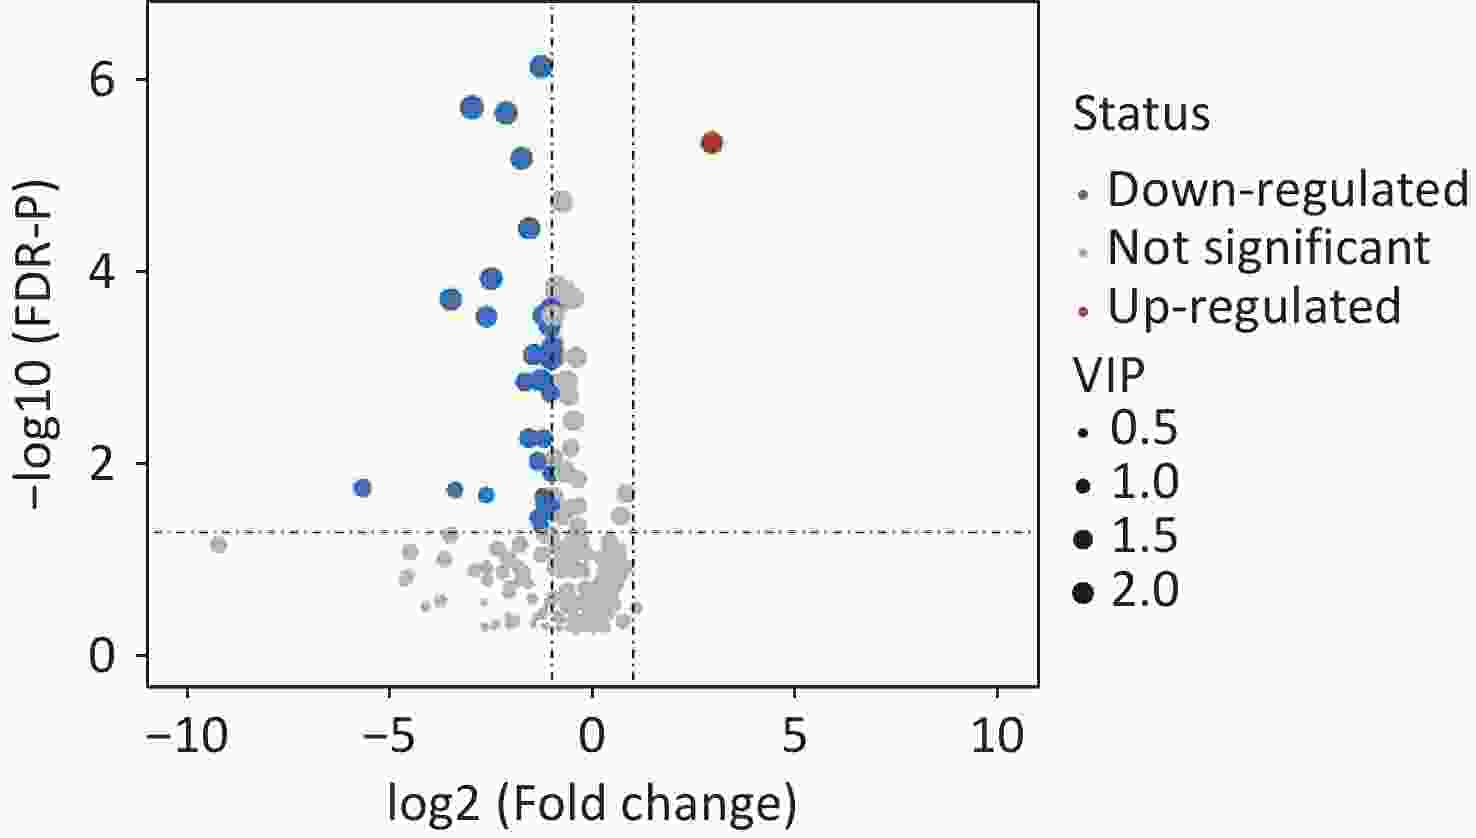
Figure 2. Volcano plot showing the group differences in lipid molecules assayed between IS cases and healthy controls. Dots represent the group comparison results for lipid molecules, with significantly upregulated lipids in red, significantly downregulated lipids in blue, and non-significantly different lipids in gray. The areas of the dots indicate the VIP of the corresponding lipid molecules. VIP, variable influences in projection.
Lipid molecules Fold change Raw-P FDR-P VIP Phosphatidylcholine PC (14:0/0:0) 0.391 0.002 0.009 1.377 PC (15:0/0:0) 0.163 0.000 0.000 1.886 PC (16:1/0:0) 0.513 0.000 0.001 1.855 PC (16:0/0:0) 0.539 0.000 0.001 2.011 PC (17:1/0:0) 0.297 0.000 0.000 2.222 PC (17:0/0:0) 0.336 0.001 0.005 1.555 PC (18:2/0:0) 0.538 0.000 0.000 2.158 PC (18:0/0:0) 0.481 0.000 0.000 2.057 PC (19:0/0:0) 0.127 0.000 0.000 2.417 PC (20:5/0:0) 0.512 0.007 0.021 1.465 PC (20:3/0:0) 0.442 0.009 0.026 1.373 PC (20:0/0:0) 0.228 0.000 0.000 2.345 PC (22:6/0:0) 0.640 0.010 0.029 1.527 PC (22:0/0:0) 0.089 0.000 0.000 2.104 PC (24:0/0:0) 0.177 0.000 0.000 2.218 PC (26:0/0:0) 0.020 0.005 0.017 1.300 PC (20:1/0:0) 0.505 0.000 0.000 1.971 PC (22:5/9:0) 0.480 0.000 0.002 1.411 PC (18:0/16:0) 0.594 0.013 0.035 1.126 PC (18:0/18:2) 0.784 0.017 0.042 1.155 PC (P-18:0/2:0) 7.640 0.000 0.000 2.041 PC (P-18:0/14:1) 0.536 0.000 0.000 2.009 PC (P-18:0/15:1) 0.315 0.000 0.001 1.430 PC (P-16:0/18:4) 0.447 0.000 0.000 2.009 PC (P-16:0/18:3) 0.364 0.000 0.001 1.844 PC (P-16:0/18:2) 0.577 0.000 0.000 1.996 PC (P-20:0/14:0) 0.415 0.000 0.000 2.239 PC (P-18:0/17:2) 0.488 0.000 0.000 1.808 PC (P-18:0/18:4) 0.610 0.003 0.011 1.679 PC (P-18:0/18:2) 0.636 0.000 0.000 1.775 PC (P-20:0/16:1) 0.505 0.000 0.001 1.561 PC (P-20:0/16:0) 0.436 0.001 0.005 1.406 PC (P-16:0/22:6) 0.661 0.000 0.002 1.860 PC (P-18:0/20:5) 0.720 0.001 0.003 1.843 PC (P-18:0/22:6) 0.917 0.009 0.027 1.258 PC (P-20:0/20:5) 0.776 0.002 0.007 1.346 PC (P-20:0/22:2) 0.490 0.010 0.027 1.250 PC (O-18:2/0:0) 0.436 0.000 0.000 2.189 PC (O-18:0/0:0) 0.492 0.000 0.001 2.093 PC (O-22:1/0:0) 0.505 0.000 0.000 2.075 PC (O-22:0/0:0) 0.647 0.000 0.001 1.932 Phosphatidylethanolamine PE (18:0/0:0) 0.610 0.003 0.012 1.640 PE (P-18:0/0:0) 0.413 0.000 0.001 2.007 PE (P-20:0/0:0) 0.497 0.000 0.001 2.137 PE (20:2/18:2) 0.338 0.000 0.000 2.117 Phosphatidylglycerol PG (22:5/18:1) 0.162 0.007 0.021 1.039 Phosphatidylserine PS (19:0/0:0) 0.590 0.000 0.000 2.213 Sphingosine Sphingosine (18:0) 0.718 0.000 0.000 2.044 Sphingosine (20:0) 0.754 0.000 0.001 1.888 Sphingomyelin SM (d17:1/26:1) 0.517 0.002 0.008 1.224 SM (d17:0/26:1) 0.391 0.000 0.001 1.617 Hexosylceramides HexCer (d18:1/16:0) 0.769 0.004 0.014 1.286 HexCer (d18:1/20:0) 0.095 0.006 0.018 1.028 HexCer (d18:1/22:0) 0.491 0.003 0.012 1.131 Triacylglycerol TG (18:1/18:2/20:4) 1.612 0.013 0.034 1.480 TG (18:1/18:1/20:4) 1.762 0.006 0.020 1.544 Note. IS: ischemic stroke; FDR: false discovery rate; VIP: variable influences in projection. Table 2. Differential lipid molecules between cases with IS and healthy controls
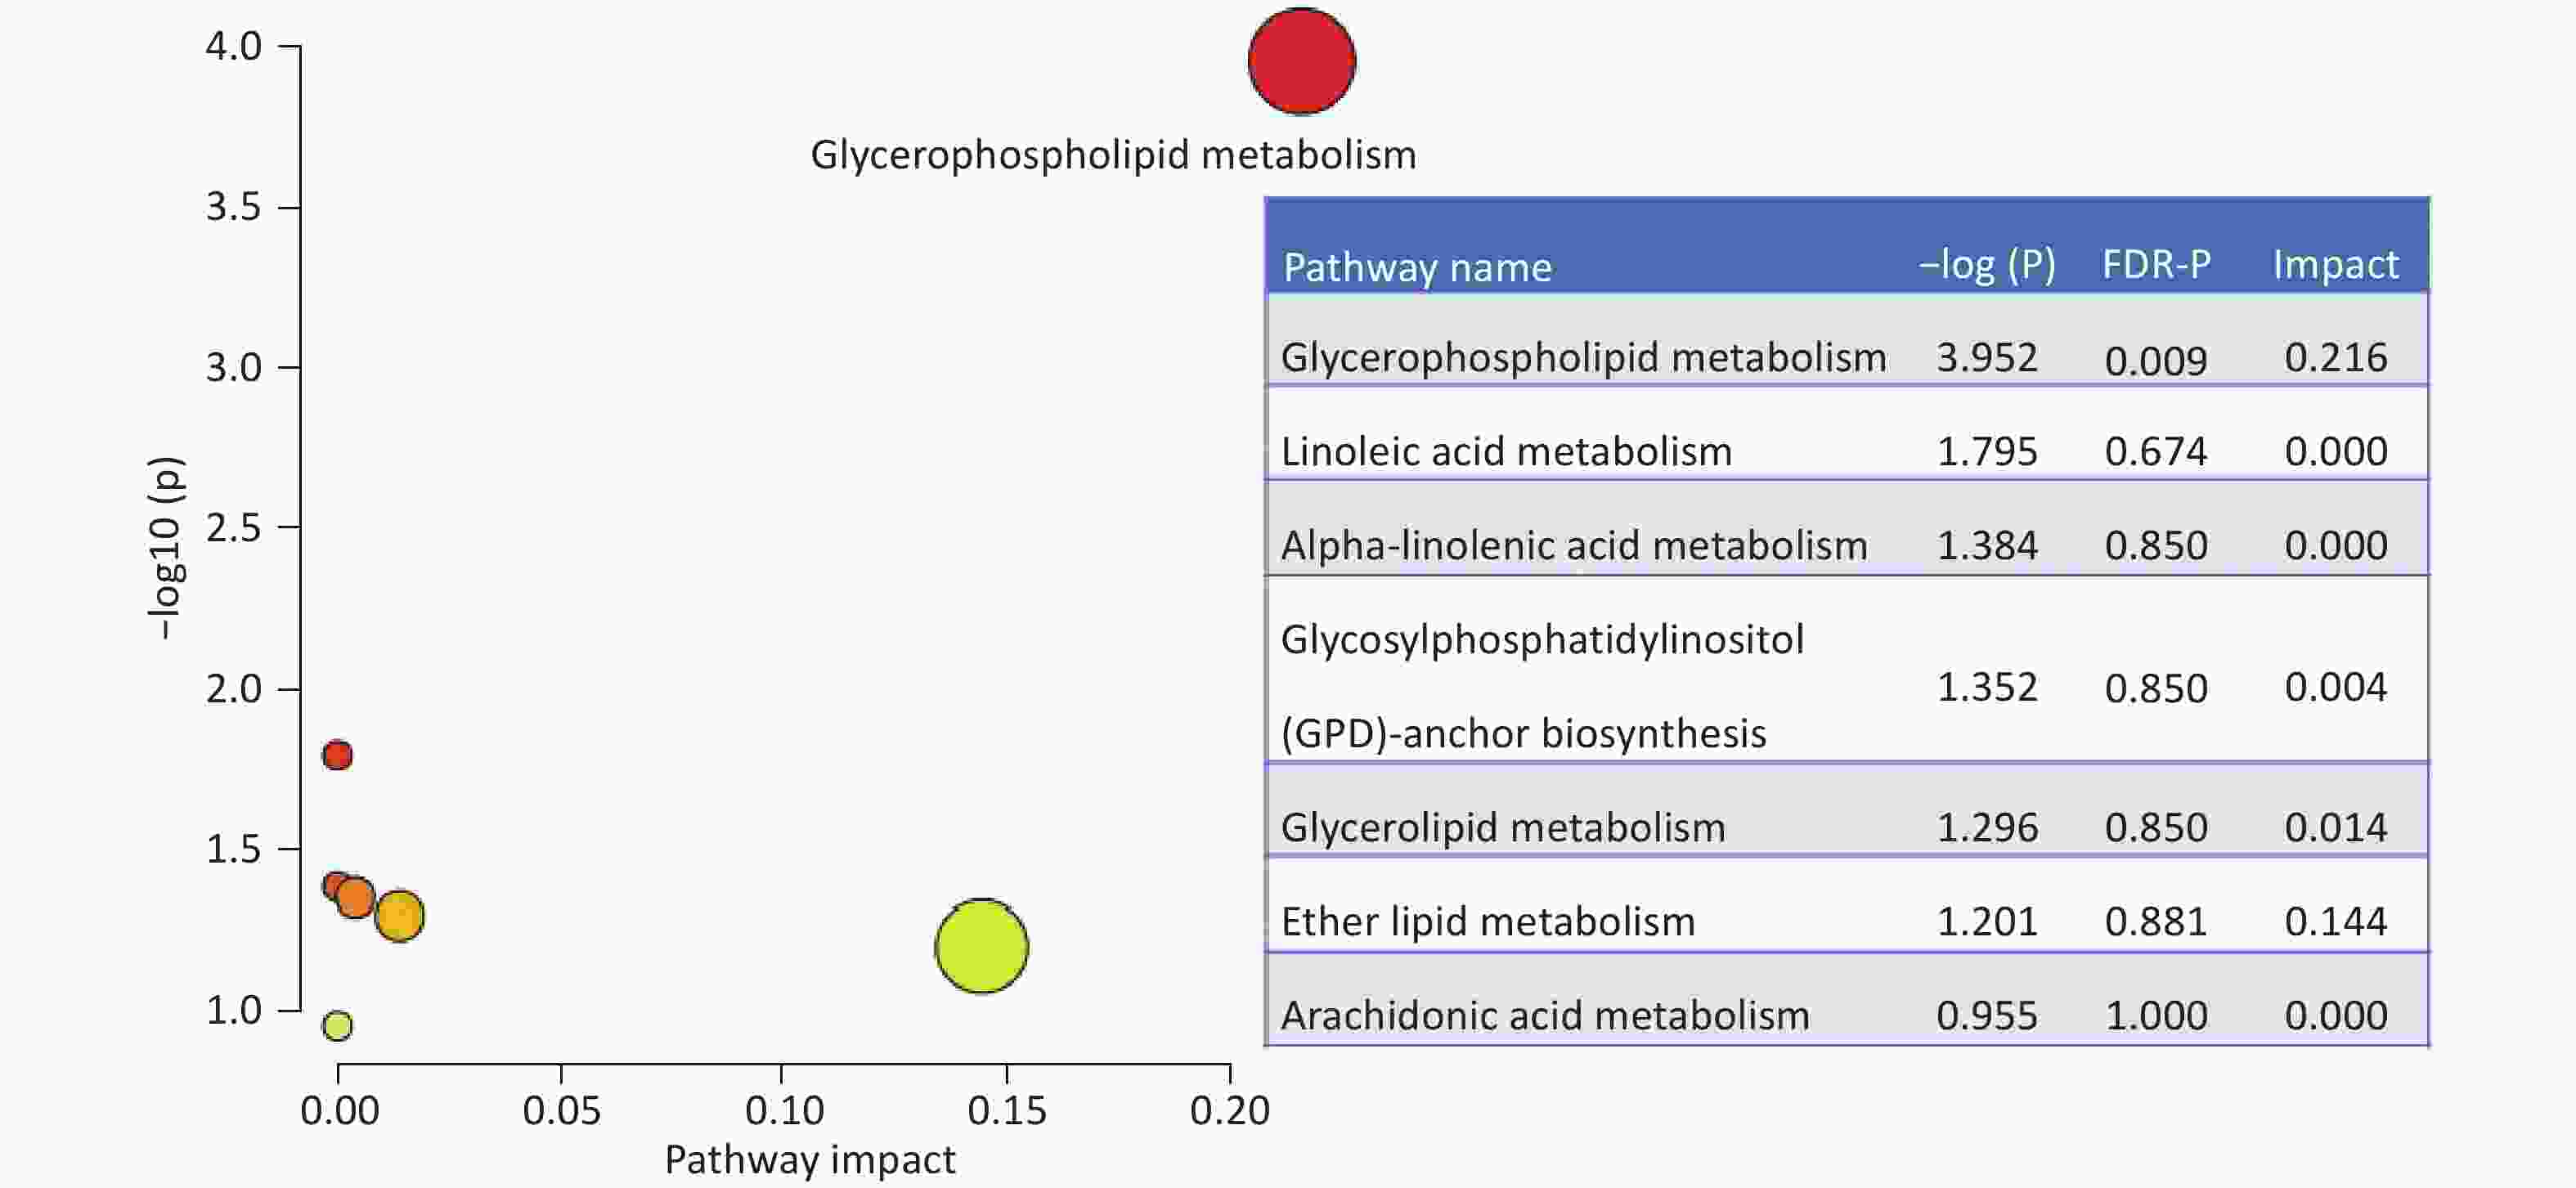
Figure 3. Enriched pathways based on the differential lipid molecules. The impact and statistical P values for the pathways are proportional to node radius and color, respectively. Only glycerophospholipid metabolism showed statistical significance an FDR-P =0.009 and impact =0.216. FDR: false discovery rate.
-
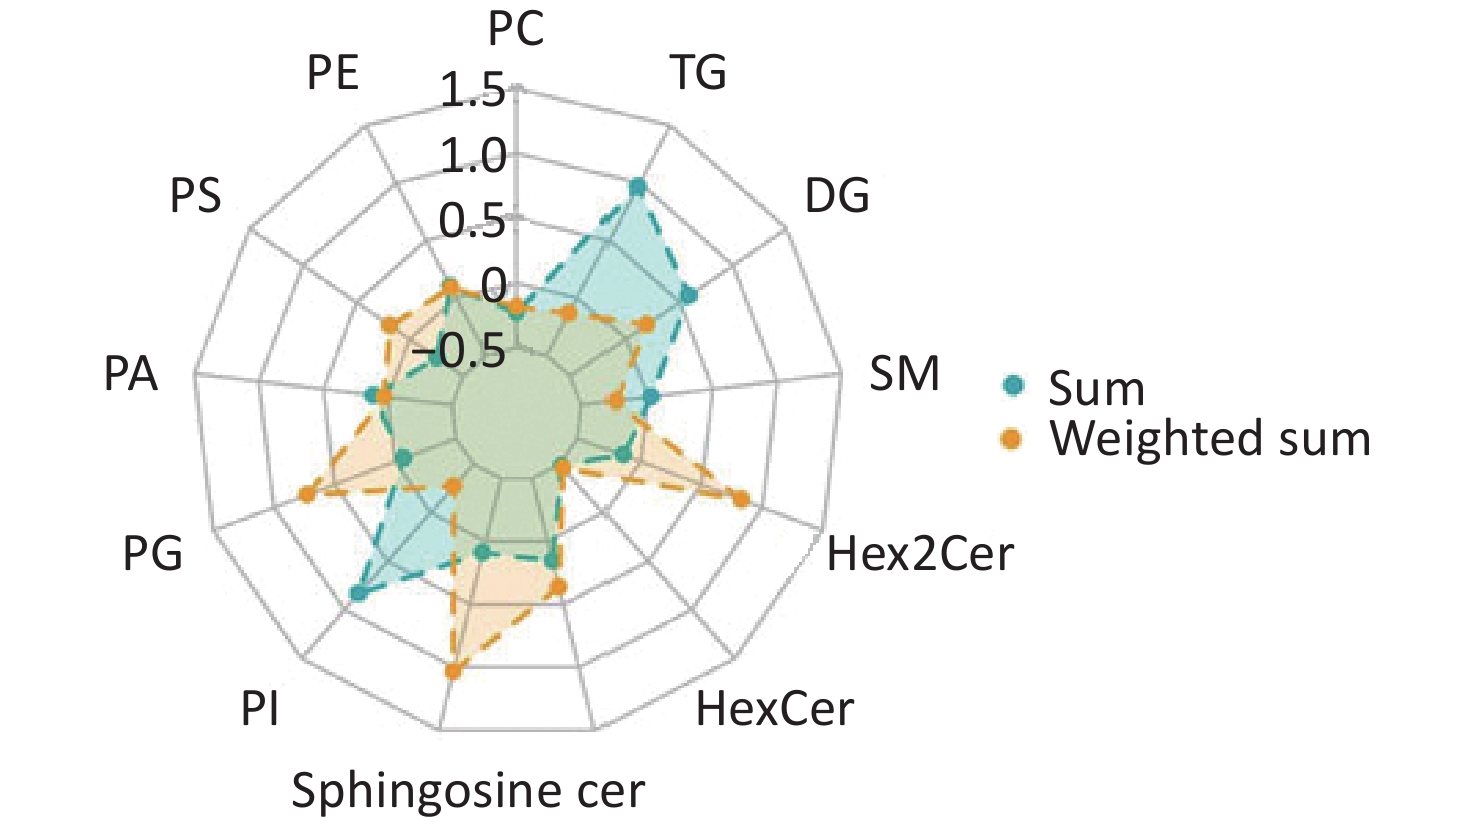
Comparisons of total lipid levels within specific lipid classes revealed that four of the 13 lipid species assayed were significantly decreased in patients with IS (Figure 4, Supplementary Table S2). They are phosphatidylcholine (PC, relative difference = –22%, P < 0.001), phosphatidylserine (PS, relative difference = –26%, P < 0.001), hexosylceramide (HexCer, relative difference = –27%, P = 0.005), and dihexosylceramide (Hex2Cer, relative difference = –14%, P = 0.038). Considering the effect of the chemical structure by calculating the weighted sum of the number of carbon atoms and double bonds, the group difference in PC was still significant (relative difference = –18%, P = 0.007). Phosphatidylinositol (PI, relative difference = –27%, P = 0.005), sphingomyeline (SM, relative difference = –24%, P < 0.001), and triacylglycerol (TG, relative difference = –13%, P = 0.045) were additionally identified to be decreased in patients with IS, compared with healthy controls.
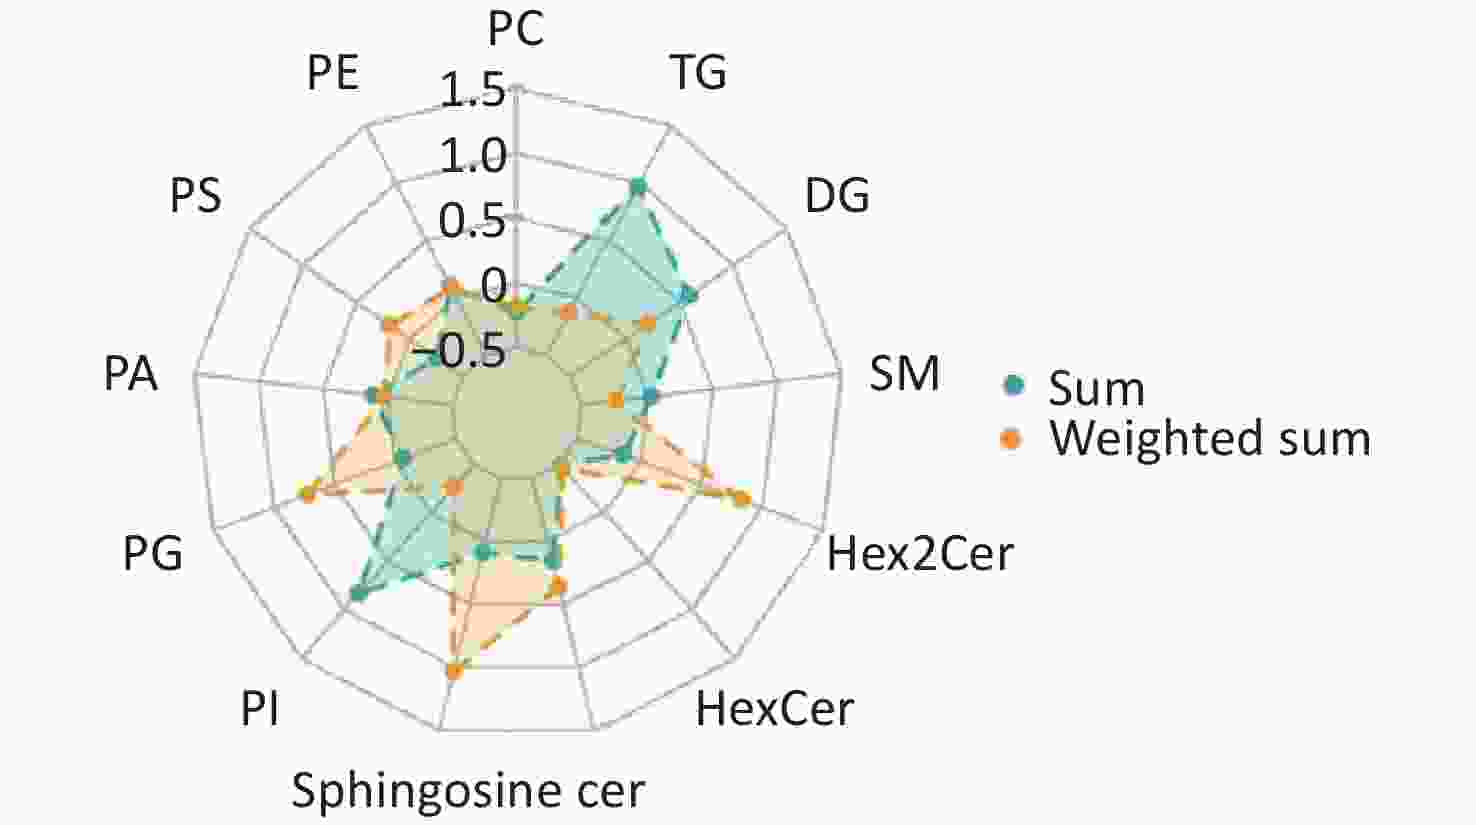
Figure 4. Radar chart showing the group-differences in lipid species between IS cases and healthy controls. The levels of each lipid species were calculated using the summed and weighted summed concentrations of lipid molecules. The relative differences are presented in the charts below. PC: Phosphatidylcholine; PE: phosphatidylethanolamine; PS: phosphatidylserine; PA: phosphatidic acid; PG: phosphatidylglycerol; PI: phosphatidylinositol; Cer: ceramide; SM: sphingomyelin; DG: diacylglycerol; TG: triacylglycerol; HexCer: hexosylceramide; Hex2Cer = DiHexosylceramide.
-
Further adjustments for age, sex, cigarette smoking, alcohol consumption, hypertension, diabetes, and hyperlipidemia did not significantly alter the results. Specifically, 44 of the 56 differential lipids identified above were still significantly associated with IS, even after correction for multiple tests (all FDR-P < 0.05; Supplementary Table S3). PC (P = 0.022), PS (P = 0.009), Hex2Cer (P = 0.040), and SM (P = 0.009) were still significantly associated with IS (Supplementary Table S4).
-
In this case-control study, we reported, for the first time, plasma lipidomic profiles related to IS in Chinese adults, who suffer the highest burden of stroke worldwide. A total of 56 lipid metabolites were identified to be associated with IS, which may participate in the development of this debilitating disorder. These lipids are enriched in glycerophospholipid metabolism, suggesting a potential mechanism underlying IS pathogenesis. Most IS-related lipids identified were phosphatidylcholines, and lipid species, including phosphatidylcholine and phosphatidylserine, were significantly associated with IS. Our study provides initial evidence that lipidomic profiling could be a useful approach for identifying novel biomarkers and risk factors for IS.
In line with our findings, a potential role for phosphatidylcholine in the development of IS has also been suggested by prior studies. For example, a lipidomic study found that phosphatidylcholine levels decreased in rats with IS[17]. A metabolomic study that included 40 patients with IS and 40 healthy controls found that PC(5:0/5:0) was significantly decreased in patients with IS[18]. These consistent findings, including ours, suggest that phosphatidylcholines and their metabolic pathways are potential therapeutic targets for IS. However, the underlying mechanism remains to be elucidated. The glycerophospholipid metabolism identified in our study is likely one of the metabolic pathways linking phosphatidylcholines with IS. Glycerophospholipid are the most abundant structural component in cell membrane, and greatly affect the stability and permeability of the cell membrane[19,20]. In addition, they play important roles in signal induction and ion and substance transportation[21]. Thus, changes in glycerophospholipid composition, stimulation of glycerophospholipid-degrading enzymes, and inhibition of acyltransferase activity have been observed in acute brain diseases such as ischemia, hypoxia, hypoglycemia, and spinal cord and brain injury[22,23]. Glycerophospholipids can degrade and release polyunsaturated fatty acids in the brain such as docosahexaenoic acid and arachidonic acid, which are closely related to the neuronal pathways of stroke. Therefore, glycerophospholipid metabolism may be a potential therapeutic target in stroke. However, whether the key metabolites involved in this pathway are risk factors for stroke remains unclear.
The objective of this study was to generate hypotheses for the identification of new biomarkers and risk factors for IS. We did not discuss the lipid molecules that differed between IS patients and healthy controls, but some analytical approaches used in our study are notable. Due to a common chemical structure and similar biological roles for molecules in a specific lipid species, we used the summed concentrations of all molecules to represent the level of their constituent lipid species and then examined the associations between the lipid species and IS. We found that phosphatidylcholine and phosphatidylserine lipid species were significantly associated with IS. Such an analytical approach may help identify possible classes of lipids that could be candidate markers for IS. Furthermore, chemical structures such as the number of carbon atoms and double bonds have been associated with cardiovascular disease[16]. The summed concentrations did not account for the differences in the chemical structures. Therefore, we calculated the summed concentrations, weighted by the number of carbon atoms and double bonds, using the following formula: lipid concentration × no. of carbon atoms × (no. of double bonds + 1). Although using the weighted sum did not reveal more lipid species associated with IS, this method can be used in lipidomics studies.
Although the sample size was limited, novel analytical approaches were used to comprehensively examine the differences between IS cases and their comparable controls. This study has some limitations. First, this was a case-control study, and the relatively small sample size may have limited the generalizability of the results. Further studies are required to confirm these findings. Second, our analysis was based on observational data; although primary potential confounders were adjusted for, residual confounders may still play a role in the observed association. For example, the influence of smoking status on biomarkers cannot be ruled out because smoking status has significant group differences.
In conclusion, our case-control study using a lipidomics approach revealed many lipid molecules that differed between patients with IS and healthy controls. Glycerophospholipid metabolism may participate in the development of IS and related lipid molecules may be potential biomarkers of IS. These results provide initial evidence that lipid molecules and their related metabolites may serve as new biomarkers and potential therapeutic targets for IS. Further studies with larger sample sizes and more robust designs are warranted to identify novel lipid biomarkers of IS.
Serum Lipidomics Profiling to Identify Potential Biomarkers of Ischemic Stroke: A Pilot Study in Chinese adults
doi: 10.3967/bes2025.095
- Received Date: 2024-12-17
- Accepted Date: 2025-04-09
-
Key words:
- Ischemic stroke /
- Lipidomics /
- Lipids /
- Case-control study
Abstract:
None of the authors has financial associations that might pose a conflict of interest in connection with the submitted article.
The study protocols were approved by the Ethics Committee of Soochow University (Approval No. 2007IRB1) and performed in accordance with the Declaration of Helsinki. Written informed consent was obtained from all participants.
&These authors contributed equally to this work.
| Citation: | Jijun Shi, Zujiao Nie, Shuyao Wang, Hao Zhang, Xinwei Li, Jialing Yao, Yibing Jin, Xiangdong Yang, Xueyang Zhang, Mingzhi Zhang, Hao Peng. Serum Lipidomics Profiling to Identify Potential Biomarkers of Ischemic Stroke: A Pilot Study in Chinese adults[J]. Biomedical and Environmental Sciences. doi: 10.3967/bes2025.095

|

 Quick Links
 DownLoad: