
-
Healthy Life Expectancy (HLE) measures both the length and quality of life of the population[1]. This serves as an indicator of the health status of populations of specific ages. In the 1970s, Sullivan proposed combining the mortality and disability rates to calculate a health index. This method was later formally named the Sullivan Method and has gained widespread adoption and application in academic circles. HLE provides the average number of years a population can live in full health and serves as a vital tool for assessing health quality. China is currently experiencing accelerated population aging and a growing burden of chronic diseases. The HLE was incorporated into the “Healthy China 2030” Planning Outline and the National Health Plan for the 14th Five-Year Plan Period, establishing it as a key indicator for guiding public health policy formulation.
China has a large elderly population. Socioeconomic development levels and distribution of health resources vary across regions. This has led to marked disparities in the HLE across different areas. Jiangxi Province, a typical central province in China, faces two major challenges: accelerated population aging and uneven distribution of healthcare resources. According to data from the Seventh National Population Census, the proportion of residents aged 60 years and older in Jiangxi Province has reached 16.87%, signaling an accelerating pace of aging. Therefore, relying solely on life expectancy is insufficient to comprehensively capture the overall health status of the older population. This highlights the urgent need for more refined and multidimensional HLE measurements to inform regional health policies. Most existing studies employ a single health indicator to calculate HLE, which fails to adequately reflect the multidimensional nature of health. To address this gap, this study uses Jiangxi Province as a case study and, based on the Sullivan method, adopts four health measures to systematically estimate and compare healthy life expectancy among the older population in the region.
This study used data from the Seventh National Health Service Survey conducted in 2023 and selected a sample from the Jiangxi Province. The survey employed a stratified multistage probability sampling method covering 60 villages (neighborhood committees) across six counties (cities and districts), with 3,600 households (8,909 individuals) surveyed. This study focused on individuals aged 60 years and older, including 3,053 participants. Among them, males accounted for 48.67% were men, and 51.33% were women.
The 2023 Jiangxi Province life expectancy tables used in this study were derived from our team's prior research[2]. This study utilized data from the Global Burden of Disease database, Jiangxi Province census records, and Jiangxi Statistical Yearbook to construct a linear mixed-effects model. This model estimated the under-five and adult mortality probabilities in Jiangxi Province from 2000 to 2022. Subsequently, these predicted values were input into the constructed “China Relational Model Life Table System” to project the 2023 life tables for Jiangxi Province.
The Activities of Daily Living (ADL) scale assesses six self-care abilities: bathing, dressing, toileting, indoor mobility, continence, and feeding. Individuals who perform all six activities independently are classified as healthy. The EuroQol Five-Dimensional Questionnaire (EQ-5D-5L) comprises five dimensions: mobility, self-care, usual activities, pain/discomfort, and anxiety/depression. The responses were converted into utility values using the Chinese population-specific value set[3], with one representing full health. The Global Activity Limitation Indicator (GALI) asks: “For at least the past 6 months, have you been limited in your daily activities because of a health problem?” A response of “no limitation” was considered as having no long-term activity limitation. Self-rated health (SRH) was measured using a 0–100 visual analogue scale (VAS), with a score of ≥ 60 defined as the cut-off for good health.
Chronic disease comorbidity status was based on self-reported physician-diagnosed conditions drawn from a list of common diseases (e.g., hypertension, diabetes, and heart disease). Individuals were categorized into three groups: no chronic disease, chronic disease, and multimorbidity (defined as two or more chronic conditions). Within each of the three comorbidity subgroups, four types of healthy life expectancy were calculated for the entire study population.
Based on life tables and employing the Sullivan method, the person-years lived in each age group of the population aged 60 and above were decomposed by applying health weights. For the EQ-5D-5L, age-specific mean utility values were used directly as weights to calculate quality-adjusted life expectancy (QALE). For ADL, SRH, and GALI, the proportions of individuals classified as healthy were used as weights to estimate the activity limitation-free life expectancy (ALE), self-rated healthy life expectancy (SRHLE), and disability-free life expectancy (DFLE), respectively. The four types of healthy life expectancy calculated in this study correspond to four distinct health dimensions—physical self-care, comprehensive health utility, subjective health assessment, and limitation in daily activities—reflecting different domains of health.
Data cleaning and computation were performed using R 4.4.1, while Microsoft Excel was used to implement the Sullivan method and output the results.
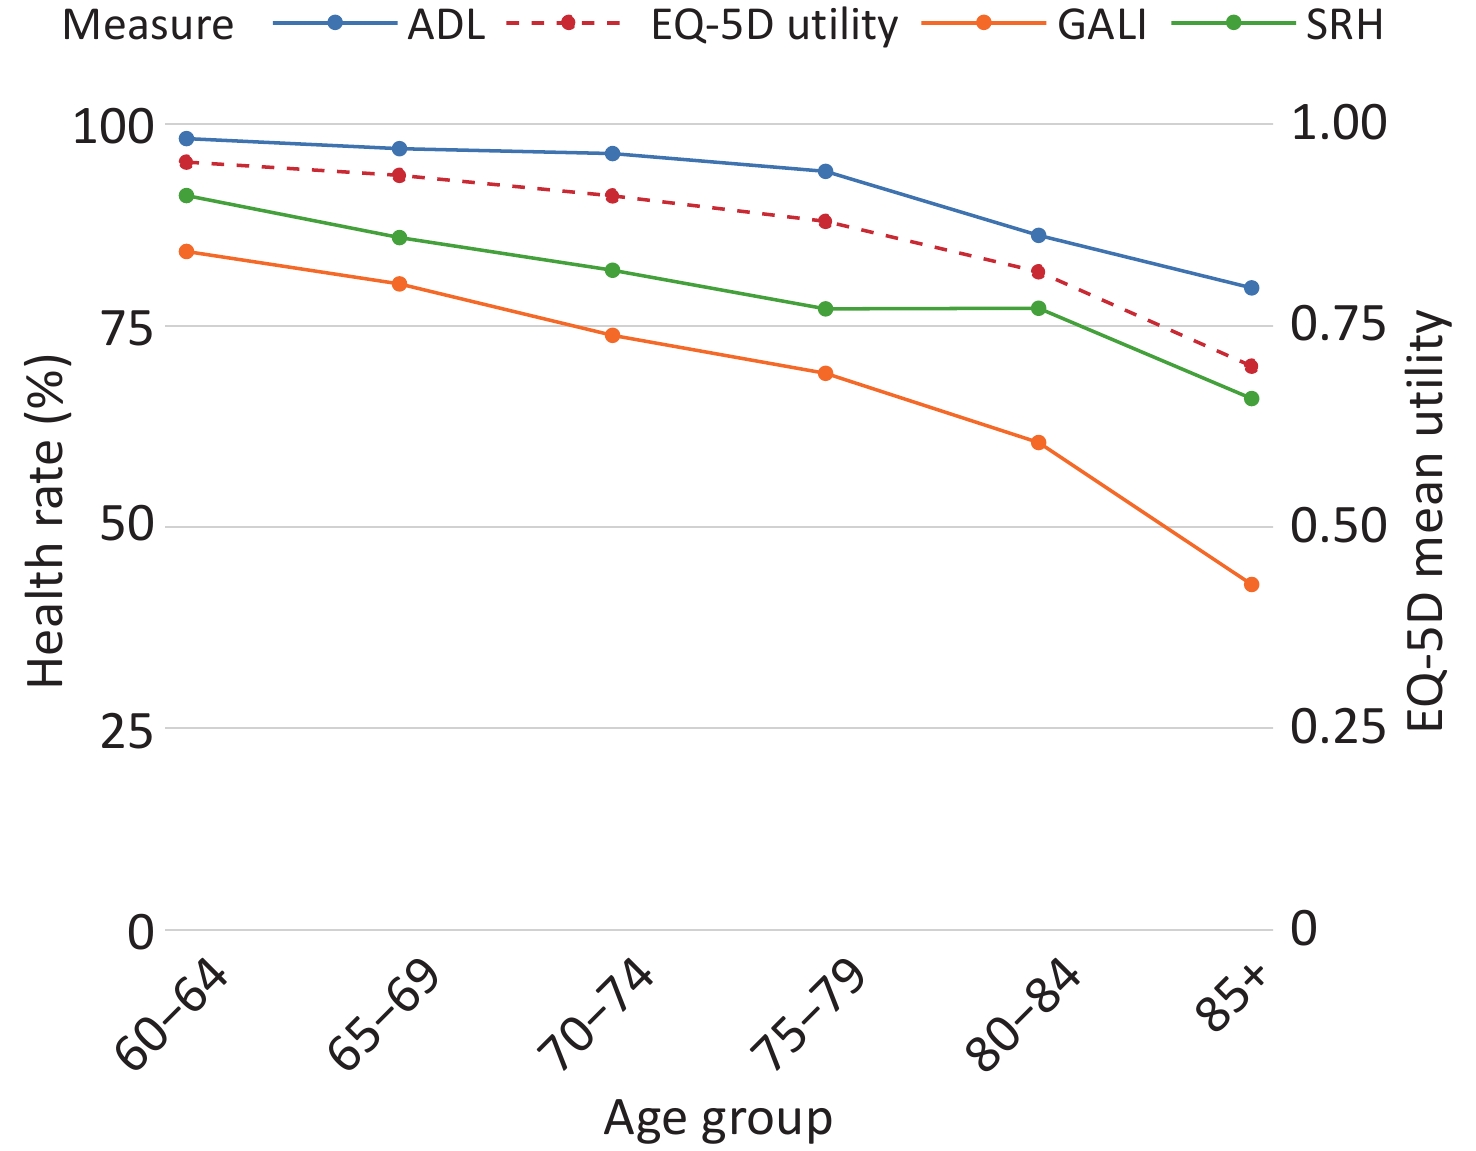
Health Status Changes with Age Figure 1 shows the age patterns of ADL healthy proportion, SRH healthy proportion, GALI healthy proportion, and EQ-5D-5L mean utility value. All four consistently declined with age, although the levels and patterns of decline varied. The ranking by health level remained stable: the ADL healthy proportion was the highest, followed by EQ-5D-5L utility, SRH healthy proportion, and GALI healthy proportion. These differences reflect the distinct definitions of health. ADL focuses on basic self-care with a high disability threshold, yielding the highest proportion. EQ-5D-5L covers pain and emotions, resulting in lower scores. GALI detects long-term activity limitations, capturing more chronic impairments; hence, it has the lowest proportion. SRH involves psychological adjustment, placing it between the others.All indicators declined gradually from the ages of 60 to 79 years. After 80 years of age, ADL, GALI, and EQ-5D-5L declined faster, with ADL and GALI declining the most steeply, indicating a marked loss in activity participation at advanced ages, This accelerated decline is likely attributable to disabling chronic diseases. According to the hallmarks of aging theory, these diseases increase physical strain and impair the functional capacity required for daily living[4]. The proportion of patients with SRH remained relatively stable between 75 and 84 years. This stability does not signify better objective health but rather a buffering effect: older adults adjust their health expectations, cushioning the subjective impact of functional decline.
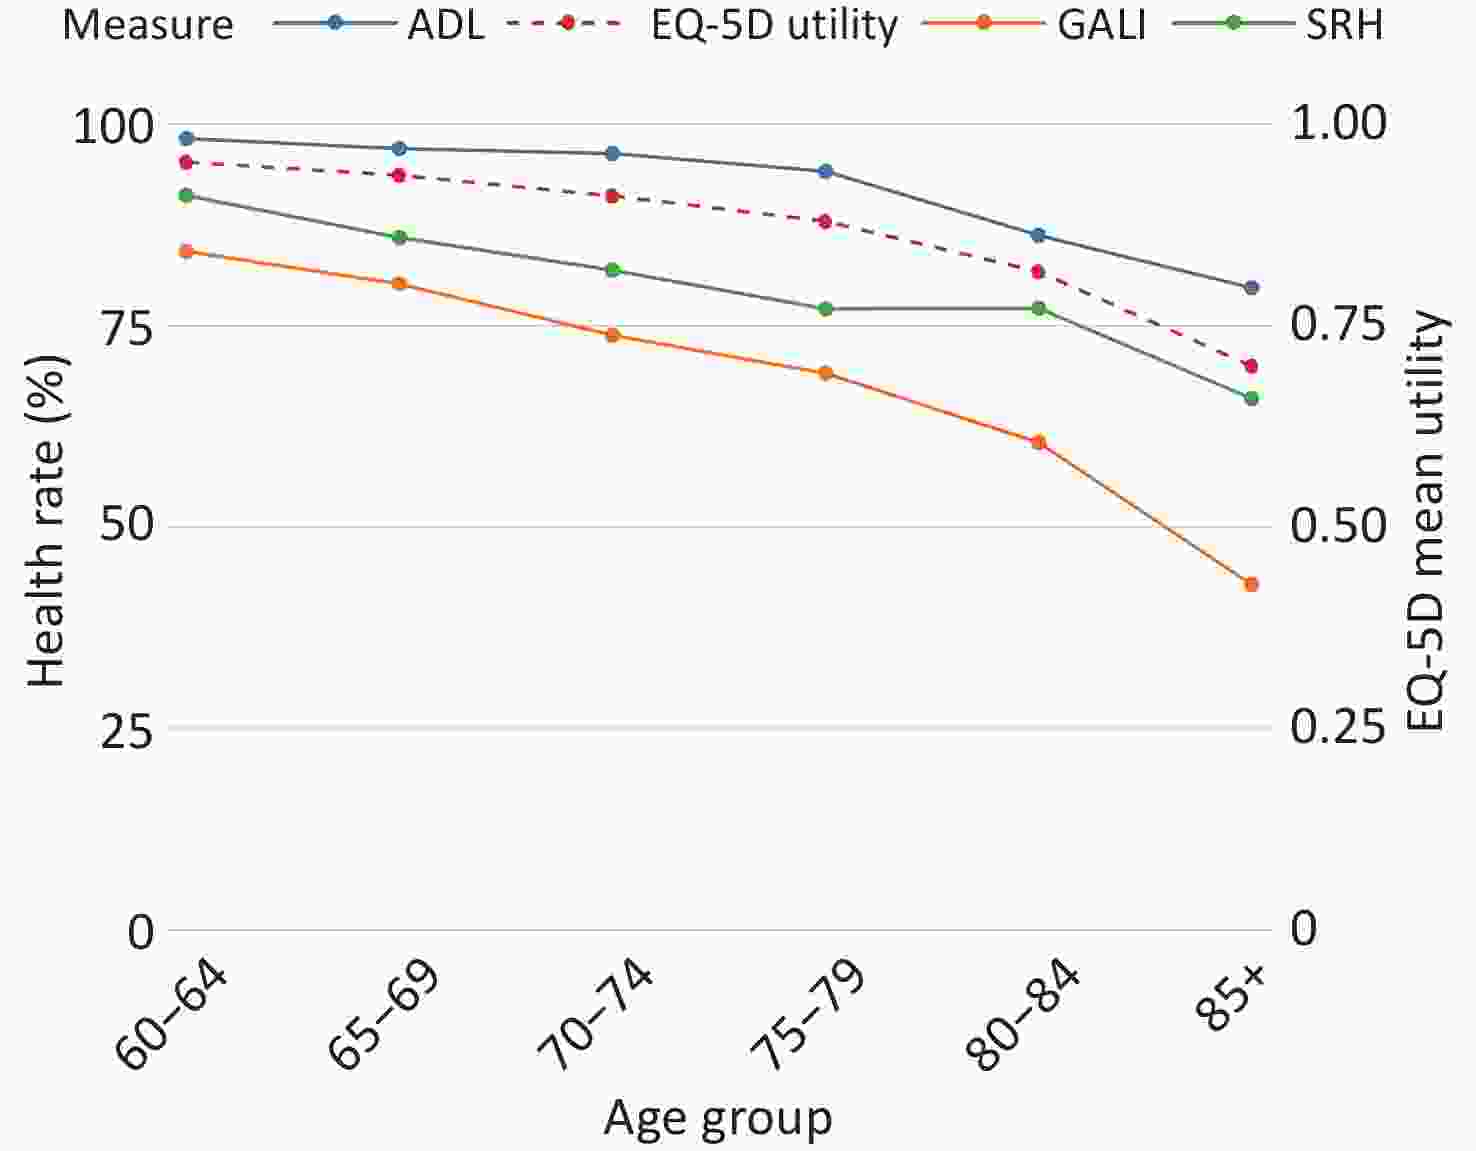
Figure 1. Age-specific trends in health indicators among adults aged 60 and older.
Levels, Trends, and Sex Differences in Multidimensional Healthy Life Expectancy among the Older Population in Jiangxi Province are presented in Table 1. These indicators correspond to four distinct health dimensions-physical self-care, comprehensive health utility, subjective health evaluation, and activity participation-reflecting the different aspects of health in older adults. In the total population, ALE was the highest, followed by QALE and SRHLE, with DFLE being the lowest. In the 60–64 age group, ALE was 19.55 years and DFLE was 15.17 years, with a difference of 4.38 years. This gap represents a transitional state of activity limitation without complete loss of independence, largely attributable to chronic conditions, such as osteoarthritis and chronic pain, and constitutes a critical window for health intervention. Community-based pain management and rehabilitation services can help reduce the duration of functional limitation and extend life without activity restrictions. All four indicators steadily decreased with age. From age 60–64 to ≥ 85, ALE showed the largest mean 5-year decline (3.16 years) and DFLE the smallest (2.63 years). However, DFLE was already the lowest among the four indicators at age 60–64 and dropped to only 2.01 years at age ≥ 85, indicating the weakest functional reserve. After the age of 80 years, all indicators fell below 6 years and the decline in function accelerated markedly, making it increasingly difficult to maintain independence. This reflects the combined effects of aging and multimorbidity, declining physiological reserve, and clustering of chronic diseases, which lead to rapid deterioration in self-care ability and quality of life[5]. We recommend prioritizing the 70–79 age group as a key stage for intervention and using the EQ-5D-5L and GALI to monitor changes in pain, mood, and activity participation so that early functional losses can be detected before ADL shows a pronounced decline. At the community level, home adaptation assessments, frailty screening, and basic services such as pain management and balance training should be implemented to prepare for functional decline in advanced age.
Age group ALE QALE SRHLE DFLE Both Male Female Both Male Female Both Male Female Both Male Female 60–64 19.55 18.19 21.11 18.58 17.48 19.87 17.11 16.28 18.16 15.17 14.69 15.74 65–69 15.41 14.18 16.75 14.54 13.57 15.62 13.22 12.44 14.16 11.55 11.14 11.99 70–74 11.60 10.60 12.68 10.84 10.05 11.70 9.82 9.11 10.64 8.31 7.96 8.66 75–79 8.27 7.63 9.04 7.67 7.20 8.27 6.98 6.47 7.66 5.66 5.64 5.76 80–84 5.56 5.34 5.95 5.12 4.97 5.46 4.83 4.53 5.35 3.54 3.61 3.65 ≥ 85 3.73 3.72 3.86 3.28 3.18 3.49 3.09 2.83 3.50 2.01 1.91 2.19 Mean 5-year decline 3.16 2.90 3.45 3.06 2.86 3.28 2.80 2.69 2.93 2.63 2.56 2.71 Note. ALE, Activity Limitation-free Life Expectancy; QALE, Quality-Adjusted Life Expectancy; SRHLE, Self-Rated Healthy Life Expectancy; DFLE, Disability-Free Life Expectancy. Mean 5-year decline was calculated as (value at age 60–64 − value at age ≥ 85) / 5. Table 1. Age- and sex-specific healthy life expectancy based on four health indicators
Compared to the results of the Sixth Jiangxi Provincial Health Service Survey in 2018, the SRHLE for men aged 60 increased from 15.81 to 16.28 years, and for women from 16.98 to 18.16 years. ALE for men increased from 17.15 to 18.19 years, and for women from 19.06 to 21.11 years. These improvements suggest that the Healthy Jiangxi Initiative and related public health interventions have begun to yield results. However, cross-regional comparisons show that SRHLE for men in Jiangxi was only roughly comparable to the 2016 level in Shanghai (16.04 years), while SRHLE for women (18.16 years) was slightly higher than that in Shanghai during the same period (18.11 years), suggesting that the health status of older adults in Jiangxi still lags behind more developed regions, which may be attributable to differences in economic development and healthcare accessibility.
By sex, women had higher healthy life expectancy than men across all four indicators in the 60–64 age group, with the female advantage ranging from 1.05 years (DFLE) to 2.92 years (ALE). With advancing age, sex differences diverged according to this indicator. QALE and SRHLE remained consistently higher in women across all age groups, with women still surpassing men by 0.31 and 0.67 years, respectively, at age ≥ 85. The female advantage in ALE narrowed steadily, from 2.92 years at age 60–64 to 0.14 years at age ≥ 85 (men: 3.72 years, women: 3.86 years). The female advantage in DFLE largely disappeared after age 75, with values of 5.64 and 5.76 years for men and women, respectively, at age 75–79. These trends indicate that women's functional advantages in physical self-care and participation in activities do not persist into advanced old age, possibly because men who survive to very old ages are a more select group with better underlying health[6]. However, women's advantage in subjective health evaluation does not diminish with age, suggesting that older women possess greater psychological resilience and a stronger capacity to adjust their health expectations in the face of functional decline[7].
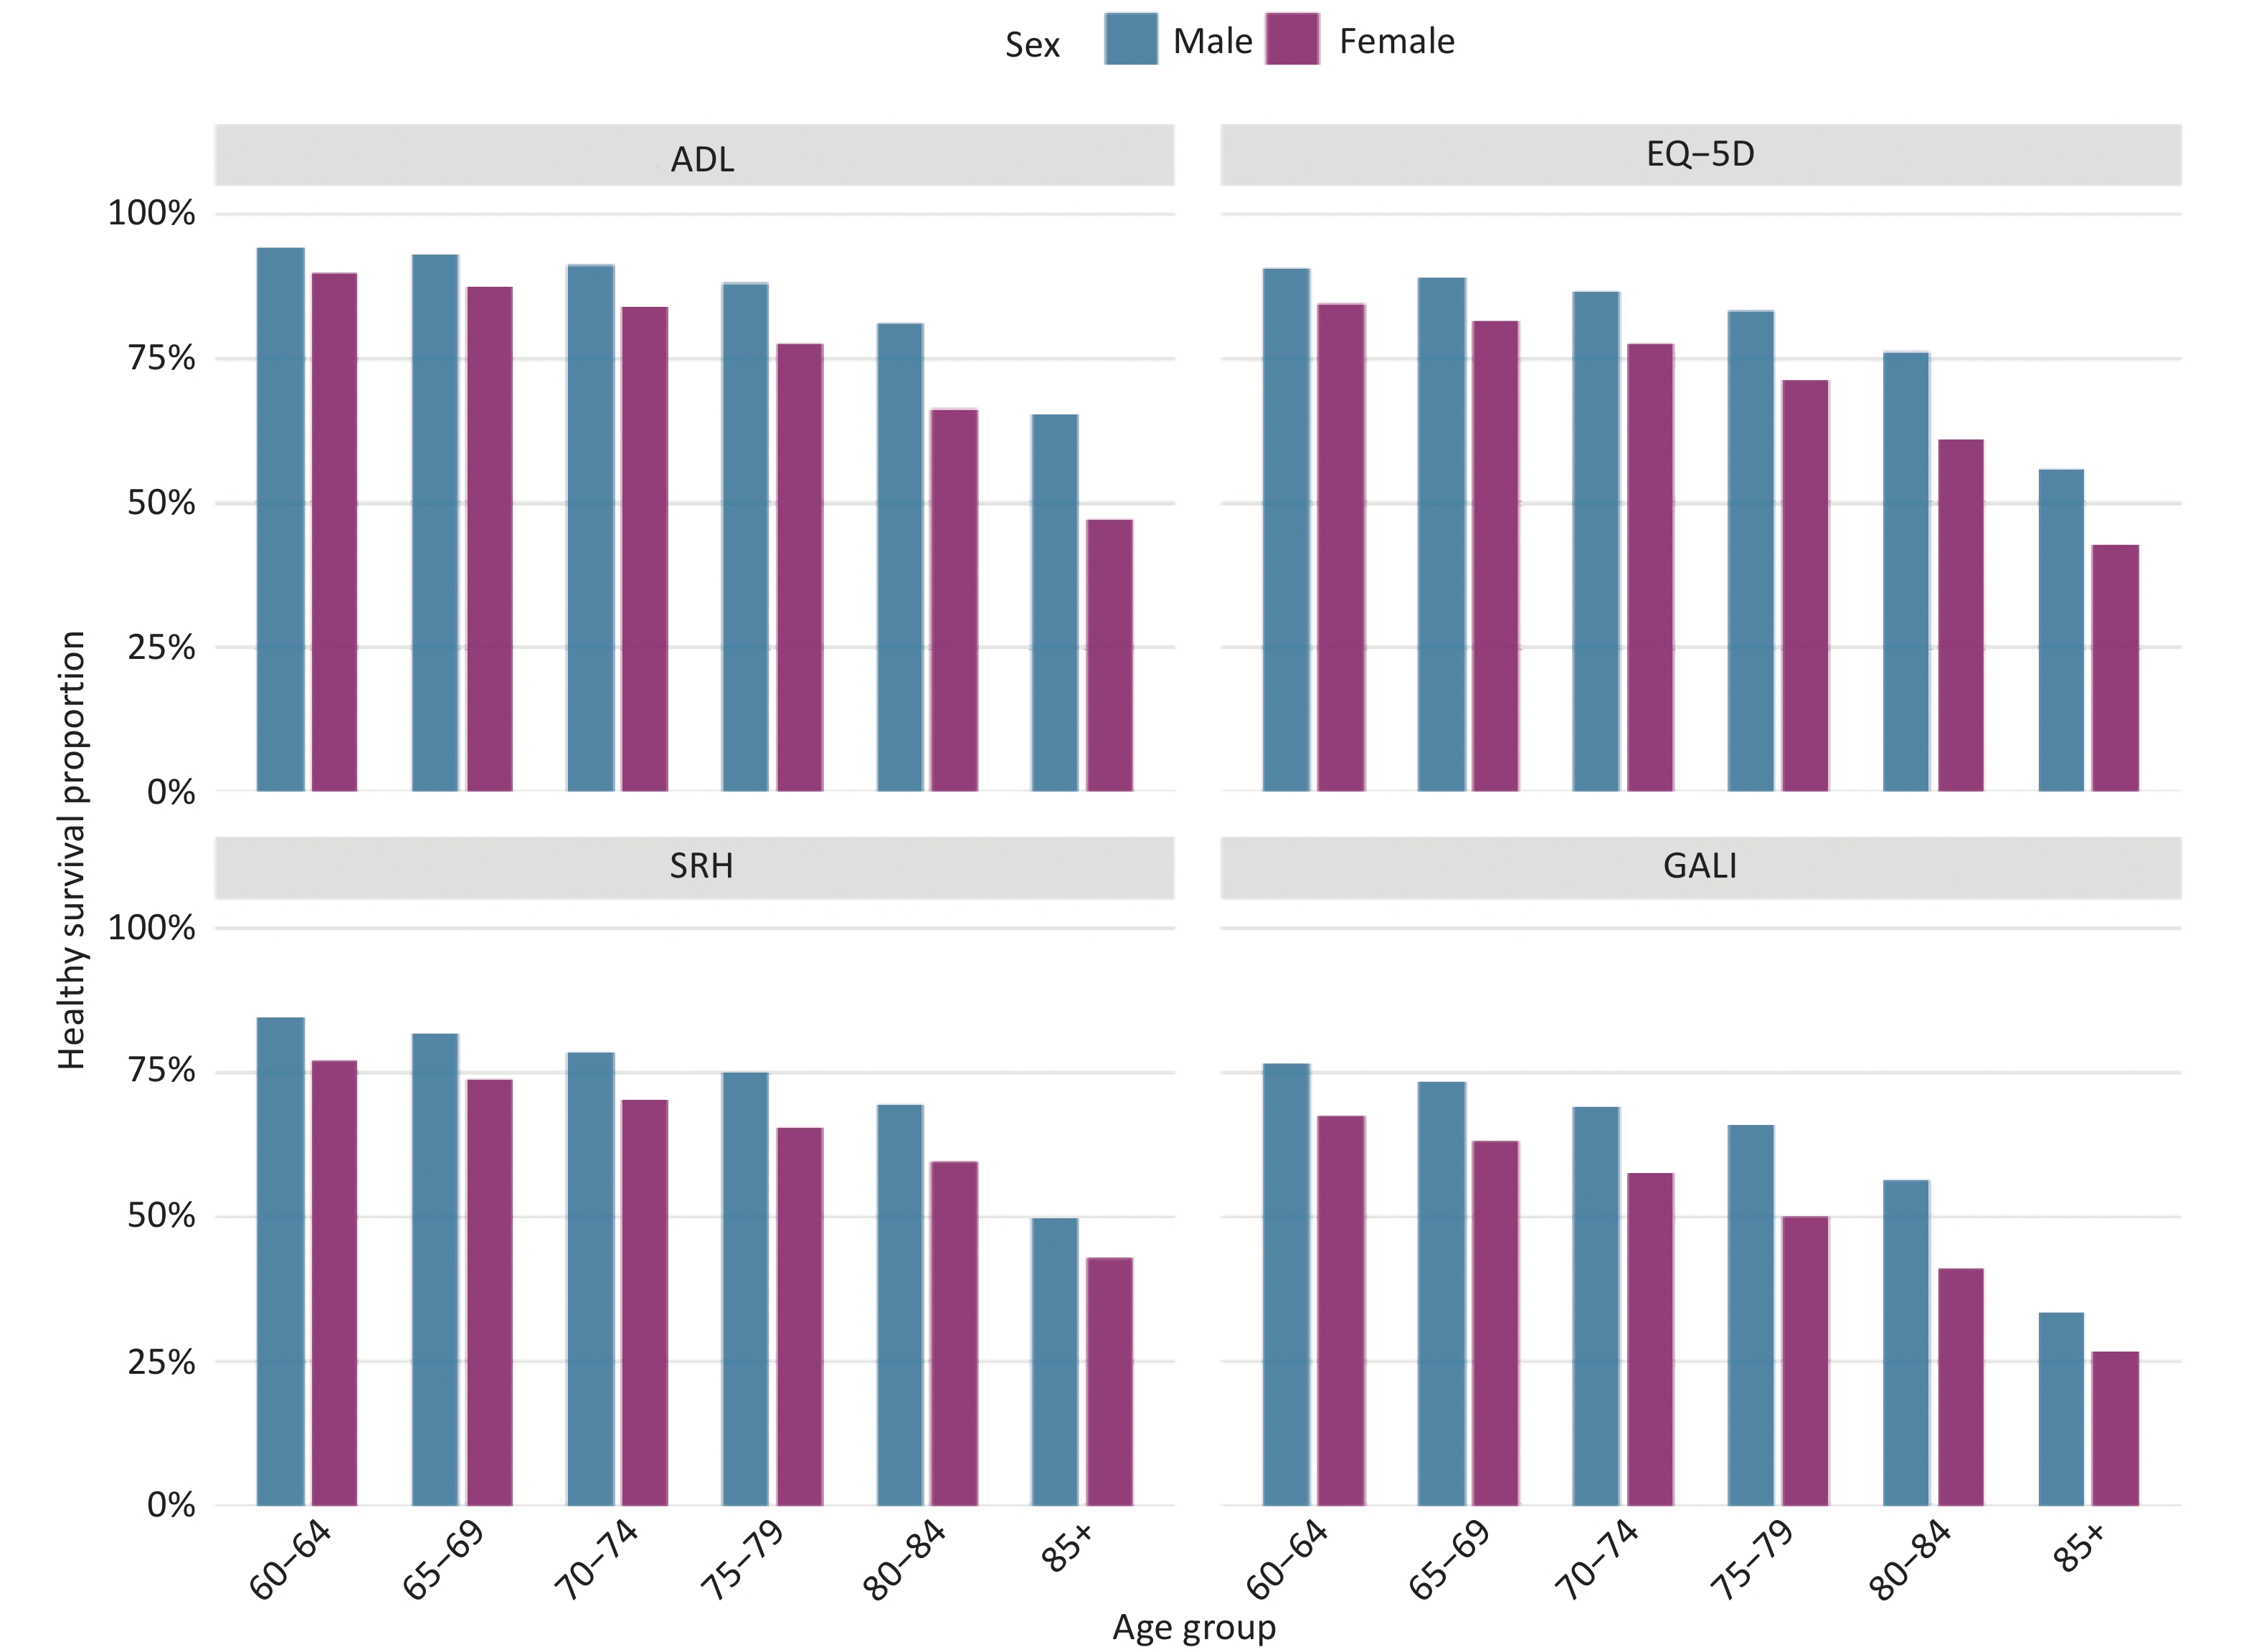
Figure 2 presents the age-stratified characteristics of the healthy survival proportion among the elderly population in Jiangxi Province based on four indicators: ADL, EQ-5D-5L, SRH, and GALI, disaggregated by gender. Overall, this proportion steadily declined with age. Among those aged 85 years and older, the proportion of healthy life years within the remaining life expectancy had already fallen substantially. This indicates that longer life does not necessarily mean healthier life and that late life is often accompanied by an extended period of functional limitation. When examined by sex, women had a higher healthy life expectancy than men, yet their healthy life proportion remained consistently slightly lower. This suggests that a greater share of women’s additional years of life are spent with disease or functional limitations, confirming the paradox that men experience a survival advantage despite worse health[8]. Considering these findings, health strategies for men should emphasize increasing participation in chronic disease screening, incorporating cardiovascular risk assessment into community health check-ups, and implementing interventions targeting high-risk behaviors, such as smoking and alcohol use, to reduce the risk of premature mortality. For women, efforts should focus on the long-term management of nonfatal chronic conditions and the maintenance of physical function, thereby compressing the period of life with morbidity.
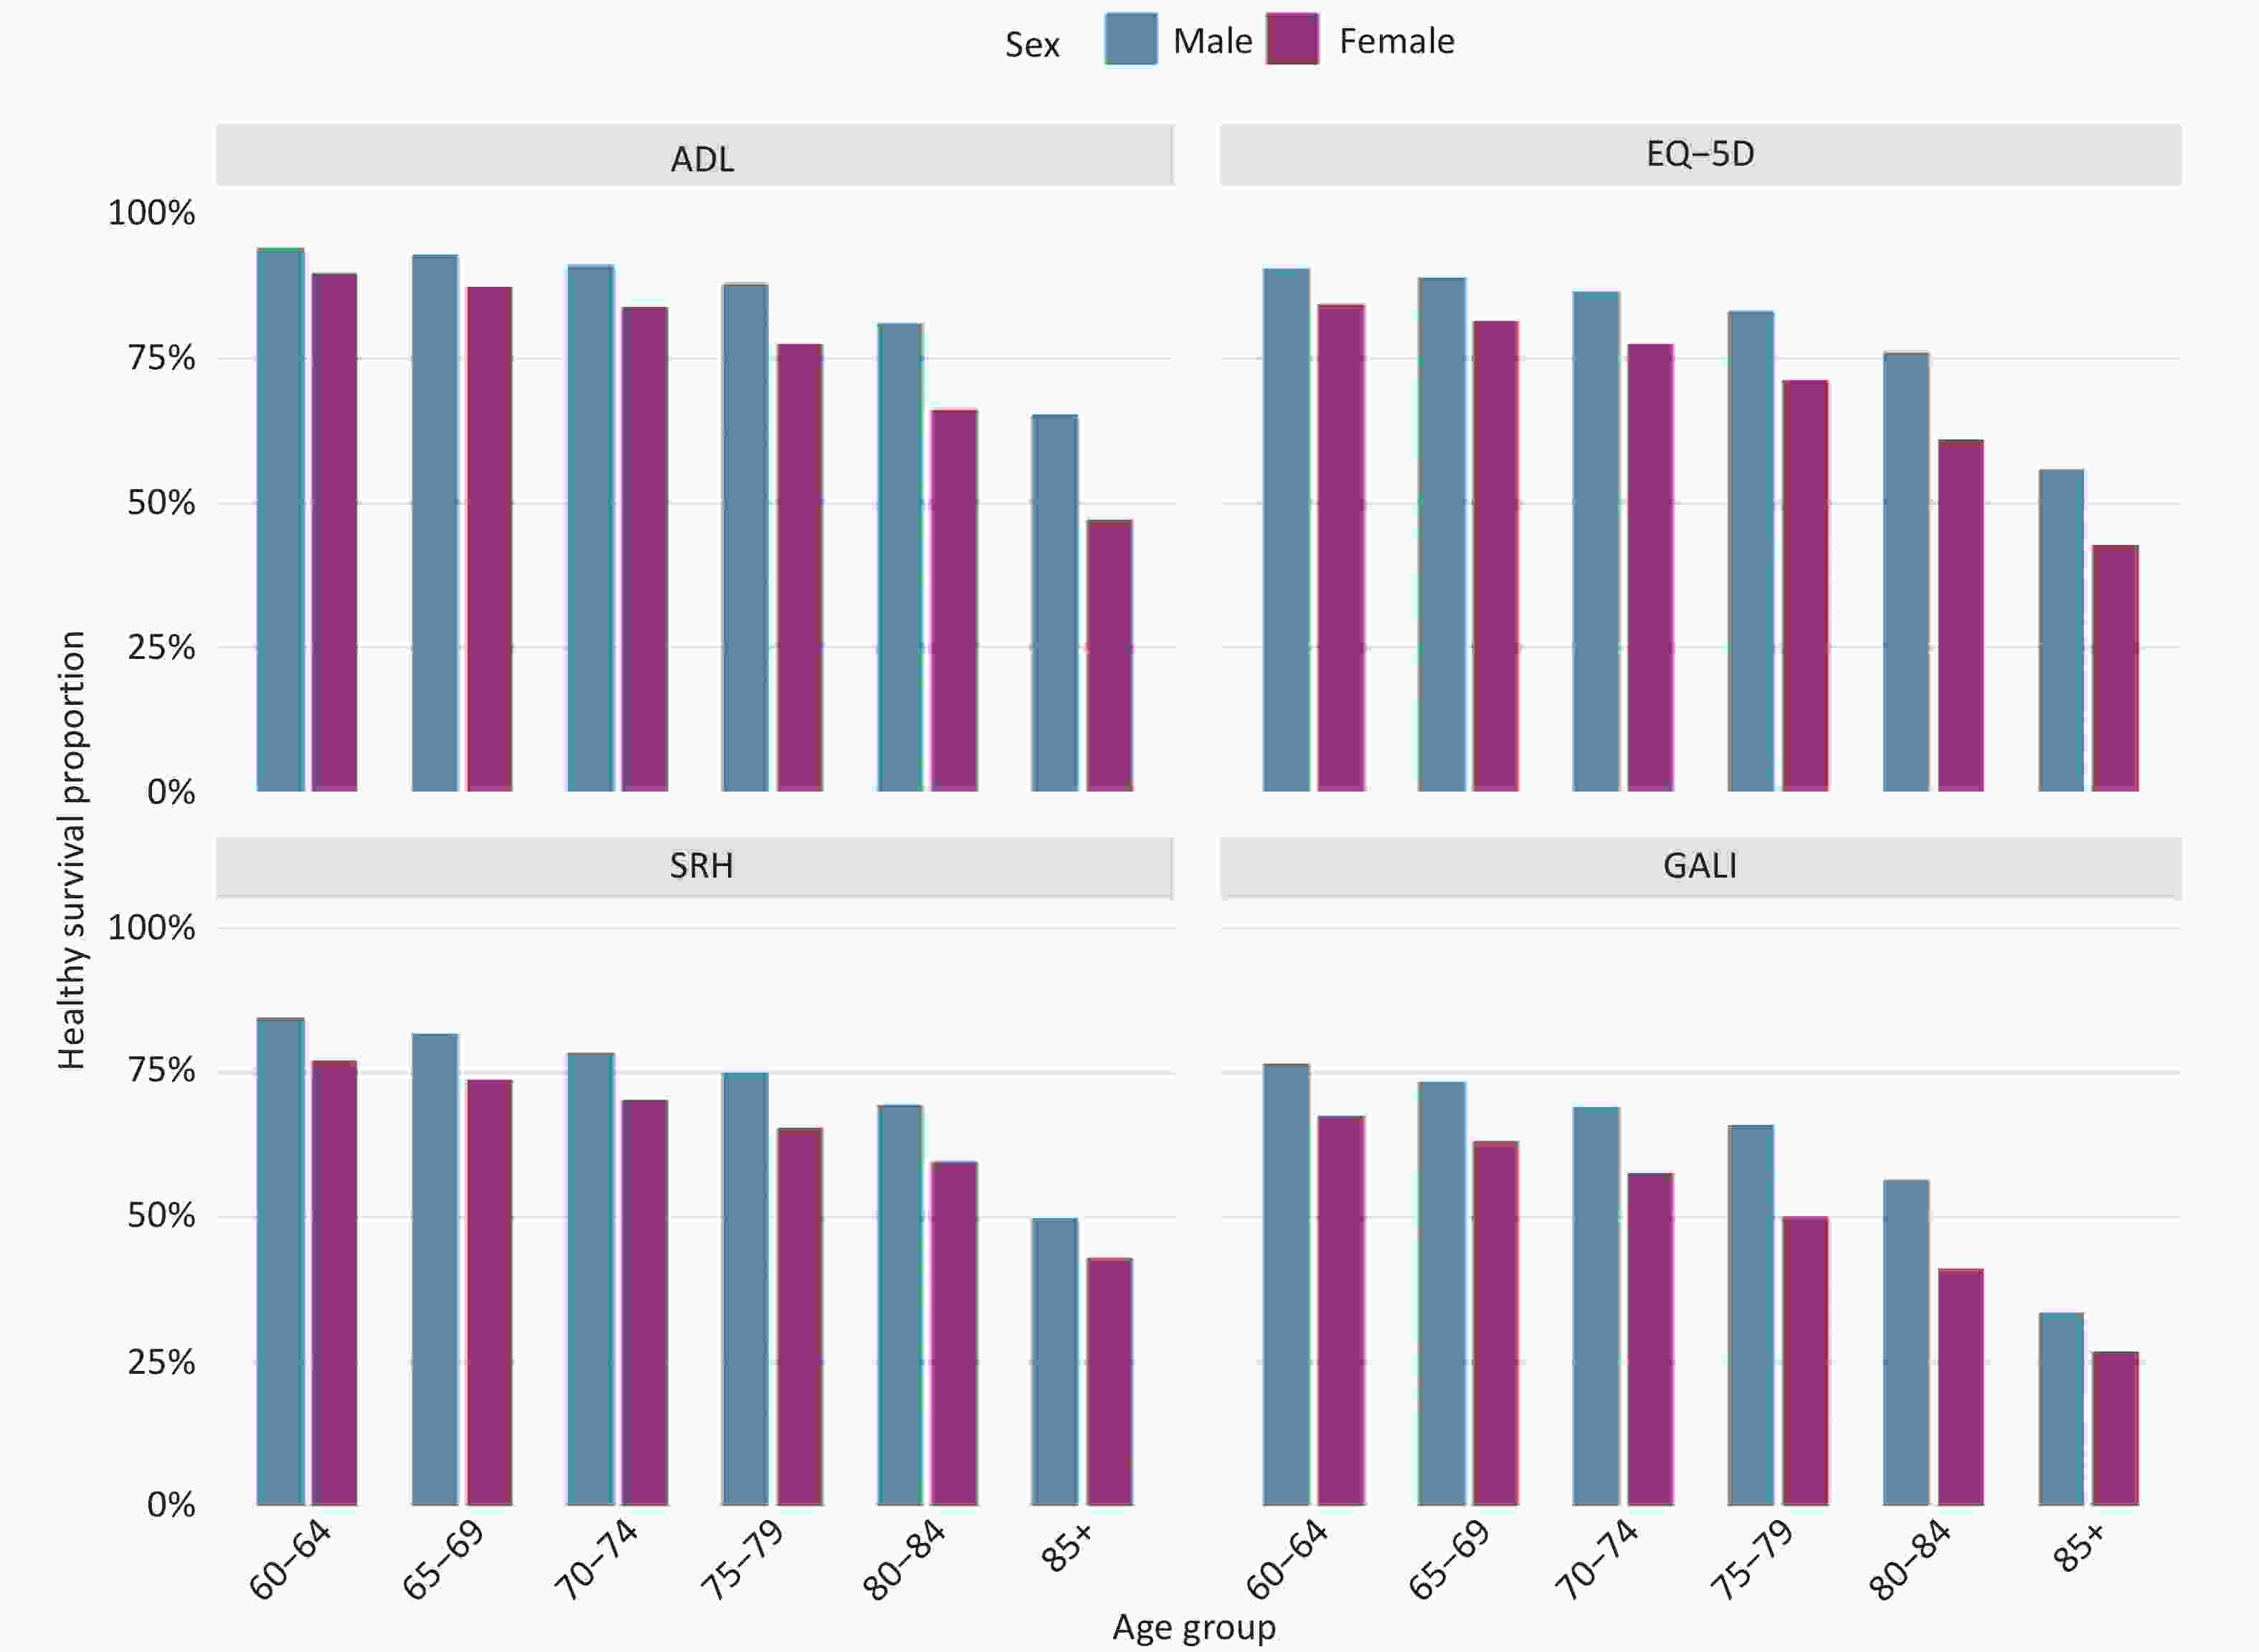
Figure 2. Differences in healthy survival proportion by age and gender in Jiangxi's elderly population, based on four measurement indicators.
We measured HLE using ADL, EQ-5D-5L, SRH, and GALI across three groups: no chronic disease, one chronic disease, and multimorbidity. The results showed that regardless of the indicator used, HLE decreased progressively with the number of chronic diseases, which is consistent with previous findings. This study further identified two noteworthy features. First, sensitivity to chronic disease accumulation differed across indicators (Supplementary Figure S1). Among older adults without chronic diseases, the four types of HLE showed differences, and as the number of chronic conditions increased, HLE based on GALI and self-rated health declined the most[9], followed by EQ-5D-5L, whereas ADL declined the least. This gradient suggests that the health impact of multimorbidity first manifests in daily activity participation and subjective perceptions, with the loss of basic self-care ability lagging. As the number of comorbidities increased, EQ-5D-5L utility values continued to decline. The greater drops in self-rated health and GALI further confirm the vulnerability of subjective evaluations and activity participation to the impact of multimorbidity. Previous studies have identified diabetes and stroke as the main disabling diseases contributing to a decline in healthy life expectancy among older adults[10]. Therefore, relying solely on ADL for health assessment risks underestimates the impairment of quality of life in early multimorbidity. Second, the health gap between the multimorbidity and disease-free groups narrowed with age, reflecting selective survival. After the age of 85 years, each additional chronic disease increased disability risk by 16% but lowered recovery likelihood by 26%, making functional loss difficult to reverse[5]. Disease-free survivors at very old age are a selected group with reduced physiological reserves; therefore, the gap narrows. Fatal diseases may also cause earlier death in those with severe limitations, further compressing the gap. These findings have important implications for geriatric health management. Multimorbidity care should prioritize the prevention of functional decline and the maintenance of independence, not just clinical indicators. Combining the ADL, EQ-5D-5L, and SRH tools can screen for high disability risk and detect “hidden disability,” where functional impairments exist despite apparent self-care ability. Strategically, community rehabilitation and chronic disease prevention can slow functional decline at younger ages, whereas assistive devices, home adaptation, and long-term care can compensate for lost function at the oldest age.
HTML
Competing Interests The authors declare that they have no competing interests.
Ethics This study involved a secondary analysis of de-identified public health survey data. The original Jiangxi Seventh Health Service Survey was conducted with ethical approval and informed participant consent. The use of this anonymized dataset for research was approved by the relevant authorities and was conducted in accordance with the ethical standards of Nanchang University.
Authors' Contributions Formal analysis, Writing-original draft, Visualization: Lin Fu; Conceptualization, Methodology, Writing-Original Draft: Fenfei Xu; Conceptualization, Methodology, Writing-Review & Editing: Xinru Li; Data Curation, Writing-Review & Editing: Yanhong Zhang; Data Curation, Writing-Review & Editing: Jiechuan Hou; Conceptualization, Methodology, Supervision, Project administration, Writing-Review and Editing, Funding acquisition: Songbo Hu. All authors read and approved the final manuscript.
Data Sharing The datasets generated and analyzed during the current study are not publicly available because of restrictions imposed by the data owner (Jiangxi Provincial Health Commission), but are available from the corresponding author on reasonable request and with permission from the data owner.
&These authors contributed equally to this work.
Reference

 Quick Links
 DownLoad: