


HTML
-
Norovirus, a foodborne pathogen, is the most common cause of acute gastroenteritis outbreaks and a major cause of sporadic nonbacterial gastroenteritis worldwide[1-2]. Norovirus is mainly spread by consumption of contaminated water and food. Bivalve molluscan shellfish, such as oysters, have been recognized as the main vector for human norovirus transmission, and are frequently involved in norovirus outbreaks[3-9]. Several studies using RT-PCR have demonstrated norovirus contamination in a significant proportion of oysters and other bivalve shellfish throughout the world[10-16]. The linkage between human illness and levels of norovirus contamination is well established. Studies in several countries have confirmed the relationship between detectable viral RNA levels and health risks[17-18].
Guangxi Zhuang Autonomous Region (GZAR), located in southwestern China, has a diverse mix of ethnic minorities, with the Zhuang ethnic group constituting one-third of the total population of 50 million. GZAR has a 1, 500 km-coastline on the Beibuwan Gulf, making it an important shellfish production and consumption area in China. Therefore, identification of norovirus levels in shellfish becomes important for local authorities to assess the associated infection risk and to manage producing areas involved in shellfish-borne outbreaks.
Since the detection and quantification of norovirus in shellfish is especially challenging owing to its low titer and the presence of inhibitory substances, highly sensitive and accurate detection tools are required. Recently, droplet digital PCR (ddPCR), an emerging technology that provides absolute quantification of the target sequence, has been developed as an alternative quantitative PCR assay[19]. This method overcomes the limitations of real-time PCR by relinquishing the need for external standard curves and the reliance on rate-based measurement (CTvalues)[20-21]. Previous studies have demonstrated that ddPCR-based methods are particularly advantageous for the detection of low levels of viruses in food and environmental samples having a large variety of inhibitory compounds[21-28]. Therefore, ddPCR would be an ideal tool for precise quantification of norovirus in shellfish tissues that contain large amounts of PCR inhibitors, such as proteins and fats. Furthermore, the published studies generally targeted a single point of the food production chain, either in harvesting areas or markets[10-13, 15-16], and therefore, the data may not be representative of the complete food production chain, from primary production to sale to consumption. Additionally, the quantitative norovirus levels in oysters were obtained mostly by real-time RT-PCR. This study aimed to develop a one-step RT-ddPCR method, and apply this to quantitative analysis of norovirus contamination throughout the food production chain of oysters along the coast of GZAR.
-
To assess the health risk of shellfish-related illness, a program for monitoring norovirus contamination in oysters from the farm to the fork was conducted in Guangxi in 2016. Oyster samples were collected from farms, markets, and restaurants monthly, from January to December. Each sample comprised 10 whole oysters and the samples were dispatched to the laboratory within 24 h under chilled conditions.
-
Viruses were extracted from the shellfish according to the reference method (ISO/TS 15216-1, 2013)[29]. For each sample, the digestive glands (stomach and digestive diverticula) of 10 oysters were excised, pooled, and then finely chopped. A 2 g sample of chopped glands was transferred to a clean tube, and mixed with 2 mL phosphate buffer saline (pH 7.3), with the addition of 10 μL of 20 mg/mL proteinase K (Amresco, Solon, OH, USA). To monitor extraction efficiency, 10 mL of mengovirus (BioMérieux, Lyon, France) was added as a within-sample control of the virus/RNA extraction process as described by Costafreda et al.[30]. The suspensions were incubated at 37 ℃ in a shaking incubator at 300 rpm for 60 min to allow digestion and then placed in a water bath at 60 ℃ for 15 min to inactivate the enzyme. Finally, the sample was centrifuged at 3, 000 ×g for 5 min, and the supernatant was collected for RNA extraction.
-
Sample RNA was isolated from 150 μL of shellfish supernatant using the QIAamp Viral RNA Kit (QIAGEN, Hilden, Germany), according to the manufacturer's instructions. Viral RNA was eluted in 35 μL of elution buffer. A negative control using RNase-free water was processed along with the shellfish samples. The isolated RNA was stored at -80 ℃ until analysis.
-
After extraction, 5 μL of extracted RNA per sample was tested along with four dilutions of the mengovirus standards (undiluted, 10-1, 10-2, and 10-3) and a negative control (RNAse free water) by one-step real-time RT-PCR using the Mengo Extraction Control Kit. Amplification was carried out in a total of 25 μL of reaction mix and performed on a Bio-Rad CFX96 real-time PCR machine (Bio-Rad, Hercules, CA, USA), with the following cycling parameters: 45 ℃ for 10 min, 95 ℃ for 10 min, and then 40 cycles of 95 ℃ for 15 s, 60 ℃ for 45 s. The CT value of the sample was compared with the standard curve of mengovirus and the extraction efficiency was calculated using the formula: % efficiency = (copies of RNA extracted from the sample/copies of 1st point of standard curve) × 100. The calculation of the number of copies of mengovirus extracted from the sample took account of the 150 μL of the 2 mL shellfish supernatant used for RNA extraction and the 5 μL of the 35 μL elution buffer used for real-time RT-PCR. An extraction efficiency greater than 1% was accepted.
-
All shellfish RNA extracts were subsequently tested by one-step RT-ddPCR for norovirus detection and quantification using the One-Step RT-ddPCR Kit for Probes (Bio-Rad). Published primer and probe sets JJV1F/JJV1R/JJV1P and JJV2F/COG2R/RING2 were used to detect genogroup Ⅰ (GⅠ) and genogroup Ⅱ (GⅡ), respectively, as described previously[31-32]. The 20 μL reaction mixture contained 4 μL of RNA, 10 μL of 2x One-Step RT-ddPCR Supermix (Bio-Rad), 0.8 μL of 25 mmol/L manganese acetate solution (Bio-Rad), and each primer and probe at a final concentration of 0.2 and 0.16 μmol/L, respectively. The reaction mixture was then processed with 70 μL of droplet generation oil (Bio-Rad) using the droplet generator (Bio-Rad). The droplets generated were then transferred into a 96 well plate, heat sealed with foil and amplified on a conventional Bio-Rad CFX96 real-time PCR machine. The thermal profile consisted of 60 ℃ for 30 min, 95 ℃ for 10 min, followed by 40 cycles of 94 ℃ for 30 s, 60 ℃ for 1 min, and a final 98 ℃ for 10 min. After RT-PCR amplification, the plate was loaded onto the QX200TM droplet reader (Bio-Rad) for data acquisition using QuantaSoft software (Bio-Rad). The QuantaSoft program provided absolute quantities per μL of reaction mixture, which were multiplied by 20 to calculate the quantities in the 20 μL RT-ddPCR reaction. The obtained values were then used to calculate an overall quantity of genome copies/g digestive gland. The calculation took into account the 4 μL out of the 35 μL elution buffer used for RT-ddPCR and the extraction efficiency for each sample. If a low number (< 10, 000) of total droplets was identified per 20 μL reaction, data were excluded from subsequent analysis.
-
Norovirus plasmid standards were generated by amplifying a 105 bp fragment with the primer set JJV2F/COG2R. The PCR product was purified, then cloned into the pGEM-T plasmid vector (Promega, Madison, WI, USA) and subsequently transformed into Escherichia coli 5-α competent cells. RNA was synthesized in vitro from the recombinant plasmids and the concentration was measured using a NanoDrop 2000c spectrophotometer (Thermo Scientific, Waltham, MA, USA). A series of ten-fold dilutions were then prepared, yielding a series of viral standards ranging from 1.88 × 10⁸ to 1.88 × 100 copies/µL. The plasmid standards at concentrations ranging from 1.88 × 10³ to 1.88 × 100 copies/µL were measured by both real-time RT-PCR and RT-ddPCR. Each dilution of the standards was repeated in five runs.
Real-time RT-PCR was carried out using a SuperScriptTM Ⅲ Platinum® One-Step qRT-PCR Kit (Invitrogen, Carlsbad, CA, USA) with the published primer and probe set JJV2F/COG2R/RING2, as described previously[31-32]. Twenty-five microliters of the reaction mixture contained 5 µL of the standard, 12.5 µL of 2× PCR Master Mix, 0.5 µL of SuperScriptTM Ⅲ RT/Platinum® Taq Mix, and each primer and probe at a final concentration of 0.4 and 0.2 µmol/L, respectively. Reactions were performed with a CFX-96 machine (Bio-Rad) under the following conditions: initial hold at 50 ℃ for 30 min and 95 ℃ for 2 min, followed by 40 cycles at 95 ℃ for 15 s, 55 ℃ for 30 s. The RT-ddPCR assay conditions were the same as described above for the quantification of shellfish samples.
-
Categorical data (frequency of positivity by season and site) were compared using a Chi-squared test. A P value of < 0.05 was considered significant. Bonferroni correction was used to calculate whether the observed differences in the prevalence by sampling sites were statistically significant.
Sample Collection
Preparation of Shellfish Homogenate
RNA Extraction
Determination of Extraction Efficiency
One-step RT-ddPCR for Norovirus Quantification
Determination of Detection Limit of One-step Real-time RT-PCR and RT-ddPCR
Statistical Analysis
-
From January to December 2016, a total of 480 oyster samples were collected in Guangxi. We obtained 240 samples from the two largest farms situated along the coastline in Guangxi, and a further 120 samples were purchased from wholesalers and retailers at supermarkets in three major cities in Guangxi. The remaining 120 samples were collected from restaurants where seafood was served (Table 1).
Sampling Site No. Sampled No. Acceptable Results Mean Extraction Efficiency (%) No. Positive (%) GⅠ GⅡ Total Farms 240 232 8.6 ± 2.3 1 47 48 (20.7) Markets 120 116 9.8 ± 3.4 1 27 28 (24.1) Restaurants 120 115 7.9 ± 2.8 0 20 20 (17.4) All 480 463 8.8 ± 2.9 2 (0.4) 94 (20.3) 96 (20.7) Table 1. Extraction Efficiencies and Norovirus Detection in Oysters by Sampling Site
-
Of 480 samples tested, 463 (96.5%) provided valid results (i.e., with > 1% extraction efficiency and > 10, 000 event numbers) and were used for further analysis. Four samples with unacceptable extraction efficiency and 13 samples showing low number of total droplets were consequently excluded from the study. Extraction efficiency values ranged from 3.5%-13.2% (mean = 8.8% ± 2.9%), with no difference between samples from farms, markets, or restaurants (Table 1).
-
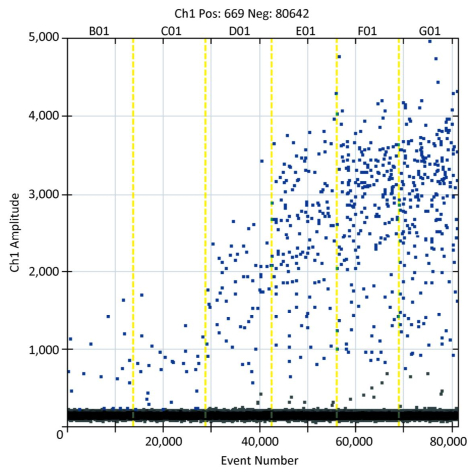
Of the 463 samples analyzed, 96 (20.7%) tested positive for norovirus, with 94 (20.3%) being positive for GⅡ and 2 (0.4%) being positive for GⅠ. Figure 1 shows the visual representation of six oyster samples that were positive for norovirus (event numbers > 10, 000), as indicated by RT-ddPCR. The prevalence varied between sampling locations, but a comparison of the norovirus prevalence using Bonferroni correction revealed no significant difference in the site-by-site prevalence (α = 0.05, α' = 0.0125) (Table 1). Norovirus was detected throughout the year, but the prevalence showed an obvious seasonal difference (P < 0.001) between the summer months (11.0%) and the winter months (30.2%).
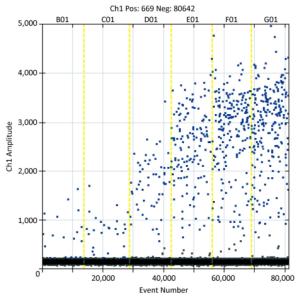
Figure 1. RT-ddPCR data for six oyster samples. The Y axis shows the fluorescent intensity, and the X axis is the total number of events in each sample. The vertical yellow lines separate the samples.
-
Quantitative data showed that levels of norovirus in the tested samples varied widely (up to 100-fold). The highest level of norovirus was 314, 300 copies/g digestive gland, while the lowest level was 6, 894 copies/g. The geometric mean of total norovirus (GⅠ and GⅡ) was 19, 300 copies/g; 22, 520 copies/g for GⅠ, and 19, 230 copies/g for GⅡ.
Among the oyster samples quantified, 54.2% (52/96) ranged from 10, 000 to 100, 000 copies/g, and 41.7% (40/96) were below 10, 000 copies/g. Four (4.2%) samples containing over 100, 000 copies/g were detected between December and February, when the highest rates of norovirus positivity were recorded. Norovirus levels also varied between sampling sites, with the highest geometric mean score observed in the samples collected from farms and the lowest in the samples from restaurants (Table 2).
Sampling Site No. Quantified No. Positive within Quantity Ranges (copies/g) Geometric Mean
(copies/g)> 100, 000 10, 000-100, 000 < 10, 000 Farms 232 1 26 21 21, 350 Markets 116 3 14 11 18, 590 Restaurants 115 0 12 8 15, 400 All 463 4 52 40 19, 300 Table 2. Norovirus Levels in Oysters by Sampling Site
Norovirus levels in positive samples showed marked seasonal variation (Figure 2). Norovirus concentrations were significantly greater from November to April than from May to October. For each month of the study, the percentage of samples with total norovirus in different quantity ranges is shown in Figure 3. Both the prevalence and levels of norovirus showed strong seasonality (highest levels during winter months and lowest levels during summer months).
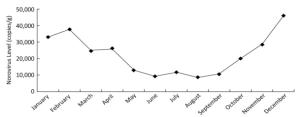
Figure 2. Monthly geometric mean of norovirus levels in oysters (SD = 12290.80).
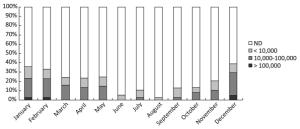
Figure 3. Monthly norovirus levels in oyster samples shown as the percentage of samples within each norovirus quantity range (copies/g). ND: not detected.
-
As shown in Table 3, the sensitivity of norovirus detection by real-time RT-PCR was approximately 1.88 × 10² copies/µL, while RT-ddPCR quantification was applicable for norovirus with ≥ 1.88 × 101 copies/µL. Thus, RT-ddPCR showed a ten-fold greater sensitivity than real-time RT-PCR for detection of norovirus. However, RT-ddPCR reported 9 ± 7, 105 ± 56, and 1, 220 ± 296 copies/µL in the 1.88 × 101, 1.88 × 10², and 1.88 × 10³ copies/µL norovirus standards, respectively, counting approximately 40%-50% fewer RNA copies than expected relative to the input standard copy number.
Norovirus Standards
(copies/µL)Real-time RT-PCR RT-ddPCR (copies/µL) Result Wells detected/tested Result Wells detected/tested 1.88 × 100 - 0/5 - 0/5 1.88 × 101 - 0/5 9 ± 7 4/5 1.88 × 10² + 5/5 105 ± 56 5/5 1.88 × 10³ + 5/5 1, 120 ± 296 5/5 Table 3. Comparison of Real-time RT-PCR and RT-PCR Measurements of Norovirus Plasmid Standards with Different Viral Loads
Sampling
Efficiency of Extraction
Norovirus Prevalence
Norovirus Quantification in Oyster Samples
Comparison of Detection Limit of One-step Real-time RT-PCR and RT-ddPCR
-
Laboratory confirmation of all suspected norovirus-contaminated shellfish is a critical element of surveillance and control activities during outbreaks. Previous studies have demonstrated that one-step RT-ddPCR shows superior quantitative performance and better tolerance to matrix inhibition than real-time RT-PCR, when applied to RNA virus analysis, indicating that the results from RT-ddPCR are more reliable and applicable than those from real-time RT-PCR[23, 27]. Also, the data analysis and interpretation of the one-step RT-ddPCR was considerably simplified in comparison with that of real-time RT-PCR. Till date, there exists very little quantitative data for noroviruses generated using the RT-ddPCR method[33]. In this study, an innovative method has been developed for norovirus quantification in samples with low levels of contamination in the presence of PCR inhibitors. Compared with real-time RT-PCR, the one-step RT-ddPCR method proved to be more sensitive in detecting norovirus, and is, therefore, a useful alternative method for detection and quantification of norovirus in water and food samples. In addition, the potential of one-step RT-ddPCR may be extended to the quantification of other RNA viruses.
The detection and quantification of norovirus contamination levels in shellfish throughout the food production chain using the RT-ddPCR method has not been well established in China. The method developed in this study allowed the detection of norovirus in oysters during the period of harvesting, trading, and consumption in Guangxi, China. Noroviruses were detected in oyster samples during all seasons, with an overall prevalence of 20.7%, highlighting the burden of norovirus contamination in shellfish from the farm to the fork in Guangxi. Previously published studies have reported norovirus prevalence in shellfish elsewhere in the world, ranging from 9.0%-76.2%[10-16]. The high variations may be attributed to seasonal and geographic differences, or differences in the diagnostic methods applied.
Higher norovirus occurrence during the cold season has been commonly observed[10-13]. This study showed distinct winter bias of both norovirus prevalence and viral levels in shellfish. Possible explanations for the seasonal pattern include the greater persistence of viruses under winter environmental temperatures, the higher prevalence of norovirus in humans in winter and the subsequent higher levels released into the marine environment, and the more effective viral clearance in shellfish during the summer months owing to the higher metabolic rate[34-36]. In Guangxi, oysters are a popular dish and are often consumed half-cooked or raw, especially during the cold months, when oysters have high fat content and are optimal for consumption. The season-specific high levels of norovirus contamination indicated a higher risk of shellfish-borne illness to consumers during the winter months.
In this study, norovirus GⅡ strains were predominant, accounting for 97.9% (94/96) of the samples that tested positive for norovirus. This is consistent with data from human infections reported in a previous study conducted in Guangxi, where the overwhelming majority of norovirus strains belonged to GⅡ[37]. However, it contrasts with some other studies, which reported that norovirus GⅠ strains, rather than GⅡ strains, were more common in oysters[10, 12, 38].
Norovirus concentrations were calculated taking into account the extraction efficiency in this study, and, thus correctly reflected the amount of norovirus present in the oysters. A previous publication indicated that oysters containing > 1, 000 (corrected with the extraction efficiency) viral genome copies per gram of digestive gland were likely to cause illness, and relatively high levels (possibly > 10, 000 copies per g) could cause significant outbreaks of illness[17]. A more recent study, which used RT-ddPCR to quantify norovirus in outbreaks due to shellfish consumption, clearly indicated that norovirus concentrations responsible for causing illness varied from 43 to 1, 170 copies/oyster[33]. Therefore, all the positive samples (20.7%, 96/463) detected in this study may be sufficient to induce gastroenteritis, and the majority of these positive samples (59.4%, 57/96) may be sufficient to cause outbreaks. The quantitative data presented in this study would be useful for risk assessment and future regulation of food safety.
The shellfish food production chain comprises three main parts: production, trade, and consumption. In this study, norovirus prevalence in oysters from farms displayed no significant difference (P > 0.05) when compared with that in oysters from markets and restaurants. However, the norovirus level detected in oysters collected from the harvest areas (mean = 21, 350 copies/g) was the highest among all the collection sites. The results indicated that contamination might have occurred during primary production, and, thus, regulating oyster production should be the critical control point for reducing the risk of viral contamination. A higher frequency of norovirus contamination (24.1% of samples) was found in oysters purchased from the markets (including from wholesalers, retailers, and supermarkets) compared with that in oysters from farms and restaurants. The increased frequency in markets compared with that in farms might have resulted from cross contamination during transport, storage, and marketing of oysters. Similarly, a high prevalence of norovirus was found in oysters collected from restaurants. As oysters were often served undercooked or raw in local restaurants, the results suggested a high risk of consumer exposure to contaminated shellfish.
In summary, the findings obtained in this study demonstrated that norovirus may be frequently detected in oysters in different stages of the food production chain in Guangxi region. From a public health perspective, the sanitary quality of shellfish in Guangxi needs to be improved. Based on the results of this investigation, we propose the following recommendations: (1) oyster producers must avoid producing and harvesting oysters in feces-contaminated areas; (2) regulators must establish monitoring procedures at the production step; (3) the catering industry should be aware, and the public should be informed, of the risk of viral gastroenteritis from consuming raw oyster.
-
We thank the staff of Beihai City CDC, Fangchenggang City CDC, and Qinzhou City CDC for assistance in collecting the oyster samples.
-
TAN Dong Mei (design of the study, sample testing, data analysis, drafting the article), LYU Su Ling (sample testing, data analysis and interpretation), LIU Wei (critical revision of the manuscript), ZENG Xian Ying (sample testing), LAN Lan (sample testing), QU Cong (sample testing), ZHUGE Shi Yang (sample testing), ZHONG Yan Xu (sample and data collection), XIE Yi Hong (sample and data collection), LI Xiu Gui (conception of the study, critical revision of the manuscript, approval of the version of manuscript to be published).

 Quick Links
 DownLoad:

