


HTML
-
Alzheimer's disease (AD) is the most frequent neurodegenerative dementia[1], characterized by progressive memory impairment and deterioration of other cognitive domains such as orientation, language, and behavior[2]. Histopathologically, the AD brain is characterized by the deposition of both neuritic plaques composed of amyloid-β peptides and hyperphosphorylated forms of the microtubule-associated protein tau in neurofibrillary tangles[3]. To facilitate the clinical diagnosis of AD, numerous studies have focused on biomarkers based on neuroimaging and molecules in cerebrospinal fluid (CSF) and peripheral blood. For example, neuroimaging using positron emission tomography with the tracer carbon-11-labeled Pittsburgh compound B can detect Aβ deposits in the brains of living subjects. However, neuroimaging tests are expensive and available at only a limited number of laboratories. As a result, access to neuroimaging is confined to a small number of patients. Similarly, Aβ and tau protein levels in CSF are well-established biomarkers with high accuracy for AD[4, 5], but CSF is not an appropriate sample for screening and routine testing due to its invasive process of sample collection. From this perspective, blood-based biomarkers for AD screening and routine testing would be more suitable[6]. Recent studies have reported many potential blood-based biomarkers of AD, such as protein, lipid, and nucleic acid[7-9].
MicroRNA (miR) is also considered to be one of the potential candidates for blood-based biomarkers. MiRs are endogenous, short, noncoding RNAs. Mature miRs are single-stranded RNA molecules of 20‑25 nucleotides which act as important post-transcriptional regulators of gene expression by binding with their target mRNAs. It is reported that miRs are essential for normal neuronal function and survival[10, 11], and several miRs have been shown to be important in neuropathology by downregulating AD‑related proteins, including APP and BACE‑1.
Exosomes are membrane vesicles with a size of 40‑100 nm that are released from numerous cell types of the body[12]. Recent studies have shown that, in addition to functional proteins, exosomes carry mRNA as well as miRs[13]. In functional terms, exosomes are considered to represent a novel mechanism of intercellular communication. Furthermore, exosomes are actively secreted from cells, which can help to eliminate the interference from passively secreted miRs. More importantly, abnormal expressions of miRs have been well detected in AD[14, 15]. There are also studies about the screening of differential exosomal miRNA biomarkers[16] and neuronal-derived exosomal proteins in serum[17] between healthy and AD patients. However, expression level of serum exosomal miR-135a, -193b, and -384 from AD patients remain unclear. In a previous study, we found that miR-135a which were changed significantly in hippocampi from APP/PS1 transgenic mice compared with the wild type control, directly interacted with the 3'-UTR of BACE-1 and repressed its expression and activity[18]. In addition, the overexpression of miR‑193b could repress the mRNA and protein expression of APP[19], and the overexpression of miR-384 suppressed the mRNA and protein expression of both APP and BACE-1[20]. So the primary goal of this study was to characterize differential expression of miR-135a, -193b, -384 in the serum exosome of AD patients, and to explore their potential value as biomarkers in AD.
-
The design of the present study was approved by the ethics committee of Xuanwu Hospital of Capital Medical University (Beijing, China), and the written informed consents were obtained from all participants. A total of 208 patients with dementia, who had been admitted to Xuanwu Hospital of Capital Medical University between September 2015 and December 2016, were enrolled in the present study. Based on the National Institute of Neurological and Communicative Disorders and Stroke and the Alzheimer's Disease and Related Disorders Association (NINCDS‑ADRDA) diagnostic criteria amendment[21], published by the National Institute on Aging and the Alzheimer's Association (NIA‑AA) in April 2011, these patients were diagnosed with AD and categorized into the mild cognitive impairment (MCI) and dementia of Alzheimer type (DAT) groups. A total of 101 MCI (59 females, 42 males, mean age 61.63 ± 7.32) and 107 DAT patients (66 females, 41 males, mean age 74.15 ± 7.93) were selected for this study. Age‑ and gender‑matched control subjects were included in the experimental design. In addition, selecting 30 Parkinson's disease with dementia patients (19 females, 11 males, mean age 68.64 ± 5.45) according to Movement Disorder Society Task Force criteria[22] and 20 vascular dementia patients (8 females, 12 males, mean age 63.73 ± 7.67) whose diagnoses were confirmed using the National Institute of Neurological Disorders and Stroke Association Internationale pour la Recherche et l'Enseignement en Neurosciences (NINDS-AIREN) criteria[23] formed disease control.
-
Peripheral blood was collected from each patient after fasting for 12 h. The serum was separated by centrifugation at 3, 000 ×g for 10 min in room temperature, followed by centrifugation at 12, 000 ×g for 5 min at 4 ˚C. The samples were stored at ‑80 ˚C until required.
-
The exosomes were isolated using the Total Exosome Isolation kit (Invitrogen Life Technologies) according to the manufacturer's instructions. Briefly, the serum was centrifuged at 2, 000 ×g for 30 min to remove cells and debris. Following this, 400 μL clarified serum was transferred to a new tube and 0.2 volumes of the Total Exosome Isolation reagent was added. Mix the serum/reagent mixture well by vortexing until there is a homogenous solution. And then incubate the sample at 4 ˚C for 30 min. After incubation, the samples were centrifuged at 10, 000 ×g for 10 min at room temperature. The supernatant was discarded and the pellet, containing the exosomes, at the bottom of the tube was resuspended in 200 μL phosphate‑buffered saline (PBS). The size distribution was confirmed using nanoparticle tracking analysis (Zetaview, Germany).
-
Protein was collected through lysis with radioimmunoprecipitation assay (RIPA) buffer supplemented with 1:100 protease inhibitor (Life Technologies) and phosphatase inhibitor cocktail Ⅰ & Ⅱ (Sigma-Aldrich). Protein was quantified using a Bicinchoninic Acid Protein assay kit (Life Technologies). And samples were separated on SDS polyacrylamide gels for western blotting analysis. Then, the separated proteins were transferred onto a PVDF membrane (Bio-Rad, Hercules, CA, USA). After blocking the membrane with 5% skimmed milk, the blots were incubated overnight at 4 ℃ with the appropriate primary antibody: 1:1, 000 diluted anti-CD9 (EXOAB-CD9A-1, System Biosciences) and anti-CD63 (EXOAB-CD63A-1, System Biosciences). Then, after washing, the blots were incubated with the HRP-conjugated secondary anti-Rabbit antibody at room temperature for 1 h. After washing, immunreactive bands were visualized using Immobilon Western HRP (Millipore; USA) and detected with FluorChem HD2 (proteinsimple; USA).
-
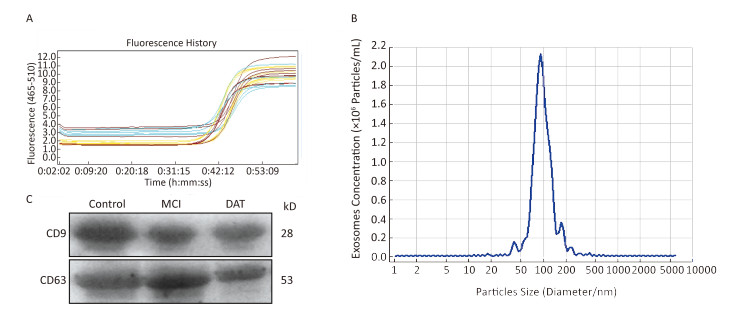
Exosomal RNA in the above PBS was extracted using miRcute miRNA isolation kits (Tiangen Biotech, Beijing, China). The quantity and quality of the RNA were determined using the Agilent RNA 6000 Pico Kit to determine the concentration of total RNA, and a Small RNA Kit Chip was used to measure the concentration of exosomal micro RNA (miRNA) on the Agilent Bioanalyzer instrument (Agilent Technologies). cDNA was obtained by reverse transcription with a microRNA First Strand cDNA Synthesis (Sangon Biotech, Shanghai, China) in a 20 μL reaction system. Then quantitative real-time PCR (qRT-PCR) was conducted with MicroRNAs Quantization PCR Kit (Sangon Biotech) and LightCycler 480 Real-time PCR system (Roche Applied Science, Germany) using U6 RNA as an endogenous control, according to manufacturer's instructions. For each miRNA, the expression level was calculated using the 2-ΔΔCt method[24]. The stability of serum exosomal U6 was detected on 90 patients (including 30 healthy controls, 30 MCI, 30 DAT) and the results were shown below (Figure 1A). The software named 'BestKeeper' was also used to analyze the stability of serum exosomal U6 expression levels according these data. The results shown that 1) the value of 'std dev [± CP]' was 0.81 (recommend < 1); 2) the value of 'set dev [± x-fold]' was 1.76 (recommend < 2). The RT‑qPCR primers (Sangon Biotech) for the measure ment of U6 RNA and miR‑135a, -193b, and -384 expressions are listed in Table 1.
Figure 1. The stability of exosomal U6 from AD and healthy control as the internal reference and characterization of exosomes. (A) Amplification curves of real-time PCR; (B) The size distribution of exosomes; (C) Western blotting of exosomal membrane markers.
Primers Sequence (5'→ 3') U6 sn RNA TTCGTGAAGCGTTCCATATTTT miR-135a CATATGGCTTTTTATTCCTATGTGA miR-193b CGGGGTTTTGAGGGCGAG miR-384 CGCGTATGAACAATTTCTAGGAAT Table 1. The Sequence of PCR Primers
-
The levels of exosomal miR-135a, miR-193b, and miR-384 in the serum of the patients and control subjects were analyzed using multiple independent nonparametric Mann-Whitney tests. P < 0.05 was considered to indicate a statistically significant differ ence. To determine the correlation of the serum expression level of exosomal miRs and its diagnostic value for AD, univariate and multivariate logistic regression analysis assays were used. Sensitivity and specificity of measured variable for AD biomarker were examined using a receiver operating characteristic curve (ROC) analysis under a nonparametric approach. The best cut-off value was selected based on the principle of minimizing the sensitivity-specificity difference and maximizing discriminating power of the tests. All analyses were performed by SPSS 19.0 software (SPSS, Inc. Chicago, IL), MedCalc software (MedCalcv. 12.1.4.0, Belgium), or GraphPad Prism (version 5.0; GraphPad Software).
Study Population
Sample Collection
Isolation of Exosome
Western Blotting
Isolation of RNA and MiR-135a, -193b, and -384 qPCR Analysis
Statistical Analyses
-
The result of the stability of exosomal U6 from AD patients and healthy control subjects as the internal reference was shown in Figure 1A. The isolated exosomes appeared as vesicles with sizes within the characteristic diameter range of 30-120 nm (Figure 1B). The sizes of the exosomes were consistent with reported exosome characteristics. To further characterize the isolated exosomes, we used the exosomal protein marker CD9 and CD63. As shown in Figure 1C, the isolated exosomes were positive for the exosomal marker CD9 and CD63. These results confirmed that the vesicles isolated from the serum were exosomes based on their size and marker protein expression.
-
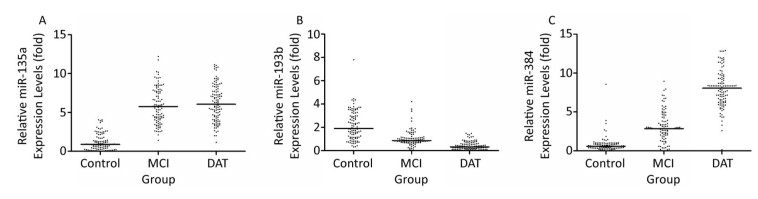
The expression levels of the exosomal miR-135a, -193b, and -384 were measured in a total 436 serum samples from 208 probable AD patients and 228 control subjects by using RT‑qPCR. The results indicated that the exosomal miR-135a level in the serum increased significantly in the MCI and AD groups compared with that in the control group (control versus MCI, P < 0.05; control versus AD, P < 0.05). However, there is no statistical difference of miR-135a levels between MCI and DAT groups (Figure 2A). Furthermore, compared with the expression in the control group, the exosomal miR-193b expression in the serum in the MCI group was signifi cantly reduced (P < 0.05), and was further reduced in the AD group (AD versus control, P < 0.01; AD versus MCI, P < 0.01) (Figure 2B). As for exosomal miR-384, its expression in MCI group was lower than that in DAT group (P < 0.05) and higher than that in control group (P < 0.05) (Figure 2C). These results demonstrated that the expression levels of exosomal miR-135a, -193b, and -384 in the serum had significant difference between the AD patients and healthy controls.
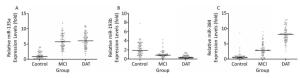
Figure 2. The relative expression levels of three exosomal miRNAs in the serum from patients with MCI and DAT and healthy control groups. A-C represents the relative serum exosomal levels of miR-135a, -193b, and -384 respectively in DAT, MCI, and control groups. The Y-axis depicts values normalized to U6 RNA and all miR levels were demonstrated in fold changes (2-ΔΔCt)[24]. The black horizontal line represents the median value of the data.
-
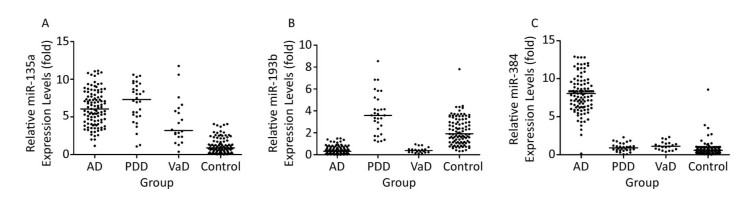
Clinical diagnosis and differential diagnosis of AD, Parkinson's disease with dementia (PDD) and vascular dementia (VaD) is difficult in late stages of the diseases, with high risk of misdiagnosis. Reliable biomarkers are required for diagnosis and differential diagnosis of these neurological diseases, and tracking the disease progression. In this study, the expression levels of exosomal miR-135a, -193b, and -384 in serum samples from AD, PDD, VaD patients and healthy controls were compared by using RT‑qPCR (Figure 3). P values of pairwise comparisons of the expression levels of exosomal miRs in the serum, measured by Mann-Whitney U tests, were presented in Table 2. There were significant differences in the levels of serum exosomal miR-384 between AD and non-AD. And serum exosomal miR-384 had the best diagnostic power to discriminate the AD, PDD, and VaD among these 3 exosomal miRs (Table 3, Figure 4).

Figure 3. Comparison of expression levels of exosomal miR-135a, -193b, and -384 in the serum samples from AD, PDD, VaD patients and healthy controls. MiR-135a (A), -193b (B), and -384 (C) expression level. The Y-axis depicts values normalized to U6 RNA and displays in 2-ΔΔCt. The black horizontal line represents the median value of the data.
miRs AD vs. PDD AD vs. VaD AD vs. Control PDD vs. VaD PDD vs. Control VaD vs. Control miR-135a 1.000 0.120 < 0.0001* 0.064 < 0.0001* < 0.0001* miR-193b < 0.0001* 1.000 < 0.0001* < 0.0001* 0.059 < 0.0001* miR-384 < 0.0001* < 0.0001* < 0.0001* 1.000 0.764 0.215 Note.*Compared with each other, the difference was statistically significant (P < 0.05). Table 2. P Values of Pairwise Comparisons of the Individual Biomarkers and Ratios, Measured by Mann-whitney U tests
Groups miRs AUC 95% CI Cut-off Value Sensitivity (%) Specificity (%) AD vs. PDD miR-135a 0.598 0.510-0.680 7.9288 75.70 46.67 miR-193b 0.996 0.965-1.000 1.1848 94.39 100.00 miR-384 0.991 0.958-1.000 2.2974 99.07 100.00 AD vs. VaD miR-135a 0.721 0.634-0.797 3.3106 89.70 55.00 miR-193b 0.551 0.460-0.639 0.2080 35.50 85.00 miR-384 0.991 0.954-1.000 2.3134 99.10 100.00 Note.AUC, area under the curve. CI, confidence interval. Table 3. Diagnostic Powers of the miR Biomarkers and Ratios to Discriminate between AD and the non-AD Diseases, Measured by ROC Curve Analyses
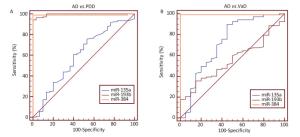
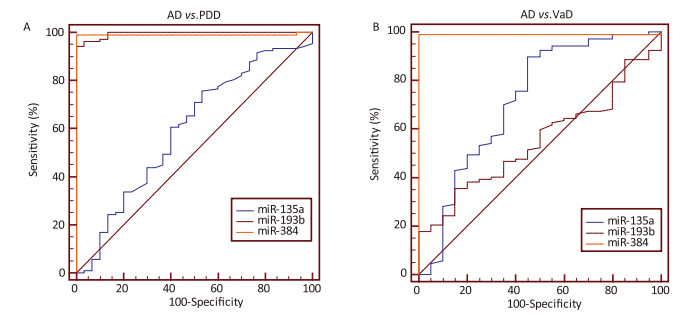
Figure 4. ROC curves of serum exosomal miR-135a, -193b, and -384 in the differential diagnosis of AD, PDD, and VaD. (A) ROC analyses of the miRs were performed to distinguish AD from PDD; (B) ROC curves of the miRs were used to distinguish AD from VaD.
-
In order to better interpret these laboratory test results, we compared the diagnostic powers between cut-off values and reference intervals in distinguishing AD from healthy controls. Firstly, ROC curve analysis was performed to find the optimal cut-off value. The results demonstrated that, when the cut-off value of serum exosomal miR-135a was 2.9837, the sensitivity/specificity was 94.4%/94% in discriminating AD patients from control subjects. The optimal cut-off value of miR-193b was 0.9105; its sensitivity/specificity was 92.5%/83% in the diagnosis of AD. While, When the sensitivity and specificity of miR-384 were 97.2% and 99% respectively (maximum of Youden's index), the corresponding cut-off value of miR-384 was 3.8906 (normalized against U6 expression). Secondly, according to C28-A3 document of Clinic and Laboratory Institute (CLSI), 120 healthy samples were selected to establish reference intervals[25, 26]. Outliers were identified and omitted using the Tukey method incorporated into the MedCalc software[27]. We calculated the values of the 2.5th and 97.5th percentiles, with 90% confidence intervals for lower and upper limits, as recommended by the IFCC (CLSI C28-A3). The results were shown in the Table 4. Futher, we used another 100 AD patients and 100 healthy people to verify the cut-off values and the reference intervals. Results were shown in Table 5. With Pearson's chi-square test, the chi-square values were 5.918, 2.303, and 7.494 for miR-135a, -193b, and -384, respectively. The corresponding P value was 0.015, < 0.0001, 0.006. Above all, we concluded that the using of cut-off value won better diagnostic power than reference intervals.
miRs Upper Limit Lower Limit 90% CI miR-135a 3.6684 NA 2.6155-4.0477 miR-193b NA 0.6104 0.3498-0.7447 miR-384 2.5305 NA 1.3287-3.8906 Table 4. Non-parametric Percentile Method (CLSI C28-A3)
miRs AD Group (n = 100) Healthy Group (n = 100) Sensitivity
(%)Specificity
(%)Positive
(%)Negative
(%)Positive (%) Negative (%) Cut-off value miR-135a 95 5 4 96 95 96 miR-193b 94 6 14 86 94 86 miR-384 97 3 1 99 97 99 Reference miR-135a* 46 54 18 82 46 82 intervals miR-193b* 48 52 27 73 48 73 miR-384* 44 56 15 85 44 85 Note.*Compared with cut-off value, the difference was statistically significant (P < 0.05). Table 5. The Sensitivity and Specificity of the Cut-off Values and Reference Intervals of Serum Exosomal miRs in the Diagnosis of AD
-
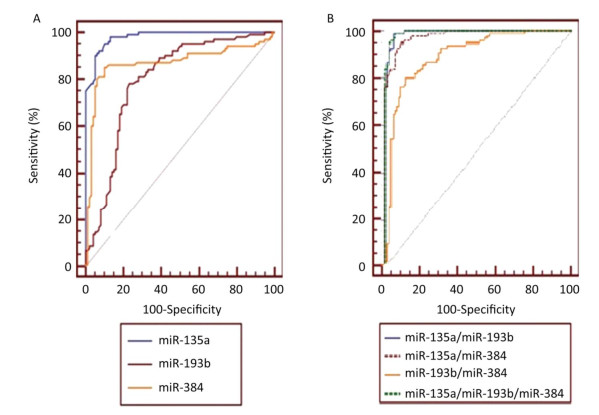
In order to investigate the early diagnostic value of the candidate exosomal miRs in the serum for AD, logistic regression analysis was performed[28]. The univariate logistic regression found that exosomal miR-135a (P < 0.0001) and miR-384 (P < 0.0001) in the serum increased the risk of MCI while exosomal miR-193b in the serum decreased the risk of MCI (Table 6). All factors with a P value < 0.05 were subsequently included in the multivariate logistic regression (stepwise) analysis, which demonstrated that miR-135a (P < 0.0001), miR-193b (P = 0.0005) and miR-384 (P = 0.0228) levels might also be independent factors for diagnosis of MCI. The independent predicting values of the exosomal miRs were further analyzed by ROC curve analysis to build a model of exosomal miRs in the serum for MCI diagnosis (Figure 5). The results demonstrated that miR-135a yielded highest diagnostic accuracy among the three miRs in discriminating MCI patients from control subjects (AUC 0.981, 95% CI 0.951-0.995, P < 0.0001). The details were shown in Table 7. The optimal cut-off value (3.0889) was selected to show that the sensitivity/specificity of exosomal miR-135a in the serum was 90.1%/95%. The Table 7 also presented ROC parameters for the combination of the miRs. The AUC values of miR-135a/miR-193b, miR-135a/miR-384, and miR-193b/miR-384 were 0.994, 0.983, and 0.905, respectively. Whereas, the combination of miR-135a, -193b, and -384 won the highest AUC among the single, the miR pairs and the combination of three miRs, which was 0.995, in the diagnosis of MCI.
miRs Univariate Logistic Multivariate Logistic (stepwise) OR 95% CI P Value OR 95% CI P Value Lower Higher Lower Higher miR-135a 7.1134 3.8133 13.2695 < 0.0001 10.2799 3.5518 29.7531 < 0.0001 miR-193b 0.2559 0.1648 0.3974 < 0.0001 0.0239 0.0029 0.1947 0.0005 miR-384 3.7514 2.6027 5.4072 < 0.0001 2.9632 1.1631 7.5495 0.0228 Note.Data was presented by P value, OR and 95% CI. The value of exosomal miRNAs in the serum to predict MCI were tested by univariate and multivariate logistic regression model. P < 0.05 was considered significant. OR, odds ratio; 95% CI, 95% confidence interval. Table 6. The Results of Univariate and Multivariate Logistic Regression Analysis of Serum Exosomal miR-135a, -193b, and -384 in Predicting MCI
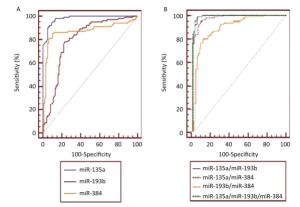
Figure 5. The ROC curves illustrated sensitivity and specificity of single serum exosomal miRNAs (A. miR-135a, miR-193b, and miR-384) and the miR pairs (B. miR-135a/miR-193b, miR-135a/miR-384, miR-193b/miR-384, and miR-135a/miR-193b/miR-384) in the diagnosis of MCI. Area under the ROC curve was abbreviated to AUC. The corresponding AUC values were listed in Table 7.
miRs Cut-off Value Sensitivity
(%)Specificity
(%)AUC 95% Confidence Interval Significance Level P* miR-135a 3.09 90 95 0.981 0.951-0.995 < 0.0001 miR-193b 1.14 78 77 0.798 0.736-0.852 < 0.0001 miR-384 1.15 85 90 0.870 0.816-0.914 < 0.0001 miR-135a/miR-193b 0.45 99 96 0.994 0.971-1.000 < 0.0001 miR-135a/miR-384 0.50 93 94 0.983 0.955-0.996 < 0.0001 miR-193b/miR-384 0.54 80 89 0.905 0.855-0.941 < 0.0001 miR-135a/miR-193b/miR-384 0.37 99 95 0.995 0.973-1.000 < 0.0001 Note.*Null hypothesis: true area = 0.5. Table 7. The Diagnosis Powers of the Single and Muti-exosomal miRs in Serum for MCI
The Stability of Exosomal U6 and Characterization of Exosomes
Expressions of Exosomal MiR-135a, -193b, and -384 in the Serum of AD Patients
The Diagnostic Powers of Serum Exosomal MiR-135a, -193b, and -384 in Discriminating between AD and other Neurological Disease
Comparison of Diagnostic Powers of Cut-off Values and Reference Intervals of MiR-135a, -193b, and -384 to Distinguish AD from Healthy Controls
Exosomal MiRs in the Serum Enhances the Early Diagnostic Power of AD
-
Searching for non-invasive AD biomarkers is currently one of the most rapidly growing areas in AD research[29]. The potential benefit in the analysis of miR in the diagnosis and treatment of numerous diseases, including cancer, infection and neurodegenerative disease has been previously evaluated by numerous researchers[30-32]. In this study, 3 exosomal miRs in the serum (miR-135a, -193b, and -384), demonstrated to regulate the expressions of APP or BACE-1 in previous studies, were studied in the MCI and AD patients compared with controls. The results indicated that the serum exosomal miR-135a and miR-384 levels of the MCI and AD groups increased significantly compared with that of the control group. And the exosomal miR-193b level in the serum from MCI and AD patients decreased signifi cantly compared with healthy subjects. However, it were reported, in the previous study, that the level of miR-135a in the serum of DAT group was significantly lower than that of control groups, and that the blood miR-384 level of the patients with MCI and DAT was also lower than that of the controls. The difference may be caused by the following reasons: our present study contained a larger number of individuals while the previous research just contained small samples. Besides, in this experiment, the exosomal miRs in the serum were the measured objects, however, the miRs in the serum or plasma were analyzed in the previous study. Many cells of the nervous system have been shown to release exosomes in the form of extracellular membrane vesicles, which indicates their active role in function, development, and pathologies of this system. What's more, other recent studies have shown that exosomes play a role in both the degradation of toxic Aβ and the accumulation of toxic peptides when the clearance pathway is overwhelmed[33]. Exosome miRs in the serum might represent a research direction of the occurrence and therapy of AD[34, 35].
There were many similarities of AD, PDD, and VaD in clinical presentation, neuropathological characteristics, and genetic determinants of risk etc[36]. Because of these overlapping features, diagnosing AD is challenging. In this study, the expression levels of serum exosomal miR-135a, -193b, and -384 of AD, PDD, and VaD patients were analyzed, and the values of the exosomal miRs in the serum were investigated in discriminating between AD and PDD, AD and VaD. Diagnostic accuracy was assessed through ROC curve analyses to obtain area under the curve (AUC) values and to define optimal cut-off values. As a result, the expression level of exosomal miR-384 in the serum had significant difference between AD and non-AD. Besides, exosomal miR-384 in the serum had the best of diagnose power in discriminating between AD and PDD, AD and VaD whose sensitivity/specificity of was 97.2%/100% and 99.1%/100% respectively. In summary, serum exosomal miR-384 might provide important assistance in the differential diagnosis between AD and non-AD.
The measurements of disease biomarkers in clin ical laboratories are used to screen, diagnose, and monitor a wide range of medical conditions[37]. In order to better interpret these results of miRs, the diagnostic powers of the reference intervals and cut-off values of the three miRs were analyzed. The results demonstrated that the cut-off values, rather than reference intervals of the miRs, had higher sensitivity and specificity in the diagnosis of AD. In short, the cut-off values of the serum exosomal miR-135a, -193b, and -384 could play an important role in the diagnosis of AD.
The early diagnostic powers of the miRs for AD were also analyzed. And the optimal cut-off values of the miRs for MCI were calculated out by ROC curves[38]. For the majority of diseases, combinated biomarkers rather than a particular one are proved better for diagnosis[39]. In this study, all the three miRs were combined to analyze the comprehensive predictive value for MCI risk, which illuminated a great diagnostic value with AUC 0.997. It was sensitive enough to make early screen practicable for MCI patient.
However, it must be noted that the serum samples used in this study were only clinically diagnosed and further studies will be necessary to evaluate their abilities of the early diagnose. In addition, independent validation of these miRs as biomarkers will also be required. Nonetheless, the present results suggested that the exosomal miRs in the serum were not only potential biomarker of AD early diagnosis, but might also provide novel insights into the screening and prevention of the diseases.
the National Research Foundation for the Doctoral Program of Higher Education of China 20121107110001
the National Natural Science Foundation of China 81472007
the National Key Research and Development Program of China 2016YFC1306300
the National Natural Science Foundation of China 81401734

 Quick Links
 DownLoad: