

-
In the electromagnetic spectrum, the region between the microwave and infrared regions is the terahertz (THz) region with a frequency extending from 100 GHz to 10 THz[1]. Before the 1990s, little was known about THz wave. In recent years, with the development of laser, quantum well and semiconductor technologies, stable and reliable excitation sources have been used to generate THz waves[2-4]. THz waves have many advantages, such as high penetration, high resolution, anti-stealth capabilities and low photon energy. THz waves could be used in diverse fields, such as national security, material analysis, nondestructive testing, scientific research and communication technology[5-8].
With the growth of THz wave technology, concerns about its biological safety and potential biological applications have been increasing. Therefore, the effects and influences of THz waves on living organisms need to be explored.
Similar to infrared waves and microwaves, the energy of THz waves can easily be absorbed by polar molecules, leading to heating of tissue and the production of noticeable thermal effects. A study showed that THz waves could generate noticeable thermal effects and upregulate the heat shock protein in mammalian cells[9]. Unlike infrared waves and microwaves, the transitions between different molecular vibrational and rotational energy levels might also play a role in the interactions of THz radiation and biological tissue[10]. Under the conditions of unchanged experimental temperature, it has been shown that THz wave exposure could influence gene expression and DNA replication[11, 12]. THz radiation might have some unique nonthermal effects on living organisms.
Previous studies have shown that the nervous system is very sensitive to electromagnetic radiation[13-15]. However, the effects of THz waves on the nervous system are unknown. Neurons are basic functional units of the nervous system[16]. Minor changes in the nervous system can cause significant emotional or functional changes in the entire body. Currently, the influence of THz waves on the nervous system is not clear. Therefore, we aimed to explore the effects of THz waves on neurons. We carried out an exploratory experiment. Neurobiological studies often use primary cultured neurons or neuron-like cells as research models[17, 18]. We used a variety of different types of neurons in our research, including 4 primary neurons (hippocampal neurons, cerebral cortical neurons, cerebellar neurons, and brainstem neurons) and 3 neuron-like cell lines (MN9D, PC12, and HT22 cells). MN9D cells are a murine mesencephalic cell line[19]. The PC12 cell line is derived from a mouse pheochromocytoma and has a reversible neuron-like response to nerve growth factor (NGF), which could induce the cells to become neuron-like cells[20]. HT22 cells are immortalized hippocampal neuronal cells[21].
After THz radiation, neurite growth, micromorphology, cell membrane roughness, and neurotransmitter changes (Glu, Gly, and Ala) were analyzed to evaluate the exposure effects. In the sensitive cells, analysis of the expression of synapse-related proteins (SYN and PSD95) was conducted to investigate the effects at the molecular level. This study aimed to guide and assist future studies on the biological effects of THz waves.
-
In our study, a QS2-180-HP source (Microtech Instruments, USA) was used to generate THz waves. The source was a quasi-optical source composed of a QS2-180 (OV-86) backward wave oscillator (BWO). It was tunable across the 96-180 GHz frequency range. It was a BWO-based THz source, and each frequency corresponded to a certain output power. We used 2 different exposure conditions (10 mW/0.17 THz and 50 mW/0.16 THz) in this study, and the exposure time are 6 min and 60 min.
We investigated 2 different exposure time groups (6 and 60 min) to explore the relationship between biological effects and exposure time, and investigated the 2 different exposure condition groups to find out the exposure condition of more obvious effects.
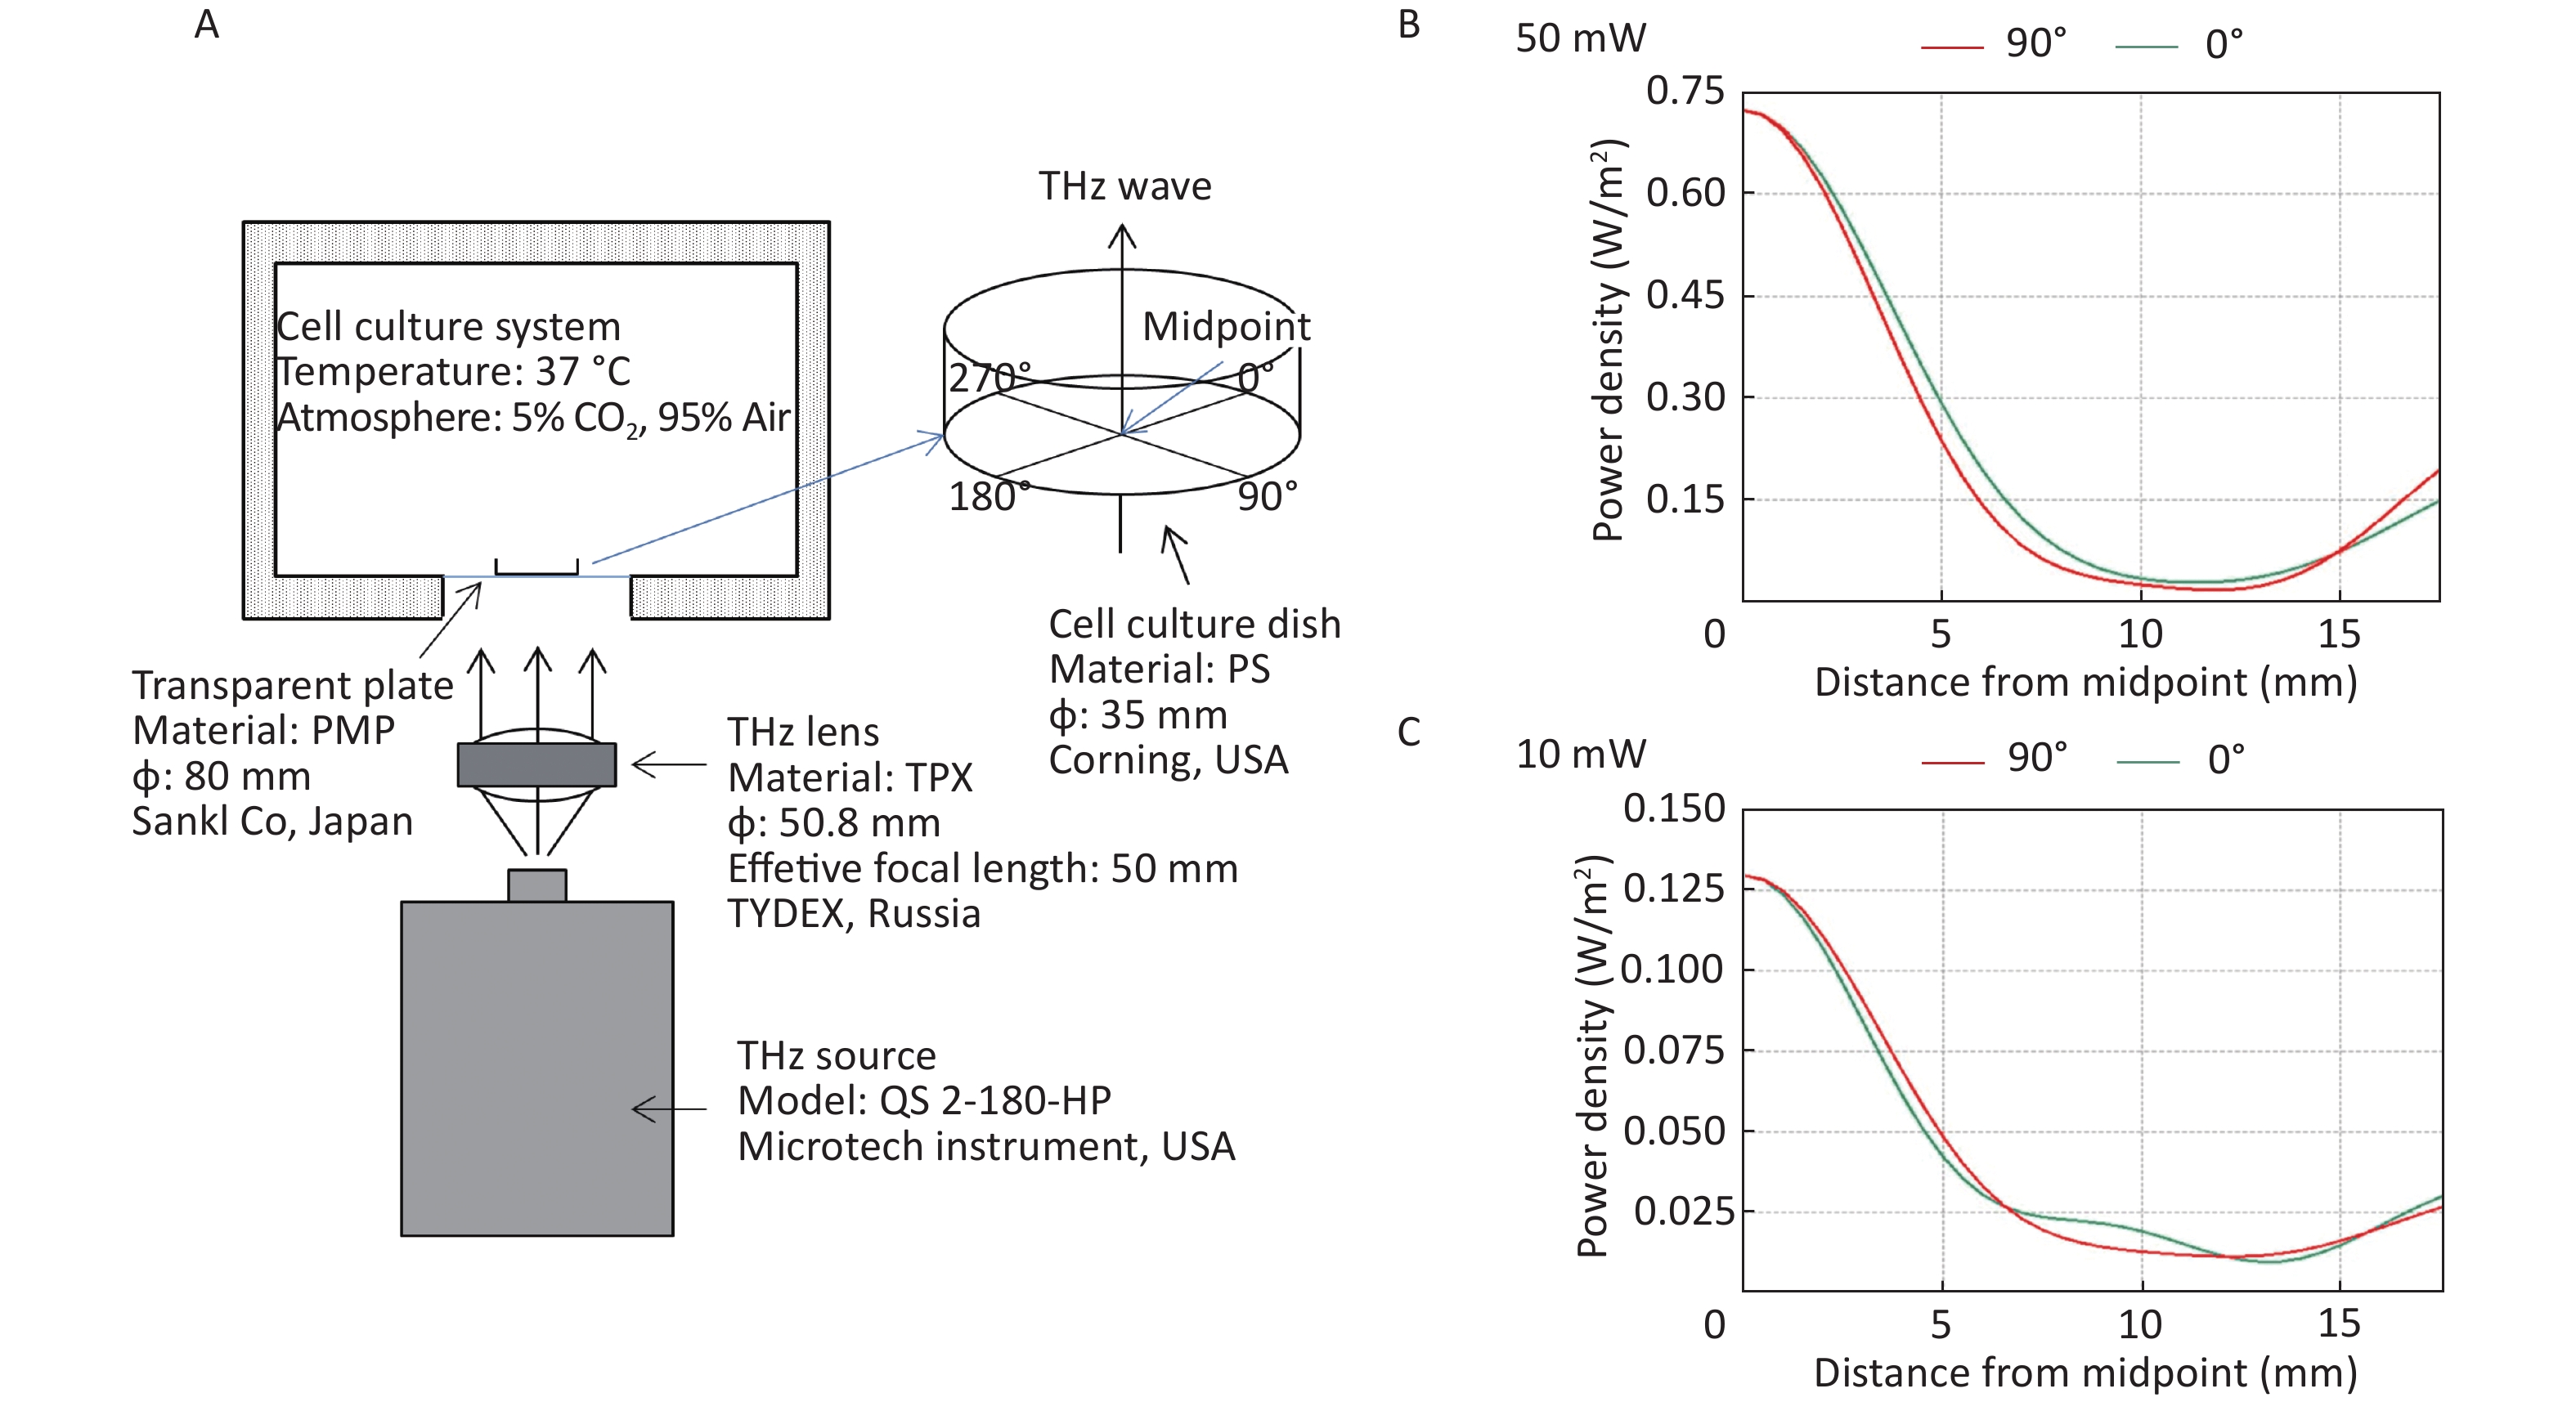
All the cells used in this experiment were adherent cells. To avoid the absorption of THz waves by cell culture medium, THz waves were emitted from the bottom of the culture dish (Figure 1A). A THz lens (TYDEX, Russia) was used to convert scattered light into parallel light. Then, a THz wave was emitted from the bottom into the 35 mm cell culture dish (Corning, USA) through a transparent plastic plate (Sanko, Japan). We calculated the energy distribution of THz waves from the bottom of cell culture dishes using FEKO software (EMSS, USA). FEKO is a widely used comprehensive computational electromagnetics software. Power density was arranged as concentric circles on the cell culture dish. We regarded the center of the cell culture dish as the midpoint. We calculated the power density curve along the radius of 0-degree and 90-degree angles. The power density curve of the 50 mW wave is shown in Figure 1B and that of the 10 mW wave is shown in Figure 1C. The power density distribution was at the bottom of the culture dish, and the THz wave transmittance of the culture dish was 93.33%.
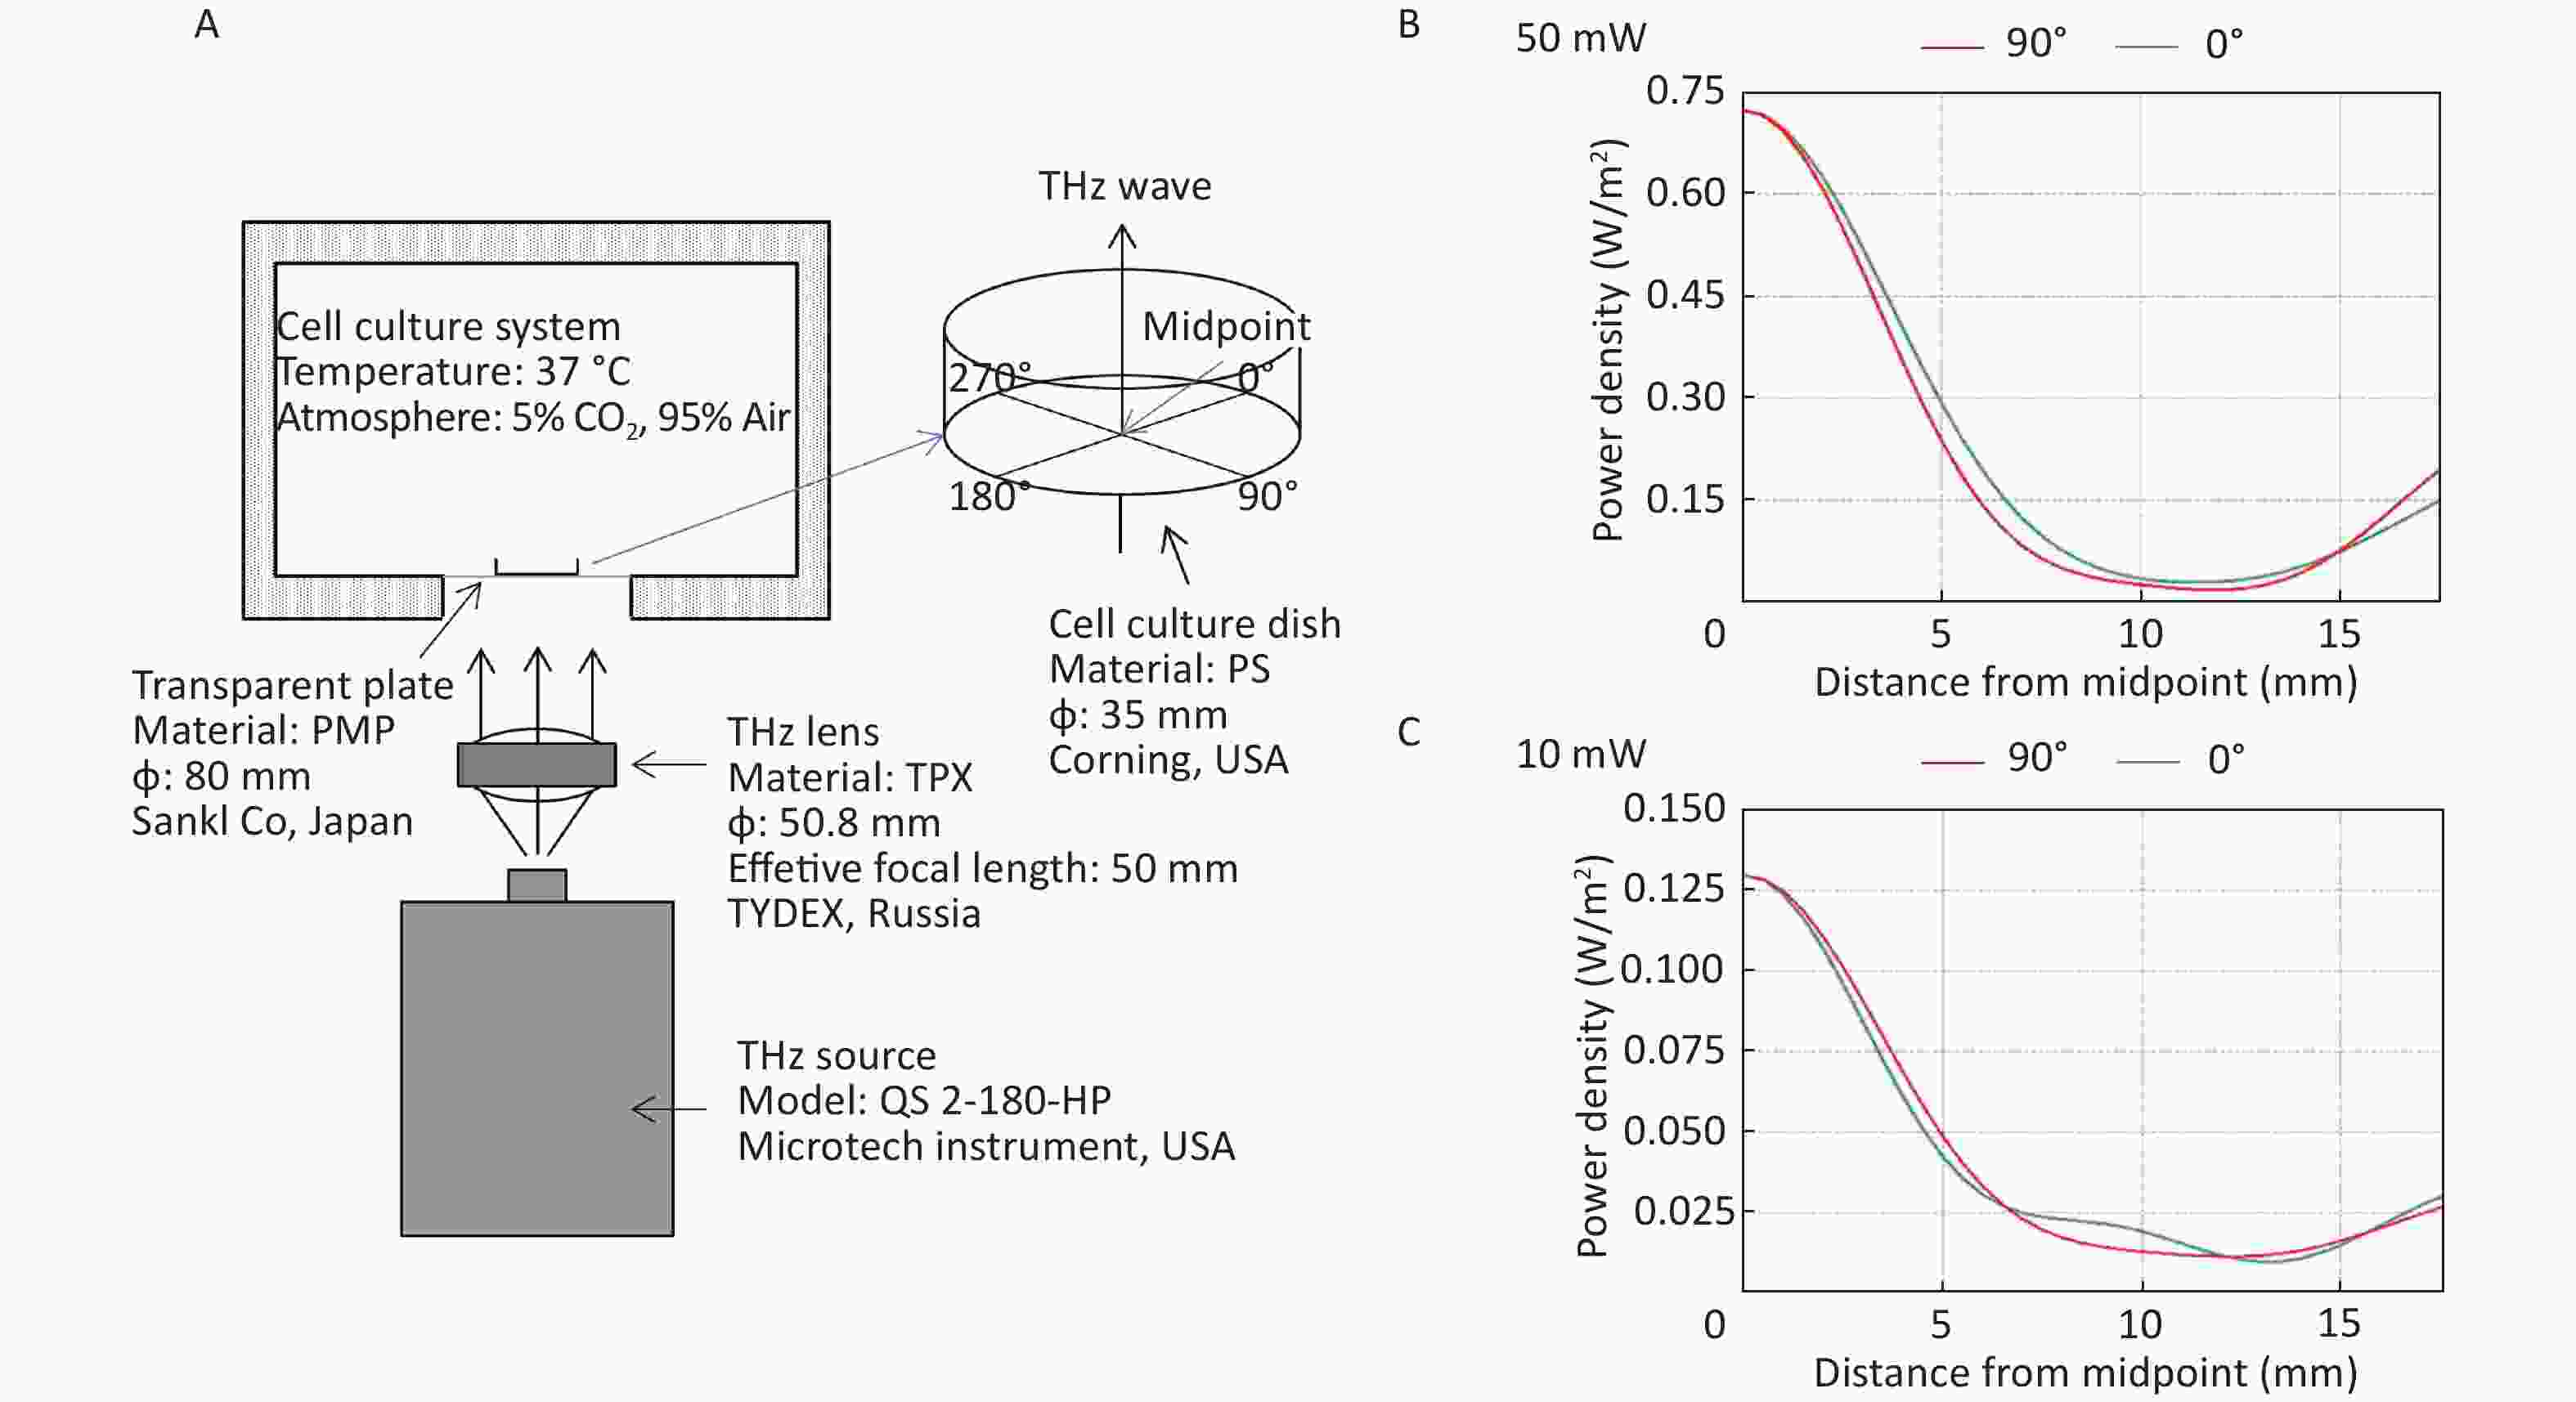
Figure 1. THz wave exposure system and power density distribution. (A) THz wave exposure system; (B) power density distribution at 0-degree and 90-degree angle radii of 50 mW wave exposure; and (C) power density distribution at 0-degree and 90-degree angle radii of 10 mW wave exposure.
According to the exposure time, there were 6 min exposure groups and 60 min exposure groups. There were 5 groups in total as follows: the control group (The control variables refer to all variables affecting experimental results except experimental factors, so the sham exposure groups were described as control group), the 50 mW (0.16 THz) wave with an exposure time of 6 min group (50 mW-6 min group), the 50 mW (0.16 THz) wave with an exposure time of 60 min group (50 mW-60 min group), the 10 mW (0.17 THz) wave with an exposure time of 6 min group (10 mW-6 min group) and the 10 mW (0.17 THz) wave with an exposure time of 60 min group (10 mW-60 min group, Table 1).
Group name Output power Frequency Exposure time Control group − − − 10 mW-6 min group 10 mW 0.17 THz 6 min 10 mW-60 min group 10 mW 0.17 THz 60 min 50 mW-6 min group 50 mW 0.16 THz 6 min 50 mW-60 min group 50 mW 0.16 THz 60 min Table 1. Exposure parameters of each group
For convenience, the frequency is omitted in the following description, and the radiation condition is represented by power.
-
A TH-212 smart temperature recorder (Beijing Hongou Cheng Yun Instrument Equipment, China) was used to analyze the temperature of the cell culture dish during exposure. The temperature recorder had a sensitivity of 0.01 ℃ and could accurately measure the temperature change of liquid in culture dishes. The detecting probe was placed in the bottom of the culture dish and submerged in the culture medium. Before analyzing the temperature, the culture dish was placed in the cell culture system for 5 h to reach a stable temperature. During exposure, the temperature change was obtained at 1, 2, 3, 4, 5, 6, 10, 20, 30, 40, 50, and 60 min.
-
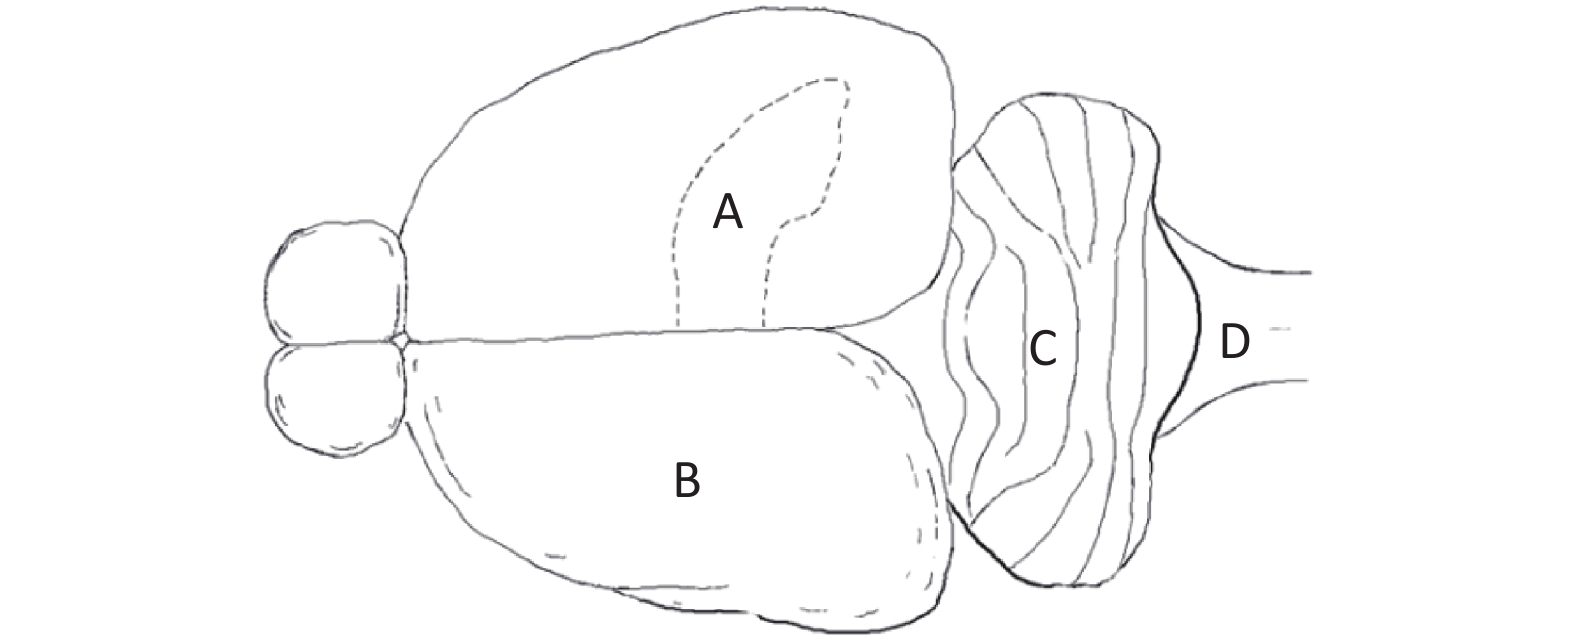
Primary Neuron Culture First, neonatal Wistar rats (born within 12 h) were immersed in 75% alcohol for disinfection. Then, the rats were sacrificed, and the brain was harvested under aseptic conditions. Under a dissecting microscope, the hippocampus (Figure 2A), cerebral cortex (Figure 2B), cerebellum (Figure 2C) and brainstem (Figure 2D) were separated. Then, the separated brain regions were digested and dispersed. The cell suspension was diluted with cell culture medium to a density of 5 × 10⁵ cells/mL and inoculated into a 35 mm culture dish for culture.
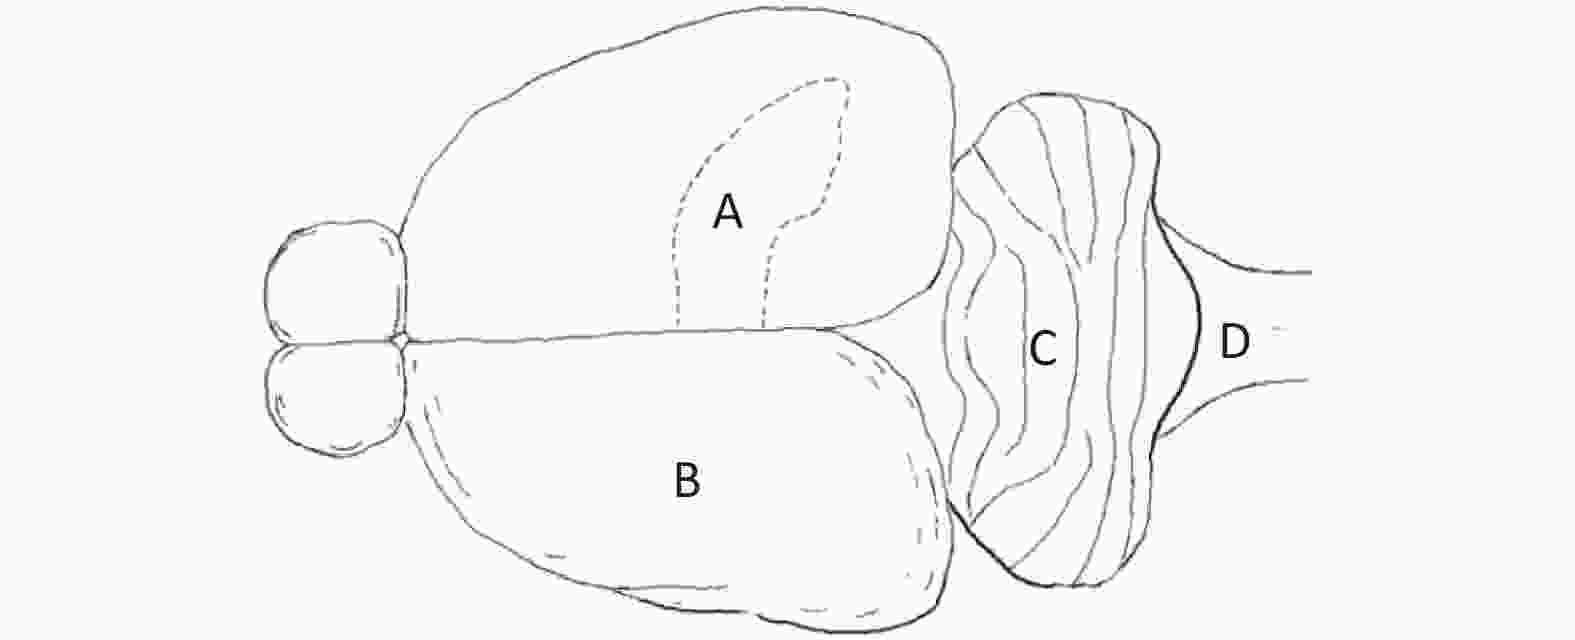
Figure 2. Sources of primary cultured neurons in a neonatal rat brain. (A) Hippocampus, (B) cerebral cortex, (C) cerebellum, and (D) brainstem.
PC12 Cell Culture and Induction After removal from liquid nitrogen, the cells were rewarmed with 37 ℃ water. Then, the cells were separated from frozen liquid by centrifugation (1,000 rpm, 10 min). The cells were cultured in 1640 medium (Gibco, USA) supplemented with 10% horse serum (Gibco, USA), 5% fetal bovine serum (Kangyuan Biology, China) and 1% penicillin (Hyclone, USA). After 3 generations, neuron growth factor (NGF, Sigma, USA) at 5 ng/mL was used to induce PC12 cell differentiation and neurite outgrowth. After 5 d of induction, the induced cells were used for experiments.
MN9D Cell Culture The cells were resuscitated from liquid nitrogen like PC12 cells. The cells were cultured in 1640 medium (Gibco, USA) supplemented with 10% fetal bovine serum (Kangyuan Biology, China) and 1% penicillin (Hyclone, USA). Cells were passaged when they had grown to 80% of the culture bottle. The cells were used for experiments after 3 generations.
HT22 Cell Culture The cells were resuscitated from liquid nitrogen like PC12 cells. The cells were cultured in Dulbecco’s Modified Eagle Medium (DMEM, Gibco) supplemented with 10% fetal bovine serum (Kangyuan Biology, China) and 1% penicillin (Hyclone, USA). Cells were passaged when they had grown to 80% of the culture bottle. The cells were used for experiments after 3 generations.
-
At 1, 2, and 3 d after THz wave radiation, neurite growth was observed with an IX70 inverted light microscope (LM) (Olympus, Japan), and images were randomly acquired at 8 fields of view in each group. Then, NeuronJ software (National Institutes of Health, USA) was used to trace and measure the neurites. The total length of neurites and the number of branches were counted.
-
In the SEM experiment, only the C group, the 10 mW-60 min group and the 50 mW-60 min group were investigated due to the restrictions on time and experimental conditions. At 3 d after THz wave radiation, prepared cells were fixed with 3% glutaraldehyde for 2 h and then rinsed in isotonic PBS buffer for 15 min 3 times. Then, the cells were dyed with 1% osmic acid at 4 ℃ for 2 h. Then, the samples were dehydrated with ethanol of different concentration gradients (50%, 70%, 80%, 90%, and 100%). After chemical desiccant treatment, the samples were stored in a desiccator. An S3400 scanning electron microscope (Hitachi, Japan) was used for micromorphology observation.
-
In the AFM experiment, only the C group, the 10 mW-60 min group and the 50 mW-60 min group were investigated due to the restrictions on time and experimental conditions. After 3 d of THz wave radiation, the cells in each group were fixed with 3% glutaraldehyde at 4 ℃ for 2 h. The fixed cells were rinsed with double distilled water for 5 seconds. The cells were analyzed after drying. Fifteen locations were randomly analyzed on the cell membrane surface by AFM (Nano Wizard, JPK Instruments, Germany). The Ra value is the arithmetic average of the height of each point on the contour in the range of the measurement and can be used to evaluate the surface roughness of the cell membrane.
-
Immediately after THz wave exposure, we collected the cell culture medium and kept it at −20 ℃. The contents of glutamic acid (Glu), glycine (Gly) and alanine (Ala) in the cell culture medium were analyzed using an Agilent 1100 HPLC (Agilent, USA).
-
The expression of SYN and PSD95 in primary cultured hippocampal and cortical neurons and MN9D cells was analyzed by IF. At 3 d after exposure, the cells were labeled with rabbit anti-rat SYN and PSD95 monoclonal antibodies (Abcam, England) overnight at 4 ℃ and then incubated with FITC-conjugated goat anti-rabbit IgG secondary antibodies (ZSGB-BIO, China) for 1 h at room temperature. SYN and PSD95 expression was observed by confocal laser scanning microscopy (LSM 880, Zeiss, Germany) after DAPI staining. The integrated optical density (IOD) of SYN and PSD95 was analyzed using Image Pro Plus software (Media Cybernetics, USA).
-
In the entire experimental design, there were 2 single-factor designs as follows: 50 mW (0.16 THz) THz wave exposure for 0, 6, and 60 min (C, 50 mW-6 min, and 50 mW-60 min, respectively) and 10 mW (0.17 THz) THz wave exposure for 0, 6, and 60 min (C, 10 mW-6 min, and 10 mW-60 min, respectively). The 2 single-factor designs shared 1 control group, but the statistics were analyzed separately. At the same exposure time, independent sample t-tests were used to determine the effects between the 50 and 10 mW groups (50 mW-6 min and 10 mW-6 min; and 50 mW-60 min and 10 mW-60 min).
The results were statistically analyzed using SPSS 19.0 software and single-factor ANOVA with a 95% confidence interval. According to the comparison target and meanings, significance markers were classified as follows: significant exposure effects, *P < 0.05 and **P < 0.01 (vs. Control); significant exposure time-dependent effects, #P < 0.05 and ##P < 0.01 (50 mW-60 min vs. 50 mW-6 min and 10 mW-60 min vs. 10 mW-6 min); and significant different effects between 10 mW (0.17 THz) THz wave and 50 mW (0.16 THz) THz wave, △P < 0.05 and △△P < 0.01 (50 mW-6 min vs. 10 mW-6 min and 50 mW-60 min vs. 10 mW-60 min).
-
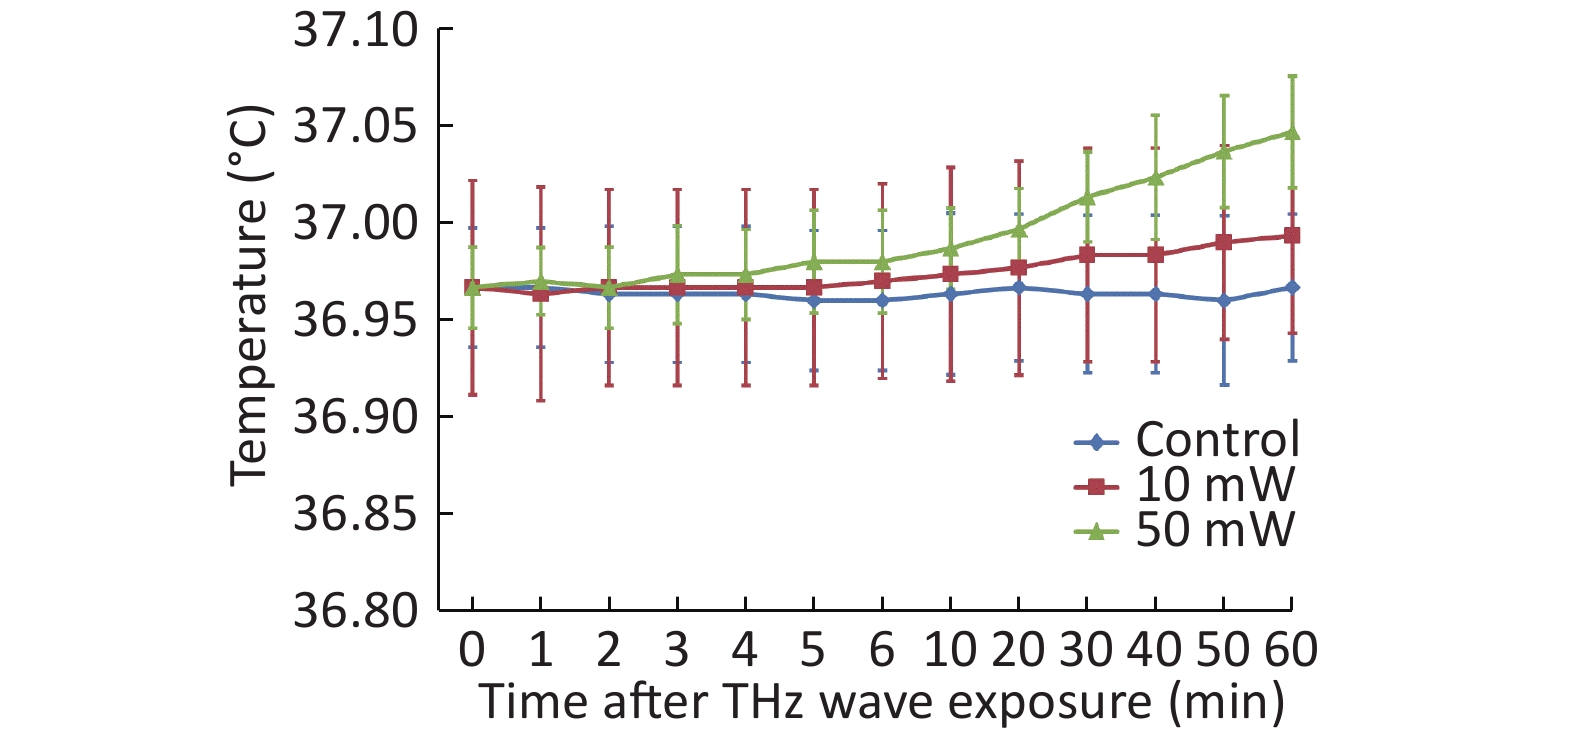
After the temperature measurement of the cell culture medium, we observed that the THz waves caused a slight temperature increase. The 50 mW THz wave exposure for 60 min increased the temperature by approximately 0.08 ℃, and the 10 mW THz wave exposure for 60 min increased the temperature by approximately 0.03 ℃. The temperature increase of the cell culture medium during THz wave exposure was less than 1 ℃ (Figure 3). The temperature change had a negligible effect on the cells. Therefore, the effects explored in this study were nonthermal effects.
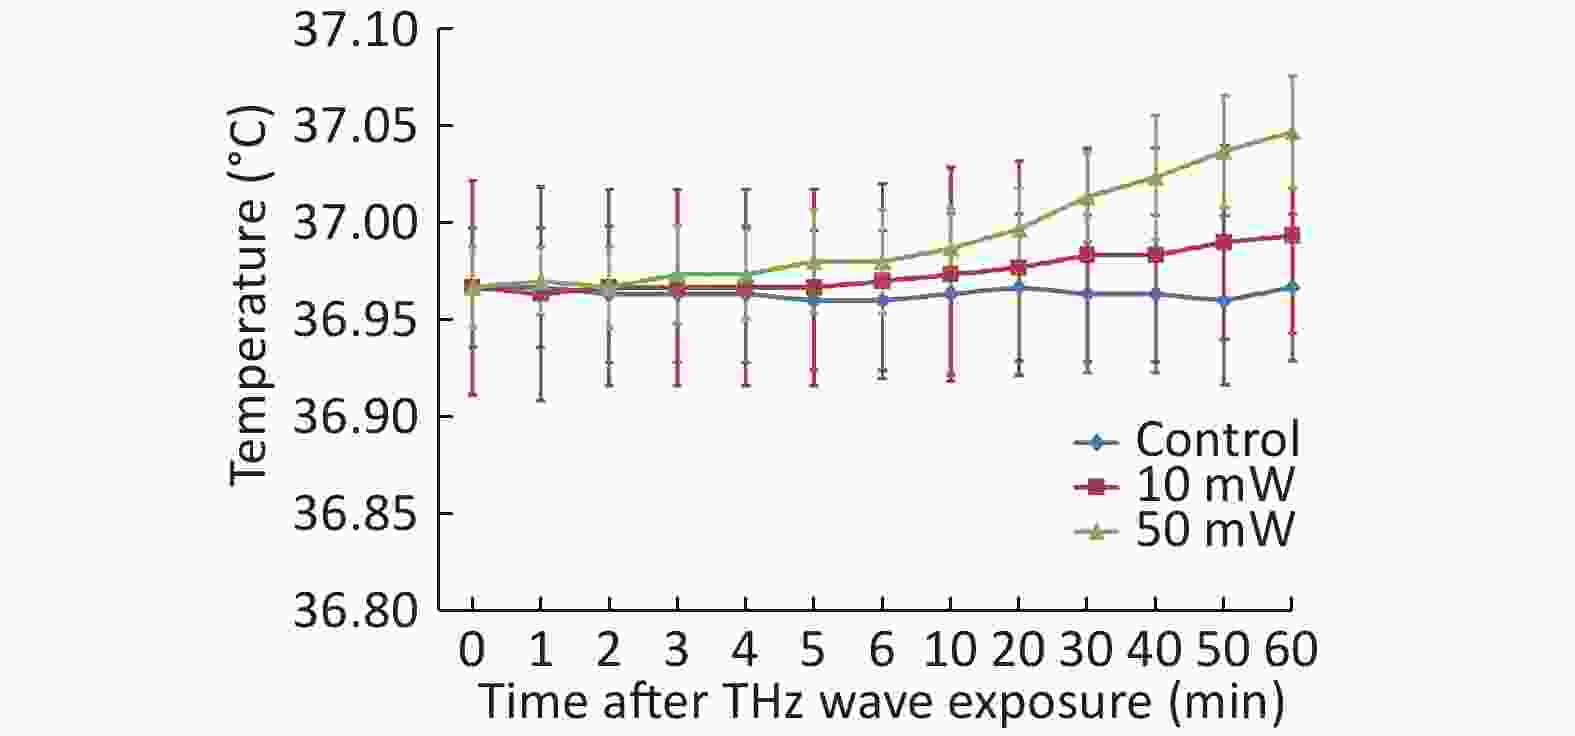
Figure 3. Temperature changes of culture medium after 50 and 10 mW THz wave exposure.
-
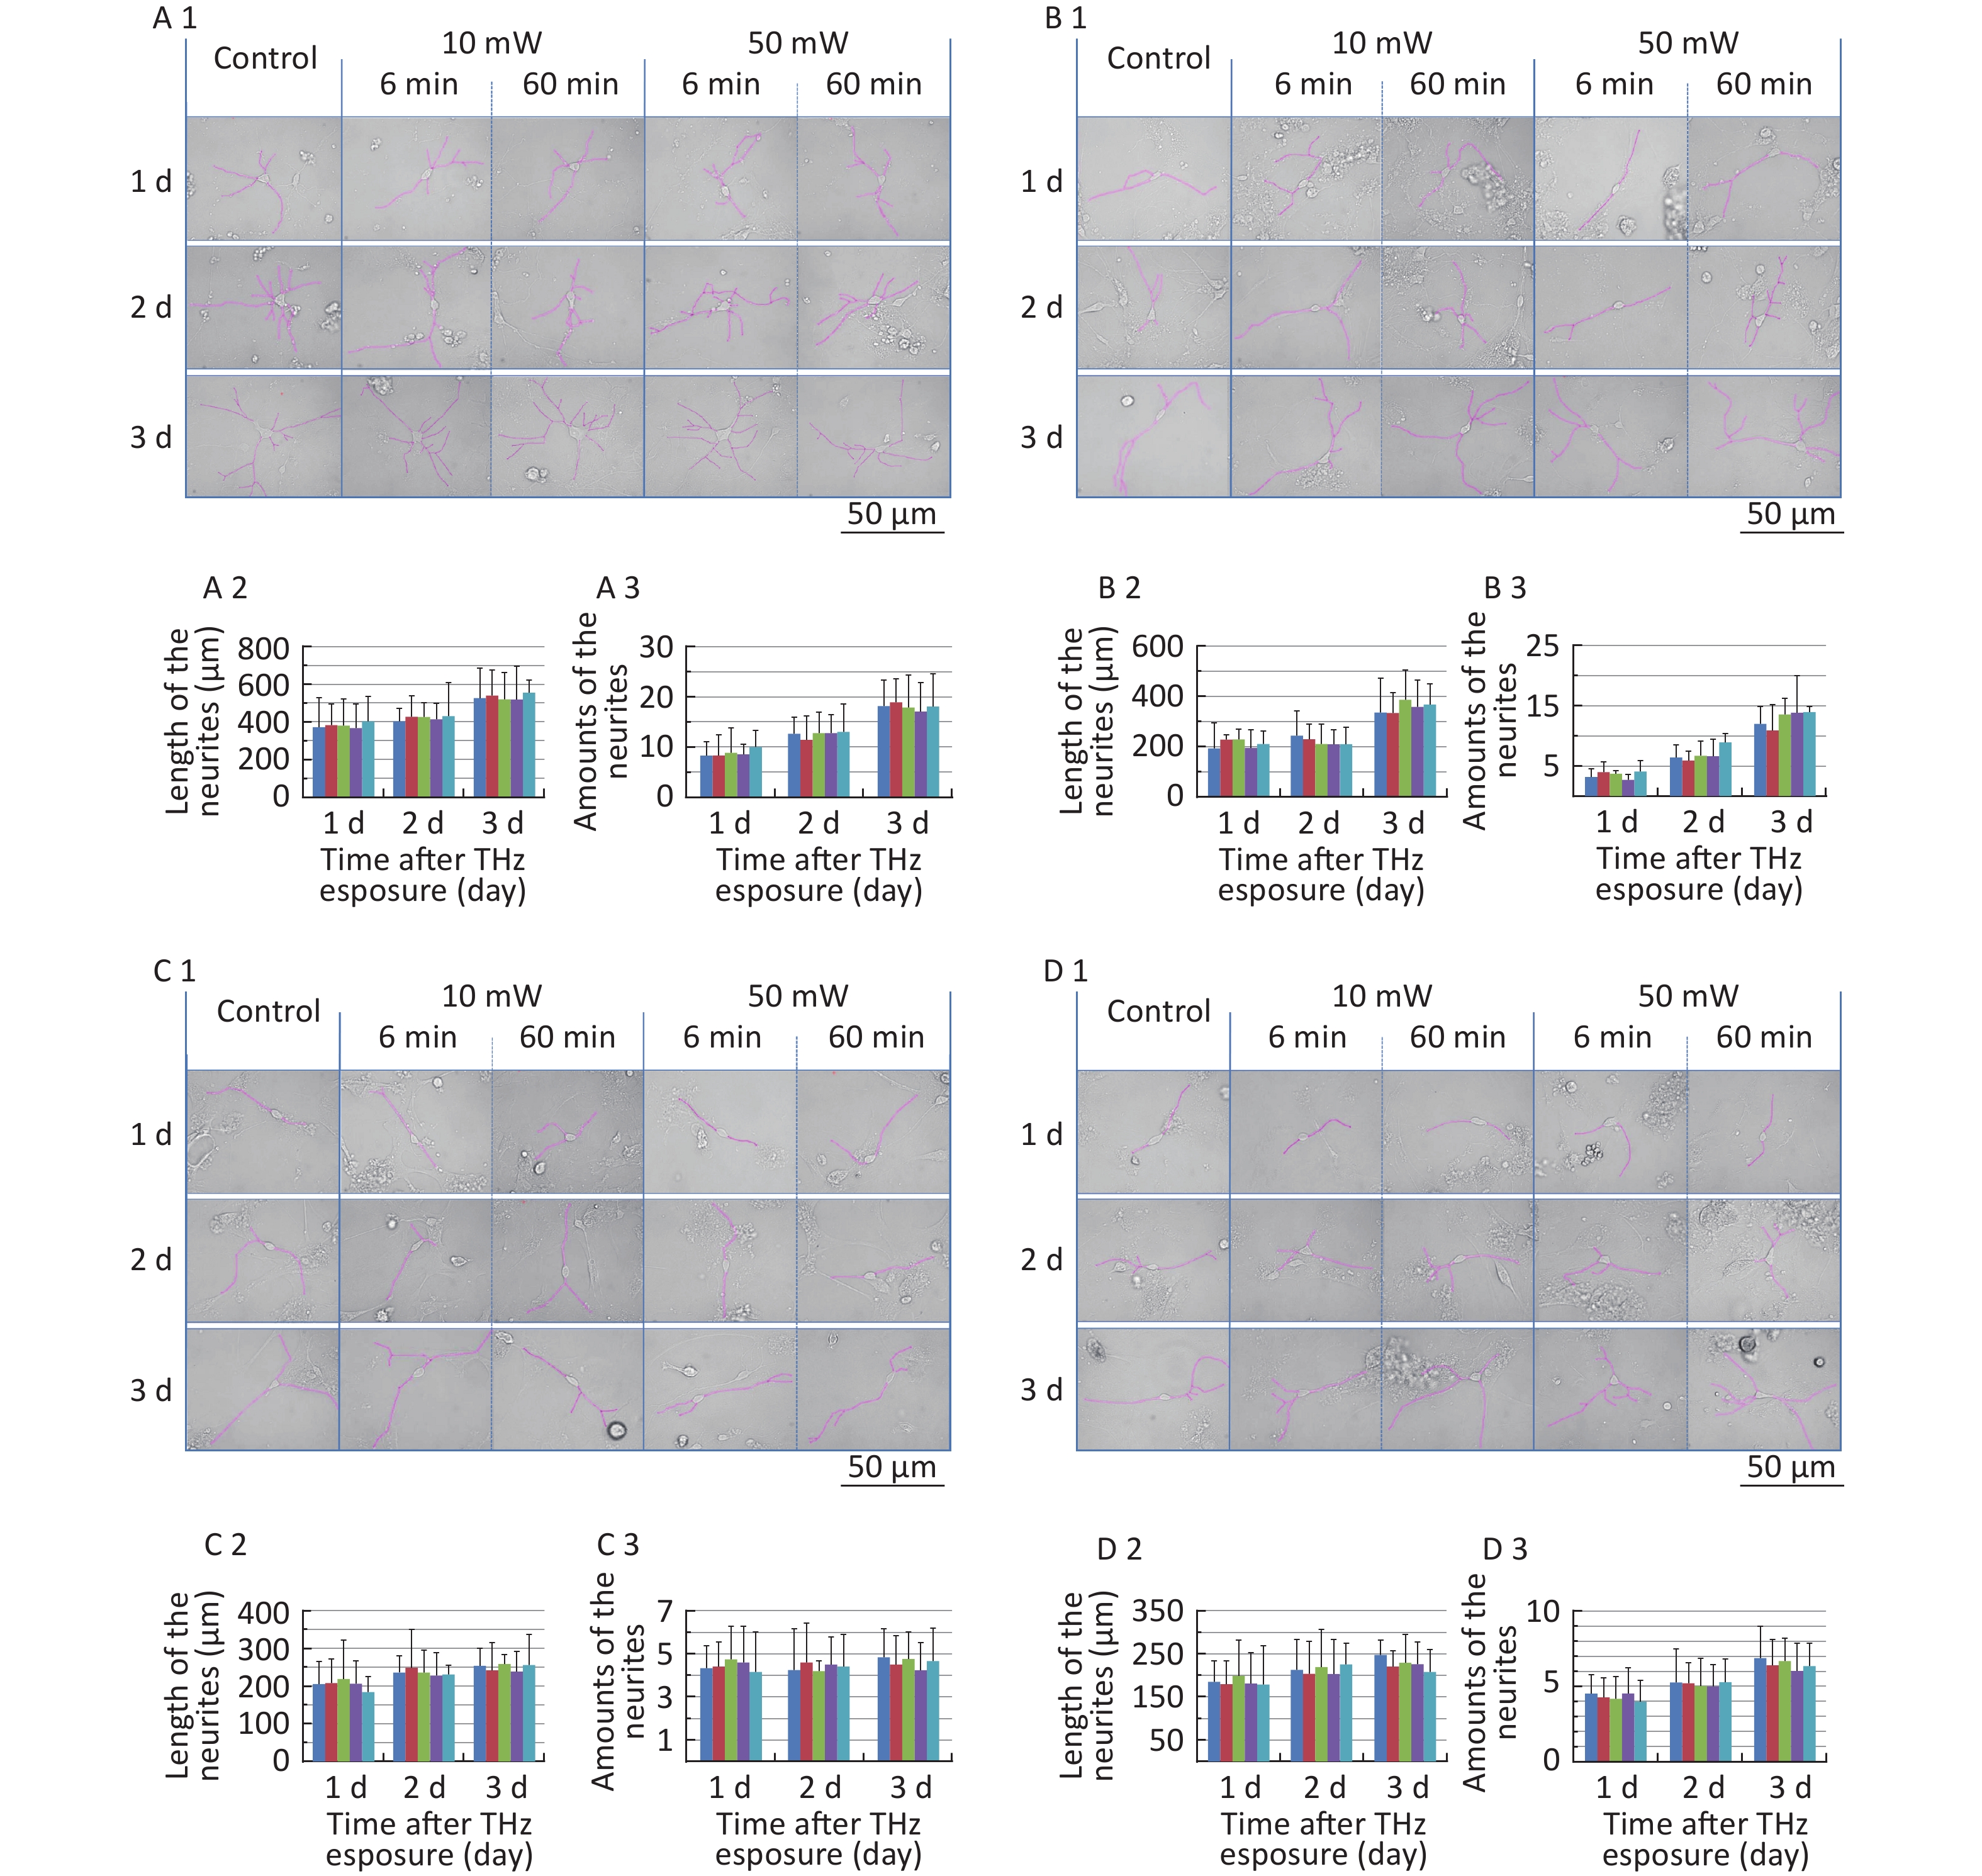
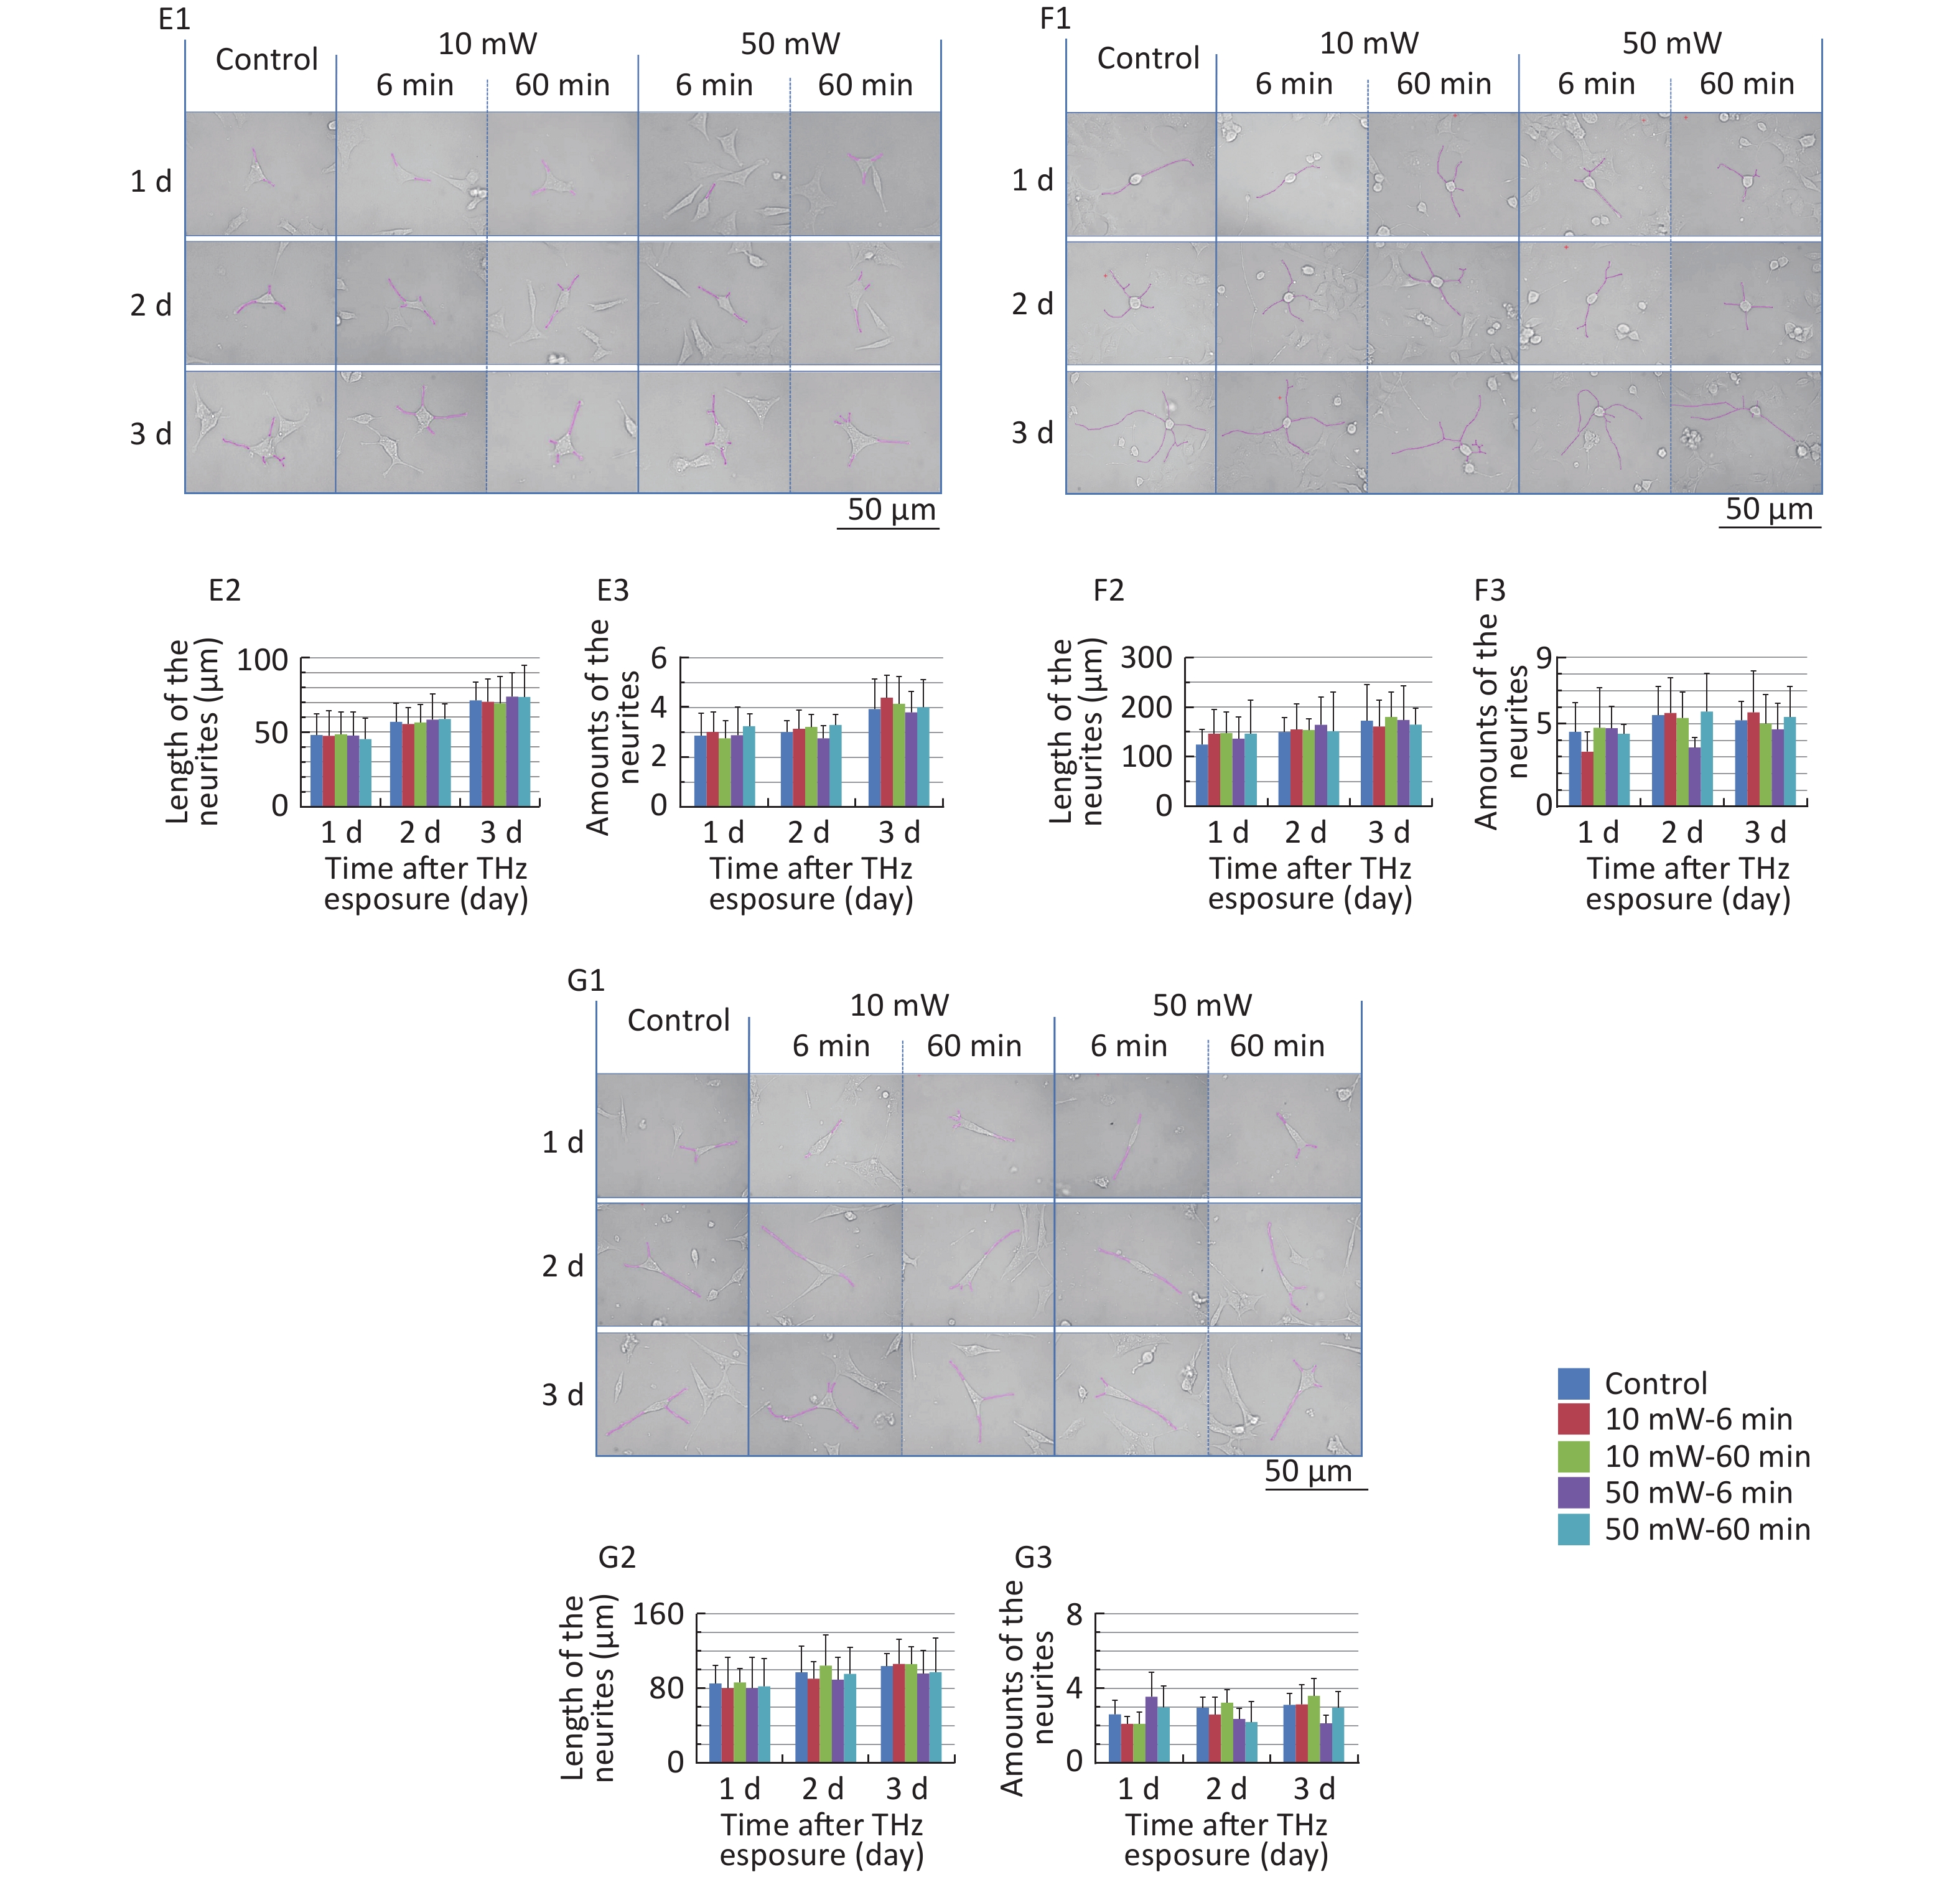
The classical morphology of neurons is neurites and branches. At 1, 2, and 3 d after THz wave exposure, we analyzed the total length and branch numbers of neurites in primary hippocampal (Figure 4, A1-A3), cortical (Figure 4, B1-B3), cerebellar (Figure 4, C1-C3) and brainstem cells (Figure 4, D1-D3) and MN9D (Figure 4, E1-E3), PC12 (Figure 4, F1-F3), and HT22 cells (Figure 4, G1-G3). As shown in Figure 4, the total length and branch numbers of neurites increased with increasing time after THz wave exposure.
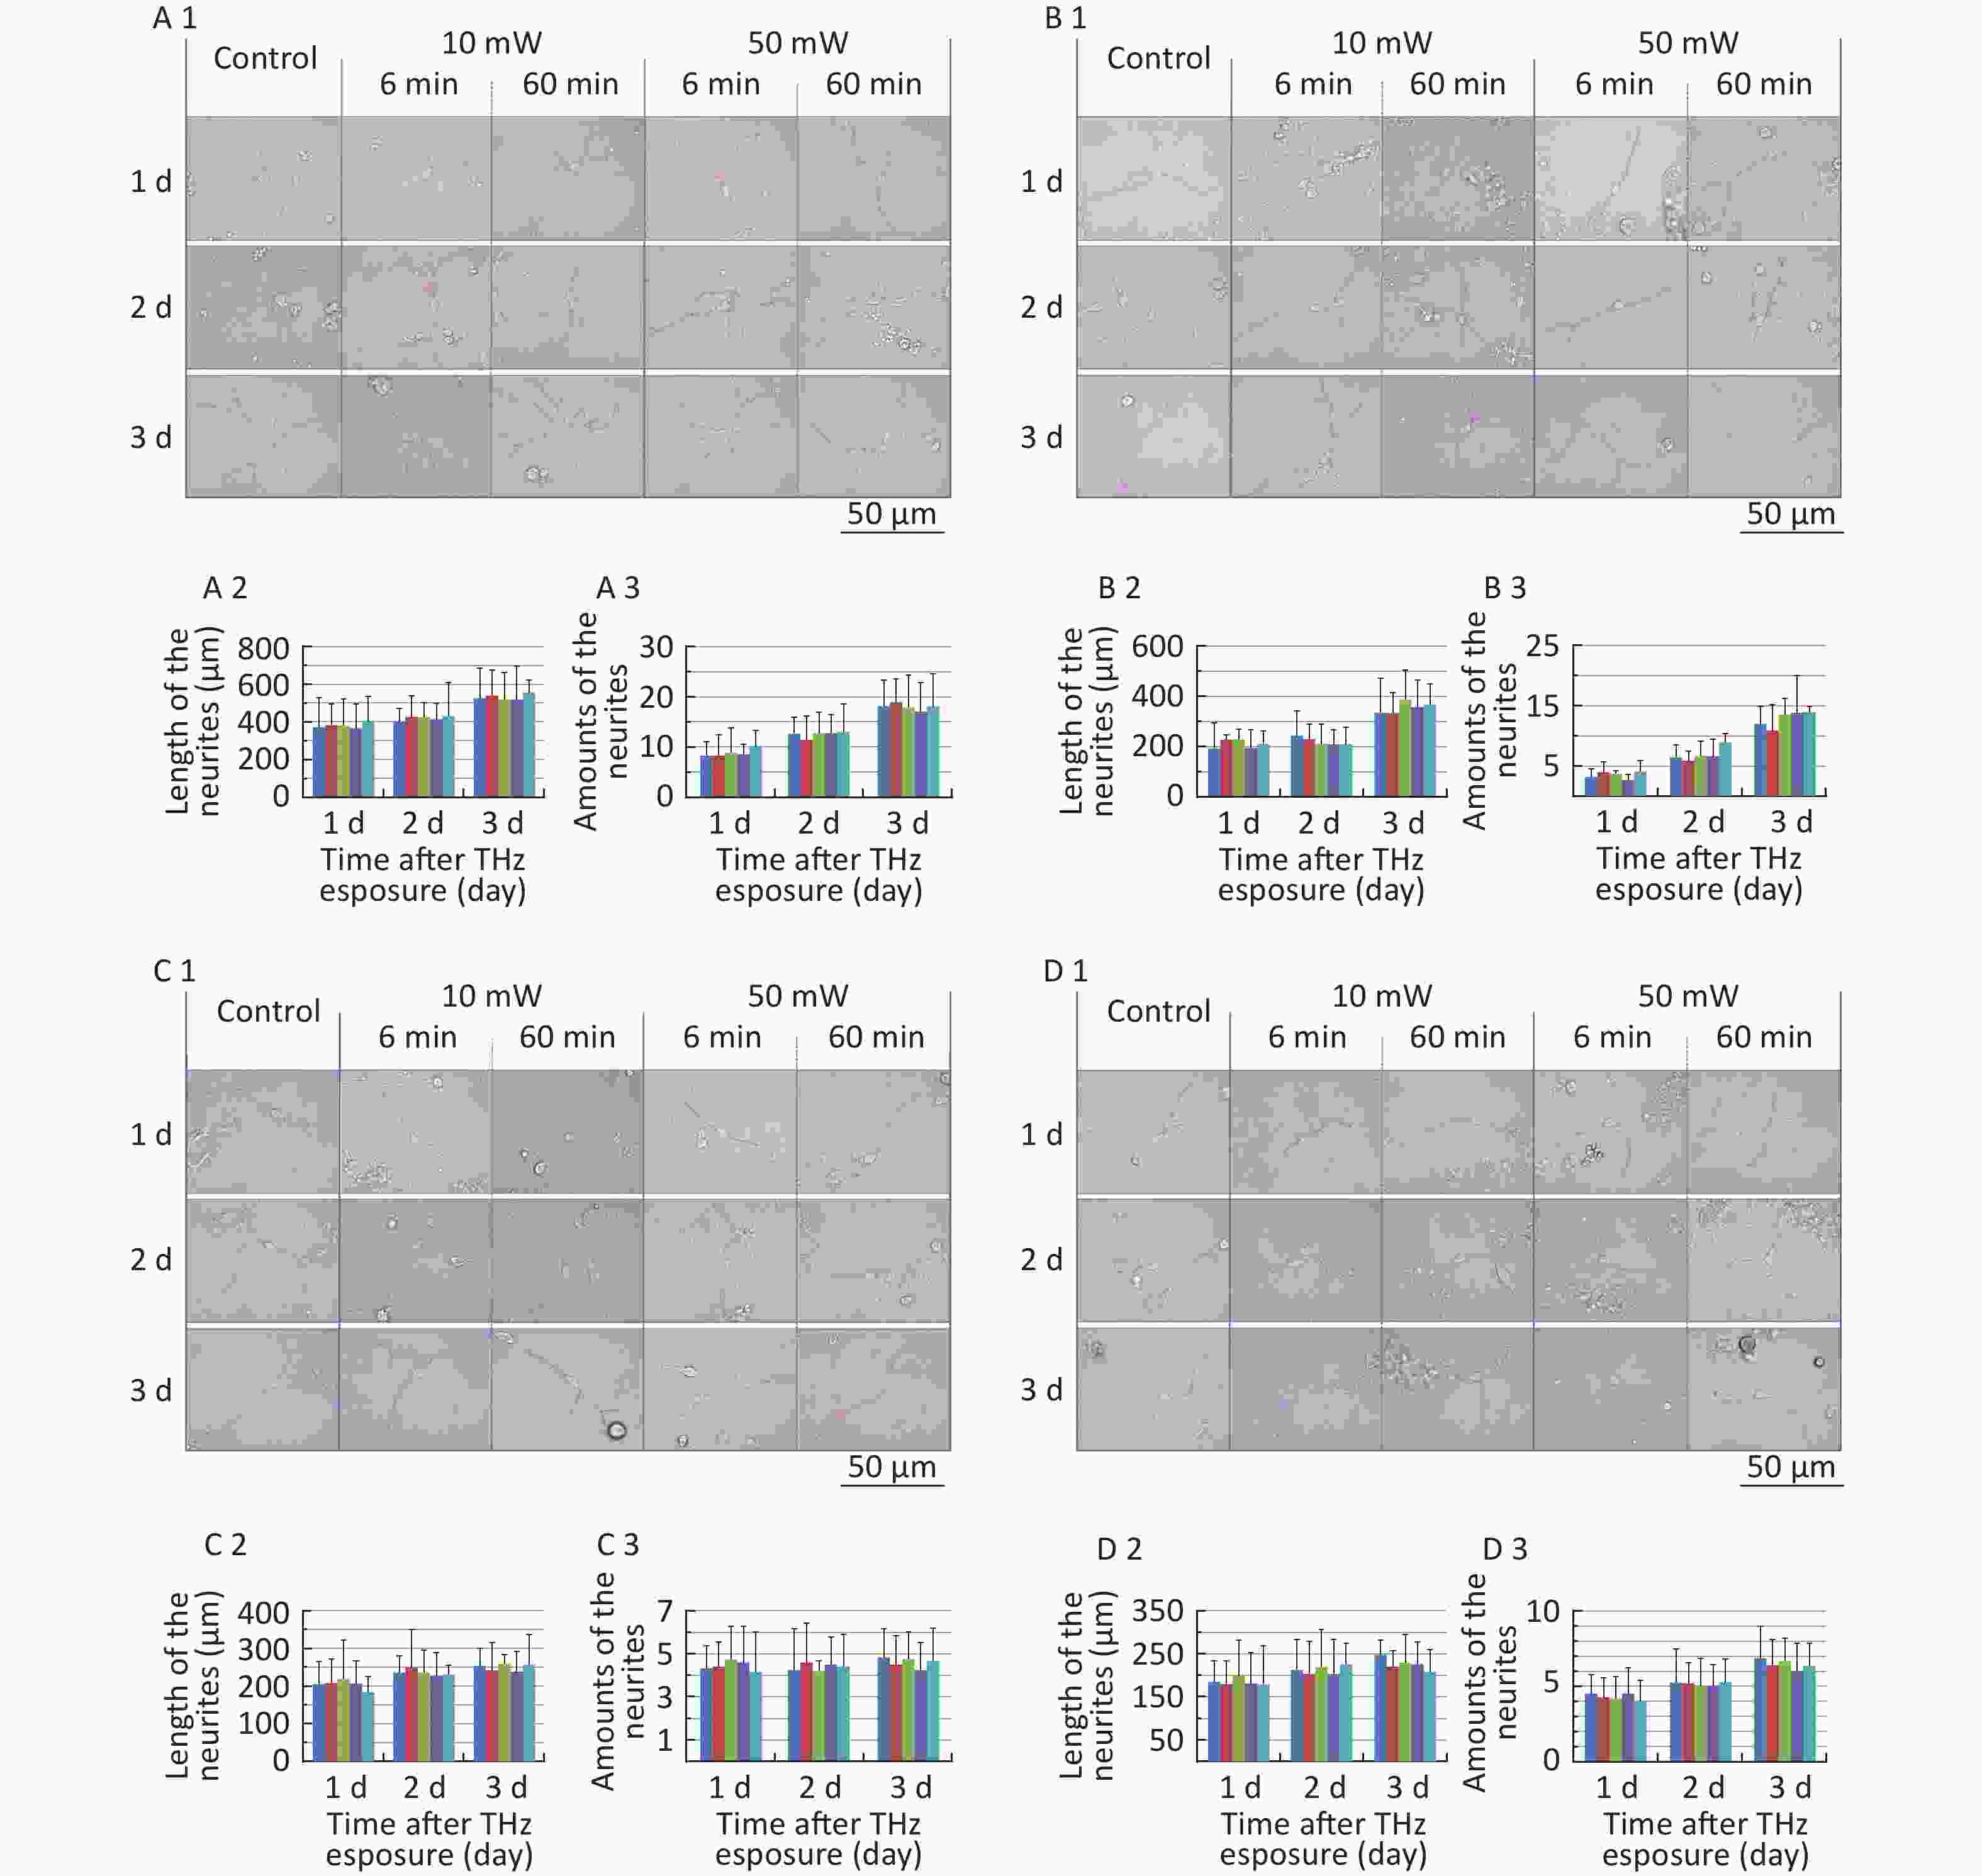
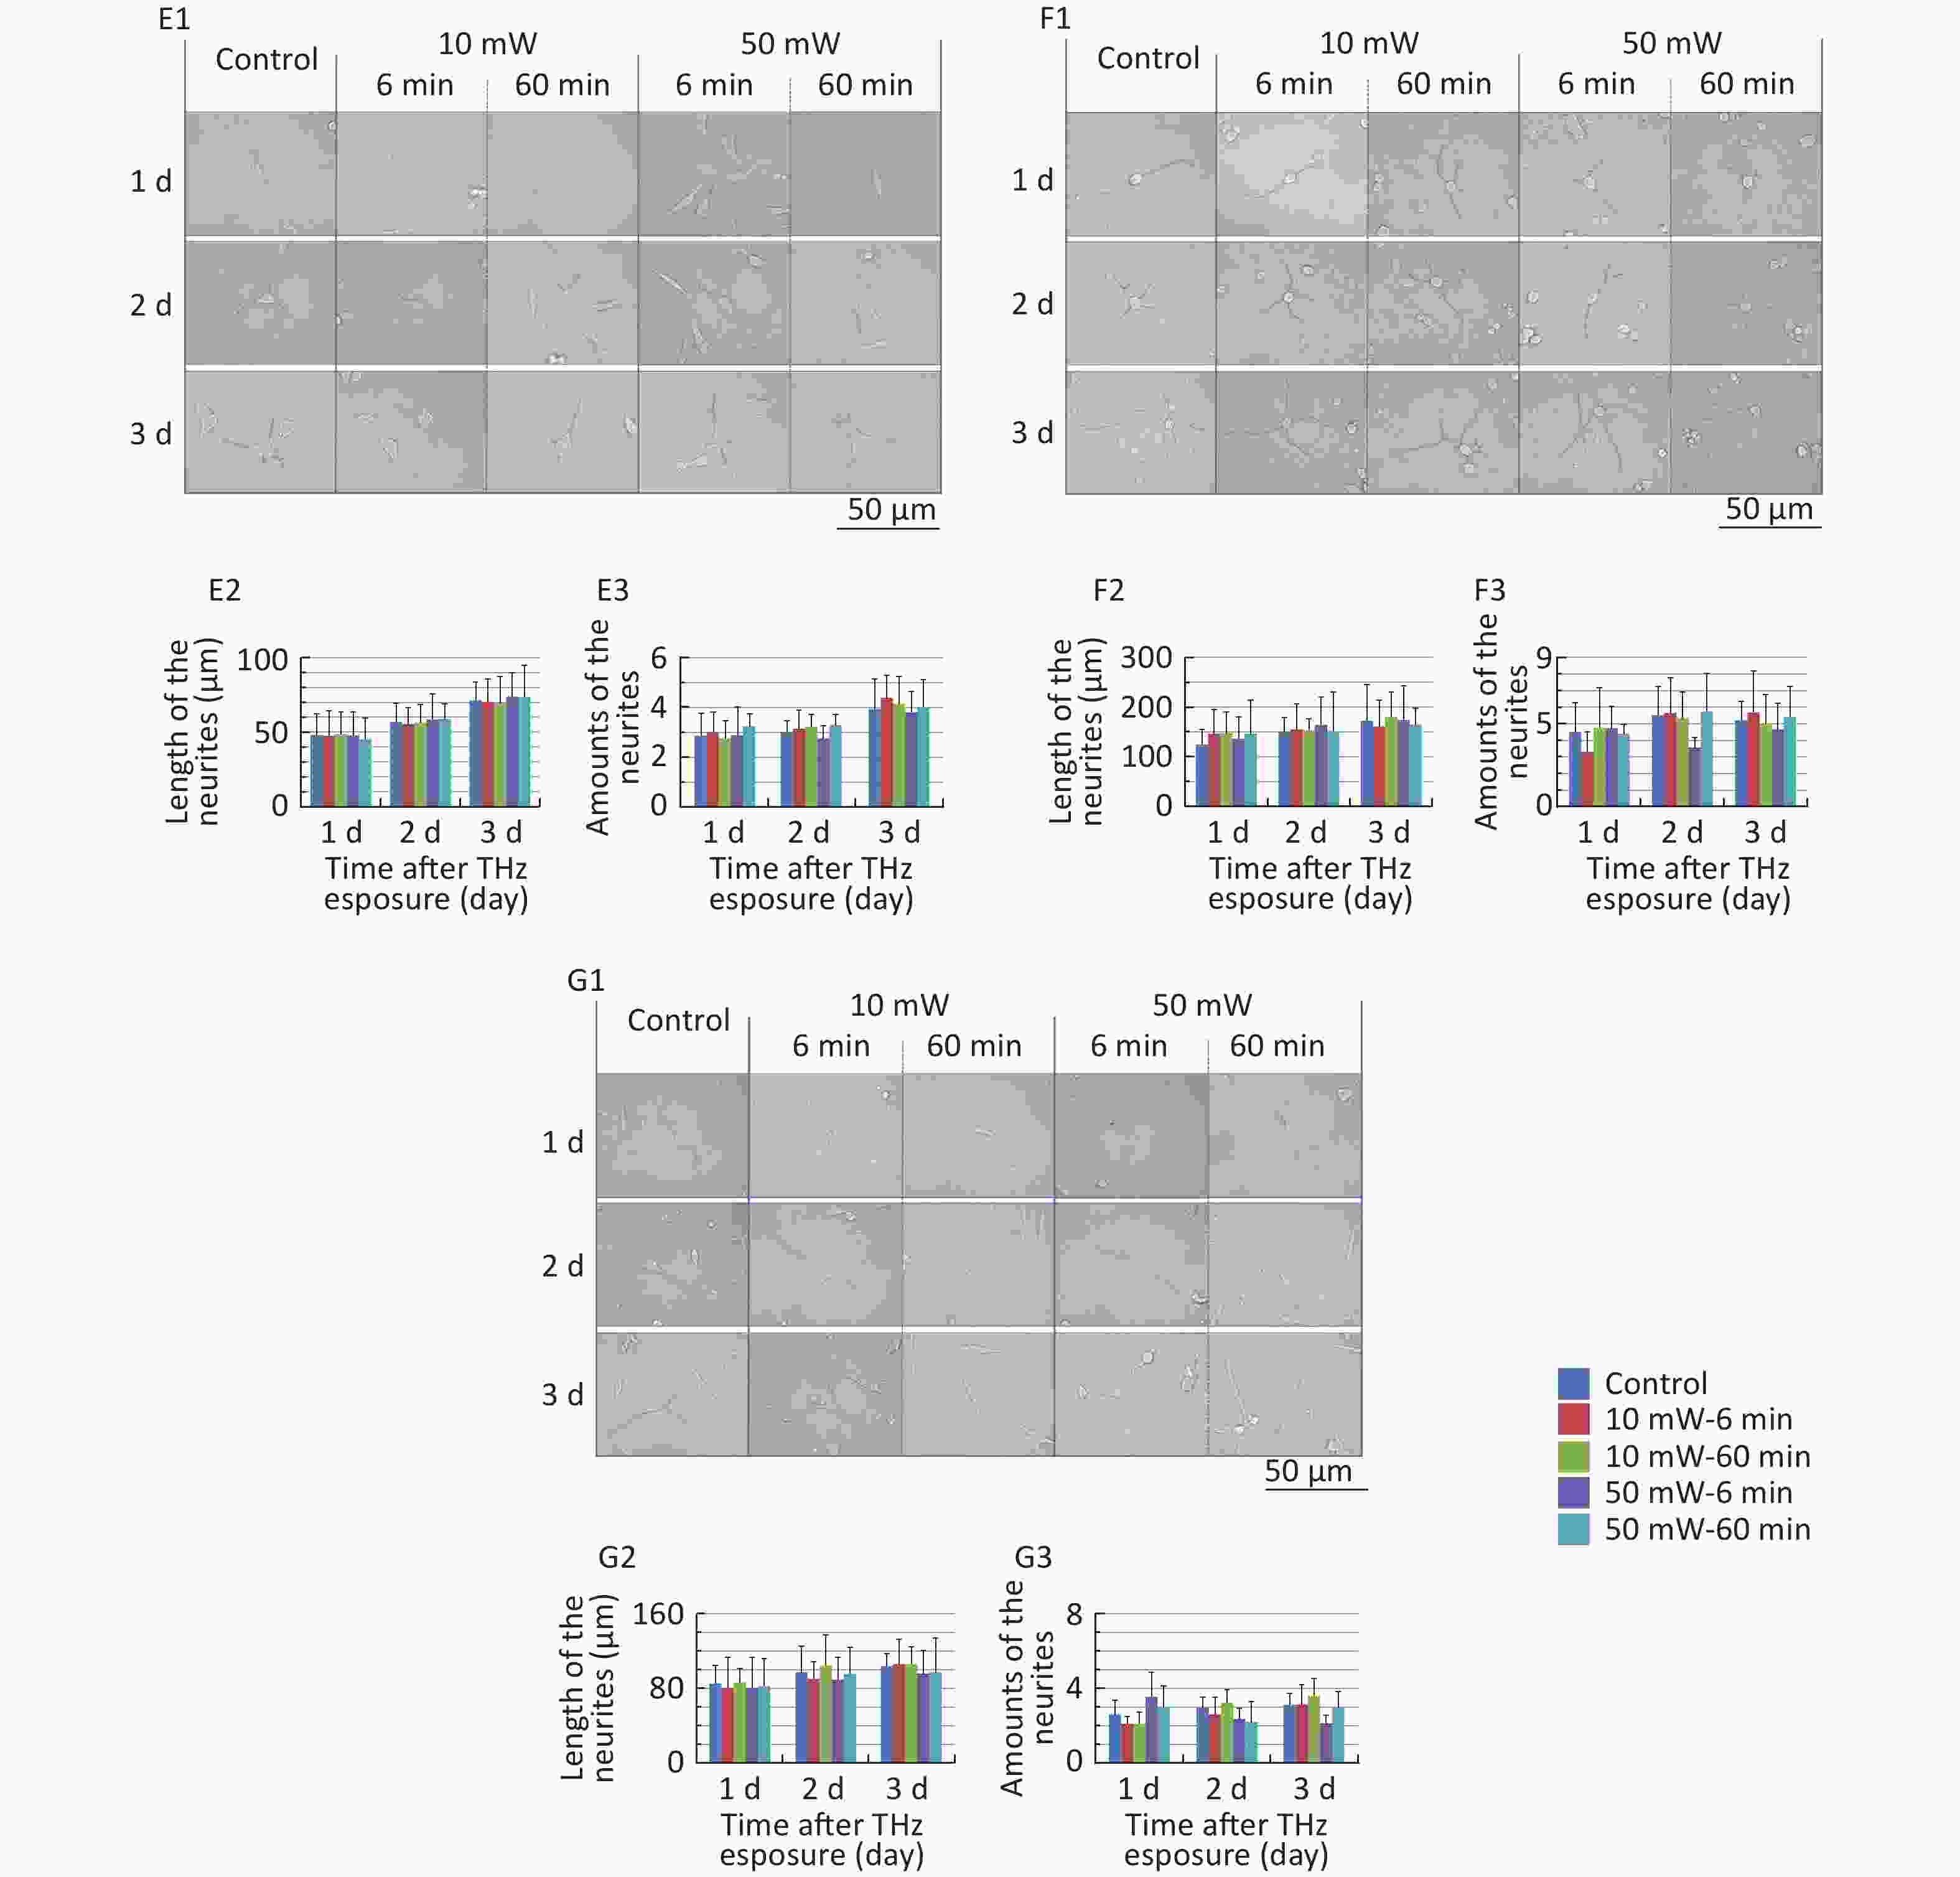
Figure 4. Total length and branch numbers of neurites in primary neurons and neuron-like cells after 50 and 10 mW THz wave exposure (LM, scale bar = 50 μm). (A1-A3) Primary hippocampus neurons; (B1-B3) primary cortical neurons; (C1-C3) primary cerebellar neurons; (D1-D3) primary brainstem neurons; (E1-E3) MN9D cells; (F1-F3) PC12 cells; (G1-G3) HT22 cells. For each kind of cell, 3 subfigures were shown as 1-3 as follows: (1) LM pictures; (2) total length at 1, 2, and 3 d after THz wave exposure; and (3) branch numbers at 1, 2, and 3 d after THz wave exposure.
In the abovementioned 7 kinds of cells, no significant differences in the total length and branch numbers of neurites were observed in the THz wave exposure groups compared with the Control group (50 mW-6 min, 50 mW-60 min, 10 mW-6 min, and 10 mW-60 min vs. Control).
Groups with different exposure times at the same THz wave were compared to elucidate the exposure time-effect relationship. No significant differences in the total length and branch numbers of neurites were observed in the 60 min exposure groups compared with the 6 min exposure groups (50 mW-60 min vs. 50 mW-6 min and 10 mW-60 min vs. 10 mW-6 min).
Groups with different THz wave at the same exposure time were also compared to find out the radiation conditions with obvious effects. No significant differences in the total length and branch numbers of neurites were observed in the 50 mW THz wave exposure groups compared with the 10 mW THz wave exposure groups (50 mW-60 min vs. 10 mW-60 min and 50 mW-6 min vs. 10 mW-6 min).
-
At 3 d after THz wave exposure, primary hippocampal and cortical cells and MN9D cells were fixed and examined by SEM.
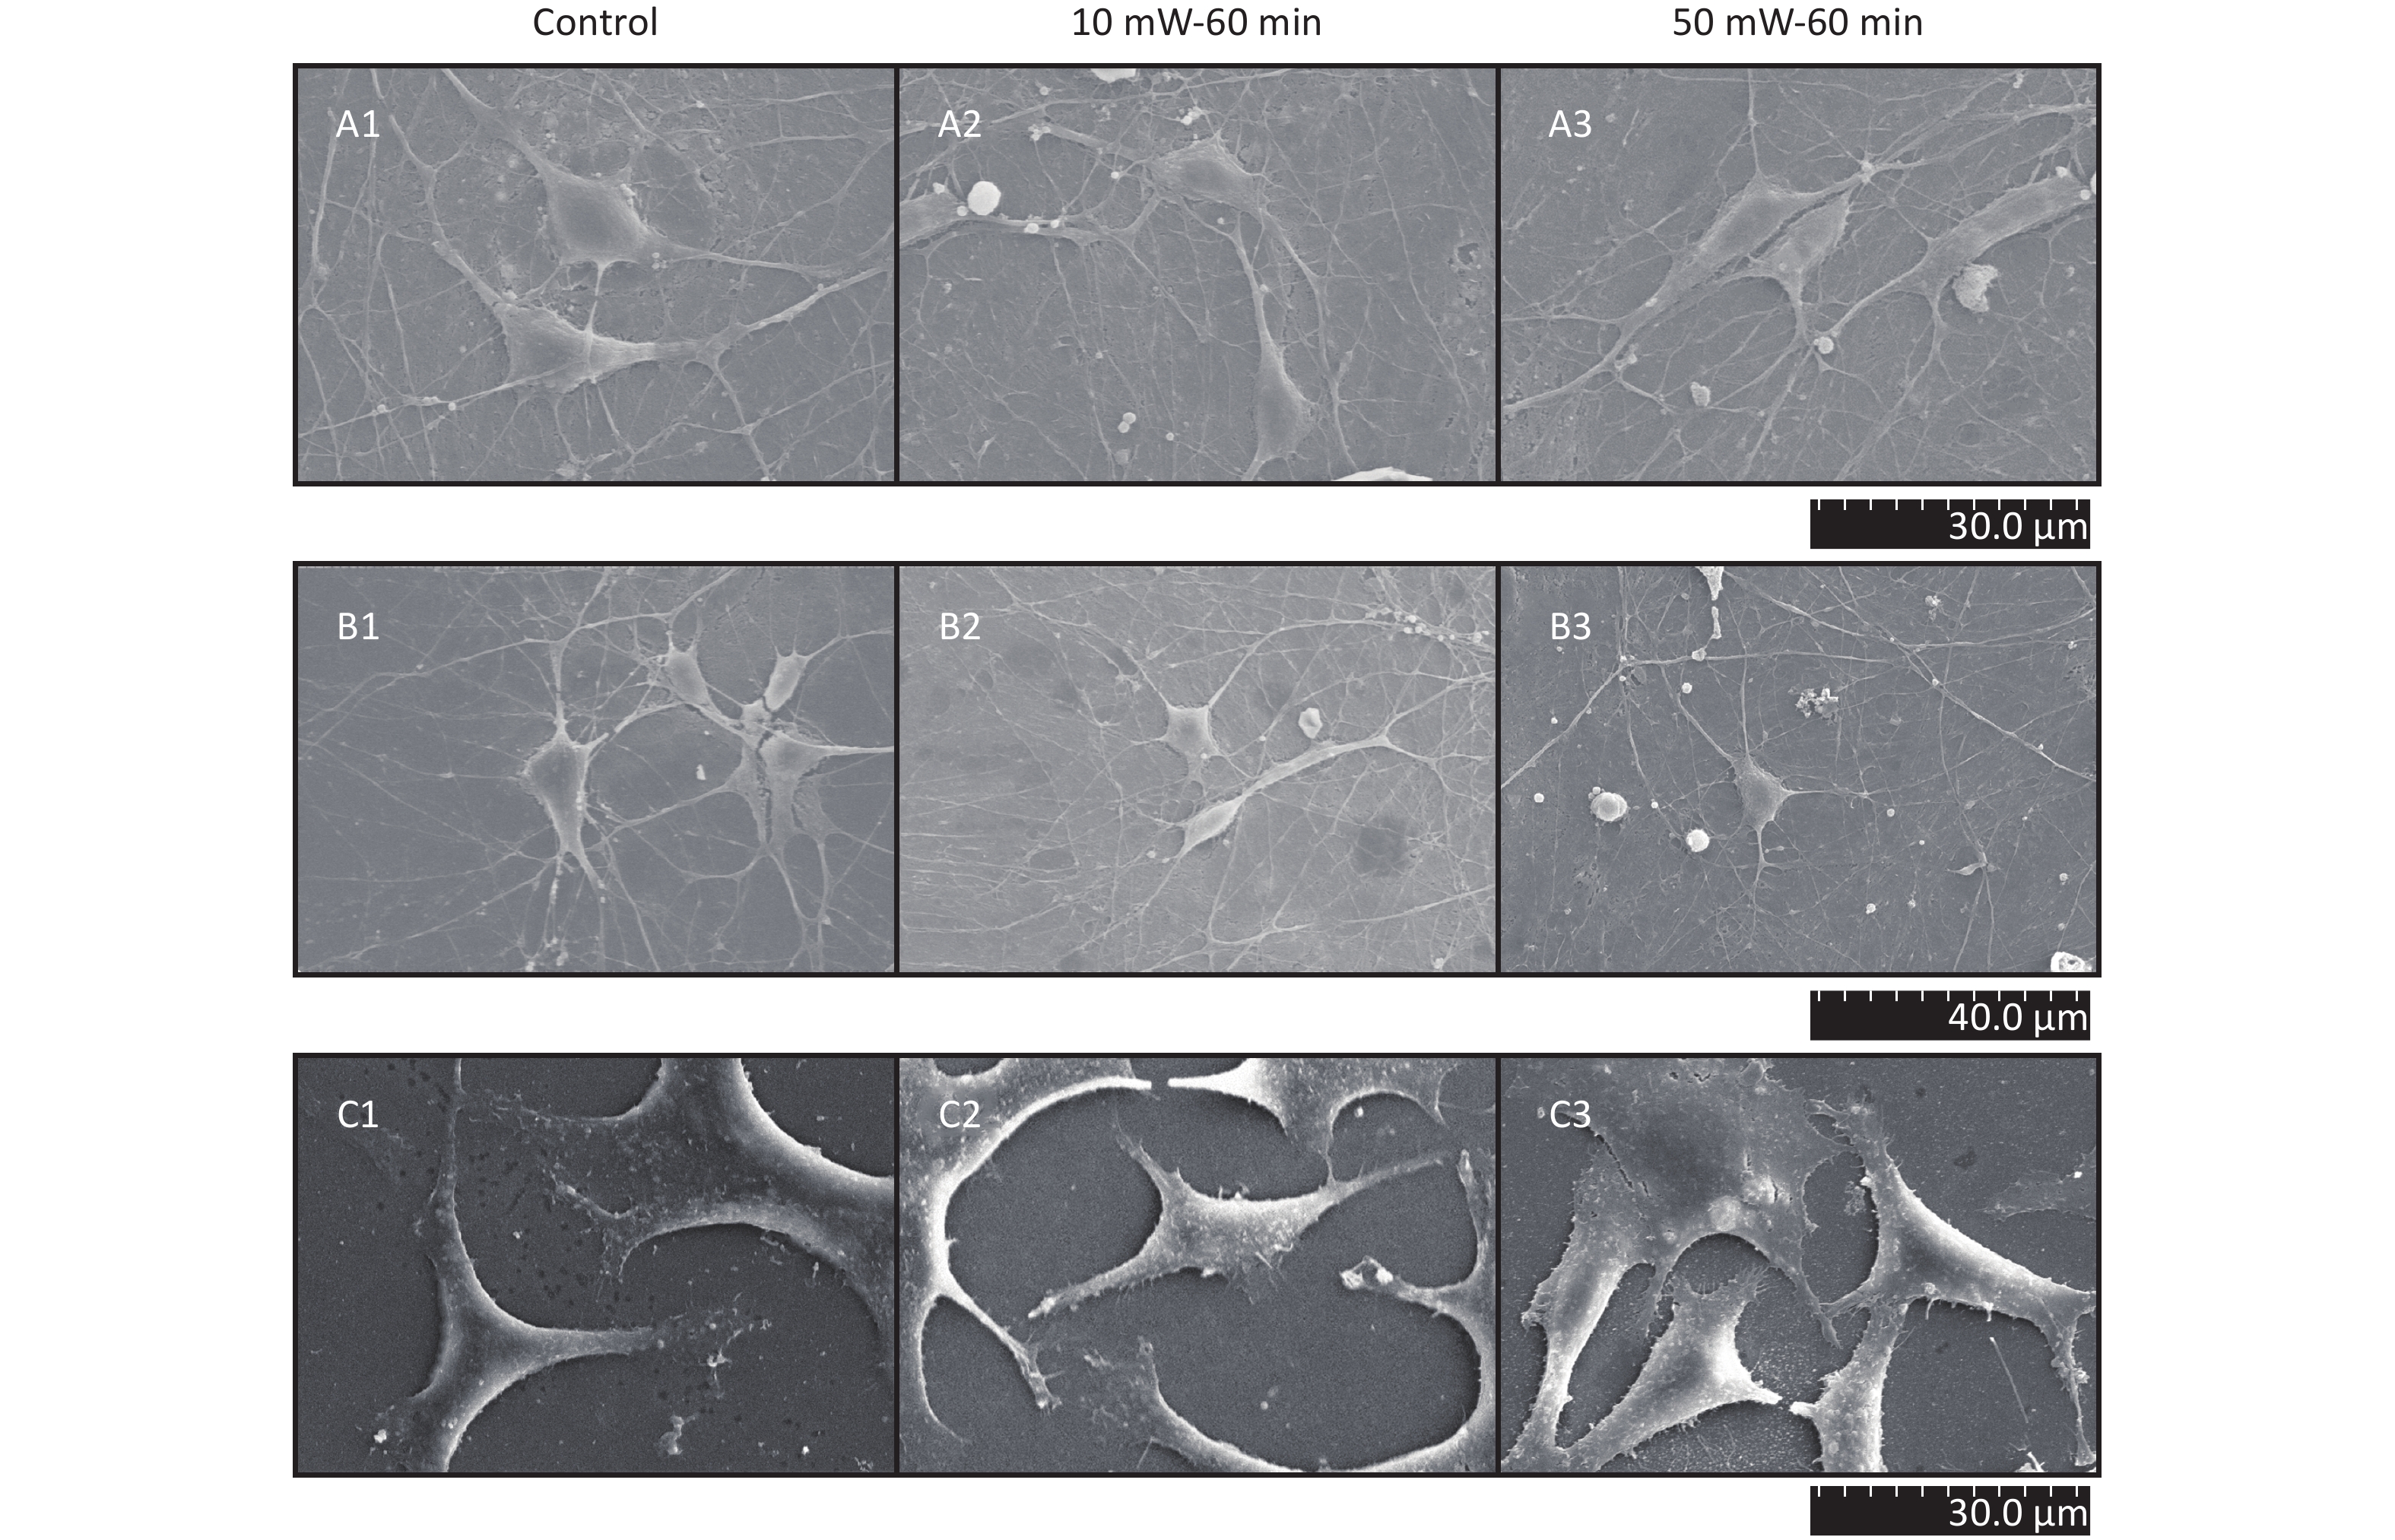
As shown in Figure 5, in primary hippocampal and cortical neurons, there were large numbers of miniscule connections between neurons (primary hippocampal neurons: Figure 5, A1-A3; primary cortical neurons: Figure 5, B1-B3), and these miniscule connections could not be observed by LM. No significant effects were observed in the number and morphology of the miniscule connections among the groups (Control, 10 mW-60 min and 50 mW-60 min). In MN9D cells (Figure 5, C1-C3), there were miniscule villous structures at the ends of the neurites, and the small processes were too short to form intercellular connections. No changes in the micromorphology of MN9D cells were observed among the groups (Control, 10 mW-60 min and 50 mW-60 min).
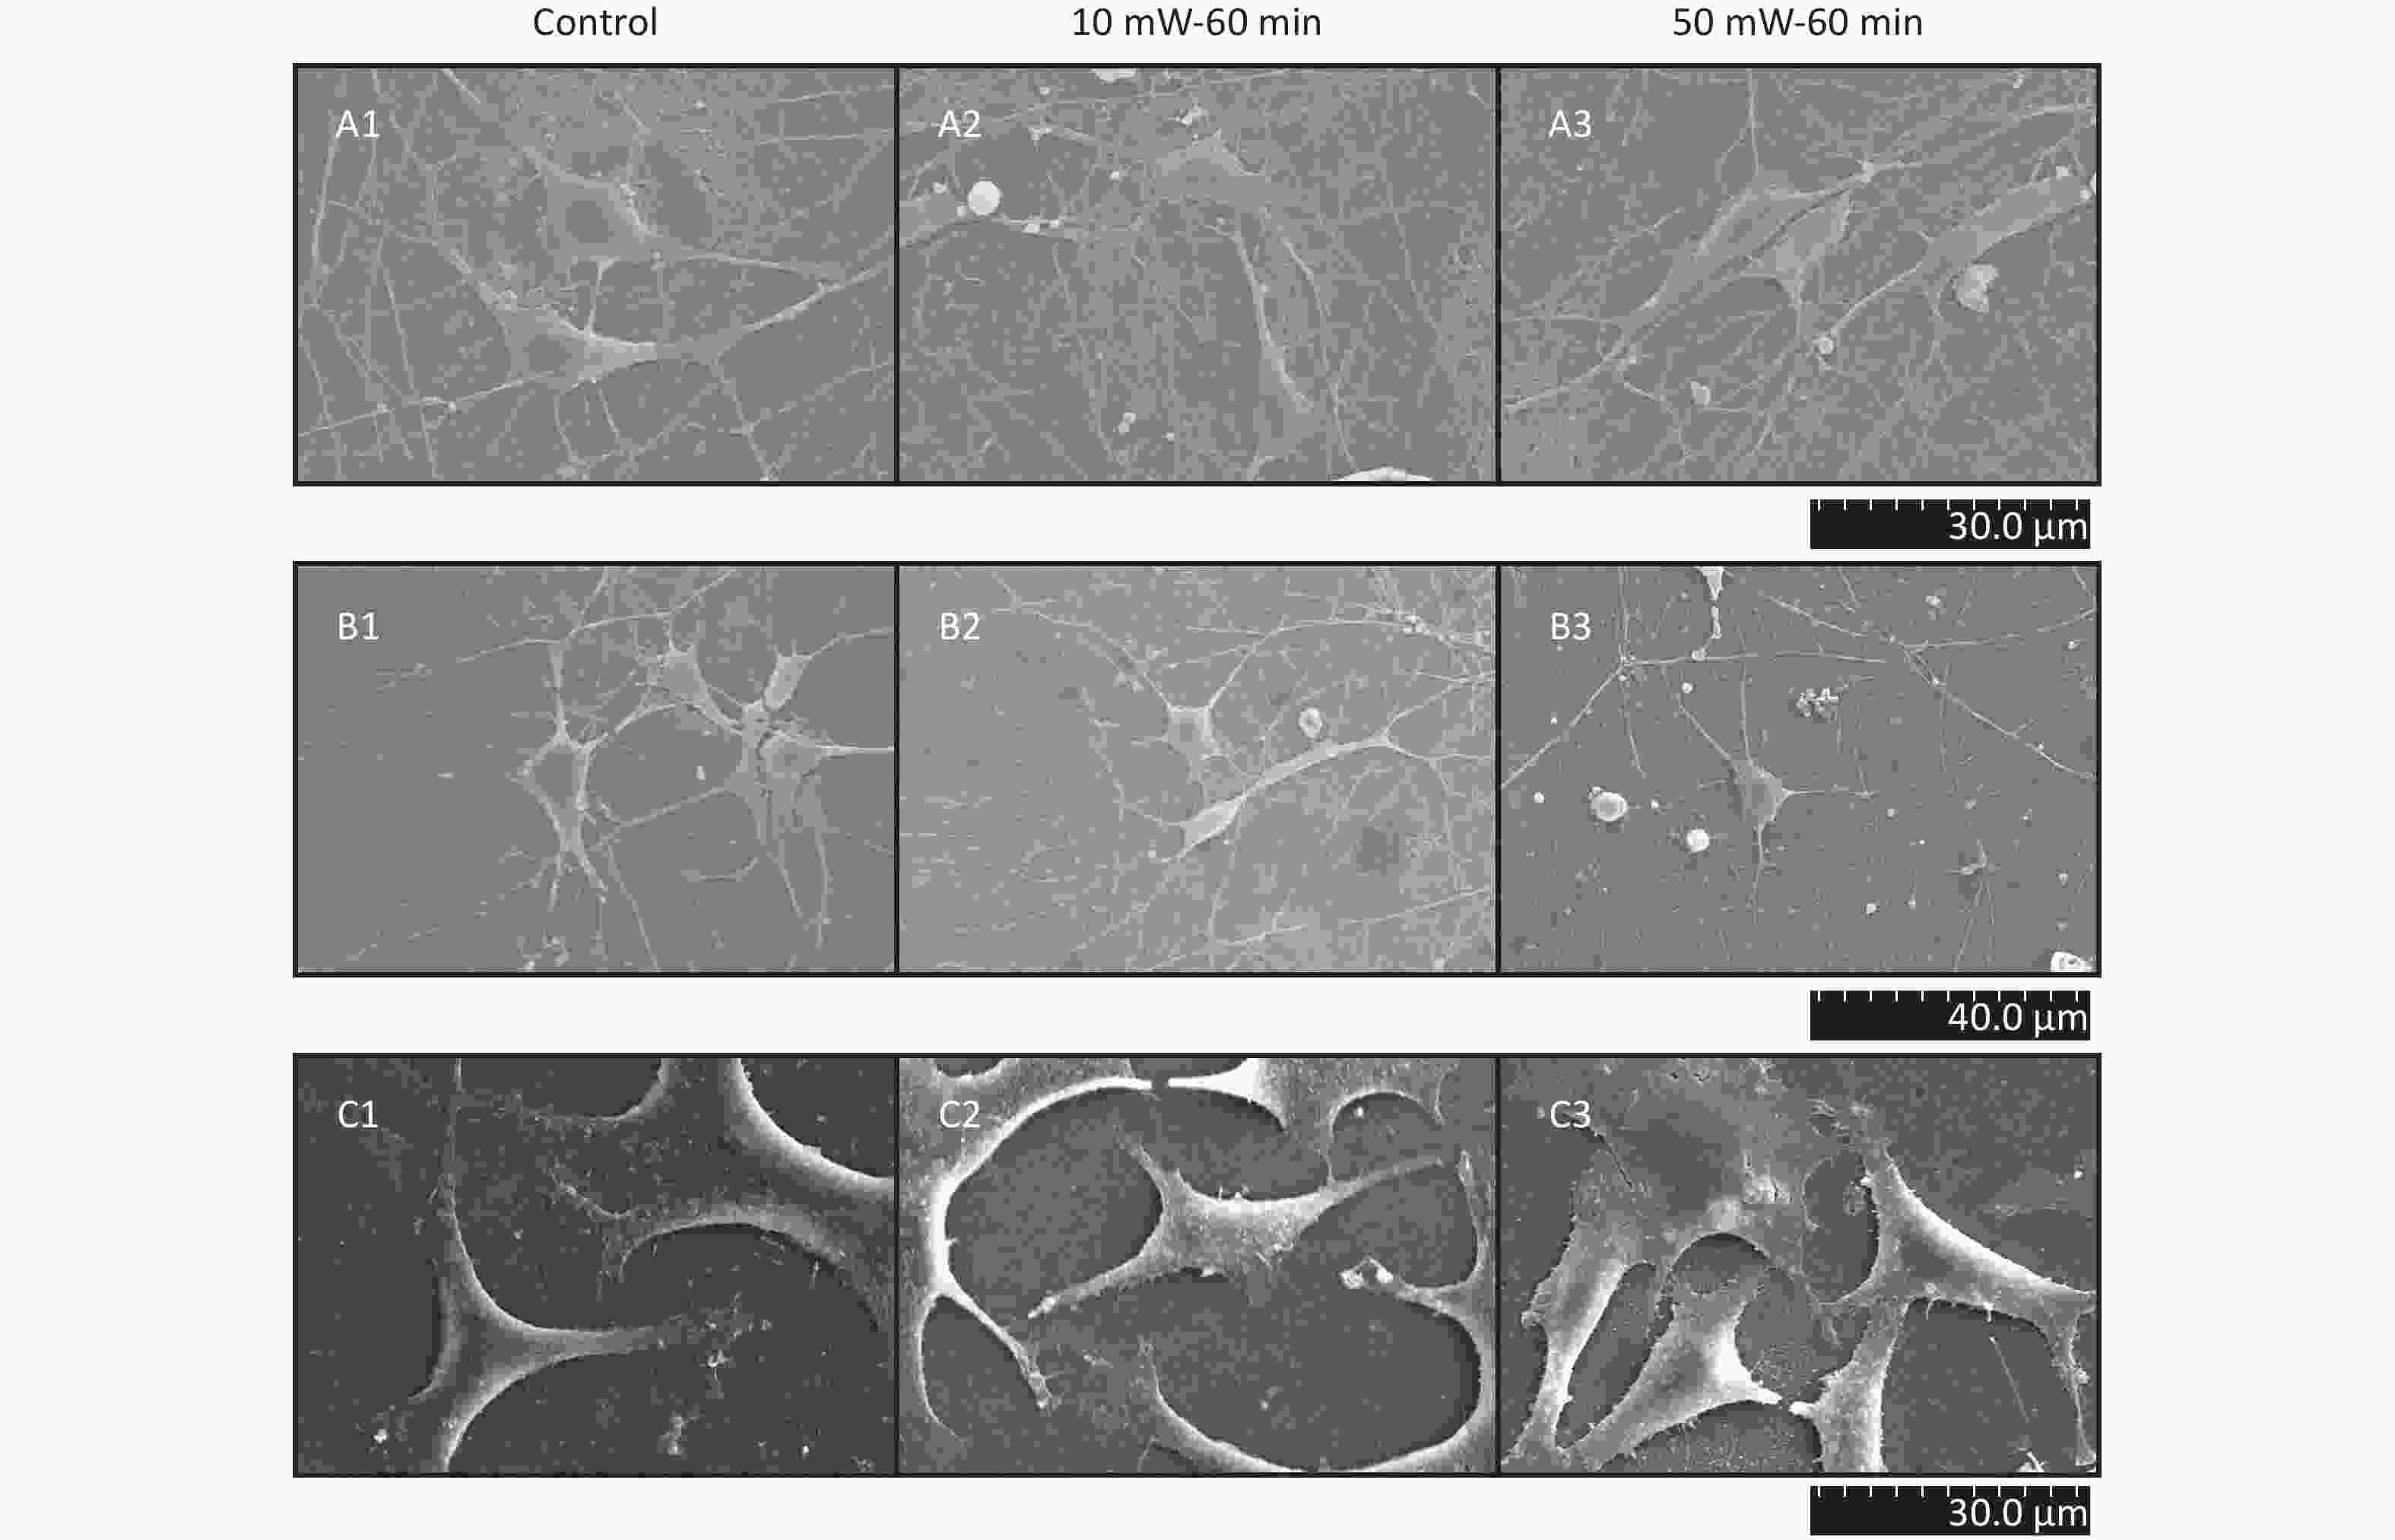
Figure 5. Micromorphology of primary hippocampal, cortical cells and MN9D cell after 50 and 10 mW wave exposure (SEM, A1-A3, scale bar = 30 μm; B1-B3, scale bar = 40 μm; C1-C3, scale bar = 30 μm). For each kind of cell, 3 subfigures are shown as 1-3 as follows: (1) SEM picture of control group; (2) SEM picture of 10 mW-60 min group; and (3) SEM picture of 50 mW-60 min group. (A1-A3) Primary hippocampal neurons; (B1-B3) primary cortical neurons; (C1-C3) MN9D cells.
-
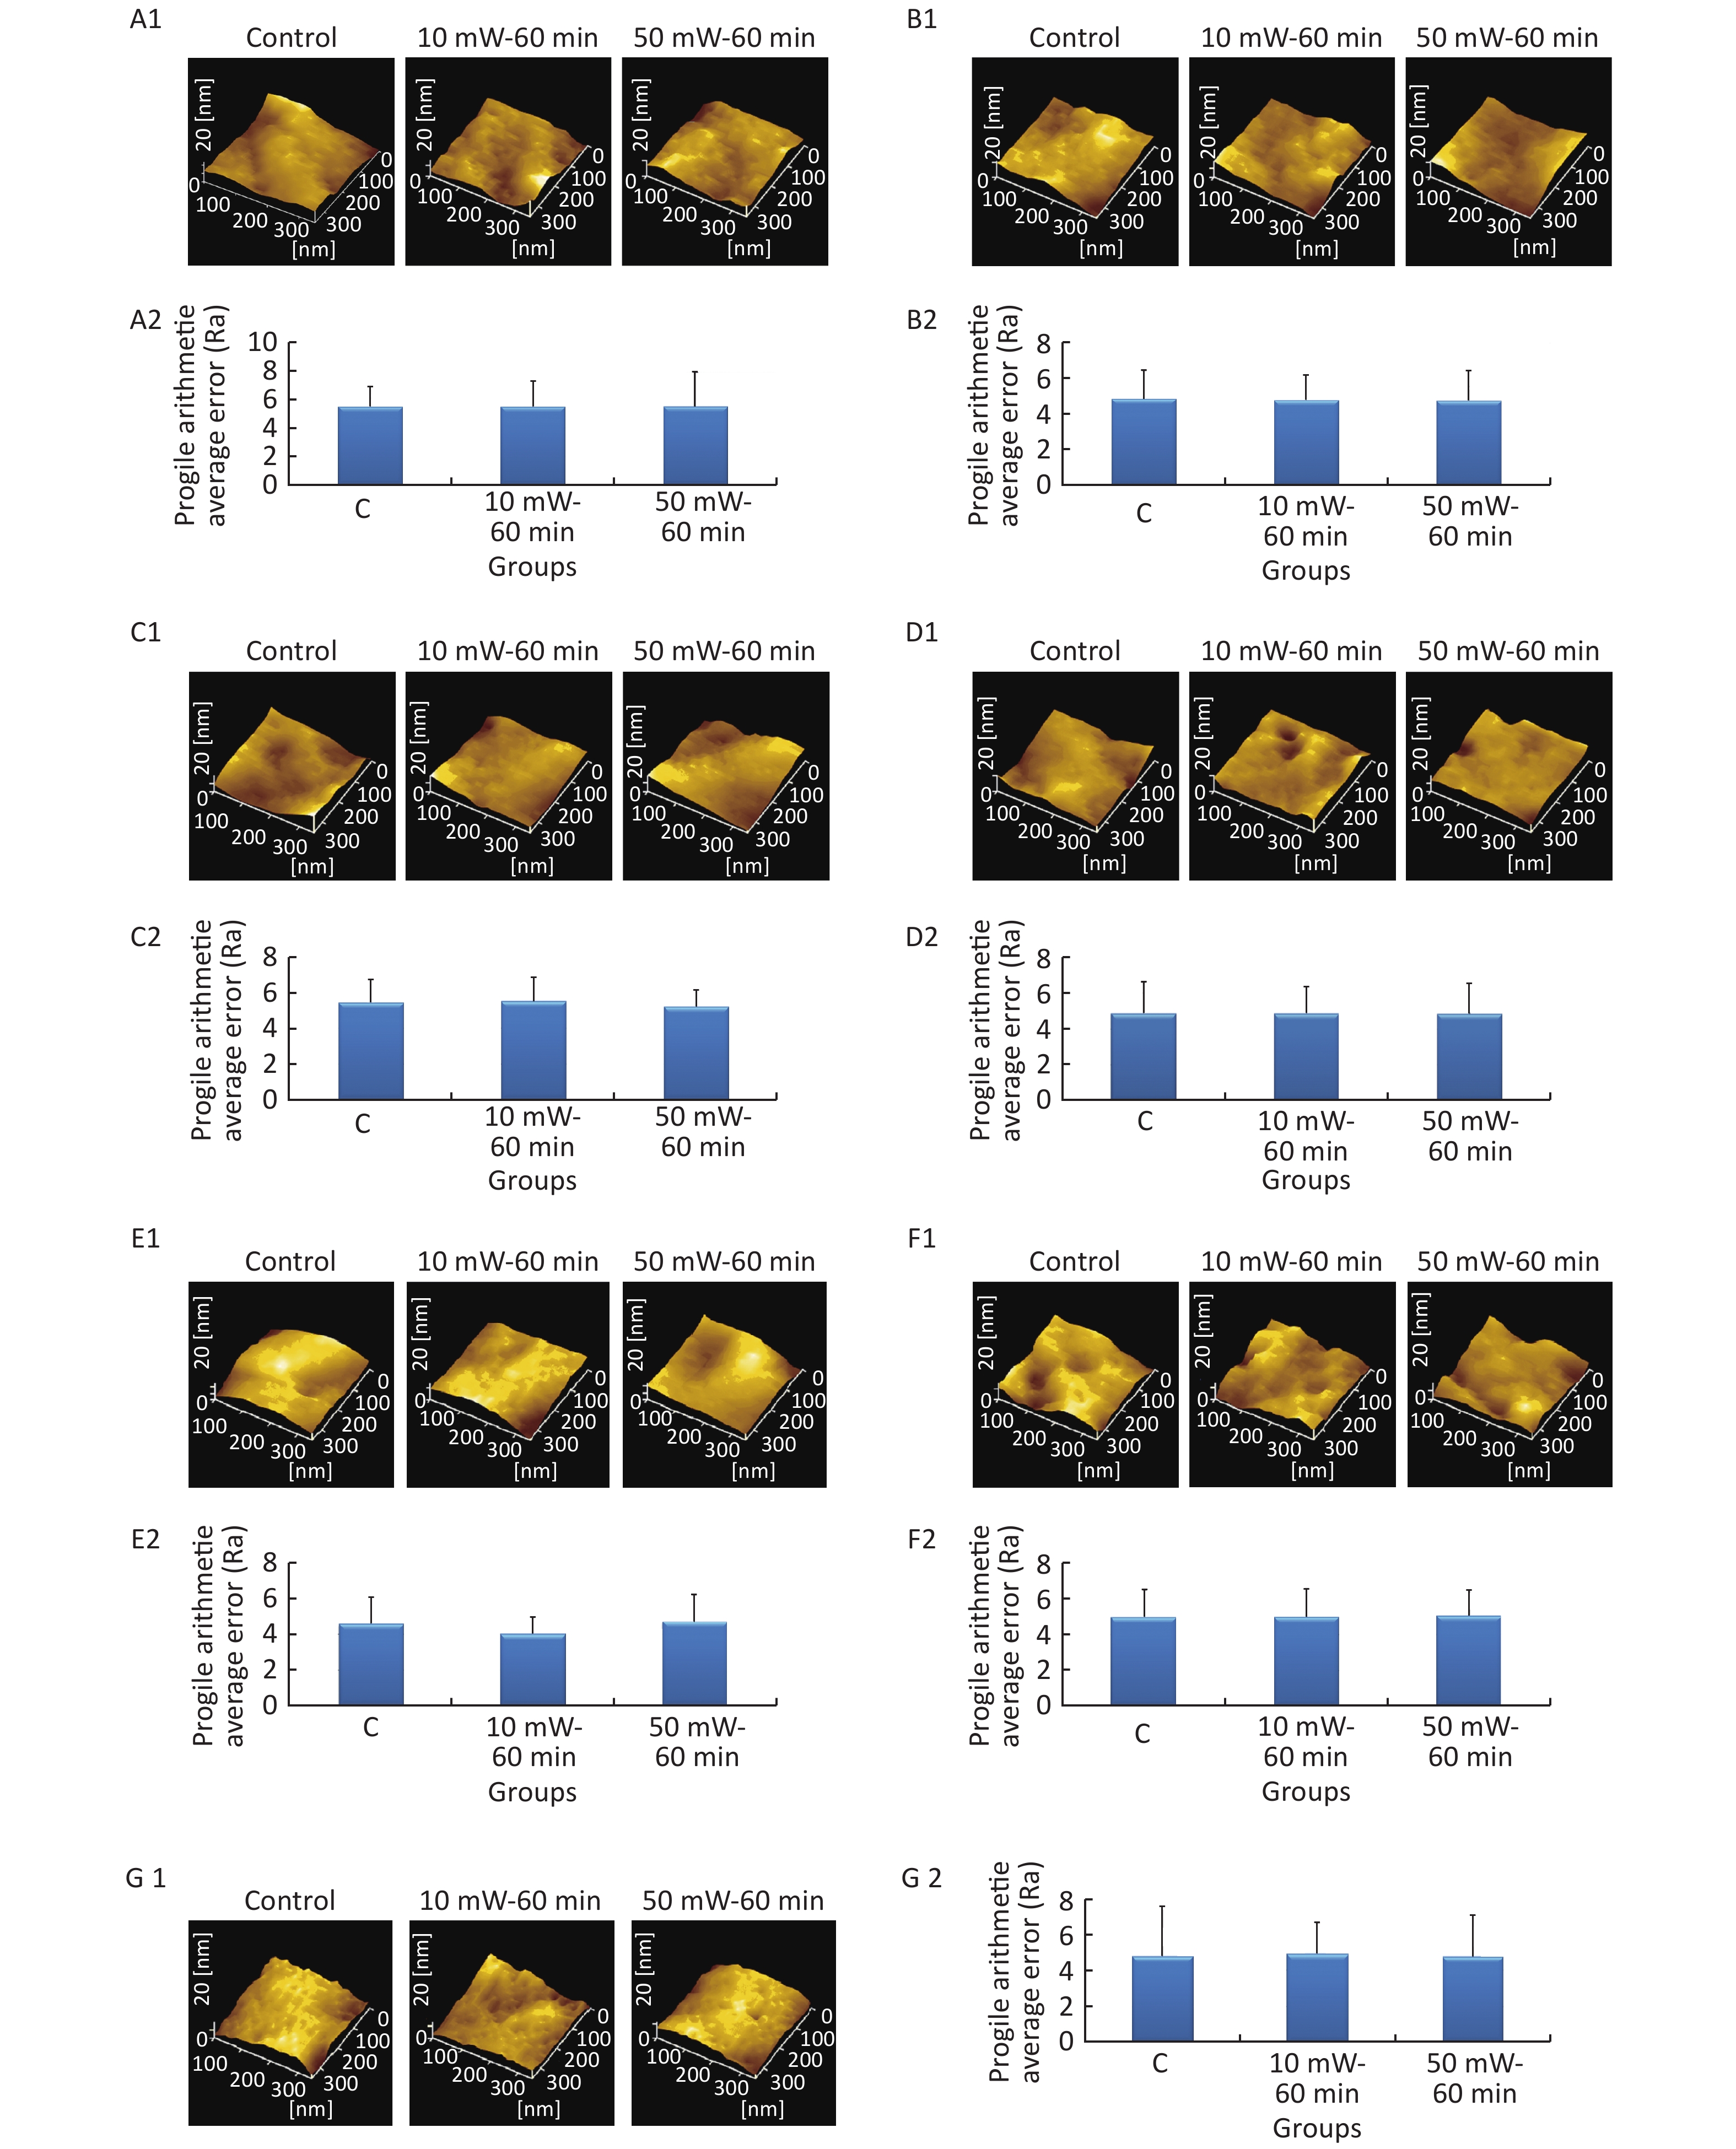
At 3 d after THz wave exposure, cells were fixed and examined by AFM, and the Ra value was used to evaluate the roughness of the cell membrane surface. As shown in Figure 6, the surfaces of the cell membranes of primary cultured hippocampal (Figure 6, A1-A2), cortical (Figure 6, B1-B2), cerebellar (Figure 6, C1-C2) and brainstem (Figure 6, D1-D2) neurons were intact and wavy. As shown in Figure 6, the surfaces of MN9D (Figure 6, E1-E2), PC12 (Figure 6, F1-F2) and HT22 (Figure 6, G1-G2) cells had distinct characteristics as follows: MN9D cells were smooth, PC12 cells were uneven, and HT22 cells were grainy.
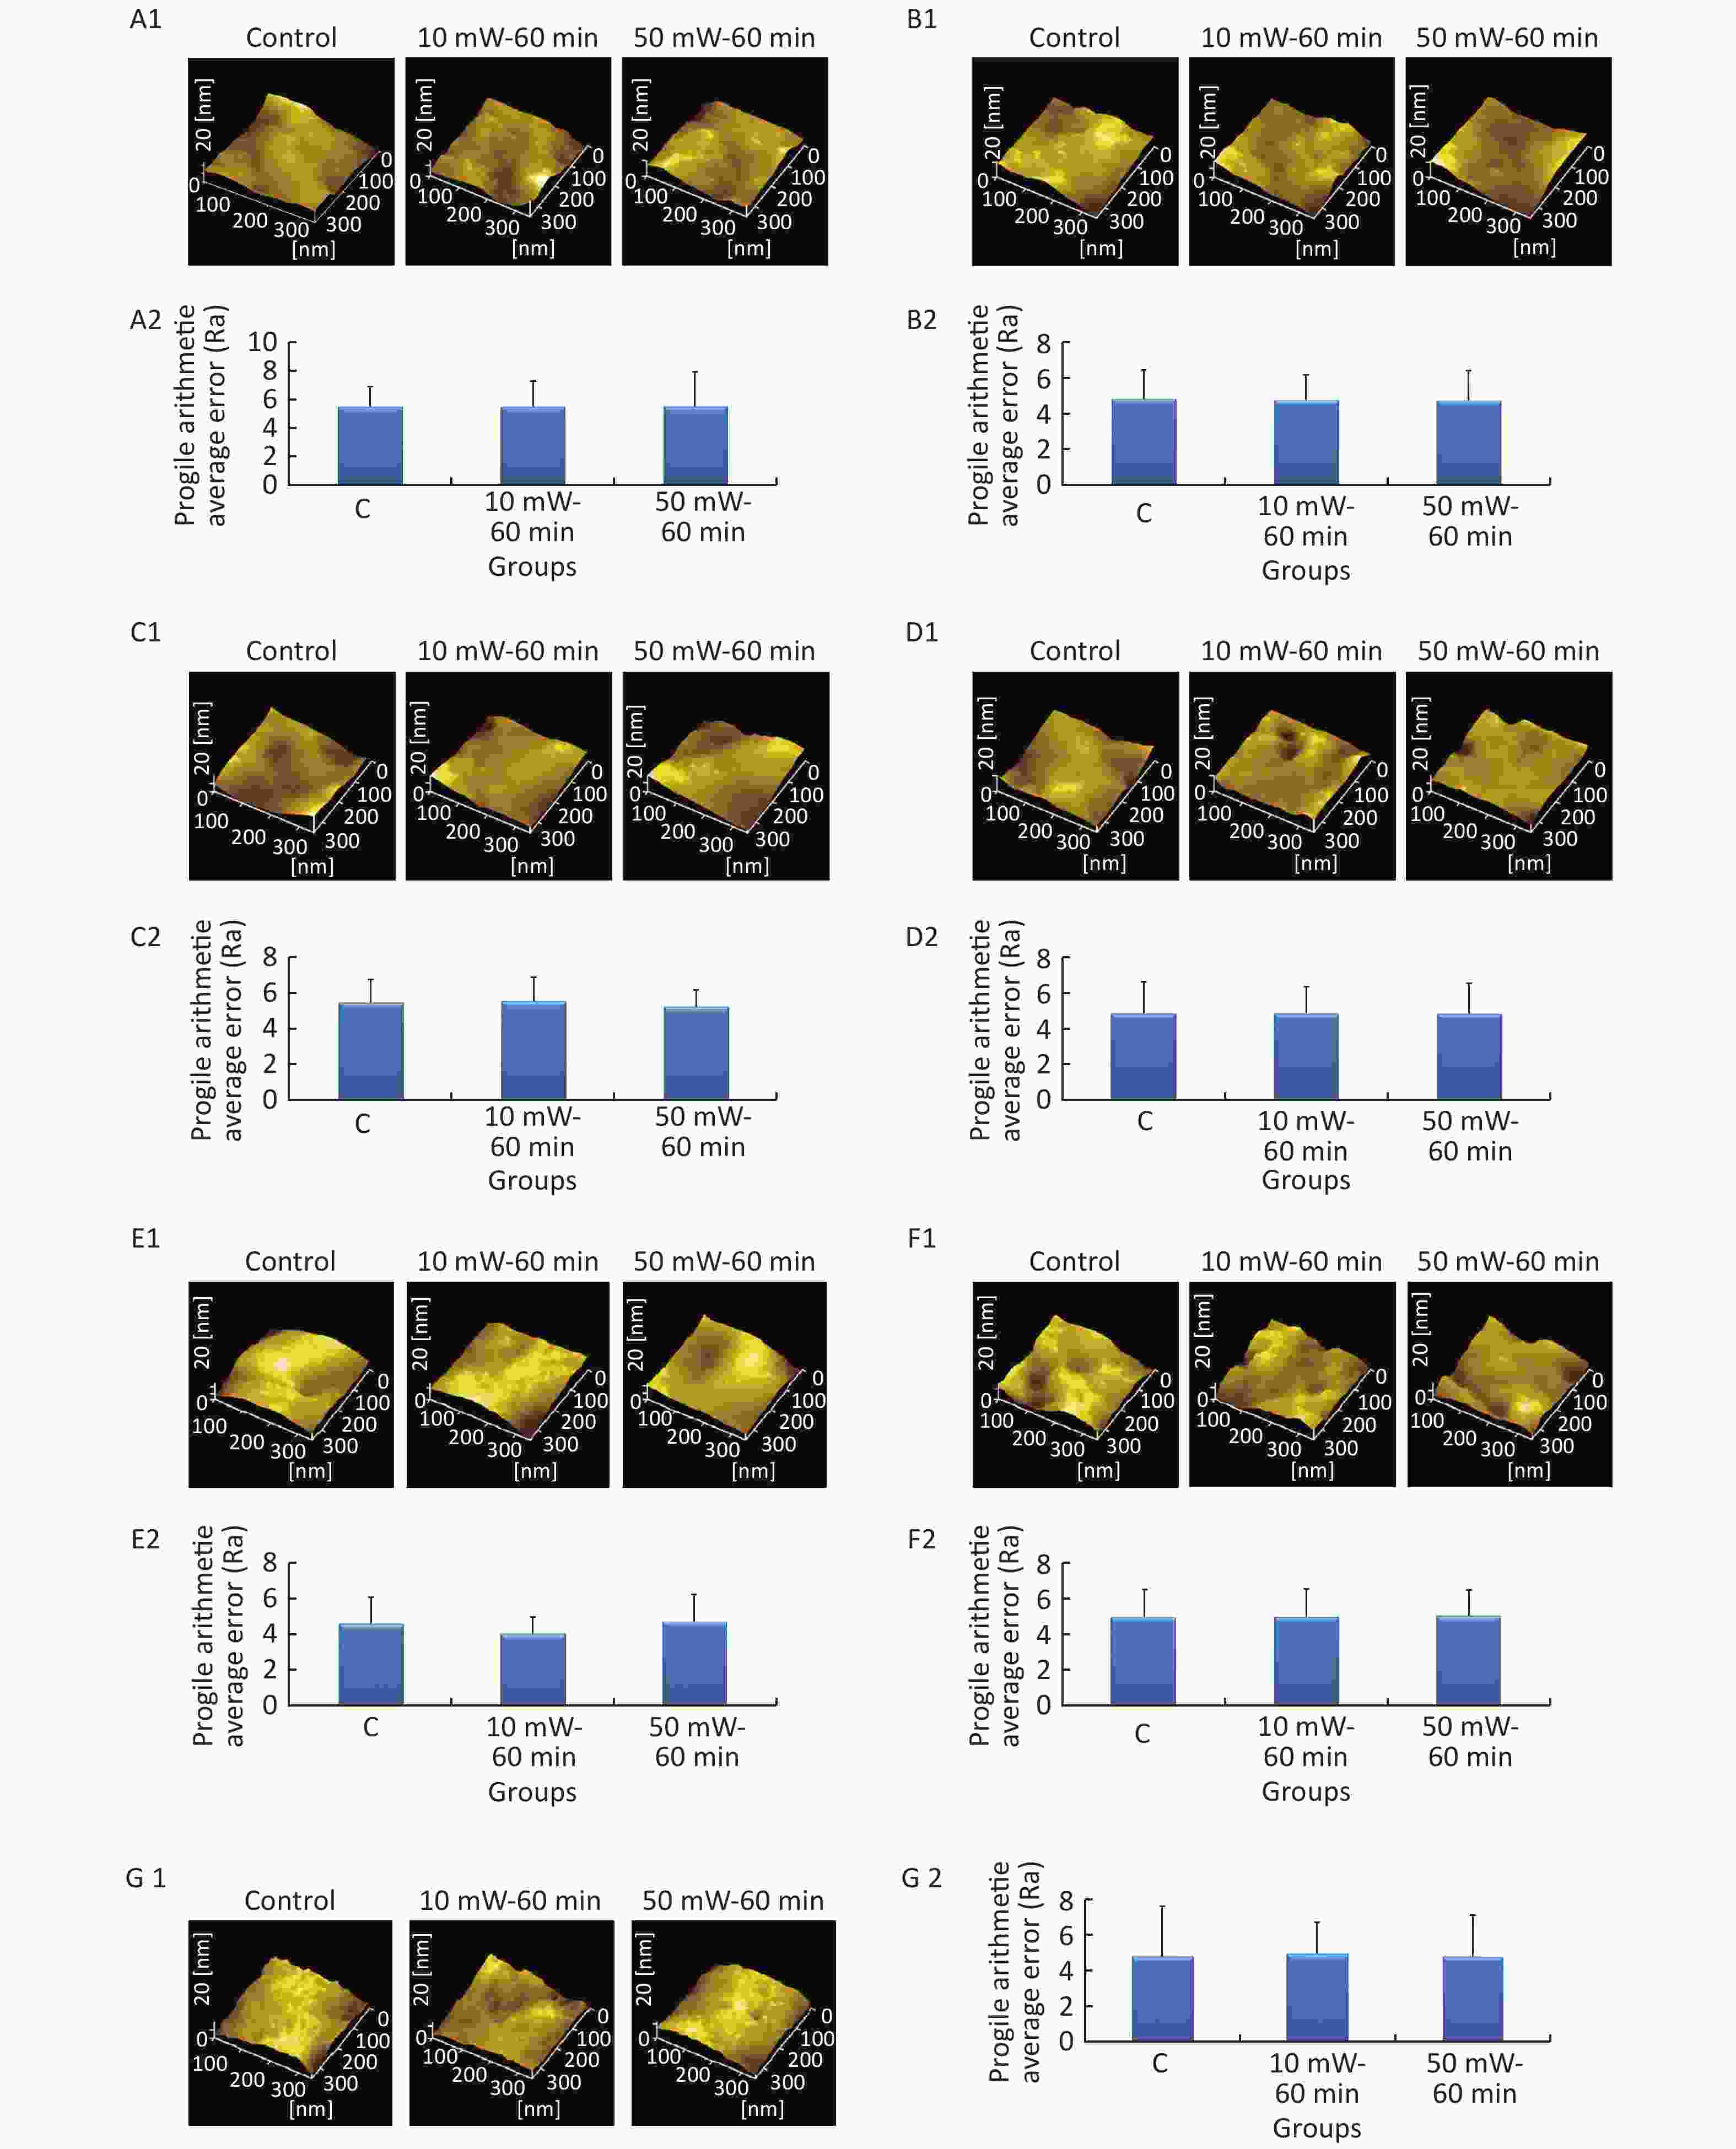
Figure 6. Cell membrane roughness in primary neurons and neuron-like cells after 50 and 10 mW THz wave exposure (AFM, scale bar = 360 nm). (A1-A2) Primary hippocampal neurons; (B1-B2) primary cortical neurons; (C1-C2) primary cerebellar neurons; (D1-D2) primary brainstem neurons; (E1-E2) MN9D cells; (F1-F2) PC12 cells; and (G1-G2) HT22 cells. For each kind of cell, 2 subfigures are shown as 1-2 as follows: (1) AFM images of control, 50 mW-60 min and 10 mW-60 min groups and (2) Ra values of cell membranes after THz wave exposure. C, Control
In the abovementioned 7 kinds of cells, no significant differences in the roughness of the cell membrane surface were observed in the THz wave exposure groups compared with that in the control group (50 mW-6 min, 50 mW-60 min, 10 mW-6 min, and 10 mW-60 min vs. Control).
Groups with different exposure times at the same THz wave were compared to elucidate the exposure time-effect relationship. No significant differences in the roughness of the cell membrane surface were observed in the 60 min exposure groups compared with the 6 min exposure groups (50 mW-60 min vs. 50 mW-6 min and 10 mW-60 min vs. 10 mW-6 min).
Groups with different THz wave at the same exposure time were also compared to find out the radiation conditions of obvious effects. No significant differences in the roughness of the cell membrane surface were observed in the 50 mW THz wave exposure groups compared with the 10 mW THz wave exposure groups (50 mW-60 min vs. 10 mW-60 min and 50 mW-6 min vs. 10 mW-6 min).
-
Immediately after exposure, we extracted the culture medium of neurons and analyzed the contents of 3 kinds of neurotransmitters, including Glu, Gly, and Ala.
THz Wave Exposure affected Neurotransmitter Contents (vs. Control) In primary hippocampal neurons (Table 2), the content of Glu significantly decreased in the 50 mW-6 min and 50 mW-60 min groups compared with the Control group (P < 0.01). The content of Gly significantly increased in the 50 mW-60 min group compared with the Control group (P < 0.05). The content of Glu significantly decreased, and the contents of Gly and Ala significantly increased in the 60 min group compared to the Control group (P < 0.05).
Neurons Groups Nneurotransmitter contents (pmol/μL) Glu Gly Ala Primary hippocampal neurons Control 29.91 ± 0.79 410.67 ± 38.87 268.94 ± 25.32 10 mW-6 min 31.24 ± 1.82 433.26 ± 24.85 251.06 ± 28.33 10 mW-60 min 26.21 ± 2.08 474.29 ± 32.38* 293.53 ± 25.11* 50 mW-6 min 25.77 ± 0.87**△△ 460.78 ± 48.23 265.29 ± 38.99 50 mW-60 min 21.73 ± 2.47**△## 483.04 ± 23.82* 264.12 ± 30.15 Primary cortical neurons Control 19.38 ± 4.29 436.93 ± 18.64 470.80 ± 54.86 10 mW-6 min 18.96 ± 2.50 415.72 ± 21.12 459.73 ± 16.16 10 mW-60 min 33.02 ± 0.63**## 415.06 ± 19.51 353.53 ± 15.12**## 50 mW-6 min 17.48 ± 0.71 411.61 ± 20.98 459.30 ± 22.20 50 mW-60 min 20.97 ± 4.98△△ 429.51 ± 12.71 468.80 ± 22.38△△ Primary cerebellar neurons Control 21.12 ± 0.42 379.75 ± 52.90 329.08 ± 58.54 10 mW-6 min 15.44 ± 0.96** 376.63 ± 27.82 492.36 ± 35.16** 10 mW-60 min 15.66 ± 0.94** 362.21 ± 45.88 497.85 ± 34.10** 50 mW-6 min 15.58 ± 1.39** 375.50 ± 53.30 522.06 ± 61.68** 50 mW-60 min 14.74 ± 2.82** 363.83 ± 32.70 542.94 ± 24.58** Primary brainstem neurons Control 27.91 ± 0.95 341.95 ± 23.35 511.22 ± 27.92 10 mW-6 min 25.18 ± 5.72 393.78 ± 18.64** 518.40 ± 70.18 10 mW-60 min 29.50 ± 0.83 394.77 ± 13.10** 525.50 ± 20.67 50 mW-6 min 21.17 ± 0.21** 440.68 ± 27.70** 561.66 ± 28.89* 50 mW-60 min 20.64 ± 0.84**△△ 451.68 ± 26.75**△△ 606.95 ± 22.60**△△## MN9D cells Control 383.03 ± 47.81 250.31 ± 34.67 1070.46 ± 75.61 10 mW-6 min 385.26 ± 10.08 244.07 ± 15.16 1082.80 ± 40.37 10 mW-60 min 374.55 ± 25.51 249.72 ± 16.82 1223.33 ± 33.54**# 50 mW-6 min 378.74 ± 25.22 250.43 ± 22.03 1198.03 ± 95.13△ 50 mW-60 min 312.69 ± 50.33*# 241.35 ± 41.19 1235.82 ± 108.38* PC12 cells Control 830.95 ± 91.00 295.40 ± 81.41 357.16 ± 28.84 10 mW-6 min 821.23 ± 36.58 313.17 ± 14.19 350.56 ± 39.24 10 mW-60 min 842.17 ± 105.02 312.49 ± 17.73 338.09 ± 43.12 50 mW-6 min 816.07 ± 69.90 312.76 ± 20.76 348.41 ± 44.43 50 mW-60 min 852.85 ± 104.36 412.07 ± 63.94*# 358.5 ± 32.15 HT22 cells Control 318.48 ± 37.48 538.73 ± 72.8 331.93 ± 43.84 10 mW-6 min 304.36 ± 15.80 512.26 ± 12.26 318.63 ± 14.96 10 mW-60 min 328.90 ± 17.28 531.30 ± 37.24 323.73 ± 16.64 50 mW-6 min 314.35 ± 9.64 533.71 ± 22.66 327.88 ± 12.15 50 mW-60 min 318.34 ± 27.01 539.30 ± 51.31 339.13 ± 30.70 Note. *P < 0.05 and **P < 0.01 vs. Control; #P < 0.05 and ##P < 0.01 for 50 mW-60 min vs. 50 mW-6 min and 10 mW-60 min vs. 10 mW-6 min; and △P < 0.05 and △△P < 0.01 for 50 mW-6 min vs. 10 mW-6 min and 50 mW-60 min vs. 10 mW-60 min. Table 2. Changes in neurotransmitters in neurons after 50 and 10 mW THz wave exposure
In primary cortical neurons (Table 2), the content of Glu significantly increased, and the content of Ala significantly decreased in the 10 mW-60 min group compared to the Control group (P < 0.01).
In primary cerebellar neurons (Table 2), the content of Glu significantly decreased in the 50 mW-6 min and 50 mW-60 min groups compared with the Control group (P < 0.01). The content of Ala significantly increased in the 50 mW-6 min and 50 mW-60 min groups compared with the Control group (P < 0.01). The content of Glu significantly decreased, and the content of Ala significantly increased in the 10 mW-6 min and 10 mW-60 min groups compared to the Control group (P < 0.01).
In primary brainstem neurons (Table 2), the content of Glu significantly decreased in the 50 mW-6 min and 50 mW-60 min groups compared with the Control group (P < 0.01). The content of Gly significantly increased in the 50 mW-6 min and 50 mW-60 min groups compared with the Control group (P < 0.01). The content of Ala significantly increased in the 50 mW-60 min group compared with the 50 mW-6 min group (P < 0.05) and the Control group (P < 0.01). The content of Ala significantly increased in the 50 mW-6 min group compared to the Control group (P < 0.05), and the content of Gly significantly increased in the 10 mW-6 min and 10 mW-60 min groups compared to the Control group (P < 0.01).
In MN9D cells (Table 2), the content of Glu significantly decreased, and the content of Ala significantly increased in the 60 min group compared to the Control group (P < 0.05). The content of Ala significantly increased in the 10 mW-60 min group compared to the Control group (P < 0.01) and the 10 mW-6 min group (P < 0.05).
In PC12 cells (Table 2), the content of Gly significantly increased in the 50 mW-60 min group compared to the Control group (P < 0.05), and the content of Gly significantly increased in the 50 mW-60 min group compared to the 50 mW-6 min group (P < 0.05).
In HT22 cells (Table 2), there was no significant difference in the content of neurotransmitters between the groups.
Exposure Time-related Effects were Observed with Neurotransmitter Content Changes In primary hippocampal neurons (Table 2), the content of Glu significantly decreased in the 50 mW-60 min group compared with the 50 mW-6 min group (P < 0.01). The content of Glu significantly decreased in the 10 mW-60 min group compared to the 10 mW-6 min group (P < 0.01).
In primary cortical neurons (Table 2), the content of Glu significantly increased, and the content of Ala significantly decreased in the 10 mW-60 min group compared to the 10 mW-6 min group (P < 0.01).
In primary cerebellar and brainstem neurons (Table 2), there was no significant difference in the content of neurotransmitters between the groups.
In MN9D cells (Table 2), the content of Glu significantly decreased in the 50 mW-60 min group compared to the 50 mW-6 min group (P < 0.05).
In PC12 and HT22 cells (Table 2), there was no significant difference in the content of neurotransmitters between the groups.
Significant Different Effects were Observed between 50 mW and 10 mW THz Wave In primary hippocampal neurons (Table 2), the content of Glu was significantly decreased in the 50 mW-6 min and 50 mW-60 min groups compared to the 10 mW-6 min (P < 0.01) and 10 mW-60 min (P < 0.05) groups, respectively.
In primary cortical neurons (Table 2), the content of Glu was significantly decreased in the 50 mW-60 min group compared to the 10 mW-60 min (P < 0.01) group, and the content of Ala was significantly increased in the 50 mW-60 min group compared to the 10 mW-60 min (P < 0.01) group.
In primary cerebellar neurons (Table 2), there was no significant difference in the content of neurotransmitters between the groups.
In primary brainstem neurons (Table 2), the content of Glu was significantly decreased in the 50 mW-60 min group compared to the 10 mW-60 min (P < 0.01) group. The content of Gly was significantly increased in the 50 mW-60 min group compared to the 10 mW-60 min (P < 0.01) group. The content of Ala was significantly increased in the 50 mW-60 min group compared to the 10 mW-60 min (P < 0.01) group.
In MN9D cells (Table 2), the content of Ala was significantly increased in the 50 mW-6 min group compared to the 10 mW-6 min (P < 0.05) group.
In PC12 and HT22 cells (Table 2), there were no significant differences in the content of neurotransmitters between the groups.
-
At 3 d after THz wave exposure, the expression levels of SYN and PSD95 were analyzed by IF in primary hippocampal and cortical neurons and MN9D cells.
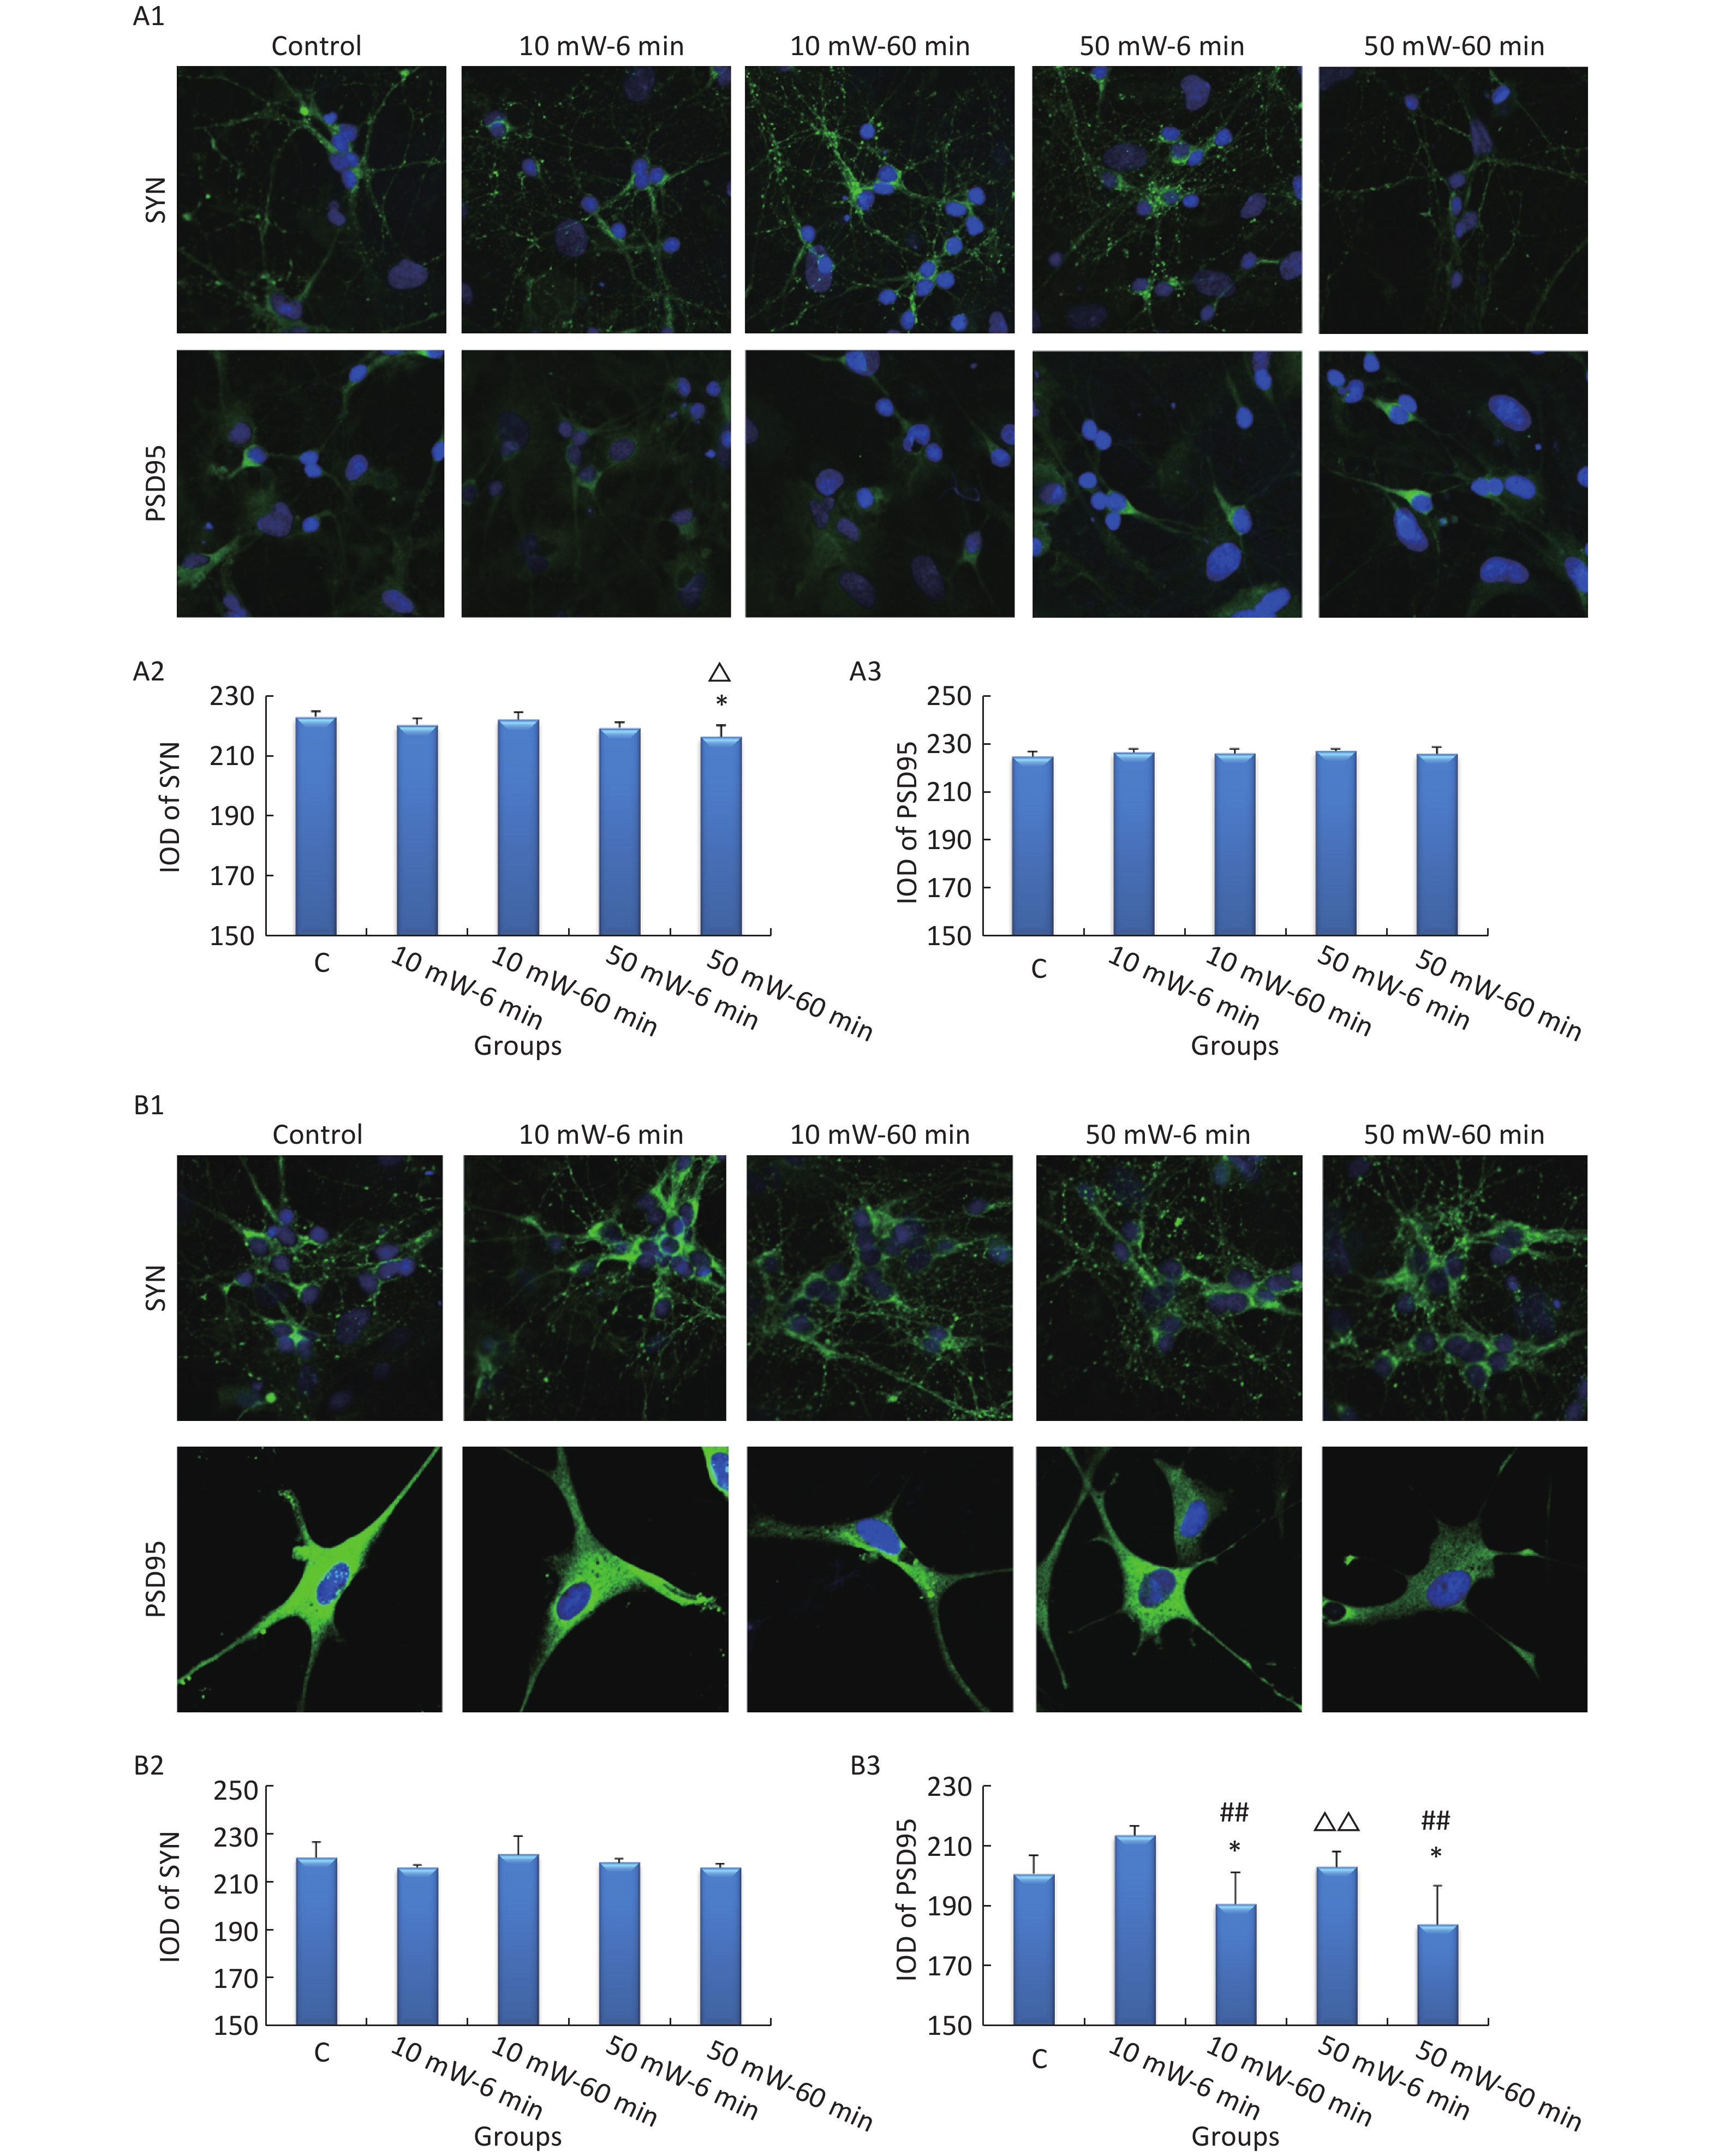
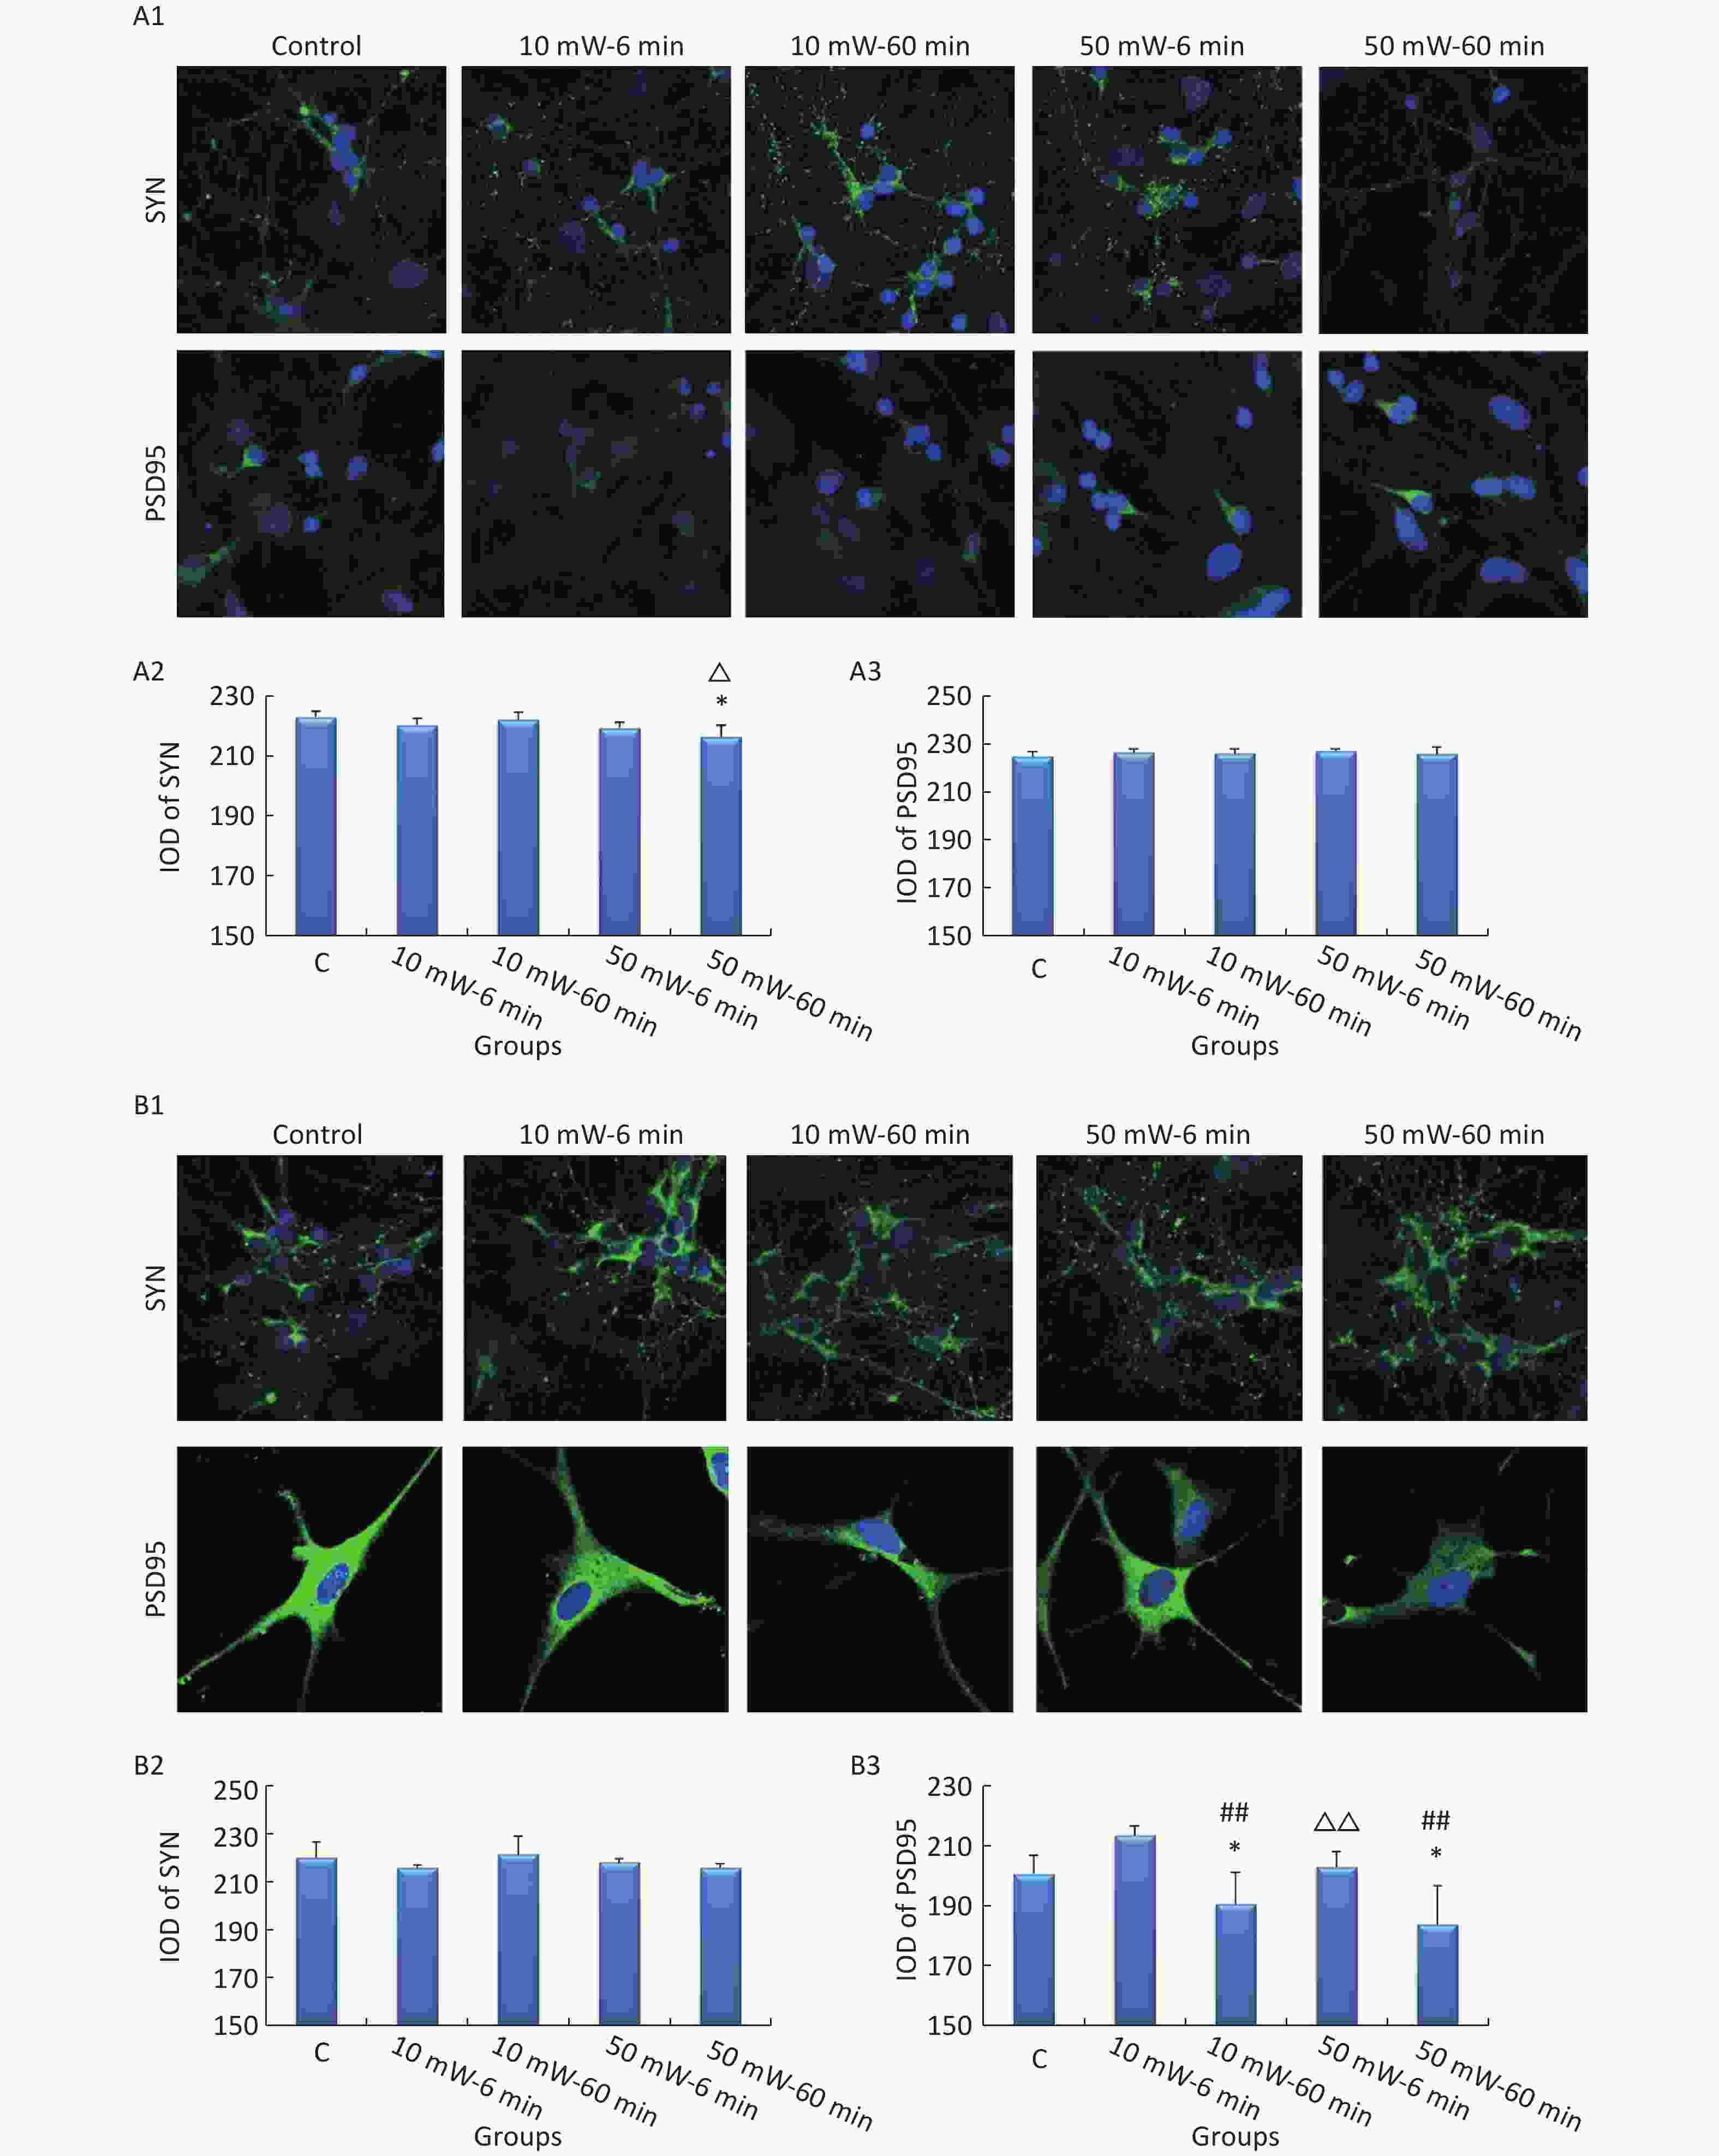
In primary cultured hippocampal cells (Figure 7, A1-A3), the IOD of SYN was significantly decreased in the 50 mW-60 min group compared to the Control group (P < 0.05). No significant differences were observed in the IODs of SYN and PSD95 among the other THz exposure groups compared to the Control group. When comparing groups of the same THz wave, no significant differences were observed in the IODs of SYN and PSD95 in the 10 mW-60 min and 50 mW-60 min groups compared to the 10 mW-6 min and 50 mW-6 min groups, respectively. When comparing groups with the same exposure time, the IOD of SYN was significantly decreased in the 50 mW-60 min group compared to the 10 mW-60 min group (P < 0.05).
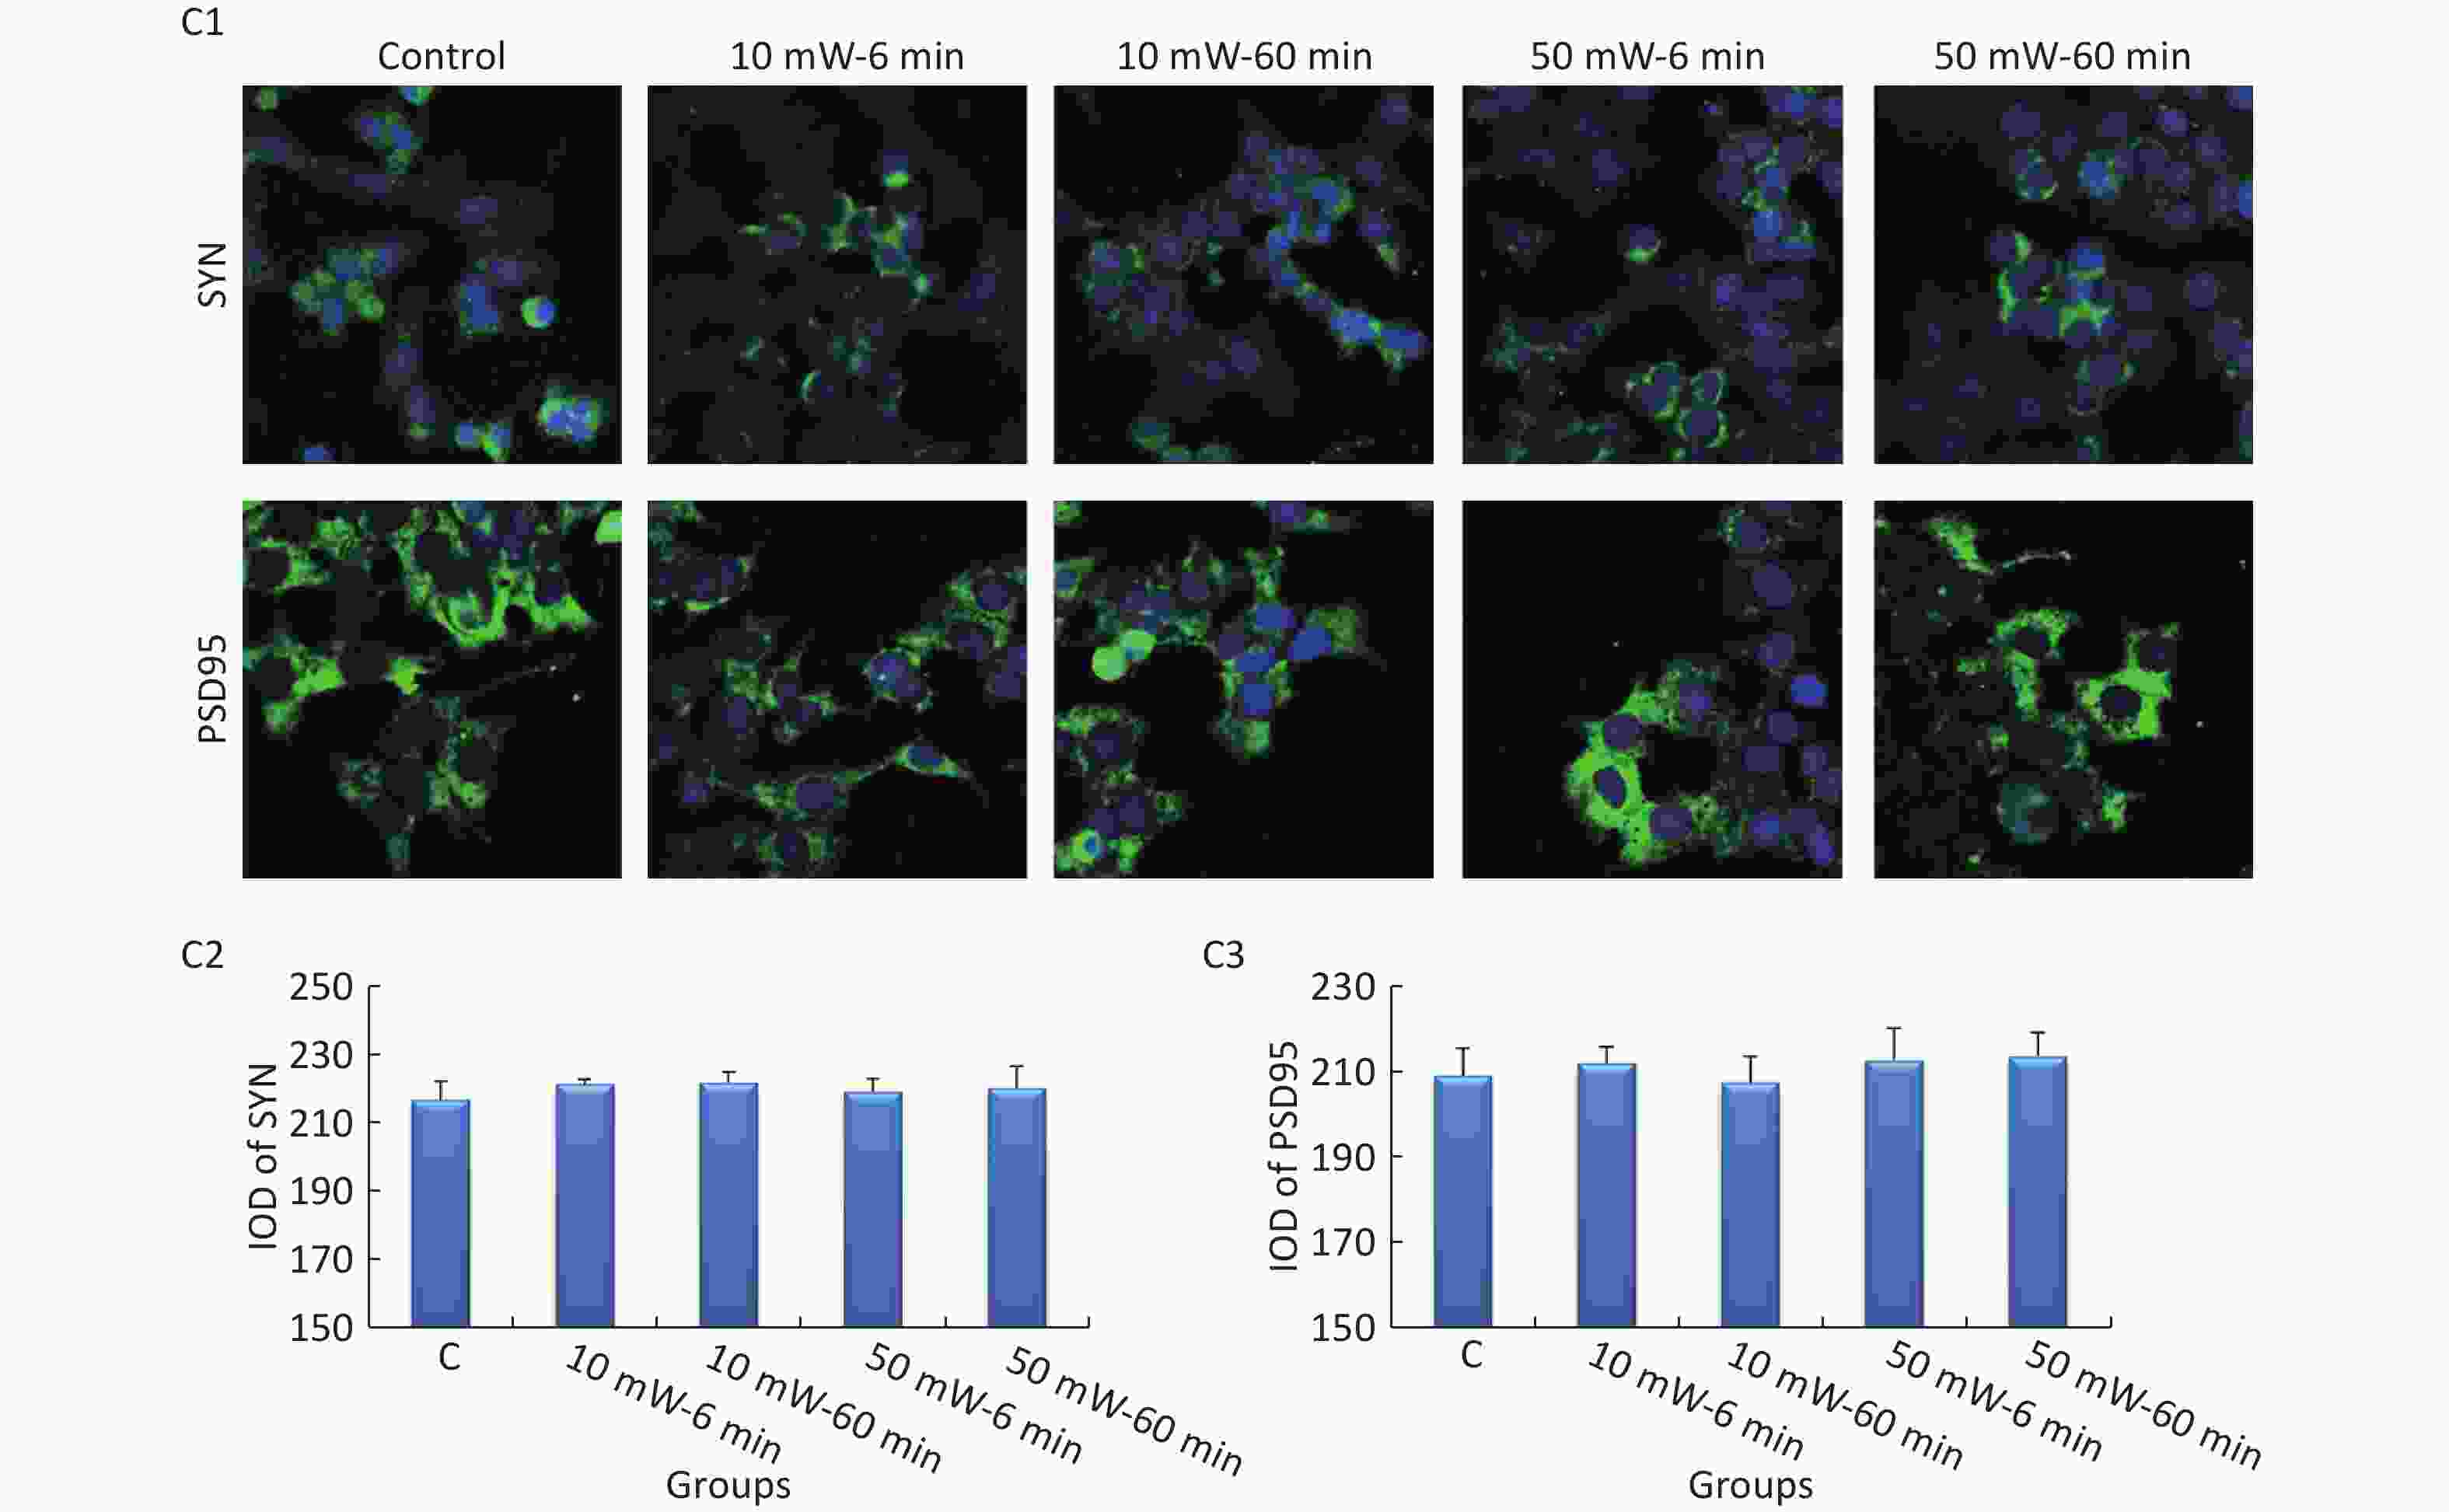
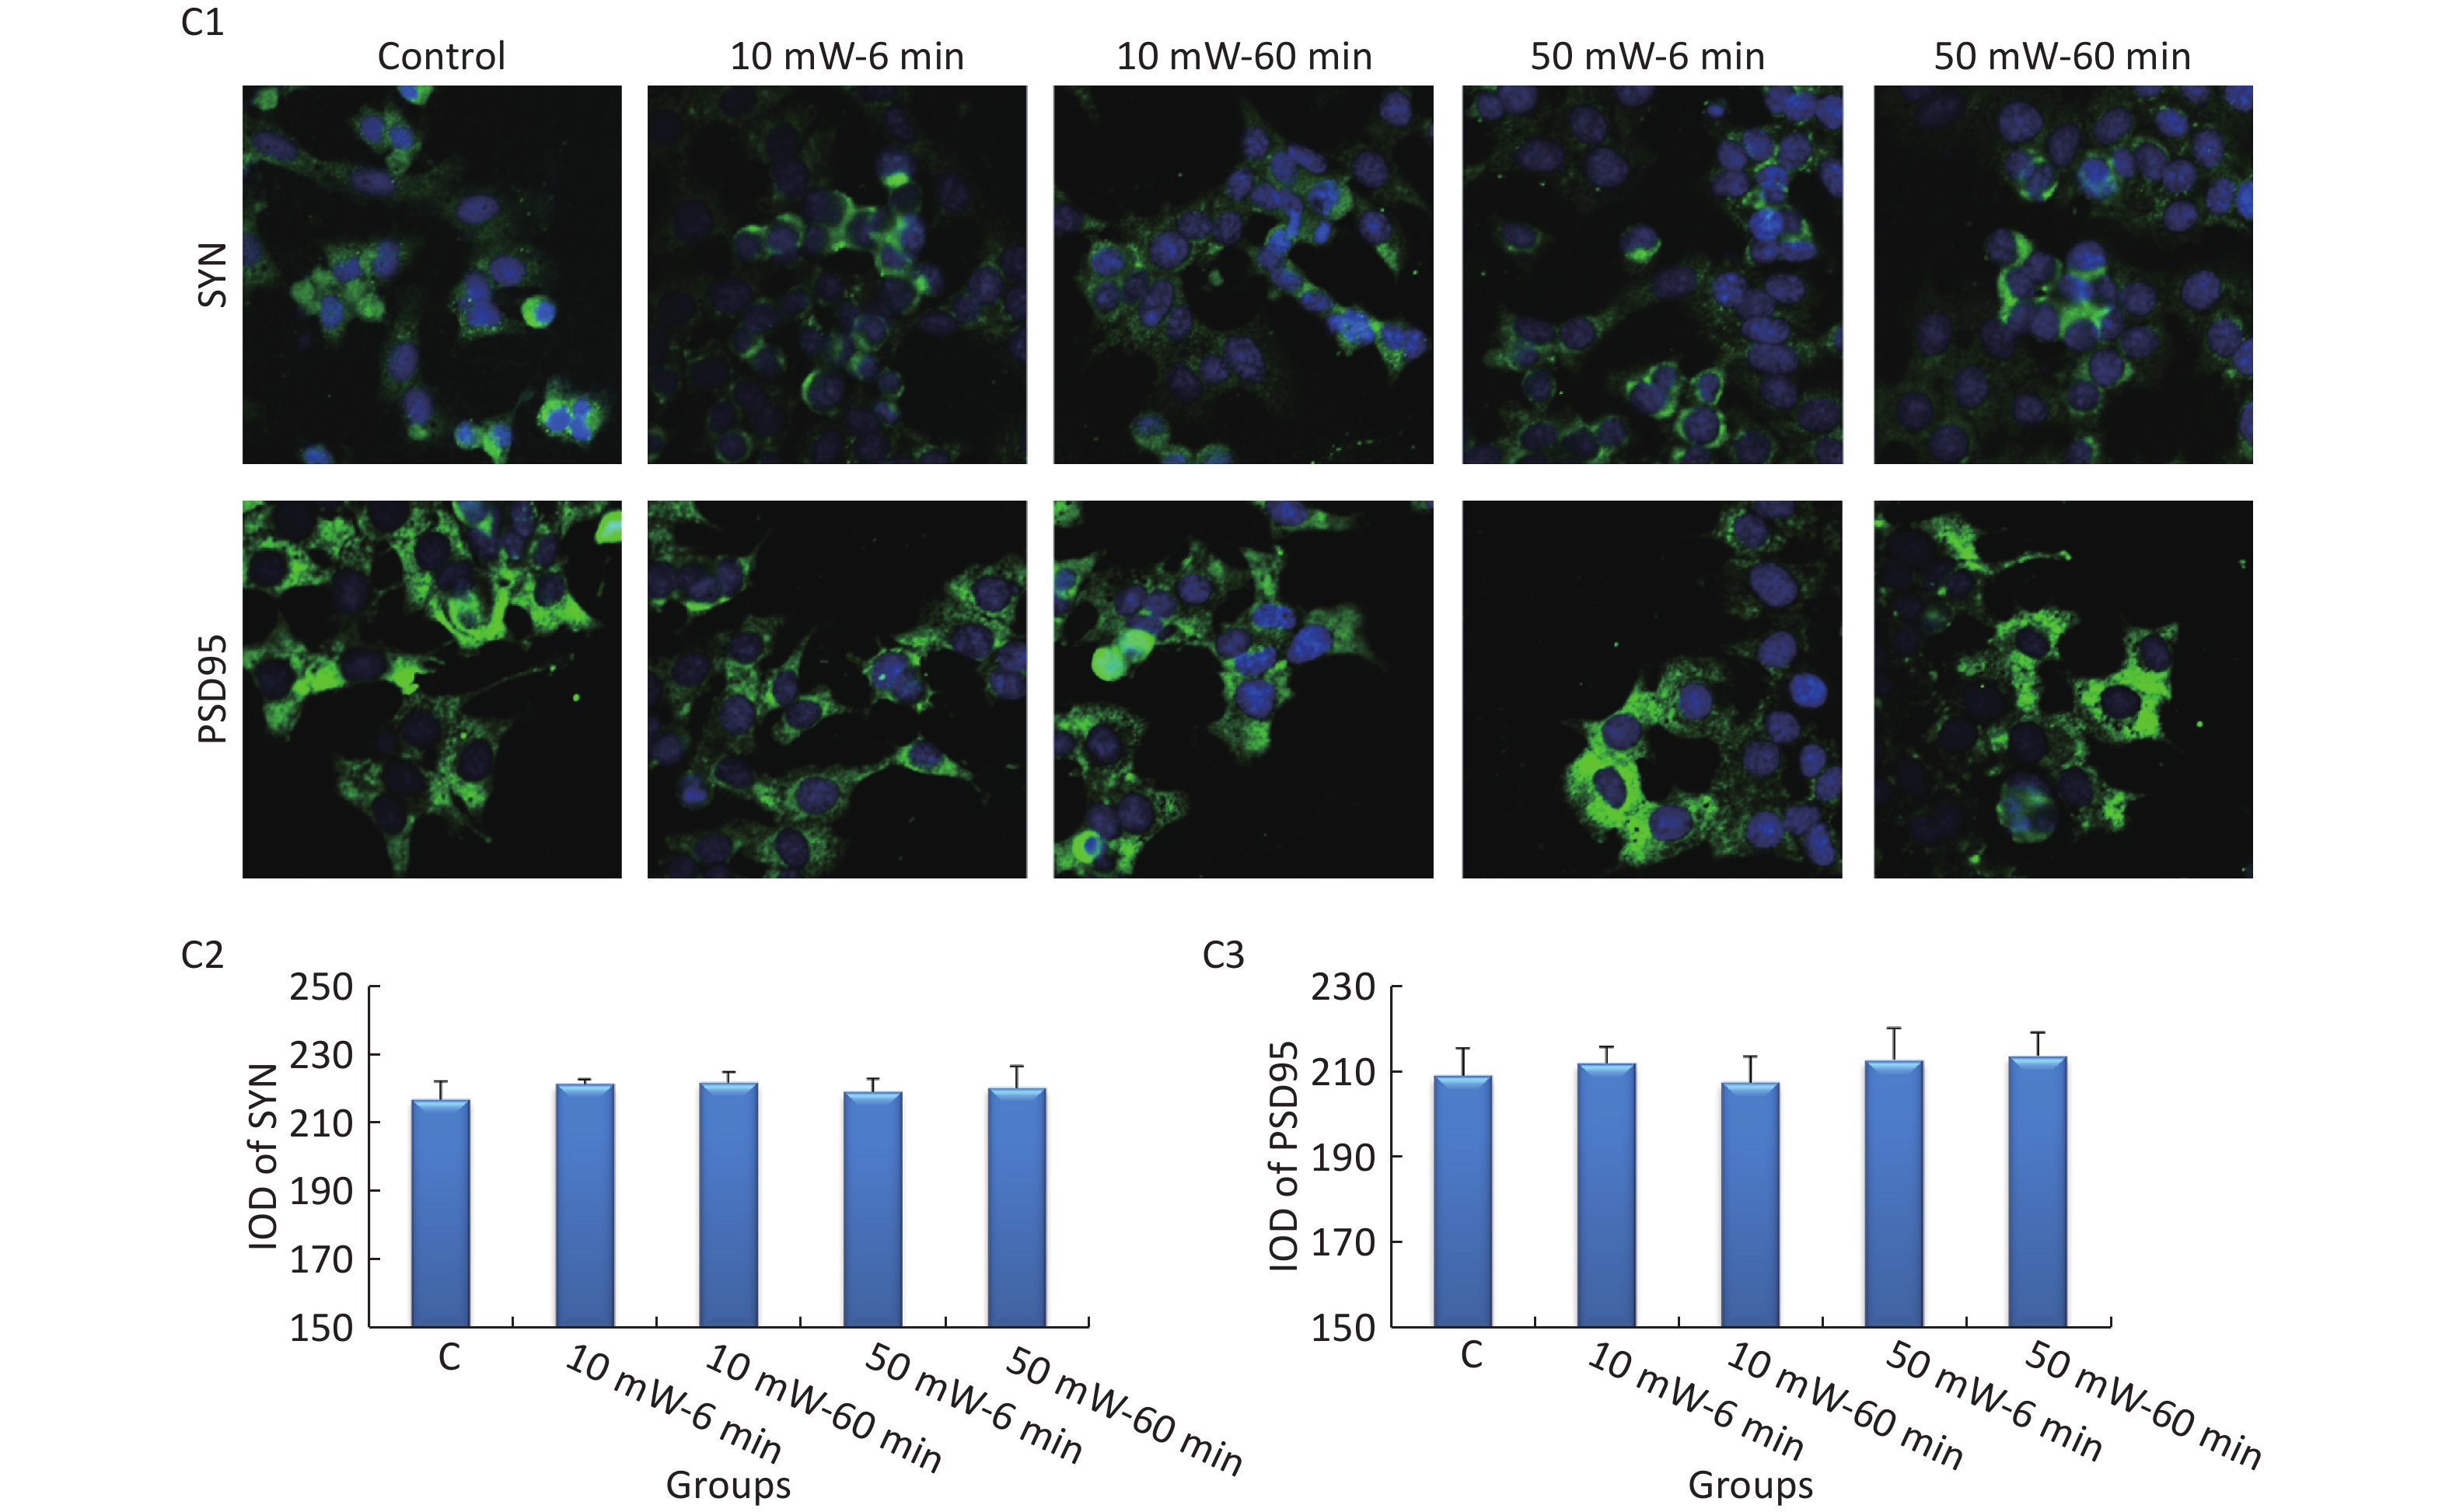
Figure 7. Expression of SYN and PSD95 in primary hippocampal and cortical cells and MN9D cells after 50 and 10 mW THz wave exposure (IF). For each kind of cell, 3 subfigures are shown as follows: (1) IF images and IODs of, (2) SYN, and (3) PSD95 after 50 and 10 mW THz wave exposure. (A1-A3) Primary hippocampal neurons (400× magnification); (B1-B3) primary cortical neurons (400× magnification for SYN; 800× magnification for PSD95); and (C1-C3) MN9D cells (400× magnification). *P < 0.05 vs. C; ##P < 0.01 for 50 mW-60 min vs. 50 mW-6 min and 10 mW-60 min vs. 10 mW-6 min; and △P < 0.05 and △△P < 0.01 for 50 mW-6 min vs. 10 mW-6 min and 50 mW-60 min vs. 10 mW-60 min. C, Control
In primary cultured cortical cells (Figure 7, B1-B3), the IOD of PSD95 was significantly decreased in the 50 mW-60 min and 10 mW-60 min groups compared to the Control group (P < 0.05). When comparing groups with the same THz wave, the IOD of PSD95 was significantly decreased in the 10 mW-60 min and 50 mW-60 min groups compared to the 10 mW-6 min (P < 0.01) and 50 mW-6 min (P < 0.01) groups, respectively. When comparing groups of the same exposure time, the IOD of PSD95 was significantly decreased in the 10 mW-60 min group compared to the 10 mW-6 min group (P < 0.01).
In MN9D cells (Figure 7, C1-C3), after THz wave exposure, no significant differences were observed in the expression of SYN and PSD95 among all the groups (Control, 10 mW-6 min, 10 mW-60 min, 50 mW-6 min, and 50 mW-60 min).
-
The brain is considered one of the most sensitive organs to electromagnetic radiation. In 2011, a case-control study of 221 central nervous system tumors showed that occupational exposure to extremely low frequency electromagnetic fields might play a role in the occurrence of meningioma[22]. In 2017, a review summarized many recent observations of harmful effects in the brain associated with mobile phone electromagnetic field exposure, and the results of several studies indicated an increase in cortical excitability with EMF exposure[23]. Because THz waves are a newly developing type of electromagnetic wave, the potential biological effects of THz waves on the brain are unknown. In this study, we explored the possible biological effects of 50 and 10 mW THz waves on neurons and neuron-like cells.
Currently, there are few studies on the biological effects of THz waves on the nervous system. Ol'shevskaia et al.[24] used a THz wave of 85.1 THz and 0.3-30 mW/cm2 to irradiate isolated rat brain slices for 20-40 min and showed neuronal cell membrane bulging, synaptic growth disorders and decreased membrane potential. In that study, the power density was high, and the thermal effects were unavoidable. THz waves have very significant thermal effects on biological structures because the energy of THz waves can be easily absorbed by polar molecules, such as water molecules.
In this study, we analyzed the temperature change of the cell culture medium during exposure and observed that the temperature change was much less than 1 ℃. Temperature changes less than 1 ℃ are considered to have minimal thermal effects on organisms. Therefore, the exposure effects investigated in this study were nonthermal effects.
Primary cultured neurons are neurons isolated from the brain regions of neonatal rats and are classic models for neurobiological research[25]. In addition, MN9D, PC12, and HT22 cells are also frequently used cell lines for in vitro neurobiological research[26-30]. The most characteristic structure of neurons is an abundant amount of neurites, which can connect with other neurons and transmit nerve impulses[31]. The length of neurites and the number of branches indicate the functional state of neurons.
In this study, the morphology of neurons was analyzed by morphological analysis software. We performed statistics and analyzed the total lengths and number of branches of neurites to evaluate the effects of THz waves on neurite growth, and no similar studies have been reported thus far. According to the results, we observed no effects of THz waves on neurite growth in any of the 7 kinds of cells (primary hippocampal neurons, primary cortical neurons, primary cerebellar neurons, primary brainstem neurons, MN9D cells, PC12, cells and HT22 cells).
SEM can be used to observe the micromorphology of neurons with a much better resolution than LM[32], and we explored the micromorphological changes in primary hippocampal, cortical and MN9D neurons with SEM. However, we observed no significant changes, indicating no noticeable effects of THz waves on the micromorphology of neurons under the experimental conditions.
Atomic force microscopy (AFM) can be used to measure the surface of an object at the nanometer level. A study has shown cell membrane bulging in neurons after THz wave exposure[24]. The important function of neurons is to maintain a stable membrane potential. Normal neurons must have a complete membrane structure; therefore, we aimed to observe changes in the cell membrane surface by high resolution AFM.
After statistical analysis, we did not observe any effects of THz waves on the roughness of the cell membrane under our experimental conditions. This might be because the output power used in this study was small and could not affect the structures of the cells.
-
In the brain, the most important mechanism of synaptic transmission is neurochemical transmission, which requires neurotransmitters[33]. Neurotransmitters bind to corresponding postsynaptic membranes and change the excitation states of neurons. Neurotransmitters include excitatory neurotransmitters and inhibitory neurotransmitters. Glu depolarizes the postsynaptic membrane to produce excitatory postsynaptic currents (EPSCs), while Gly and Ala cause postsynaptic membrane hyperpolarization to produce inhibitory postsynaptic currents (IPSCs)[34-37].
The results of this study showed that the changes in neurotransmitters were similar in primary hippocampal, cerebellar and brainstem neurons and MN9D cells after THz wave exposure (decreased Glu and/or increased Gly and Ala). Changes in the neurotransmitters indicated that these cells were in an inhibitory state. An excited state was observed in the primary cortical neurons (increased Glu and decreased Ala) after 10 mW THz wave exposure, and when 50 mW THz wave exposure, no changes in the neurotransmitters were observed. We speculated that 10 mW THz waves might more sensitive to cortical neurons. In HT22 cells, no significant changes in neurotransmitters were observed. This indicated that the responsiveness and sensitivity of different kinds of cells to THz waves with the same parameters were different.
In more than one neurotransmitter index and cell type, we observed that the 60 min exposure to THz waves led to more significant changes in neurotransmitters than the 6 min exposure. Similarly, it was observed that 50 mW THz wave exposure resulted in more significant changes in neurotransmitters than the 10 mW exposure. This indicated that the nonthermal biological effects of THz waves were positively correlated with exposure time and the effects of 50 mW THz wave were more obvious than 10 mW THz wave.
According to the changes in the neurotransmitters in each cell type, primary cultured neurons were more sensitive to THz waves than immortalized cell lines, and among them, primary hippocampal neurons were the most sensitive. For the cell lines, MN9D cells were the most sensitive. Beneficial stimulus effects were observed only in cortical neurons.
-
According to the results of the neurotransmitters, we believed that the effects in primary hippocampal and cortical neurons and MN9D cells were representative. In these 3 kinds of cells, we evaluated the effects of THz waves at molecular levels.
PSD95 and SYN are important synaptic-related molecules[38-41]. Changes in their contents indicate synaptic functions. It has been shown that an enhanced SYN expression level is associated with an improvement in cognitive function in rats[38], and the downregulation of PSD95 expression is associated with memory impairment after traumatic brain injury[42]. In this study, IF was used to analyze the expression of these two molecules. We observed that the 50 mW THz wave downregulated SYN expression in primary hippocampal neurons, and 50 mW and 10 mW THz waves downregulated PSD95 expression in primary cortical neurons. It was also observed that the effects were positively correlated with exposure time and the effects of 50 mW THz wave were more obvious than 10 mW THz wave. These results indicated that THz waves might have negative effects on synaptic functions.
-
Different cells responded differently to THz waves, but most of them showed inhibitory effects after THz wave exposure. The effects of neurons were closely related to the parameters of the THz wave (e.g., the 10 mW THz wave exposure had excitatory stimulatory effects on cortical neurons, while the 50 mW THz wave did not). THz waves could affect neurotransmitters and synaptic-related proteins under nonthermal conditions, and both changes indicated that THz waves might inhibit the normal function of neurons. The effects were positively correlated with exposure time and and the effects of 50 mW THz wave were more obvious than 10 mW THz wave. Based on the results of neurotransmitters and synaptic-related proteins, we believed that primary hippocampal and cortical neurons were THz-sensitive neurons. In neuron-like cell lines, the neurotransmitter results indicated that the MN9D cell line was more sensitive than other cell lines.
Although 10 mW and 50 mW THz waves had different frequencies, we mainly wanted to discuss the power-related effects, and found out that the biological effects of THz waves might closely positively related with its power, which we will explore in depth in the future.
No evidence of morphological damage was observed under the conditions of this study, possibly because the THz power density was too low to cause substantial damage under these experimental conditions.
We hope that our findings will be helpful for future studies of the biological effects of THz waves. Currently, there is a lack of understanding of the biological effects of THz waves. With the development of THz wave applications, research on its biological safety, public safety and safety standards should also be conducted.
-
This work has been carried out with finantial support from the National Defense Science and Technology Innovation Special Zone Project.
Exposure Effects of Terahertz Waves on Primary Neurons and Neuron-like Cells Under Nonthermal Conditions
doi: 10.3967/bes2019.094
- Received Date: 2019-03-01
- Accepted Date: 2019-09-16
-
Key words:
- Terahertz wave /
- Biological effects /
- Neurons /
- Neurotransmitter /
- SYN /
- PSD95
Abstract:
| Citation: | TAN Sheng Zhi, TAN Peng Cheng, LUO Lan Qing, CHI Yun Liang, YANG Zi Long, ZHAO Xue Long, ZHAO Li, DONG Ji, ZHANG Jing, YAO Bin Wei, XU Xin Ping, TIAN Guang, CHEN Jian Kui, WANG Hui, PENG Rui Yun. Exposure Effects of Terahertz Waves on Primary Neurons and Neuron-like Cells Under Nonthermal Conditions[J]. Biomedical and Environmental Sciences, 2019, 32(10): 739-754. doi: 10.3967/bes2019.094

|

 Quick Links
 DownLoad: