

 下载:
下载:


-
Acrylamide (ACR) is a water-soluble vinyl monomer that has multiple chemical and industrial applications, e.g., in waste water management and ore processing. In addition, ACR is used extensively in molecular laboratories for gel chromatography and is present in certain foods that have been prepared at high temperatures[1-3]. Therefore, ACR poses potential risks to public health and the environment. ACR can cause neurotoxicity, reproductive toxicity, genotoxicity, and carcinogenicity in animals and neurotoxicity in humans. The neurotoxic properties of ACR have been studied mostly because the neurotoxic effects are the only toxic effects that have been shown in humans related to occupational exposure and in experimental animal studies[1].
Currently, there are three hypotheses on the mechanism of ACR neurotoxicity: (1) inhibition of kinesin-based fast axonal transport, (2) alteration of neurotransmitter levels, and (3) direct inhibition of neurotransmission[1, 4-6]. It has been shown that ACR decreases the concentration of noradrenalin, dopamine, and 5-hydroxytryptamine in the central nervous system (CNS)[7]. Our previous results showed that ACR subacute exposure reduced the concentration of the excitatory neurotransmitter glutamate in the CNS and may be one of the mechanisms that lead to ACR neurotoxicity[8]. A growing body of evidence now indicates that the nerve terminal is one of the targets or primary sites of ACR action[9-10]. Furthermore, the synapse, as the key structure of the nerve terminal, is the physiological unit that is essential for the maintenance of normal neurophysiologic activity and neurotransmitter release. There are many different types of synapses, but all presynaptic terminals share a similar structural organization. Synapses harbor a varying number of synaptic vesicles accumulated around release sites as a prerequisite for the quantal release of neurotransmitters following depolarization[11]. The synaptic transmission is the most important mode of action in the CNS; the conversion of electrical signals into chemical signals is mediated by the transportation of synaptic vesicles to the active zone and neurotransmitter release across the synapse. Therefore, a steady distribution state of synaptic vesicles is critical for maintaining normal synaptic function. Therefore, in this study, the ultra-structure of the synapse and the distribution of the synaptic vesicles in pre-synaptic areas were investigated by electron microscopy.
Although the protein components of pre-and post-synaptic structures are currently being described and investigated in other studies, the roles of specific synaptic proteins in ACR-induced neurotoxicity remain unknown. Synapsin Ⅰ belongs to the Synapsin family and is the most abundant phosphoprotein present in the synapses of the CNS[12]. Synapsin Ⅰ is mainly distributed on the outer surface of the small synaptic vesicle membranes of the central nerve terminals of neurons and can be seen as a specific marker of axon terminals that reflects synaptic density and distribution. Synapsin Ⅰ acts as a linker among synaptic vesicles[12] and between synaptic vesicles with actin filaments[13], which can dynamically adjust synaptic vesicle clusters as well as transport and release via phosphorylation/dephosphorylation, thereby affecting the release of neurotransmitters[14]. The results of a preliminary study indicated that ACR subacute exposure leads to a decrease in Synapsin Ⅰ protein expression in the spinal cord of rats[15], suggesting that Synapsin Ⅰ may be a biomarker of synaptic neuropathy induced by ACR.
Based on these previous findings, the present study was designed to investigate the subacute neurotoxic effects on the cerebral cortex and cerebellum induced by ACR in rats, particularly in terms of functional damage on synaptic proteins and synaptic vesicles to determine the mechanism of ACR neurotoxicity at the synapse level.
-
ACR (technical grade with a purity exceeding 98%) was purchased from Sinopharm Chemical Reagent Co., Ltd (Beijing, China). Paraformaldehyde was purchased from Solarbio Technology (Beijing, China). Mouse anti-GAPDH monoclonal antibody, HRP conjugated goat anti-rabbit IgG, HRP conjugated goat anti-mouse IgG, and Western Blot Kit were obtained from Jiangsu Cowin Biotech Co., Ltd (Beijing, China). Anti-Synapsin Ⅰ rabbit polyclonal antibody was bought from AbcamCo., Ltd (Shanghai, China). Anti-P-Synapsin Ⅰ rabbit polyclonal antibody was bought from Cusabio Biotech Co., Ltd (Wuhan, China). All other chemicals were obtained from the Beijing Chemical Reagents Company (China) or Sigma-Aldrich.
-
Thirty-six adult male Sprague Dawley (SD) rats were obtained from Beijing Vital River laboratory animal technology (China). The rats were five-week-old specific pathogen free (SPF) rats, with body weights ranging from 160 g to 180 g. They were fed ad libitum Certified Rodent Chow and water in individual stainless steel wire bottom cages. The animal room was maintained at 22 ± 2 ℃ with 40%-80% humidity and a 12/12 light/dark cycle. All rats were acclimated to the environment for 5 days prior to the study. The use of animals and experimental protocols was approved by the Committee of Experimental Animal Welfare and Ethics of the National Institute of Occupational Health and Poison Control, Chinese Center for Disease Control and Prevention. The animal model of ACR-induced subacute neurotoxicity was established according to published literature and our prior work[8, 16]. Healthy rats were randomly divided into three groups (12 animals per group). The ACR treatment groups were given 5 mL/kg of ACR (30 mg/kg and 50 mg/kg, ACR dissolved in normal saline) by intraperitoneal injection. The NS control group was given an equivalent volume (5 mL/kg) of NS by intraperitoneal injection. Animals in these three groups were treated once a day for 11 days consecutively. Body weight and neurological changes were measured once a day during the 11-day treatment. The animals were monitored twice a day. All rats were euthanized by carbon dioxide at the end of the test.
-
Toxicant-induced neurological disorders were quantified using gait scores as described in previously published work[8]. The testing index was determined on treatment day 7 and 11. The assigned scores were as follows: 1 = normal gait, 2 = slightly abnormal gait (hind limb adduction), 3 = moderately abnormal gait (obvious ataxia and foot splay with limb abduction), and 4 = severely abnormal gait (dragging hind limbs, inability to support body weight, and foot splay).
-
Histological examination was done on tissues from the NS control group and the ACR treatment groups. Standard tissue sections were taken from the cerebral cortex and cerebellum tissues (n = 3 for each group) after perfusion fixation in 4% paraformaldehyde. Standard hematoxylin/eosin (H & E) staining was performed for light microscopy observation. Other samples (n = 3 for each group) were fixed in 2% paraformaldehyde and 2.5% glutaraldehyde in 0.1 mol/L cacodylate buffer, post-fixed in osmium tetroxide, dehydrated in graded ethanol, and embedded in Eponate 12 resin. Ultrathin sections were sliced on a Leica EM UC6 ultramicrotome. TEM images were collected using a Hitachi transmission electron microscope equipped with a CCD camera and were examined by experienced pathologists (General Hospital of Beijing Military Region, Beijing, China). The active zone distance (AZD) and nearest neighbor distance (NND) of synaptic vesicles in the cerebral cortex and cerebellum were measured by Image Tool and LoClust software[17]. The center of each vesicle was marked by Image Tool software to determine the coordinates of each synaptic vesicle. LoClust software measured the AZD and NND values using x-and y-coordinate values for vesicle profile centers and points tracing the active zone profile as an input and calculates the AZD and NND values either in pixels or calibrated with a known distance.
-
The protein expression levels of Synapsin Ⅰ and P-Synapsin Ⅰ were measured by Western blotting. Whole tissue extracts (n = 6 for each group) from the cerebral cortex and cerebellum were prepared by homogenization in RIPA lysis buffer. The total protein content of the tissues was separated by SDS-PAGE. Protein extraction buffer and phenylmethylsulfonyl fluoride (PMSF) were put into sediments and centrifuged at 16, 000 × g for 15 min at 4 ℃. The protein concentration was measured with a bicinchoninic acid (BCA) protein assay kit. An 8% separation gel and a 5% stacking gel were prepared. Proteins and sample buffers were mixed at a proportion of 4:1. The mixture was transferred to a nitrocellulose membrane, which was soaked in 5% nonfat milk to block nonspecific binding and incubated for 12 h at 4 ℃ with Synapsin Ⅰ polyclonal antibody (Abcam, 1:4, 000 in 5% nonfat milk) or P-synapsin Ⅰ polyclonal antibody (Cusabio Biotech, 1:500 in 5% nonfat milk). After three 10-min washing steps in Tris-buffered saline with Tween (TBST), the membrane was incubated for 1 h with secondary antibody (Cowin Biotech, 1:4, 000 in 5% nonfat milk). The membrane was then washed three times for 10 min in TBST. 1 mL of ECL chemiluminescence liquid was placed on the membrane for 2 min in the dark. The photographs were developed in a dark room. GAPDH was used as a reference (1:4, 000 in 5% nonfat milk). The bands were scanned, and the band intensities on the films were quantified using ImageJ software.
-
Experiments were conducted in duplicate and repeated three times. Data are expressed as mean ± standard deviation (SD). Behavioral analyses were performed by experimenters blind to group identity. Statistical analyses were conducted using SAS software (SAS Institute Inc., Cary, NC, USA, version 9.3). The Shapiro-Wilk test was used to test for normal distributions. The Bartlett test was used to test for homogeneity of variance. For data that was normally distributed and had homogeneity of variance, the differences between groups were evaluated by repeated measures ANOVA followed by Bonferroni correction. Otherwise, the Kruskal-Wallis test was used. The Cochran-Armitage trend test was applied to analyze the RRP and reverse pool (RP) vesicle distribution ratio. Significance was set at P < 0.05.
-
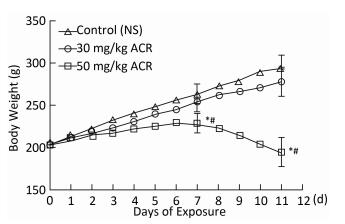
Body weight changes are shown in Figure 1. Rats in the NS control group showed a steady gain in body weight throughout the test period. However, when exposed to 50 mg/kg ACR, a significant reduction in body weight was observed at the end of the test compared with both the NS control group and 30 mg/kg ACR treatment group (P < 0.05). No significant difference in body weight was found between rats in the 30 mg/kg ACR treatment group and the NS control group (P > 0.05).

Figure 1. Effect of ACR on rat body weight. Data are expressed as x±s. #Significant difference compared with control, P < 0.05. *Significant difference compared with the 30 mg/kg ACR treatment group, P < 0.05.
-
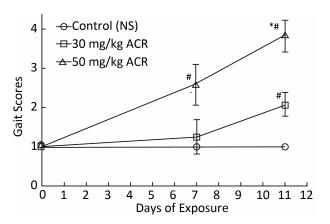
Abnormal posture of the foot or leg, distorted gait, foot dragging, and muscle weakness were observed in the ACR treatment groups, and typical abnormal gaits were analyzed as shown in Figure 2. Rats in the 30 mg/kg and 50 mg/kg ACR groups showed a significant increase in gait scores compared with the NS control group at the end of the test (P < 0.05). Gait scores of rats treated with 50 mg/kg ACR were increased significantly compared with the control (NS) group and the 30 mg/kg ACR treatment group at the end of the test (P < 0.05). The high incidence of neurological abnormalities observed in rats treated with ACR (50 mg/kg) was more prominent than that of the 30 mg/kg ACR-treated group and the NS control group at the two evaluations (day 7 and 11).

Figure 2. Gait score analysis for the NS control group and the ACR (30 mg/kg and 50 mg/kg) treatment groups. Data are expressed as x±s. #Significant difference compared with control, P < 0.05. *Significant difference compared with the 30 mg/kg ACR treatment group, P < 0.05.
-
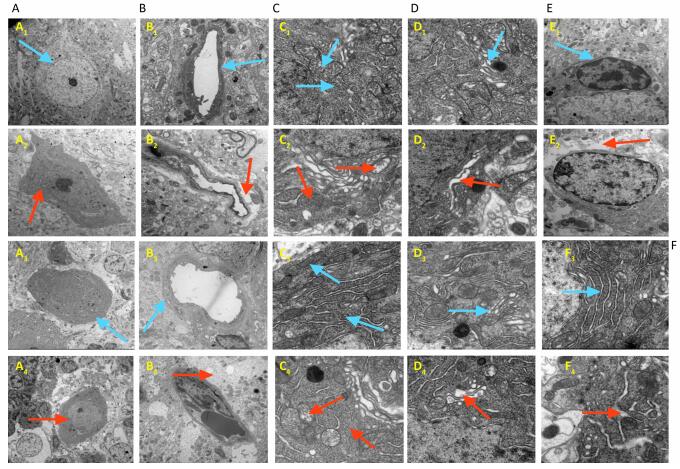
Ultra-structural analysis of the cerebral cortex and cerebellum tissues showed clear CNS neuropathy (Figures 3 and 4). 50 mg/kg ACR exposure led to widened pericellular spaces of the cortical neurons, cortical neuron basophilic chromatin enhancement, widened pericellular spaces of the Purkinje cells, irregular shape and loss of Purkinje cells, neuronal contraction, nuclear membrane intro cession, glial cell edema, blood brain barrier (BBB) structural damage, mitochondrial damage, depolymerization of polyribosomes and the rough endoplasmic reticulum, and Golgi apparatus dilation in the cerebral cortex and cerebellum.

Figure 3. Histological examination using H & E staining for the NS control group and the ACR (50 mg/kg) treatment group. Typical morphological changes of cerebral cortex (A) and cerebellum (B) were photographed. 1-2: magnification 200×, 3-4: magnification 400 ×. A1, A3, B1, B3: NS control group, A2, A4, B2, B4: 50 mg/kg ACR treatment group. Typical pathological changes are noted by arrowheads: widened pericellular spaces of the cortical neurons, cortical neuron basophilic chromatin enhancement, widened pericellular spaces of the Purkinje cells, and irregular shape and loss of Purkinje cells.

Figure 4. Ultra-structural analysis by electron microscopy for the NS control group and the ACR (50 mg/kg) treatment group. Typical morphological changes of the cerebral cortex (1, 2) and the cerebellum (3, 4) were photographed. 1, 3: NS control group, 2, 4: 50 mg/kg ACR treatment group. (A) Neurons, (B) Blood brain barrier (BBB), (C) itochondria and polyribosomes, (D) golgi apparatus, (E) glial cell, (F) rough endoplasmic reticulum. Clear pathological changes are noted by red arrowheads: A2, A4: neuron contraction, nuclear membrane introcession; B2, B4: BBB structural damage; C2, C4: mitochondrial damage, depolymerization of polyribosomes; D2, D4: golgi apparatus dilation; E2: glial cell edema; F4: rough endoplasmic reticulum dilation.
-
Changes in the number of synapses in the CNS are shown in Figure 5. The number of synapses in the cerebral cortex and cerebellum of rats treated with 30 mg/kg ACR was decreased significantly compared with the NS control group at the end of the test (P < 0.05), and the number of synapses in cerebral cortex and cerebellum of rats treated with 50 mg/kg ACR was decreased significantly compared with both the NS control group and 30 mg/kg ACR treatment group at the end of the test (P < 0.05).

Figure 5. Changes in the number of synapses in the cerebral cortex and cerebellum. (A) Number of synapses in the cerebral cortex. (B) Number of synapses in the cerebellum. Data are expressed as x±s. #Significant difference compared with control, P < 0.05. *Significant difference compared with the 30 mg/kg ACR treatment group, P < 0.05.
-
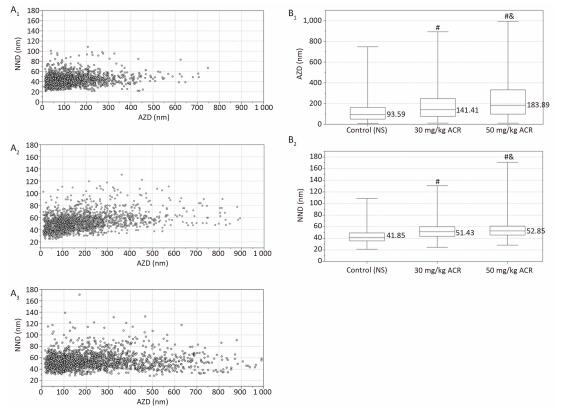
The center of each vesicle was marked using Image Tool software. The AZD was defined as the shortest distance between the center of the vesicles to the active zone (Figure 6). The NND was defined as the distance between the center points of the nearest two vesicles as determined by LoClust software (Figure 6). The scatter plot and box plot of the synaptic vesicles in the cerebral cortex (Figure 7) and cerebellum (Figure 8) show that the distribution of synaptic vesicles in the cerebral cortex and cerebellum of rats was more dispersed with increasing concentration of ACR. The interquartile range of AZD and the maximum and median of AZD and NND increased with increasing ACR concentration. The AZD and NND of the synaptic vesicles in the cerebral cortex and cerebellum of rats treated with 30 mg/kg ACR was increased significantly compared with the NS control group at the end of the test (P < 0.01), and the AZD and NND of synaptic vesicles in the cerebral cortex and cerebellum of rats treated with 50 mg/kg ACR was increased significantly compared with both the NS control group and 30 mg/kg ACR treatment group at the end of the test (P < 0.01).

Figure 6. Analysis of synaptic vesicles in the cerebral cortex and cerebellum. (A) Synapses were photographed by electron microscopy at a magnification of 100, 000 ×, and this indicated clear structures of normal synapses, including synaptic vesicles, active zones, and post-synaptic density. (B) ImageTool and LoClust software were used to measure the AZD and NND of the synaptic vesicles.

Figure 7. Analysis of AZD and NND in the cerebral cortex. (A1) Scatter plot of synaptic vesicles in the control (NS) group; (A2) scatter plot of synaptic vesicles in the 30 mg/kg ACR treatment group; (A3) scatter plot of synaptic vesicles in the 50 mg/kg ACR treatment group; (B1) box plot of AZD for the NS control group and ACR (30 mg/kg and 50 mg/kg) treatment groups; (B2) box plot of NND for the NS control group and ACR (30 mg/kg and 50 mg/kg) treatment groups. #Significant difference compared with control, P < 0.01. & Significant difference compared with the 30 mg/kg ACR treatment group, P < 0.01.

Figure 8. Analysis of AZD and NND in the cerebellum. (A1) Scatter plot of synaptic vesicles in the control (NS) group; (A2) scatter plot of synaptic vesicles in the 30 mg/kg ACR treatment group; (A3) scatter plot of synaptic vesicles in the 50 mg/kg ACR treatment group; (B1) box plot of AZD for the NS control group and ACR (30 mg/kg and 50 mg/kg) treatment groups; (B2) box plot of NND for the NS control group and ACR (30 mg/kg and 50 mg/kg) treatment groups. #Significant difference compared with control, P < 0.01. & Significant difference compared with the 30 mg/kg ACR treatment group, P < 0.01.
A 3 × 2 contingency table chi-square test and the Cochran-Armitage trend test were used to analyze the ratio of the distribution of vesicles in the RRP and RP in the cerebral cortex (Table 1) and cerebellum (Table 2) of the NS control group, the 30 mg/kg ACR exposure group, and the 50 mg/kg ACR exposure group. The results showed that the distribution of vesicles in RRP and RP in the cerebral cortex and cerebellum were all significantly different (cerebral cortex, χ2= 265.4468, P < 0.01; cerebellum, χ2= 340.6080, P < 0.01), and the changes in the distribution of the synaptic vesicles in the RRP and RP in the cerebral cortex and cerebellum had the same trend, that the proportion of synaptic vesicles in the RRP decreased while that in RP increased with increasing concentration of ACR (cerebral cortex, Z = -16.2104, P < 0.01; cerebellum, Z = -18.3149, P < 0.01). The chi-square test was used to compare the ratio of the distribution of synaptic vesicles in the RRP and RP in the cerebellum among the NS control group, the 30 mg/kg ACR group, and the 50 mg/kg ACR group with Bonferroni adjustment for multiple testing. The results indicated that the pairwise comparison of the distribution of vesicles in the RRP and RP of three groups had significant differences (P < 0.01).
Table 1. The Distribution of Synaptic Vesicles in the RRP and RP in the Cerebral Cortex
Group RRP (AZD ≤ 200 nm) RP (AZD > 200 nm) Total Control (NS) 1498 383 1881 30 mg/kg ACR* 1291 567 1858 50 mg/kg ACR*# 1038 849 1887 Note. *Significant difference compared with control, P < 0.01. #Significant difference compared with the 30 mg/kg ACR treatment group, P < 0.01. Table 2. The Distribution of Synaptic Vesicles in the RRP and RP in the Cerebellum
Group RRP (AZD ≤ 200 nm) RP (AZD > 200 nm) Total Control (NS) 1503 334 1837 30 mg/kg ACR* 1188 653 1841 50 mg/kg ACR*# 991 866 1857 Note. *Significant difference compared with control, P < 0.01. #Significant difference compared with the 30 mg/kg ACR treatment group, P < 0.01. -
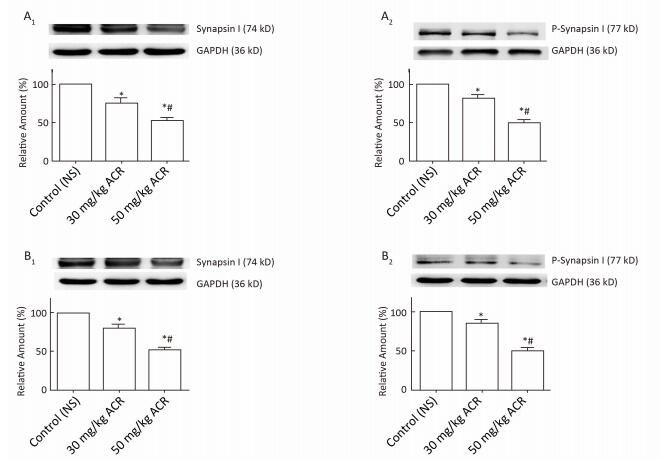
The protein expression levels of Synapsin Ⅰ and P-Synapsin Ⅰ are listed in Figure 9. The protein expression levels of Synapsin Ⅰ and P-Synapsin Ⅰ in the cerebral cortex and cerebellum of rats treated with 30 mg/kg ACR were decreased significantly compared with the NS control group at the end of the test (P < 0.05), and the protein expression of Synapsin Ⅰ and P-Synapsin Ⅰ in the cerebral cortex and cerebellum of rats treated with 50 mg/kg ACR was decreased significantly compared with the NS control group and 30 mg/kg ACR treatment group at the end of the test (P < 0.05).

Figure 9. The expression of Synapsin Ⅰ and P-Synapsin Ⅰ in the cerebral cortex and cerebellum. Synapsin Ⅰ and P-Synapsin Ⅰ protein levels in different groups were determined using western blotting and are expressed as the percentage of Synapsin Ⅰ/GAPDH or P-Synapsin Ⅰ/GAPDH. Representative immunoblots are shown in the graph. (A) cerebral cortex, (B) cerebellum, 1: Synapsin Ⅰ, 2: P-Synapsin Ⅰ. The data are expressed as x±s. *Significant difference compared with control, P < 0.05. #Significant difference compared with the 30 mg/kg ACR treatment group, P < 0.05.
-
As common nerve poison, ACR causes different kinds of neuropathy depending on the duration and concentration of exposure. Workers exposed to ACR develop central and/or peripheral nerve syndromes such as cerebellar ataxia and peripheral neuropathy. In the present study, abnormal posture of the foot or leg, distorted gait, foot dragging, and muscle weakness were observed in the ACR treatment groups, and the high incidence of neurological abnormalities observed in rats treated with ACR (50 mg/kg) was more prominent than that of the 30 mg/kg ACR treated group and the NS control group.
To find the structure-based mechanism of these neurological abnormalities, the morphology of the rat cerebral cortex and cerebellum was examined by light microscopy, and the synaptic ultra-structure was investigated by electron microscopy. The results showed that ACR subacute exposure can cause serious pathological damage to the rat CNS such as widened pericellular spaces of the cortical neurons, cortical neuron basophilic chromatin enhancement, widened pericellular spaces of Purkinje cells, irregular shape and loss of Purkinje cells, neuronal contraction, nuclear membrane introcession, glial cell edema, BBB structural damage, mitochondrial damage, depolymerization of polyribosomes and the rough endoplasmic reticulum, and Golgi apparatus dilation. Further more, ACR subacute exposure reduced the number of synapses in the cerebral cortex and cerebellum.
Neurons are the core components of the CNS and process and transmit information through electrical and chemical signals. Previous research has shown that the nerve terminal is a target or primary site of ACR action[9-10]. Synapses, as the key structure of nerve terminals, are essential to neuronal function in that they transmit information among neurons and between neurons and effector cells. ACR subacute exposure can cause neuronal structural damage and reduce the number of synapses in the cerebral cortex and cerebellum, which might interrupt normal information transmission processes in the CNS and cause neurological abnormalities. Additionally, ACR subacute exposure can cause BBB structural damage, which can weaken the protective function of the CNS and make it easier for neurotoxins to reach the CNS and cause serious damage. Depolymerization of polyribosomes and the rough endoplasmic reticulum as well as Golgi apparatus dilation may interrupt normal synthesis of proteins and induce abnormal functional changes. Mitochondria are enriched at the synapse in adult neurons, leading to ATP generation, and have important functional roles in buffering calcium fluxes during synaptic transmission and providing energy for synaptic vesicle release and recycling[18]. Mitochondrial damage can thus interrupt ATP generation and may influence neurotransmitter release.
As we know that the most important mode of action in the CNS is neurochemistry of synaptic transmission. The function of neurons is to convert electrical into chemical signals, which is mediated by neurotransmitter release. Neurotransmitters play a key role and can be divided into excitatory and inhibitory neurotransmitters. Glutamate is the most important and widespread excitatory neurotransmitter of the brain[19] and is mainly distributed in the cerebral cortex and the cerebellum, as well as in other regions. Combined with specific receptors of the postsynaptic membrane, glutamate can decrease the postsynaptic membrane potential, resulting in excitatory postsynaptic potentials that lead to postsynaptic neuronal excitatory effects and play a significant role in learning, memory, and neuronal plasticity. Our previous results showed that ACR subacute exposure reduces the excitatory neurotransmitter glutamate in the cerebral cortex and cerebellum, which may be one of the mechanisms that lead to ACR neurotoxicity[8]. Neurotransmitters are stored in synaptic vesicles and are mediated by transportation of synaptic vesicles to the active zone, so the steady distribution state of synaptic vesicles is essential for maintaining the normal function of synapses.
To further explore the mechanism of the abnormal release of neurotransmitters induced by ACR, we analyzed the distribution of synaptic vesicles in pre-synaptic areas. In this study, AZD was defined as a measure of situation change of synaptic vesicles with respect to the synaptic active zone and NND as a measure of the cluster state of synaptic vesicles[17] to reveal ACR subacute exposure effects on synaptic vesicle distribution in the pre-synaptic areas. The results indicated that with increasing ACR concentrations, a more dispersed distribution of synaptic vesicles was observed, and both AZD and NND in the cerebral cortex and cerebellum showed increasing trends. As previous studies have noted, neurotransmitters are stored in synaptic vesicles, and a clustered arrangement of synaptic vesicles is a structural feature typical of a functional chemical synapse[17]. Furthermore, synaptic vesicles need to be transported to the synaptic active zone to complete the process of neurotransmitter release, and therefore the normal cluster state and arrangement of synaptic vesicles with respect to the synaptic active zone are closely related to the normal function of synapses. The increase in the AZD and NND may delay the transport of synaptic vesicles to the synaptic active zone, resulting in disorders of neurotransmitter release.
Based on the likelihood of the release of synaptic vesicles, synaptic vesicles are divided into two pools, the RRP and the RP. The synaptic vesicles of the RRP are close to active zones and are more likely to release, whereas the synaptic vesicles of the RP are more distant from active zones and can move closer under stimulation to replenish the vesicles in the RRP[11]. In this study, we defined that the synaptic vesicles belonged to the RRP if the AZD was within 200 nm and the RP if the AZD was greater than 200 nm[11, 20-21]. Our results show that ACR subacute exposure altered the ratio of the distribution of synaptic vesicles in both the RRP and RP, the proportion of synaptic vesicles in the RRP in the cerebral cortex and cerebellum increased, and the proportion of synaptic vesicles in the RP in the cerebral cortex and cerebellum decreased in a dose-dependent manner (P < 0.01), all of which may lead to impaired neurotransmitter release and lead to related neurotoxicity.
As the major synaptic phosphoproteins, Synapsin Ⅰ and its phosphorylated counterpart (P-Synapsin Ⅰ) are involved in the regulation of synaptogenesis and neurotransmitter release[14]. Synapsin Ⅰ has several protein kinase phosphorylation sites, including protein kinase A (PKA), calmodulin kinase (CaMK) Ⅰ/Ⅳ, Ⅱ, extracellular signal-regulated kinase (ERK) 1/2, Src, and cyclin-dependent kinase (CDK) 1/5. Studies have shown that in Synapsin Ⅰ knockout mice, the distribution of synaptic vesicles becomes dispersed, the number of synaptic vesicles clustering at the area of the active zone decreases, glutamate release of peripheral nerves is reduced[22], and the number of synaptic vesicles in the RRP pool is reduced in inhibitory synapses[23]. In Synapsin Ⅰ/Ⅱ double knockout mice, the number of synaptic vesicles is reduced by 50%-60% in the CNS[24], and the content of glutamate and γ-aminobutyric acid in the synaptic vesicles is reduced by 48%-60%[25].
To determine the protein-based mechanism of the distribution of synaptic vesicles, we evaluated the expression levels of Synapsin Ⅰ and P-Synapsin Ⅰ. Synaptic vesicles are connected by Synapsin Ⅰ homodimers or Synapsin Ⅰ/Ⅱ heterodimers[12], which include the non-phosphorylated state of Synapsin Ⅰ; therefore, the non-phosphorylated state of Synapsin Ⅰ plays a significant role in maintaining the clustering state of synaptic vesicles. In this study, ACR subacute exposure reduced Synapsin Ⅰ protein expression in the cerebral cortex and cerebellum, which might affect Synapsin Ⅰ homodimers or Synapsin Ⅰ/Ⅱ heterodimers between synaptic vesicles and increase the NND of synaptic vesicles. Synapsin Ⅰ links synaptic vesicles to actin filaments. Synapsin Ⅰ phosphorylation at a PKA site can dissociate Synapsin Ⅰ from the synaptic vesicle membrane surface, reduce synaptic vesicle binding capacity with actin filaments, enhance synaptic vesicle exocytosis, and accelerate the speed of the synaptic vesicle cycle[26-28]. In this study, ACR subacute exposure reduced the P-Synapsin Ⅰ protein expression in the cerebral cortex and cerebellum, which made synaptic vesicles difficult to dissociate from the synaptic vesicle-Synapsin Ⅰ-actin complex to transport to the synaptic active zone, and thus increased the AZD of synaptic vesicles and reduced the proportion of synaptic vesicles in the RRP. Changes of the distribution state of synaptic vesicles in pre-synapse areas may affect the transport and release processes of synaptic vesicles, resulting in abnormal neurotransmitter release, eventually causing abnormal CNS function.
In conclusion, the results of the present study show that ACR subacute exposure contributes to the structural damage of the cerebral cortex and cerebellum. The reduction in the protein expression of Synapsin Ⅰ and P-Synapsin Ⅰ might lead to changes in the distribution of synaptic vesicles in pre-synaptic areas (increase the AZD and NNDand reduce the proportion of synaptic vesicles in the RRP in the cerebral cortex and cerebellum), thereby causing a reduction in the excitatory neurotransmitter glutamate release in the rat CNS, and eventually induce abnormal neurobehavior. The functional damage of synaptic proteins and synaptic vesicles may thus be an ACR neurotoxicity mechanism.
ACR is known to decrease the CNS concentration of noradrenalin, dopamine, and 5-hydroxytryptamine. Previously published work has shown that the binding of ACR to sulfhydryl groups on cysteine residues of proteins that have important roles in the membrane fusion process may interfere with these in synaptic vesicles with their target membranes at the nerve terminus, which may lead to a reduction of neurotransmitters and eventually nerve terminal degeneration[1]. Our work provides a possible protein-based mechanism of the change in the distribution of synaptic vesicles for the reduction of related neurotransmitters.
-
We acknowledge Dr. Alexander G. Nikonenko for kindly providing us with LoClust software.
-
Experimental analyses were performed by ZB, SH, WX, and LZ. Statistical analyses were performed by ZB, SH, WX, and CX. The paper was written by ZB and SH, and the references were checked by CX Sample collection was done by CP, ZD, and YY Quality assurance and technical guidance were done by XJ and LB.
doi: 10.3967/bes2017.057
Acrylamide-induced Subacute Neurotoxic Effects on the Cerebral Cortex and Cerebellum at the Synapse Level in Rats
-
Abstract:
Objective To investigate acrylamide (ACR)-induced subacute neurotoxic effects on the central nervous system (CNS) at the synapse level in rats. Methods Thirty-six Sprague Dawley (SD) rats were randomized into three groups, (1) a 30 mg/kg ACR-treated group, (2) a 50 mg/kg ACR-treated group, and (3) a normal saline (NS)-treated control group. Body weight and neurological changes were recorded each day. At the end of the test, cerebral cortex and cerebellum tissues were harvested and viewed using light and electron microscopy. Additionally, the expression of Synapsin Ⅰ and P-Synapsin Ⅰ in the cerebral cortex and cerebellum were investigated. Results The 50 mg/kg ACR-treated rats showed a significant reduction in body weight compared with untreated individuals (P < 0.05). Rats exposed to ACR showed a significant increase in gait scores compared with the NS control group (P < 0.05). Histological examination indicated neuronal structural damage in the 50 mg/kg ACR treatment group. The active zone distance (AZD) and the nearest neighbor distance (NND) of synaptic vesicles in the cerebral cortex and cerebellum were increased in both the 30 mg/kg and 50 mg/kg ACR treatment groups. The ratio of the distribution of synaptic vesicles in the readily releasable pool (RRP) was decreased. Furthermore, the expression levels of Synapsin Ⅰ and P-Synapsin Ⅰ in the cerebral cortex and cerebellum were decreased in both the 30 mg/kg and 50 mg/kg ACR treatment groups. Conclusion Subacute ACR exposure contributes to neuropathy in the rat CNS. Functional damage of synaptic proteins and vesicles may be a mechanism of ACR neurotoxicity. -
Key words:
- Acrylamide (ACR) /
- Synapsin Ⅰ /
- P-Synapsin Ⅰ /
- Synaptic vesicles /
- Neurotoxicity
-
Figure 1. Effect of ACR on rat body weight. Data are expressed as x±s. #Significant difference compared with control, P < 0.05. *Significant difference compared with the 30 mg/kg ACR treatment group, P < 0.05.
Figure 2. Gait score analysis for the NS control group and the ACR (30 mg/kg and 50 mg/kg) treatment groups. Data are expressed as x±s. #Significant difference compared with control, P < 0.05. *Significant difference compared with the 30 mg/kg ACR treatment group, P < 0.05.
Figure 3. Histological examination using H & E staining for the NS control group and the ACR (50 mg/kg) treatment group. Typical morphological changes of cerebral cortex (A) and cerebellum (B) were photographed. 1-2: magnification 200×, 3-4: magnification 400 ×. A1, A3, B1, B3: NS control group, A2, A4, B2, B4: 50 mg/kg ACR treatment group. Typical pathological changes are noted by arrowheads: widened pericellular spaces of the cortical neurons, cortical neuron basophilic chromatin enhancement, widened pericellular spaces of the Purkinje cells, and irregular shape and loss of Purkinje cells.
Figure 4. Ultra-structural analysis by electron microscopy for the NS control group and the ACR (50 mg/kg) treatment group. Typical morphological changes of the cerebral cortex (1, 2) and the cerebellum (3, 4) were photographed. 1, 3: NS control group, 2, 4: 50 mg/kg ACR treatment group. (A) Neurons, (B) Blood brain barrier (BBB), (C) itochondria and polyribosomes, (D) golgi apparatus, (E) glial cell, (F) rough endoplasmic reticulum. Clear pathological changes are noted by red arrowheads: A2, A4: neuron contraction, nuclear membrane introcession; B2, B4: BBB structural damage; C2, C4: mitochondrial damage, depolymerization of polyribosomes; D2, D4: golgi apparatus dilation; E2: glial cell edema; F4: rough endoplasmic reticulum dilation.
Figure 5. Changes in the number of synapses in the cerebral cortex and cerebellum. (A) Number of synapses in the cerebral cortex. (B) Number of synapses in the cerebellum. Data are expressed as x±s. #Significant difference compared with control, P < 0.05. *Significant difference compared with the 30 mg/kg ACR treatment group, P < 0.05.
Figure 6. Analysis of synaptic vesicles in the cerebral cortex and cerebellum. (A) Synapses were photographed by electron microscopy at a magnification of 100, 000 ×, and this indicated clear structures of normal synapses, including synaptic vesicles, active zones, and post-synaptic density. (B) ImageTool and LoClust software were used to measure the AZD and NND of the synaptic vesicles.
Figure 7. Analysis of AZD and NND in the cerebral cortex. (A1) Scatter plot of synaptic vesicles in the control (NS) group; (A2) scatter plot of synaptic vesicles in the 30 mg/kg ACR treatment group; (A3) scatter plot of synaptic vesicles in the 50 mg/kg ACR treatment group; (B1) box plot of AZD for the NS control group and ACR (30 mg/kg and 50 mg/kg) treatment groups; (B2) box plot of NND for the NS control group and ACR (30 mg/kg and 50 mg/kg) treatment groups. #Significant difference compared with control, P < 0.01. & Significant difference compared with the 30 mg/kg ACR treatment group, P < 0.01.
Figure 8. Analysis of AZD and NND in the cerebellum. (A1) Scatter plot of synaptic vesicles in the control (NS) group; (A2) scatter plot of synaptic vesicles in the 30 mg/kg ACR treatment group; (A3) scatter plot of synaptic vesicles in the 50 mg/kg ACR treatment group; (B1) box plot of AZD for the NS control group and ACR (30 mg/kg and 50 mg/kg) treatment groups; (B2) box plot of NND for the NS control group and ACR (30 mg/kg and 50 mg/kg) treatment groups. #Significant difference compared with control, P < 0.01. & Significant difference compared with the 30 mg/kg ACR treatment group, P < 0.01.
Figure 9. The expression of Synapsin Ⅰ and P-Synapsin Ⅰ in the cerebral cortex and cerebellum. Synapsin Ⅰ and P-Synapsin Ⅰ protein levels in different groups were determined using western blotting and are expressed as the percentage of Synapsin Ⅰ/GAPDH or P-Synapsin Ⅰ/GAPDH. Representative immunoblots are shown in the graph. (A) cerebral cortex, (B) cerebellum, 1: Synapsin Ⅰ, 2: P-Synapsin Ⅰ. The data are expressed as x±s. *Significant difference compared with control, P < 0.05. #Significant difference compared with the 30 mg/kg ACR treatment group, P < 0.05.
Table 1. The Distribution of Synaptic Vesicles in the RRP and RP in the Cerebral Cortex
Group RRP (AZD ≤ 200 nm) RP (AZD > 200 nm) Total Control (NS) 1498 383 1881 30 mg/kg ACR* 1291 567 1858 50 mg/kg ACR*# 1038 849 1887 Note. *Significant difference compared with control, P < 0.01. #Significant difference compared with the 30 mg/kg ACR treatment group, P < 0.01.  下载: 导出CSV
Table 2. The Distribution of Synaptic Vesicles in the RRP and RP in the Cerebellum
Group RRP (AZD ≤ 200 nm) RP (AZD > 200 nm) Total Control (NS) 1503 334 1837 30 mg/kg ACR* 1188 653 1841 50 mg/kg ACR*# 991 866 1857 Note. *Significant difference compared with control, P < 0.01. #Significant difference compared with the 30 mg/kg ACR treatment group, P < 0.01.
下载: 导出CSV
-
[1] Erkekoglu P, Baydar T. Acrylamide neurotoxicity. Nutr Neurosci, 2014, 17:49-57. doi: 10.1179/1476830513Y.0000000065 [2] Blancher C, Cormick RM. Sodium dodecyl sulphatepolyacrylamide denaturing gel electrophoresis and Western blotting techniques. Methods Mol Biol, 2012, 878:89-110. doi: 10.1007/978-1-61779-854-2 [3] Tareke E, Rydberg P, Karlsson P, et al. Analysis of acrylamide, a carcinogen formed in heated foodstuffs. J Agric Food Chem, 2002, 50:4998-5006. doi: 10.1021/jf020302f [4] Lopachin RM, Gavin T. Acrylamide-induced nerve terminal damage: relevance to neurotoxic and neurodegenerative mechanisms. J Agric Food Chem, 2008, 56:5994-6003. doi: 10.1021/jf703745t [5] Sabri MI, Spencer PS. How does acrylamide perturb axon transport and induce nerve fiber degeneration? Commentary on forum position paper, Neurotoxicology, 2002, 23:259-63. https://www.researchgate.net/publication/11164395_How_Does_Acrylamide_Perturb_Axon_Transport_and_Induce_Nerve_Fiber_Degeneration_Commentary_on_Forum_Position_Paper [6] Sickles DW, Brady ST, Testino A, et al. Direct effect of the neurotoxicant acrylamide on kinesin-based microtubule motility. J Neurosci Res, 1996, 46:7-17. doi: 10.1002/(ISSN)1097-4547 [7] Tilson HA. The neurotoxicity of acrylamide: an overview. Neurotoxicol Teratol, 1981, 3:445-61. https://www.researchgate.net/publication/51286127_The_neurotoxicity_of_acrylamide_An_overview [8] Zhang Bin, Xiao Jingwei, Chen Xiao, et al. Study on changes of glutamate and γ-aminobutyric acid neurotransmitters induced by acrylamide in rats. J Toxicol, 2016:107-112. (In Chinese) http://en.cnki.com.cn/Article_en/CJFDTotal-WSDL201602006.htm [9] LoPachin RM, Ross JF, Lehning EJ. Nerve terminals as the primary site of acrylamide action: a hypothesis. Neurotoxicology, 2002, 23:43-59. doi: 10.1016/S0161-813X(01)00074-2 [10] LoPachin RM, Balaban CD, Ross JF. Acrylamide axonopathy revisited. Toxicol Appl Pharmacol, 2003, 188:135-53. doi: 10.1016/S0041-008X(02)00072-8 [11] Pechstein A, Shupliakov O. Taking a back seat: synaptic vesicle clustering in presynaptic terminals. Front Neurosci, 2010, 2, 143. http://www.oalib.com/paper/3124043 [12] Shupliakov O, Haucke V, Pechstein A. How synapsin Ⅰ may cluster synaptic vesicles. Semin Cell Dev Biol, 2011, 22:393-9. doi: 10.1016/j.semcdb.2011.07.006 [13] Greengard P, Valtorta F, Czernik AJ, et al. Synaptic vesicle phosphoproteins and regulation of synaptic function. Science, 1993, 259:780-5. doi: 10.1126/science.8430330 [14] Bykhovskaia M. Synapsin regulation of vesicle organization and functional pools. Semin Cell Dev Biol, 2011, 22:387-92. doi: 10.1016/j.semcdb.2011.07.003 [15] Xiao Jingwei, Meng Huilin, Yu Changyan, et al. Study on changes of synapsin Ⅰ in acrylamide-induced subacute neurotoxicity in rats. J Toxicol, 2013, 27:332-40. (In Chinese) [16] Lehning EJ, Balaban CD, Ross JF, et al. Acrylamide neuropathy. Ⅱ. Spatiotemporal characteristics of nerve cell damage in brainstem and spinal cord, Neurotoxicology, 2002, 23:415-29. doi: 10.1016/S0161-813X(02)00080-3 [17] Nikonenko AG, Skibo GG. Technique to quantify local clustering of synaptic vesicles using single section data. Microsc Res Techniq, 2004, 65:287-91. doi: 10.1002/(ISSN)1097-0029 [18] McBride HM, Neuspiel M, Wasiak S. Mitochondria: More Than Just a Powerhouse. Curr Biol, 2006, 16, R551-R60. doi: 10.1016/j.cub.2006.06.054 [19] Hackett JT, Ueda T. Glutamate Release. Neurochem Res, 2015, 40:2443-60. doi: 10.1007/s11064-015-1622-1 [20] Fowler MW, Staras K. Synaptic vesicle pools: Principles, properties and limitations. Exp Cell Res, 2015, 335:150-6. doi: 10.1016/j.yexcr.2015.03.007 [21] Zhang XL, Guariglia SR, McGlothan JL, et al. Presynaptic mechanisms of lead neurotoxicity: effects on vesicular release, vesicle clustering and mitochondria number. Plos One, 2015, 10, e0127461. doi: 10.1371/journal.pone.0127461 [22] Li L, Chin LS, Shupliakov O, et al. Impairment of synaptic vesicle clustering and of synaptic transmission, and increased seizure propensity, in synapsin Ⅰ-deficient mice. Proc Natl Acad Sci USA, 1995, 92:9235-9. doi: 10.1073/pnas.92.20.9235 [23] Baldelli P, Fassio A, Valtorta F, et al. Lack of synapsin Ⅰ reduces the readily releasable pool of synaptic vesicles at central inhibitory synapses. J Neurosci, 2007, 27:13520-31. doi: 10.1523/JNEUROSCI.3151-07.2007 [24] Bogen IL, Boulland JL, Mariussen E, et al. Absence of synapsin Ⅰ and Ⅱ is accompanied by decreases in vesicular transport of specific neurotransmitters. J Neurochem, 2006, 96:1458-66. doi: 10.1111/jnc.2006.96.issue-5 [25] Bogen IL, Haug KH, Roberg B, et al. The importance of synapsin Ⅰ and Ⅱ for neurotransmitter levels and vesicular storage in cholinergic, glutamatergic and GABAergic nerve terminals. Neurochem Int, 2009, 55:13-21. doi: 10.1016/j.neuint.2009.02.006 [26] Cesca F, Baldelli P, Valtorta F, et al. The synapsins: key actors of synapse function and plasticity. Prog Neurobiol, 2010, 91:313-48. doi: 10.1016/j.pneurobio.2010.04.006 [27] Menegon A, Bonanomi D, Albertinazzi C, et al. Protein kinase A-mediated synapsin Ⅰ phosphorylation is a central modulator of Ca2+-dependent synaptic activity. J Neurosci, 2006, 26:11670-81. doi: 10.1523/JNEUROSCI.3321-06.2006 [28] Bonanomi D, Menegon A, Miccio A, et al. Phosphorylation of synapsin Ⅰ by cAMP-dependent protein kinase controls synaptic vesicle dynamics in developing neurons. J Neurosci, 2005, 25:7299-308. doi: 10.1523/JNEUROSCI.1573-05.2005 -

 点击查看大图
计量
- 文章访问数: 1549
- HTML全文浏览量: 499
- PDF下载量: 65
- 被引次数: 0

 Quick Links