

 下载:
下载:

-
For lifetime non-smokers, lung cancer risk is mainly associated with inhalation exposure to air pollution. For the Chinese population, indoor air pollution due to solid fuel combustion has been the primary source of inhalation exposure for decades[1]. Polycyclic aromatic hydrocarbons (PAHs) are the by-products of incomplete combustion. Cooking techniques also expose cooks to high levels of PAHs[2]. Furthermore, on an average, Chinese adults spend up to 20 hours a day indoors[3]. Thus, PAHs are the most ubiquitous carcinogens encountered by Chinese non-smokers in their daily lives. Several studies reported that genetic susceptibility remarkably influenced lung cancer risk potentially associated with PAH inhalation exposure[4-5]. However, few studies have also comprehensively and systematically assessed genetic susceptibility of individuals to lung cancer risk caused by PAH exposure. The main objective of the present study was to establish a comprehensive genetic susceptibility assessment model of lung cancer risk caused by PAH inhalation exposure in non-smokers in China, which includes the systematic process of PAH carcinogenesis.
Study subjects were recruited from the Peking University People's Hospital and the Beijing First Hospital of Integrated Chinese and Western Medicine in Beijing, China. From November 2014 to July 2015, a total of 143 newly diagnosed patients with confirmed lung adenocarcinoma and 143 cancer-free control subjects were recruited. The control and case subjects matched with respect to age (± 5 years), gender, living location, use of heating and cooking fuels, and cooking frequency from 1985 to 2014. Both case and control subjects met the following exclusion criteria: (1) occupational exposure to PAH, and (2) positive smoking history. Interviewer-administered questionnaires were used to obtain information on sociodemographic characteristics, environmental factors related to PAH inhalation exposure, and dietary habits over the past three decades. From each subject, about 4 mL peripheral blood was collected in two tubes containing an anticoagulant (Ethylene Diamine Tetraacetic Acid, EDTA). The study protocol was approved by the Biomedical Ethics Committee of Peking University. Written informed consent was obtained from all participants.
Sixty-eight genetic polymorphisms were selected based on the following criteria: (1) polymorphisms were related to either tumorigenesis, especially lung tumorigenesis, or PAH metabolism in the human body, based on in vivo, in vitro, or epidemiological studies conducted in the past, and (2) minor allele frequency was > 10%. Based on their major roles in humans, the genetic polymorphisms were categorized as belonging to either of the following 10 pathways/groups: (1) Phase Ⅰ and/or Phase Ⅱ PAH metabolism, (2) direct DNA repair, (3) base excision repair (BER), (4) nucleotide excision repair (NER), (5) double-strand break repair (DSBR), (6) mismatch repair (MMR), (7) translesion DNA synthesis (TLS), (8) oncogenes or suppressor genes, (9) inflammation and immune system, and (10) others. Genetic polymorphisms were typed using Iplex chemistry by a matrix-assisted laser desorption/ionization time-of-flight mass spectrometer (MALDI-TOF-MS; MassARRAY system, Sequenom, Inc., San Diego, CA, USA). The risk genotypes, which were modified from previous studies, were coded as 1. The non-risk genotypes were coded as 0.
Differences in demographics between the case and control subjects were evaluated using the t-test for continuous variables and the χ2-test for categorical variables. The Hardy-Weinberg equilibrium (HWE) was tested in the control subjects. ORs and 95% CIs were calculated using an unconditional logistic regression. Data were analyzed using SPSS 20.0 (SPSS, Inc., Chicago, IL, USA). All P-values were two-tailed.
Demographic characteristics of the study population have been presented in Table S1 (available in www.besjournal.com), along with the population distribution. Average age of the study population was approximately 60 years. Notably, subjects aged 60-69 years formed the largest proportion of the study population. Because of the recruitment criterion of no positive smoking history, nearly 80% of the participants were non-smoking Chinese females. No significant differences were observed between the case and control subjects with respect to BMI, occupation, education, and family history of lung cancer. According to the TMN classification for staging lung cancer, almost 73.4% case subjects had stage I lung adenocarcinoma. The exposure levels to PAHs in four primary environmental exposure factors, which were matched between the case and control subjects, have been listed in Table S1. The proportion of residents living in a heating area for more than 10 years was as high as 96%. The use of heating and cooking fuels showed similar population distribution patterns for different exposure levels. Further, the proportion of cooking population was 73%, which was attributed to the high proportion of female subjects.
Table Table S1. Population Distribution of Demographic Characteristics, Dietary Habits and Primary Environmental Exposure Factor of PAHs
Factors Category Case Control P Age (year) - 60.6 ± 11.9 59.9 ± 11.5 0.63 Gender Female 112 (78.3%) 112 (78.3%) Male 31 (21.7%) 31 (21.7%) BMI (kg/m2) - 24.2 ± 3.2 24.2 ± 3.4 0.79 Occupation Peasant 20 (14.0%) 23 (16.1%) Worker 18 (12.6%) 22 (15.4%) Professional 92 (64.3%) 85 (59.4%) Service/sales 8 (5.6%) 9 (6.3%) Other 5 (3.5%) 4 (2.8%) 0.90 Education Junior high school or lower 42 (29.4%) 33 (23.1%) High school or technical secondary school 23 (16.1%) 35 (24.5%) Junior college or above 78 (54.5%) 75 (52.4%) 0.16 Familial history of lung cancer No 113 (79.0%) 122 (85.3%) Yes 30 (21.0%) 21 (14.7%) 0.16 TNM stage Ⅰ 105 (73.4%) Ⅱ 2 (1.4%) Ⅲ 9 (6.3%) Ⅳ 27 (18.9%) Meat and seafood > 6 days / week, ≥ 10 years 64 (44.7%) 54 (37.8%) 4-6 days / week, ≥ 10 years 32 (22.3%) 34 (23.8%) 1-3 days / week, ≥ 10 years 36 (25.2%) 50 (35.0%) < 1 day / week, 30 years 11 (7.7%) 5 (3.5%) 0.14 Eggs and milk > 6 days / week, ≥ 10 years 50 (35.0%) 73 (51.0%) 4-6 days / week, ≥ 10 years 37 (25.8%) 28 (19.6%) 1-3 days / week, ≥ 10 years 47 (32.9%) 39 (27.3%) < 1 day / week, 30 years 9 (6.3%) 3 (2.1%) 0.03 Fresh vegetables > 6 days / week, ≥ 10 years 133 (93.0%) 125 (87.4%) 4-6 days / week, ≥ 10 years 7 (4.9%) 14 (9.8%) 1-3 days / week, ≥ 10 years 2 (1.4%) 4 (2.8%) < 1 day / week, 30 years 1 (0.7%) 0 0.17 Fresh fruits > 6 days / week, ≥ 10 years 54 (37.8%) 58 (40.6%) 4-6 days / week, ≥ 10 years 39 (27.3%) 46 (32.2%) 1-3 days / week, ≥ 10 years 40 (28.0%) 29 (20.3%) < 1 day / week, 30 years 10 (7.0%) 10 (7.0%) 0.48 Beans and bean products > 6 days / week, ≥ 10 years 12 (8.4%) 18 (12.6%) 4-6 days / week, ≥ 10 years 21 (14.7%) 24 (16.8%) 1-3 days / week, ≥ 10 years 100 (69.9%) 77 (53.8%) < 1 day / week, 30 years 10 (7.0%) 24 (16.8%) 0.02 Smoked, fried and barbecued food > 6 days / week, ≥ 10 years 3 (2.1%) 3 (2.1%) 4-6 days / week, ≥ 10 years 3 (2.1%) 7 (4.9%) 1-3 days / week, ≥ 10 years 42 (29.4%) 46 (32.2%) < 1 day / week, 30 years 95 (66.4%) 87 (60.8%) 0.56 Location Living in heating area, At least 10 years (Index = 1) 138 (96.5%) 138 (96.5%) - Never (Index = 0) 5 (3.5%) 5 (3.5%) Heating fuel Solid fuel as primary heating fuel, At least 10 years (Index = 1) 37 (25.9%) 37 (25.9%) - Never (Index = 0) 106 (74.1%) 106 (74.1%) Cooking fuel Solid fuel as primary cooking fuel, At least 10 years (Index = 1) 36 (25.2%) 36 (25.2%) - Never (Index = 0) 107 (74.8%) 107 (74.8%) Cooking frequency Cooking more than 4 times per week, At least 10 years (Index = 1) 104 (72.7%) 104 (72.7%) - Never (Index = 0) 39 (27.3%) 39 (27.3%) Population distribution for different dietary habits has also been presented in Table S1. Significant results were obtained among various dietary habit groups for two food types, namely eggs and milk, and beans and bean products. However, further analysis using a logistic regression model showed that only the intake frequencies of eggs and milk were associated with significantly different lung cancer risks. The people with the highest intake frequency ( > 6 days/week, more than 10 years) of eggs and milk also take the lowest lung cancer risk compared to lower intake frequencies. Age, gender, and primary exposure to PAHs were matched during subject recruitment. Thus, the consumption of eggs and milk was considered a covariate while assessing the association between lung cancer risk and genetic polymorphisms.
Using a logistic regression model, four genetic polymorphisms showed significantly different ORs for different genotypes (Table S2 available in www.besjournal.com). Among all four polymorphisms, the risk genotypes of rs1052133 (GG & GC) in hOGG1 and rs2293347 (CC) in EGFR had significantly higher ORs of 1.72 (95% CI = 1.00-2.96) and 1.65 (95% CI = 1.02-2.64), respectively. However, risk genotypes of GSTM1 (null) and rs664677 (TT) in ATM showed low ORs of 0.50 (95% CI = 0.31-0.81) and 0.44 (95% CI = 0.23-0.87), respectively. Next, we separately analyzed 10 pathways to discern the variables and interactions with significant ORs. As shown in Table S3 (available in www.besjournal.com), compared to all other pathways, 6 pathways significantly influenced lung cancer risk.
Table Table S2. Genetic Polymorphisms with Significance (P < 0.1) in Univariate, Unconditional Logistic Regression Models in the Present Study
Genetic Polymorphism Genotype Case Control β P OR 95% CI P Value for HWE Test GSTM1 not null = 0 74 (51.7%) 50 (35.0%) Ref. null = 1 69 (48.3%) 93 (65.0%) -0.70 0.005 0.50 0.31 0.81 – rs1052133 CC = 0 32 (22.4%) 46 (32.2%) Ref. GG & GC = 1 111 (77.6%) 96 (67.1%) 0.54 < 0.05 1.72 1.00 2.96 0.51 rs664677 CC & CT = 0 126 (88.1%) 113 (79.0%) Ref. TT = 1 17 (11.9%) 30 (21.0%) -0.81 0.02 0.44 0.23 0.87 0.45 rs2293347 TT & CT = 0 64 (44.8%) 81 (56.7%) Ref. CC = 1 79 (55.2%) 62 (43.3%) 0.50 0.04 1.65 1.02 2.64 0.50 Table Table S3. The Multivariable, Unconditional Logistic Regression Models of Six Pathway Groups and their Genetic Polymorphisms and Interactions with Significance (P < 0.1) Adjusted by Covariables.
Genetic Polymorphisms β P OR 95% CI P Value for HWE Test PAH metabolism GSTT1 null/not null 0.54 0.11 1.72 0.89 3.36 – rs1048943, T/C 0.17 0.70 1.18 0.51 2.76 0.80 GSTT1☒rs1048943 –1.24 0.02 0.29 0.11 0.80 – GSTM1 null/not null -1.00 0.002 0.37 0.19 0.70 - rs4646903, A/G 1.78 0.004 5.91 1.76 19.9 0.16 rs12529, G/C 1.45 0.007 4.27 1.48 12.3 0.89 rs12529 × rs4646903 -1.72 0.008 0.18 0.05 0.64 - rs1051740, T/C -0.55 0.18 0.58 0.26 1.28 0.98 GSTM1 × rs1051740 0.97 0.07 2.63 0.93 7.45 - DNA repair BER rs1052133, C/G 1.22 0.002 3.38 1.58 7.26 0.51 rs25487, C/T 0.73 0.13 2.07 0.81 5.28 0.70 rs1052133 × rs25487 -1.45 0.01 0.23 0.08 0.70 - TLS rs3087386, T/C -0.76 0.09 0.47 0.20 1.12 0.57 rs465646, T/C -0.62 0.14 0.54 0.23 1.24 0.56 rs3087386 × rs465646 1.15 0.03 3.17 1.10 9.09 - Oncogene (or suppressor gene) rs1042522, C/G 0.56 0.07 1.76 0.95 3.25 0.87 rs2279744, T/G 0.68 0.08 1.96 0.93 4.16 0.31 rs2273953-rs1801173, GC/AT 1.68 0.003 5.34 1.79 15.9 0.38-0.29 rs2273953-rs1801173 × rs2279744 -1.83 0.005 0.16 0.04 0.57 - Immune rs568408, A/G -1.75 0.01 0.17 0.04 0.69 0.37 rs1042522 (TP53), C/G -0.73 0.28 0.48 0.13 1.80 0.87 rs1042522 × rs568408 1.57 0.04 4.81 1.08 21.3 - rs1800796, C/G -0.54 0.20 0.58 0.26 1.32 0.30 rs4646903 (CYP1A1), A/G -0.58 0.13 0.56 0.26 1.19 0.16 rs4646903 × rs1800796 1.32 0.01 3.72 1.32 10.5 - Other rs664677, T/C -0.77 0.02 0.46 0.24 0.91 0.45 rs2293347, C/T 0.48 0.05 1.61 1.00 2.60 0.50 All genetic polymorphisms and interactions, which significantly influenced lung cancer risk, in the 6 pathways were combined together in a multivariate, unconditional logistic regression. Subsequently, using backward stepwise progression, 18 genetic polymorphisms and interactions were included in the final model (Table 1). There were 6 genetic polymorphisms and 3 interactions (GSTT1, rs1048943, GSTT1 × rs1048943, rs12529, rs4646903, rs12529 × rs4646903, GSTM1, rs1051740, and GSTM1 × rs1051740) associated with PAH metabolic pathways. Two genetic polymorphisms and one interaction (rs1052133, rs25487, and rs1052133 × rs25487) were involved in BER. One dinucleotide polymorphism, namely rs1801173-rs2273953 in TP73, significantly interacted with rs2279744 in MDM2. The remaining three genetic polymorphisms (rs568408, rs664677, and rs2293347) were related to inflammation and the cell cycle processes.
Table 1. Final Genetic Susceptibility Assessment Model of Lung Cancer Risk in this Study
Variables β SE Wals P OR 95% CI GSTT1 0.40 0.38 1.15 0.280 1.50 0.72 3.13 rs1048943 0.32 0.50 0.42 0.520 1.38 0.52 3.65 GSTT1 × rs1048943 -1.53 0.60 6.60 0.010 0.22 0.07 0.70 rs12529 1.86 0.61 9.45 0.002 6.45 1.97 21.2 rs4646903 2.20 0.72 9.46 0.002 9.03 2.22 36.7 rs12529 × rs4646903 -2.27 0.74 9.35 0.002 0.10 0.02 0.44 GSTM1 -0.99 0.36 7.51 0.006 0.37 0.18 0.75 rs1051740 -0.69 0.46 2.31 0.130 0.50 0.20 1.22 GSTM1 × rs1051740 1.14 0.60 3.62 0.060 3.12 0.97 10.1 rs1052133 1.48 0.45 11.1 0.0009 4.41 1.84 10.6 rs25487 0.99 0.56 3.15 0.080 2.69 0.90 8.05 rs1052133 × rs25487 -1.55 0.65 5.58 0.020 0.21 0.06 0.77 rs2279744 0.66 0.43 2.36 0.120 1.93 0.83 4.48 rs1801173-rs2273953 1.70 0.63 7.36 0.007 5.45 1.60 18.6 rs1801173-rs2273953 × rs2279744 -1.61 0.72 4.93 0.030 0.20 0.05 0.83 rs568408 -0.60 0.33 3.29 0.070 0.55 0.28 1.05 rs664677 -1.29 0.44 8.68 0.003 0.28 0.12 0.65 rs2293347 0.72 0.29 6.16 0.010 2.06 1.16 3.66 Constant -0.18 1.03 0.03 0.860 0.84 According to the final model, the genetic susceptibility score (GSS) was calculated as follows:
$$GSS = OR = {e^{yi}}/{e^{yo}}$$ (1) where, yi= 0.40 × GSTT1 + 0.32 × rs1048943 + (-1.53) × rs1048943 × GSTT1 + 1.86 × rs12529 + 2.20 × rs4646903 + (-2.27) × rs12529 × rs4646903 + (-0.99) × GSTM1 + (-0.69) × rs1051740 + 1.14 × GSTM1 × rs1051740 + 1.48 × rs1052133 + 0.99 × rs25487 + (-1.55) × rs1052133 × rs25487 + 0.66 × rs2279744 + 1.70 × rs1801173-rs2273953 + (-1.61) × rs1801173-rs2273953 × rs2279744 + (-0.60) × rs568408 + (-1.29) × rs664677 + 0.72 × rs2293347 (2) and y0 = 0.
GSS was analyzed as a continuous variable. It was observed that GSSs of cases were significantly higher than those of the controls (P < 0.01). The median GSS values of case and control subjects were 21.8 and 8.6, respectively. The difference in GSS between case and control subjects was further analyzed in different populations (Table S4 available in www.besjournal.com). For different gender groups, considerable differences in GSS of both males and females were observed between the case and control subjects. For males, the median value of GSS in case subjects was 16.0, which was slightly higher than that in the control subjects (P= 0.18). In females, compared to males, a more significant difference in GSS (P < 0.001) was observed between the case and control subjects. We also evaluated the differences in GSS among subjects belonging to different age groups. For the subjects aged < 60 years, the lung cancer patients had a higher GSS than the cancer-free individuals (GSS, 18.0 vs. 9.2; P < 0.001). Meanwhile, uniform differences in GSS between cases and controls were more significant (P < 0.001) for the subjects aged > 60 years (Table S4).
Table Table S4. GSS Difference Between Cases and Controls in Different Genders and Different Age Groups
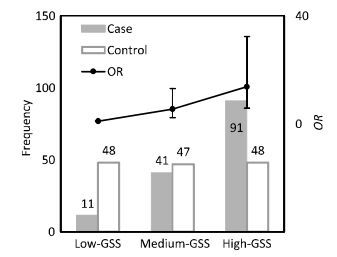
Item Male Female < 60 years ≥ 60 years Case Control Case Control Case Control Case Control N 31 31 112 112 64 74 79 69 GSSa 16.0 13.7 22.9 7.4 18.0 9.2 24.4 8.1 P 0.18 < 0.001 < 0.001 < 0.001 Note, aThe median value of GSS in this group. To assess the lung cancer risk associated with different levels of genetic susceptibility, GSS was divided into three groups according to its population distribution in control subjects: low-GSS (GSS ≤ 4.7), median-GSS (4.7 < GSS ≤ 14.6), and high-GSS (GSS > 14.6) groups. The GSS levels for case and control subjects with their corresponding lung cancer risks (ORs and 95% CI) have been shown in Figure 1. A significant difference of population distribution in GSS levels was observed between the control and case subjects. In control subjects, the population distribution of all three GSS levels was nearly uniform; however, in case subjects, the population number of each GSS level increased with GSS levels increasing. Thus, a positive dose-response relationship for GSS levels and lung cancer risk was observed. Compared to the population with low-GSS, lung cancer risk potentially associated with PAH inhalation for the population with median-GSS was 5.47 (95% CI = 2.29-13.1) times higher, while that for the population with high-GSS was 13.7 (95% CI = 5.82-32.3) times higher.
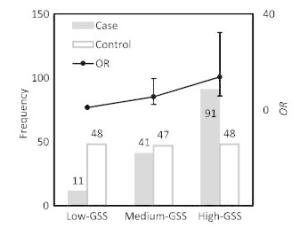
Figure 1. Population distribution and lung cancer risk of different GSS levels.
In the present study, we focused on the genetic susceptibility of individuals to lung cancer risk, with reference to the risk potentially associated with PAH inhalation exposure. To minimize the influence of environmental risk factors, we analyzed the effects of primary exposure to PAHs over the past 30 years between the case and control subjects. For comprehensively evaluating the genetic susceptibility of individuals, we analyzed 68 genetic polymorphisms in 10 pathways related to PAH metabolism and tumorigenesis. This resulted in a more precise and reliable assessment of genetic susceptibility in the present study. As a result, the GSS difference between lung cancer patients and cancer-free persons kept accordant, despite differences in the gender and age of subjects. Further, lung cancer risk increased with an increase in the GSS level, indicating a positive dose-response relationship. These results supported the reliability and universality of this genetic susceptibility assessment model for the general population. In earlier studies, similar calculation-based methods for analyzing genetic susceptibility of individuals were reported. Baja et al. calculated the number of unfavorable genetic variants associated with oxidative stress as a measure of GSS and determined the effect of GSS on the association between traffic-related air pollution and the QT interval; however, it was assumed that all polymorphisms had an equal weight contribution[6]. De Jager et al. created a weighted genetic risk score (wGRS) using 16 susceptibility alleles to predict multiple sclerosis risk, while the result was not significant[7].
Using our genetic susceptibility assessment model, we determined that most genetic polymorphisms were involved in PAH metabolism. This result indicated that the genes associated with PAH metabolism majorly contributed towards an individual's genetic susceptibility for lung cancer caused by PAH inhalation exposure. In addition, genetic polymorphisms associated with BER in the final model indicated that BER was the main mechanism for DNA repair of lesions induced by PAHs, which has been previously verified[8-9]. In addition, while assessing the significance of genetic polymorphisms in each pathway, a total of 25 genetic polymorphisms and gene-gene interactions in 6 pathways showed a remarkable influence on lung cancer risk potentially associated with PAH inhalation exposure. This suggested that concentrating on particular kinds of genetic polymorphisms, rather than analyzing comprehensive genetic information, may not reflect actual susceptibility in individuals.
In conclusion, the integration of 18 genetic polymorphisms and interactions into a genetic susceptibility assessment model, in which genetic polymorphisms related to PAH metabolism played a main role, can comprehensively evaluate lung cancer risk caused by PAH inhalation exposure for the general non-smoking Chinese population.
The authors thank the participants and the medical staff who provided assistance with sample collection.
No conflict of interest to declare.
doi: 10.3967/bes2017.104
A Genetic Susceptibility Study of Lung Cancer Risk Potentially Associated with Polycyclic Aromatic Hydrocarbon Inhalation Exposure
-
Abstract: To establish a genetic susceptibility assessment model of lung cancer risk potentially associated with polycyclic aromatic hydrocarbon (PAH) inhalation exposure among non-smokers in China, a total of 143 patients with lung adenocarcinoma and 143 cancer-free individuals were recruited. Sixty-eight genetic polymorphisms in 10 pathways related to PAH metabolism and tumorigenesis were selected and examined. It was observed that 3 genetic polymorphisms, along with 10 additional genetic polymorphisms via gene-gene interactions, significantly influenced lung cancer risk potentially associated with PAH inhalation exposure. Most polymorphisms were associated with PAH metabolism. According to the established genetic susceptibility score (GSS), lung cancer risk increased with a rise in the GSS level, thereby indicating a positive dose-response relationship.
-
Table S1. Population Distribution of Demographic Characteristics, Dietary Habits and Primary Environmental Exposure Factor of PAHs
Factors Category Case Control P Age (year) - 60.6 ± 11.9 59.9 ± 11.5 0.63 Gender Female 112 (78.3%) 112 (78.3%) Male 31 (21.7%) 31 (21.7%) BMI (kg/m2) - 24.2 ± 3.2 24.2 ± 3.4 0.79 Occupation Peasant 20 (14.0%) 23 (16.1%) Worker 18 (12.6%) 22 (15.4%) Professional 92 (64.3%) 85 (59.4%) Service/sales 8 (5.6%) 9 (6.3%) Other 5 (3.5%) 4 (2.8%) 0.90 Education Junior high school or lower 42 (29.4%) 33 (23.1%) High school or technical secondary school 23 (16.1%) 35 (24.5%) Junior college or above 78 (54.5%) 75 (52.4%) 0.16 Familial history of lung cancer No 113 (79.0%) 122 (85.3%) Yes 30 (21.0%) 21 (14.7%) 0.16 TNM stage Ⅰ 105 (73.4%) Ⅱ 2 (1.4%) Ⅲ 9 (6.3%) Ⅳ 27 (18.9%) Meat and seafood > 6 days / week, ≥ 10 years 64 (44.7%) 54 (37.8%) 4-6 days / week, ≥ 10 years 32 (22.3%) 34 (23.8%) 1-3 days / week, ≥ 10 years 36 (25.2%) 50 (35.0%) < 1 day / week, 30 years 11 (7.7%) 5 (3.5%) 0.14 Eggs and milk > 6 days / week, ≥ 10 years 50 (35.0%) 73 (51.0%) 4-6 days / week, ≥ 10 years 37 (25.8%) 28 (19.6%) 1-3 days / week, ≥ 10 years 47 (32.9%) 39 (27.3%) < 1 day / week, 30 years 9 (6.3%) 3 (2.1%) 0.03 Fresh vegetables > 6 days / week, ≥ 10 years 133 (93.0%) 125 (87.4%) 4-6 days / week, ≥ 10 years 7 (4.9%) 14 (9.8%) 1-3 days / week, ≥ 10 years 2 (1.4%) 4 (2.8%) < 1 day / week, 30 years 1 (0.7%) 0 0.17 Fresh fruits > 6 days / week, ≥ 10 years 54 (37.8%) 58 (40.6%) 4-6 days / week, ≥ 10 years 39 (27.3%) 46 (32.2%) 1-3 days / week, ≥ 10 years 40 (28.0%) 29 (20.3%) < 1 day / week, 30 years 10 (7.0%) 10 (7.0%) 0.48 Beans and bean products > 6 days / week, ≥ 10 years 12 (8.4%) 18 (12.6%) 4-6 days / week, ≥ 10 years 21 (14.7%) 24 (16.8%) 1-3 days / week, ≥ 10 years 100 (69.9%) 77 (53.8%) < 1 day / week, 30 years 10 (7.0%) 24 (16.8%) 0.02 Smoked, fried and barbecued food > 6 days / week, ≥ 10 years 3 (2.1%) 3 (2.1%) 4-6 days / week, ≥ 10 years 3 (2.1%) 7 (4.9%) 1-3 days / week, ≥ 10 years 42 (29.4%) 46 (32.2%) < 1 day / week, 30 years 95 (66.4%) 87 (60.8%) 0.56 Location Living in heating area, At least 10 years (Index = 1) 138 (96.5%) 138 (96.5%) - Never (Index = 0) 5 (3.5%) 5 (3.5%) Heating fuel Solid fuel as primary heating fuel, At least 10 years (Index = 1) 37 (25.9%) 37 (25.9%) - Never (Index = 0) 106 (74.1%) 106 (74.1%) Cooking fuel Solid fuel as primary cooking fuel, At least 10 years (Index = 1) 36 (25.2%) 36 (25.2%) - Never (Index = 0) 107 (74.8%) 107 (74.8%) Cooking frequency Cooking more than 4 times per week, At least 10 years (Index = 1) 104 (72.7%) 104 (72.7%) - Never (Index = 0) 39 (27.3%) 39 (27.3%)  下载: 导出CSV
Table S2. Genetic Polymorphisms with Significance (P < 0.1) in Univariate, Unconditional Logistic Regression Models in the Present Study
Genetic Polymorphism Genotype Case Control β P OR 95% CI P Value for HWE Test GSTM1 not null = 0 74 (51.7%) 50 (35.0%) Ref. null = 1 69 (48.3%) 93 (65.0%) -0.70 0.005 0.50 0.31 0.81 – rs1052133 CC = 0 32 (22.4%) 46 (32.2%) Ref. GG & GC = 1 111 (77.6%) 96 (67.1%) 0.54 < 0.05 1.72 1.00 2.96 0.51 rs664677 CC & CT = 0 126 (88.1%) 113 (79.0%) Ref. TT = 1 17 (11.9%) 30 (21.0%) -0.81 0.02 0.44 0.23 0.87 0.45 rs2293347 TT & CT = 0 64 (44.8%) 81 (56.7%) Ref. CC = 1 79 (55.2%) 62 (43.3%) 0.50 0.04 1.65 1.02 2.64 0.50
下载: 导出CSV
Table S3. The Multivariable, Unconditional Logistic Regression Models of Six Pathway Groups and their Genetic Polymorphisms and Interactions with Significance (P < 0.1) Adjusted by Covariables.
Genetic Polymorphisms β P OR 95% CI P Value for HWE Test PAH metabolism GSTT1 null/not null 0.54 0.11 1.72 0.89 3.36 – rs1048943, T/C 0.17 0.70 1.18 0.51 2.76 0.80 GSTT1☒rs1048943 –1.24 0.02 0.29 0.11 0.80 – GSTM1 null/not null -1.00 0.002 0.37 0.19 0.70 - rs4646903, A/G 1.78 0.004 5.91 1.76 19.9 0.16 rs12529, G/C 1.45 0.007 4.27 1.48 12.3 0.89 rs12529 × rs4646903 -1.72 0.008 0.18 0.05 0.64 - rs1051740, T/C -0.55 0.18 0.58 0.26 1.28 0.98 GSTM1 × rs1051740 0.97 0.07 2.63 0.93 7.45 - DNA repair BER rs1052133, C/G 1.22 0.002 3.38 1.58 7.26 0.51 rs25487, C/T 0.73 0.13 2.07 0.81 5.28 0.70 rs1052133 × rs25487 -1.45 0.01 0.23 0.08 0.70 - TLS rs3087386, T/C -0.76 0.09 0.47 0.20 1.12 0.57 rs465646, T/C -0.62 0.14 0.54 0.23 1.24 0.56 rs3087386 × rs465646 1.15 0.03 3.17 1.10 9.09 - Oncogene (or suppressor gene) rs1042522, C/G 0.56 0.07 1.76 0.95 3.25 0.87 rs2279744, T/G 0.68 0.08 1.96 0.93 4.16 0.31 rs2273953-rs1801173, GC/AT 1.68 0.003 5.34 1.79 15.9 0.38-0.29 rs2273953-rs1801173 × rs2279744 -1.83 0.005 0.16 0.04 0.57 - Immune rs568408, A/G -1.75 0.01 0.17 0.04 0.69 0.37 rs1042522 (TP53), C/G -0.73 0.28 0.48 0.13 1.80 0.87 rs1042522 × rs568408 1.57 0.04 4.81 1.08 21.3 - rs1800796, C/G -0.54 0.20 0.58 0.26 1.32 0.30 rs4646903 (CYP1A1), A/G -0.58 0.13 0.56 0.26 1.19 0.16 rs4646903 × rs1800796 1.32 0.01 3.72 1.32 10.5 - Other rs664677, T/C -0.77 0.02 0.46 0.24 0.91 0.45 rs2293347, C/T 0.48 0.05 1.61 1.00 2.60 0.50
下载: 导出CSV
Table 1. Final Genetic Susceptibility Assessment Model of Lung Cancer Risk in this Study
Variables β SE Wals P OR 95% CI GSTT1 0.40 0.38 1.15 0.280 1.50 0.72 3.13 rs1048943 0.32 0.50 0.42 0.520 1.38 0.52 3.65 GSTT1 × rs1048943 -1.53 0.60 6.60 0.010 0.22 0.07 0.70 rs12529 1.86 0.61 9.45 0.002 6.45 1.97 21.2 rs4646903 2.20 0.72 9.46 0.002 9.03 2.22 36.7 rs12529 × rs4646903 -2.27 0.74 9.35 0.002 0.10 0.02 0.44 GSTM1 -0.99 0.36 7.51 0.006 0.37 0.18 0.75 rs1051740 -0.69 0.46 2.31 0.130 0.50 0.20 1.22 GSTM1 × rs1051740 1.14 0.60 3.62 0.060 3.12 0.97 10.1 rs1052133 1.48 0.45 11.1 0.0009 4.41 1.84 10.6 rs25487 0.99 0.56 3.15 0.080 2.69 0.90 8.05 rs1052133 × rs25487 -1.55 0.65 5.58 0.020 0.21 0.06 0.77 rs2279744 0.66 0.43 2.36 0.120 1.93 0.83 4.48 rs1801173-rs2273953 1.70 0.63 7.36 0.007 5.45 1.60 18.6 rs1801173-rs2273953 × rs2279744 -1.61 0.72 4.93 0.030 0.20 0.05 0.83 rs568408 -0.60 0.33 3.29 0.070 0.55 0.28 1.05 rs664677 -1.29 0.44 8.68 0.003 0.28 0.12 0.65 rs2293347 0.72 0.29 6.16 0.010 2.06 1.16 3.66 Constant -0.18 1.03 0.03 0.860 0.84
下载: 导出CSV
Table S4. GSS Difference Between Cases and Controls in Different Genders and Different Age Groups
Item Male Female < 60 years ≥ 60 years Case Control Case Control Case Control Case Control N 31 31 112 112 64 74 79 69 GSSa 16.0 13.7 22.9 7.4 18.0 9.2 24.4 8.1 P 0.18 < 0.001 < 0.001 < 0.001 Note, aThe median value of GSS in this group.
下载: 导出CSV
-
[1] Bruce N, Perez-Padilla R, Albalak R. Indoor air pollution in developing countries:a major environmental and public health challenge. B World Health Organ, 2000; 78, 1078-92. doi: 10.1007/s10389-012-0511-1 [2] Shen G, Zhang Y, Wei S, et al. Indoor/outdoor pollution level and personal inhalation exposure of polycyclic aromatic hydrocarbons through biomass fuelled cooking. Air Qual Atmos Hlth, 2014; 7, 449-58. doi: 10.1007/s11869-014-0262-y [3] Ministry of Environmental Protection the People's Republic of China. Exposure Factors Handbook of Chinese Population (Adults). Environmental Science Press of China, Beijing, 2013. [4] Shen H, Tao S, Liu J, et al. Global lung cancer risk from PAH exposure highly depends on emission sources and individual susceptibility. Sci Rep, 2014; 4, 6561. http://adsabs.harvard.edu/abs/2014NatSR...4E6561S [5] Zhang Y, Tao S, Shen H, et al. Inhalation exposure to ambient polycyclic aromatic hydrocarbons and lung cancer risk of Chinese population. PNAS, 2009; 106, 21063-7. doi: 10.1073/pnas.0905756106 [6] Baja ES, Schwartz JD, Wellenius GA, et al. Traffic-related air pollution and QT interval:modification by diabetes, obesity, and oxidative stress gene polymorphisms in the normative aging study. Environ Health Persp, 2010; 118, 840-6. doi: 10.1289/ehp.0901396 [7] De Jager PL, Chibnik LB, Cui J, et al. Integration of genetic risk factors into a clinical algorithm for multiple sclerosis susceptibility:a weighted genetic risk score. Lancet Neurol, 2009; 8, 1111-9. doi: 10.1016/S1474-4422(09)70275-3 [8] Tudek B. Base excision repair modulation as a risk factor for human cancers. Mol Aspects Med, 2007; 28, 258-75. doi: 10.1016/j.mam.2007.05.003 [9] Zienolddiny S, Campa D, Lind H, et al. Polymorphisms of DNA repair genes and risk of non-small cell lung cancer. Carcinogenesis, 2006; 27, 560-7. doi: 10.1093/carcin/bgi232 -

 点击查看大图
计量
- 文章访问数: 1198
- HTML全文浏览量: 367
- PDF下载量: 35
- 被引次数: 0

 Quick Links