

 下载:
下载:

-
Seawater desalination has become an important part of industry and household water use in countries facing water shortage. China's seawater desalination industry has begun to take shape and is in a stage of rapid development. In February 2012, the General Office of the State Council of China issued the Opinions on Speeding up the Development of Seawater Desalination Industry[1], indicating that the development of the seawater desalination industry is of great significance for alleviating the shortage of water resources in some coastal areas and islands in China, optimizing the water usage structure, and ensuring the sustainable utilization of water resources. The current mainstream seawater desalination methods include Multistage Flash (MSF), Multiple Effect Distillation (MED), and Reverse Osmosis (RO)[2]. During seawater desalination, the heavy water with high salt content produced inevitably leads to scaling and foaming, which affects the normal operation of equipment and reduces its service life. Therefore, to ensure the normal operation of seawater desalination equipment and improve desalination efficiency, special agents, mainly consisting of defoamers and scale inhibitors, are employed to eliminate foams and prevent scaling on the surface of the equipment, respectively. However, the safety and quality indices of desalinated water for municipal and household use have become the focus of public attention[3] because the water quality might be affected by the addition of water treatment chemicals.
Since the German physicist Quincke first proposed the chemical method to eliminate foams in 1963[4], the history of defoamers has undergone four innovations[5, 6]. The current defoamer used in seawater desalination is polyether-modified organosilicon defoamer, which is a new type of highly efficient defoaming agent. It is mainly composed of strong antifoaming polyether and highly hydrophobic simethicone that breaks foams rapidly, as well as an emulsifier and stabilizer that can combine simethicone with polyether. Characterized by strong defoaming performance, rapid foam-breaking ability, and low volatility, it has been extensively used globally[7]. Humans, livestock, and poultry can be exposed when it is inevitably discharged into the environment, leading to adverse effects on human health and the ecological environment. Extensive attention has been paid to the safety of defoamer application during seawater desalination[8-10], and some scholars have carried out toxicological experiments on individual defoamers[9, 11]. However, to date, no systematic toxicological studies, safety evaluation, or related regulation standard specifications have been produced.
Many developed countries have formulated relevant evaluation standards, among which the NSF standard NSF/ANSI 60-2012 Drinking Water Treatment Chemicals-Health Effects[12], widely recognized by the global water industry and government regulatory authorities, has clearly standardized the hygienic safety evaluation methods of seawater desalination agents. Currently, most mainstream seawater desalination agents have obtained NSF/ANSI60-2012 certification. However, the current 44-item seawater desalination standard of China has not covered all the segments of the seawater desalination industry and has made no mention of the evaluation standard or hygienic standard for seawater desalination agents. The current standard GB/T17218-1998, Hygienic Safety Evaluation of Chemical Treatment Agent for Drinking Water, is only aimed at chemicals such as flocculants and coagulants commonly used in traditional waterworks and does not involve the scale inhibitors or defoamers typically used in seawater desalination[13]. The hygienic safety evaluation of seawater desalination agents needs to be improved in order to adapt to the rapid development of the seawater desalination industry in China.
Our group previously completed studies on the toxicity of scale inhibitors[14] and acute toxicity assessment of defoamers. The present study mainly focused on the characterization of sub-chronic toxicity of defoamers by oral administration in adult rats in order to provide an experimental basis and data support for the safety evaluation and regulation of defoamers used in seawater desalination.
-
All animal procedures were approved by the Institutional Animal Care and Use Committee of the Chinese Center for Disease Control and Prevention (China CDC) at Beijing, China. Eighty (40 males and 40 females) Wistar rats that were specific- pathogen-free (SPF) and weighed 80 to 120 g were provided by the Experimental Animal Center of the Academy of Military Medical Sciences of the Chinese People's Liberation Army [license number: SCXK (Military) 2012-0004]. The rats were kept in a clean room for animals [license number: SYXK (Jing) 2014-0043], where the temperature was maintained between 18-22 ℃ and humidity between 40% and 55% RH. The standard rat feed was purchased from Beijing Ke Ao Xie Li Co., Ltd. [license number: SCXK (Jing) 2014-0010], and tap water was provided for drinking. The rats were treated humanely and with regard for the alleviation of suffering.
-
The samples used in this study were white viscous liquids, as polyether modified organosilicon defoamers, provided by Tianjin Institute of Seawater Desalination and Comprehensive Utilization of the State Oceanic Administration. The chemicals involved in the preparation are shown in Table 1. Defoamer was prepared with distilled water for exposure purposes.
Table 1. Chemical Components involved in the Preparation of the Defoamer
Name Molecular Formula Simethicone (CH3)3SiO[(CH3)2SiO]n-Si(CH3)3 Aerosil SiO2 Dehydrated sorbitol fatty acid ester C7H11O6-R Polyoxyethylene sorbitol anhydride fatty acid ester C64H126O26 Allyl polyoxypropylene ether CH2=CHCH2O(CH2CH2O)nH Hydrogen-containing silicone oil (CH3)3SiO[(CH3)2SiO]n[(CH3)(H)SiO]nSi(CH3)3 Isopropanol C3H8O Carboxymethylcellulose sodium RnOCH2COONa Water H2O -
The experiment was conducted according to the OECD guidelines for sub-chronic toxicity testing[15] and previous research results. The acute toxicity test found that the LD50 of the defoamer was greater than 5, 000 mg/kg BW, which is classified as a non-toxic level, and the 10, 000 mg/kg BW dose caused no toxic symptoms or death in the test animals. Accordingly, 1/5, 1/10, and 1/20 of the highest dose of acute toxicity (i.e., 10, 000 mg/kg BW) were set to be the high, medium, and low doses in the sub-chronic toxicity test groups, which were 2.0, 1.0, and 0.5 g/kg BW, respectively. A control group of distilled water was also used. There were 20 rats with 10 males and 10 females in each group. A dose of 1 mL/100 g weight of the defoamer was orally administered for 90 days without any interval. Throughout the exposure period, rats were assessed daily for behavioral activities and evidence of diarrhea, dehydration, and deteriorating body conditions. The animals' weight and food intake were recorded on a weekly basis.
After the exposure, rats were made to fast for more than 16 hours. Under anesthesia with chloral hydrate, blood samples were taken via the abdominal aorta, and then rats were euthanized by dislocating. All organs and tissues of the liver, kidney, spleen, and testis were quickly dissected and carefully examined for any abnormalities. The internal organs of the liver, spleen, kidney, stomach, duodenum, and testis/ovaries were weighed and fixed with 10% formalin solution for histopathological examination. The whole blood samples were used for routine blood testing, and the serum obtained by centrifugation was used for the determination of blood biochemical indices.
-
Blood biochemical test kits were purchased from BioSino Bio-Technology & Science Inc. Hematological examinations including assessments of erythrocyte-related indices [red blood cell number (RBC), hemoglobin (HGB), hematocrit (HCT), mean corpuscular volume (MCV), mean corpuscular hemoglobin (MCH), mean corpuscular hemoglobin concentration (MCHC), and coefficient of variation of red blood cell distribution width (RDW-CV)], platelet related-indices [number of platelets (PLT), plateletcrit (PCT), mean platelet volume (MPV), and platelet distribution width (PDW)], and immune cell-related indices [white blood cell count (WBC), number of lymphocytes (Lymph#), number of intermediate cells (Mid#), number of granulocytes (Gran#), percentage of lymphocytes (lymph%), percentage of intermediate cells (Mid%), and percentage of granulocytes (Gran%)] were conducted using a Sysmex XP-100 automated hematological analyzer (Sysmex, Kobe, Japan). Biochemical examinations of hepatic function-related indices [alanine aminotransferase (ALT), aspartate aminotransferase (AST), total protein (TP), albumin (ALB), globulin (GLB), total bilirubin (TBIL), direct bilirubin (DBIL), indirect bilirubin (IBIL), and alkaline phosphatase (ALP)], renal function-related indices [urea nitrogen (UREA) and creatinine (CREA)], and other key indices [blood glucose (GLU) and total cholesterol (CHOL)] were assessed using a Toshiba 120 Automatic Biochemical Analyzer (Japan).
-
Specimens of the liver, spleen, kidney, stomach, duodenum, and testis/ovaries were taken and fixed in 4% neutral buffered formaldehyde. Thereafter, organs and tissues were embedded in paraffin, sectioned at 5 μm, stained with hematoxylin and eosin (H.E.), and examined under an Olympus BX43 optical microscopy (Tokyo, Japan) by an experienced pathologist blinded to the sample identity. Images were acquired by an LV320 Digital Acquisition Device.
-
SPSS was used for the statistical analysis of the experiment data. In the case of homoscedasticity, single factor variance analysis (one-way-ANOVA), with α = 0.05 indicating statistical significance, was used. Dunnett's test method was then used to compare the average of each dose group with the control group. In the case of heteroscedasticity, the Brown-Forsythe test or Welch test was used for statistical analysis. For all the analyses, a P value of ≤ 0.05 was considered significant.
-
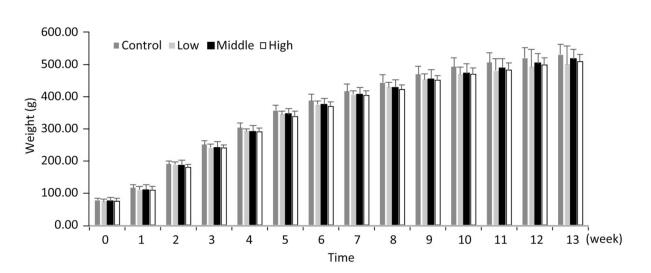
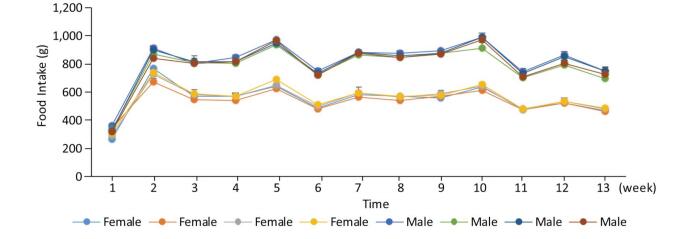
As shown in Figures 1, 2, and 3, the body weight and food intake of rats in the high, medium, and low dose groups showed no significant differences between that in the control group across all time points, irrespective of gender, indicating that long-term exposure to the defoamer had no significant effect on the weight gain of both male and female rats.
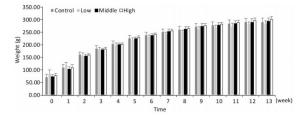
Figure 1. Weight change in female rats. Each value represents the mean ± standard deviation, n = 10 rats for each group.

Figure 2. Weight change in male rats. Each value represents mean ± standard, n = 10 rats for each group.
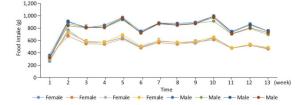
Figure 3. Food intake change in male and female rats. Each value represents mean ± standard error, n = 10 rats for each group.
-
The ALT and AST levels in the blood of male rats exposed to the defoamer for a long time changed in a dose-dependent manner, and only the high dose group showed significantly reduced levels compared with those in the control group (P < 0.05) (Table 2). Although the AST levels in female rats in the high dose group were significantly lower than those in the control group (P < 0.05), long-term exposure to the highest dose of defoamer had no significant effect on ALT level in female rats in each dose group (Table 3).
Table 2. Biochemical Indices Related to Hepatic Function of Male Rats (n = 10, x ± sd)
Groups ALT(U/L) AST (U/L) TP (g/L) ALB(g/L) GLB(g/L) A/G TBIL(μmol/L) DBIL(μmol/L) IBIL(μmol/L) ALP(U/L) Control 48.1 ± 7.4 127.8 ± 14.7 60.71 ± 1.42 36.91 ± 0.72 23.80 ± 1.28 1.55 ± 0.09 0.55 ± 0.16 0.25 ± 0.15 0.30 ± 0.17 110.0 ± 16.8 Low 51.3 ± 6.2 127.6 ± 16.3 59.09 ± 3.42 37.39 ± 0.96 21.70 ± 2.55* 1.75 ± 0.20* 0.63 ± 1.43 0.35 ± 0.83 0.28 ± 0.62 136.4 ± 31.9* Medium 53.6 ± 6.7 146.2 ± 23.8 59.96 ± 1.62 37.79 ± 0.52* 22.17 ± 1.21* 1.71 ± 0.09* 0.37 ± 0.18* 0.18 ± 0.17 0.19 ± 0.17 128.6 ± 21.8* High 38.5 ± 5.7* 78.5 ± 3.08* 59.45 ± 0.59 37.57 ± 0.59* 21.88 ± 0.79* 1.71 ± 0.09* 0.35 ± 0.19* 0.17 ± 0.05 0.18 ± 0.16 125.5 ± 29.8* Note. *Compared with the control group with P < 0.05. Table 3. Blood Biochemical Indices Related to Hepatic Function of Female Rats (n = 10, x ± sd)
Groups ALT(U/L) AST(U/L) TP(g/L) ALB(g/L) GLB(g/L) A/G TBIL(μmol/L) DBIL(μmol/L) IBIL(μmol/L) ALP(U/L) Control 35.8 ± 5.1 111.6 ± 9.9 63.27 ± 1.80 39.62 ± 0.91 23.65 ± 1.19 1.68 ± 0.07 0.66 ± 0.21 0.13 ± 0.11 0.53 ± 0.26 68.1 ± 9.0 Low 39.1 ± 4.7 117.4 ± 17.8 63.28 ± 1.91 40.08 ± 0.85 22.17 ± 1.28* 1.81 ± 0.09* 0.60 ± 0.24 0.37 ± 0.14 0.23 ± 0.18* 77.1 ± 8.9* Medium 40.5 ± 4.4 122.4 ± 23.5 64.06 ± 1.49 41.05 ± 0.88* 23.01 ± 0.86* 1.78 ± 0.05* 0.49 ± 0.26* 0.13 ± 0.09 0.36 ± 0.25 80.9 ± 11.6* High 35.3 ± 7.3 87.0 ± 18.3* 62.04 ± 2.04 41.11 ± 1.28* 21.96 ± 1.19* 1.87 ± 0.09* 0.41 ± 0.28* 0.11 ± 0.11 0.30 ± 0.27 81.3 ± 23.2* Note. *Compared with the control group with P < 0.05. Tables 2 and 3 showed that long-term exposure to the defoamer had no significant effect on the blood TP level in each dose group for both male and female rats. However, the blood ALB levels of rats of the high and medium dose groups were significantly higher than that in the control group (P < 0.05). The GLB levels of each dose group for both male and female rats were significantly lower than that in the control group (P < 0.05). Correspondingly, the A/G ratio of each dose group for both male and female rats was significantly higher than that in the control group (P < 0.05).
Tables 2 and 3 showed that there was no significant change in the blood DBIL level of male and female rats exposed to defoamer for a long time. For the IBIL level, a statistically significant difference was found only between the lowest dose group of female rats and the control group (P < 0.05). The TBIL levels of male and female rats in the medium and high dose groups were significantly reduced in a dose-dependent manner (P < 0.05).
Tables 2 and 3 showed that the blood ALP level of male and female rats in each dose group after long-term exposure to defoamer was significantly increased compared with that in the control group (P < 0.05).
Table 4 showed that the blood UREA level in each dose group was significantly increased compared to that in the control group for both male and female rats (P < 0.05). Long-term exposure to the defoamer had no significant effect on the blood CREA level in male rats. However, CREA levels in the high and medium dose groups were lower than that of the female rats in the control group (P < 0.05).
Table 4. Blood Biochemical Indices Related to Renal Function of Rats (n = 10, x ± sd)
Groups Male Rats Female Rats UREA (mmol/L) CREA (μmol/L) UREA (mmol/L) CREA (μmol/L) Control 5.99 ± 0.75 35.9 ± 2.1 6.36 ± 0.42 35.4 ± 1.6 Low 7.35 ± 1.43* 32.3 ± 4.6 7.34 ± 0.59* 36.3 ± 2.9 Medium 7.53 ± 0.77* 37.3 ± 3.8 7.88 ± 1.01* 33.3 ± 2.4* High 7.40 ± 0.61* 35.5 ± 8.3 7.88 ± 1.09* 34.9 ± 7.8* Note. *Compared with the control group with P < 0.05. Long-term exposure to the defoamer had no significant impact on the blood glucose levels of both male and female rats (Table 5). The blood CHOL level was significant reduced in a dose- and sex-dependent manner since a significant difference was only observed in the high dose group of male rats (P < 0.05).
Table 5. Blood Glucose and Cholesterol Levels of Rats (n = 10, x ± sd)
Groups Male Rats Female Rats GLU (mmol/L) CHOL (mmol/L) GLU (mmol/L) CHOL (mmol/L) Control 8.90 ± 1.54 2.14 ± 0.22 6.84 ± 0.97 2.05 ± 0.22 Low 9.21 ± 2.76 2.28 ± 0.40 6.03 ± 1.03 1.92 ± 0.24 Medium 8.26 ± 1.87 1.96 ± 0.18 7.58 ± 1.36 2.08 ± 0.15 High 8.22 ± 1.41 1.93 ± 0.14* 6.54 ± 0.91 1.91 ± 0.14 Note. *Compared with the control group with P < 0.05. -
For the immune cells, Table 6 showed that the WBC and Gran% were not significantly different between the three exposure groups and the control group. However, the Lymph% in all groups was significantly increased compared with that in the control group (P < 0.05). For the red blood cell indices, RBCs and MCV in the medium and high dose groups were significantly higher than those in the control group (P < 0.05). There was no significant difference in HGB level between each dose group and the control group. For platelet indices, the PLT in each dose group was significantly lower than that in the control group (P < 0.05).
Table 6. The Effect of the Defoamer on Routine Blood Indices in Male Rats (n = 10, x ± sd)
Item Abbreviation Unit Control Low Medium High Immune cell indices White blood cell count WBC × 109/L 7.58 ± 1.73 10.50 ± 7.37 7.86 ± 3.19 6.76 ± 1.67 Percentage of lymphocyte Lymph% % 94.82 ± 2.18 97.19 ± 0.87* 96.81 ± 0.35* 96.00 ± 1.07 Percentage of granulocyte Gran% % 1.58 ± 0.91 1.05 ± 0.33 1.26 ± 0.21 1.61 ± 0.59 Red blood cell indices Red blood cell count RBC × 1012/L 6.98 ± 0.17 6.92 ± 0.92 7.42 ± 0.39* 7.22 ± 0.42 Hemoglobin HGB g/L 152.2 ± 2.7 148.7 ± 13.4 154.6 ± 3.4 154.1 ± 3.4 Mean corpuscular volume MCV Fl 53.89 ± 0.66 58.07 ± 6.22 56.31 ± 0.50* 56.43 ± 0.43* Platelet indices Platelet number PLT × 109/L 2096.5 ± 208.5 1047.2 ± 215.1* 1179.8 ± 108.7* 1047.29 ± 75.8* Note. *Compared with the control group with P < 0.05. Table 7 showed that long-term exposure to the defoamer had a significant effect on the blood cells of female rats. The blood indices, except HGB, were all significantly different between the treatment groups and the control (P < 0.05). WBC count in the highest dose group was significantly higher than that in the control group (P < 0.05). The Gran% in each dose group was also significantly higher than that in the control group (P < 0.05). However, the Lymph% in the three dose groups was significantly decreased compared with that in the control group (P < 0.05). The RBC and MCV in each dose group was lower than that in the control group (P < 0.05), and the values of these indices increased when the dose increased. The PLT in each dose group was significantly increased compared with that in the control group (P < 0.05).
Table 7. The Effect of the Defoamer on Routine Blood Indices in Female Rats (n = 10, x ± sd)
Item Abbreviation Unit Control Low Medium High Immune cell indices White blood cell count WBC × 109/L 4.74 ± 0. 81 5.37 ± 3.40 4.41 ± 3.03 6.39 ± 1.91* Percentage of lymphocyte Lymph% % 97.44 ± 0.81 84.34 ± 2.30* 81.58 ± 2.39* 84.12 ± 1.79* Percentage of granulocyte Gran% % 0.96 ± 0.33 7.69 ± 1.56* 9.33 ± 1.74* 7.48 ± 1.29* Red blood cell indices Red blood cell count RBC × 1012/L 6.89 ± 0.13 5.64 ± 0.57* 6.08 ± 0.20* 6.14 ± 0.27* Hemoglobin HGB g/L 152.0 ± 6.38 144.0 ± 9.08 148.6 ± 5.13 153.1 ± 5.30 Mean corpuscular volume MCV Fl 57.17 ± 0.55 49.83 ± 0.54* 50.05 ± 0.72* 50.41 ± 0.89* Platelet indices Platelet number PLT × 109/L 1539.9 ± 104.5 4945.5 ± 508.5* 5362.2 ± 588.7* 5312.2 ± 580.9* Note. *Compared with the control group with P < 0.05. -
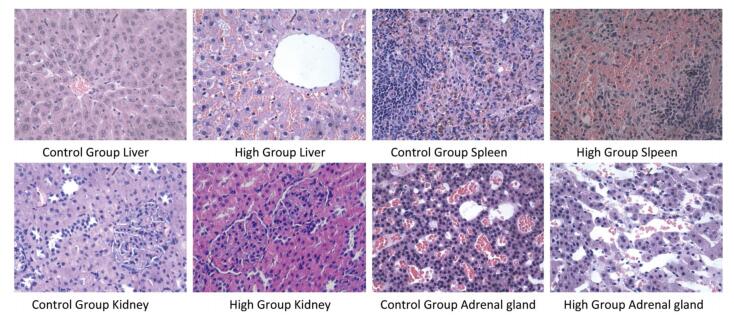
The results of histopathological examination were shown in Table 8. Different degrees of adrenal cortex congestion and atrophy of the adrenal cortex were found in the control group and the high dose group, with no significant differences between groups. Splenic congestion and mild erosion of duodenal mucosa of male rats in the high dose group were considered to have been caused by improper anatomical selection and were not related to the test agent.
Table 8. Results of Histopathological Examination (n = 10, x ± s)
Pathological Changes Female (n = 10) Male (n = 10) Control High Control High Liver Focus of mononuclear cell infiltration 2 2 5 1 Scattered hepatic cell steatosis 0 0 0 1 Hepatic congestion, hepatic cell steatosis, punctate necrosis with mononuclear cell infiltration 0 0 0 3 Spleen Hemosiderosis 1 0 0 0 Submembranous congestion 0 1 0 0 Spleen congestion 0 0 0 1 Kidney Glomerular mesangial hyperplasia 1 0 0 0 Stomach Mild erosion of gastric mucosal epithelium 1 0 0 0 Intestines Mild erosion of duodenal mucosa 0 0 0 2 Adrenal gland Cortical congestion 1 2 2 2 Atrophy 2 3 0 0 Ovary Luteal granulosa cell vacuolation 1 0 / / Several cases of liver mononuclear cell infiltration were found in the control group. Three cases of liver congestion, steatosis of hepatic cells around the central vein, and punctate necrosis with multiple focal mononuclear cell infiltrations were found in the male rats of the high dose group. One case of liver mononuclear cell infiltration was detected in the male rats of the medium dose group. The degree of pathological change in the male rats of the high dose group was slightly aggravated compared with that of the control group, which might be related to the test agent. The typical pathological results are shown in Figure 4.
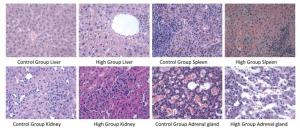
Figure 4. Typical pathological results (HE ×400).
-
The extensive use of desalinated seawater, for which the production process involves the addition of of a defoamer, can inevitably lead to long-term chronic exposure to a relatively low dose of defoamer and induce adverse human health effects. Polyether-modified organosilicon defoamers that are used commonly in seawater desalination are synthesized from polyether and silicone oil. Polyether- containing polysiloxane segments are modified by polycondensation reaction, allowing for the synthesis of a new type of high-efficiency defoamer. This defoamer has the characteristics of polyether defoamers and organosilicon defoamers[16]. It has the advantage of low surface tension, high temperature resistance, and alkali resistance[17]. However, polyether defoamers and organosilicon defoamers are toxic or low-toxicity substances, the degradation products of polyether defoamers are toxic, and organosilicon defoamers are not easy to degrade[18]. Therefore, polyether-modified organosilicon defoamers may also be toxic, not easily degraded, or produce toxic degradation products in water, which might come in contact with humans. Herein, based on OECD guidelines[15], a preliminary sub-chronic toxicity study was designed and carried out through animal experiments to systematically evaluate the safety and explore potential adverse effects of defoamers. This study aimed to provide a first-hand dose basis and health effect biomarkers of long-term exposure and safety evaluation of defoamers in order to inform future toxicological studies, regulation management, and monitoring regarding the use of defoamers in seawater desalination.
The polyether-modified silicone defoamer used in the present study is a kind of polymeric compound, which is nontoxic or has generally weak toxicity[19]. Our results were consistent with previous findings since the lethality, body weight, and food intake were not significantly changed in either sex of rats exposed to up to 2.0 g/kg BW of defoamer compared with the control group across a 90 day exposure period. High dose defoamer exposure lead to a significant decrease in the ALT and AST levels of both male and female rats, and medium and high doses of defoamer may reduce the levels of TBIL, DBIL, and IBIL in the blood of female and male rats. It has been suggested that there may be liver injury when ALT, AST, and bilirubin are increased significantly, but there was not any clinical significance observed when these indicators were decreased[20]. While there is a normal range of biochemical indicators in animal blood, changes that stay within the normal range will not have a damaging effect on the body. The normal range of blood biochemical indices in Wistar rats was as follows: ALT; 10-80 U/L, AST; 20-100 U/L, and TBIL; 0-8.5 µmol/L[21]. The results of this study showed that ALT, AST, and TBIL in the blood samples of middle- and high-dose groups decreased to different degrees, but the new values were still within the normal range. Although there were statistical differences between the control group, this result may be due to the limitation of the small sample size in this experiment. Therefore, this result cannot be used to prove that defoamer can cause health damage in rats.
Differential doses of defoamer could cause an increase in ALB levels and a decrease in GLB levels, thereby increasing the overall A/G ratio, but have no effect on TP. Albumin/globulin (A/G) has important clinical significance, and the normal value of A/G is 1.5-2.5:1.0[21]. The decrease of A/G suggests severe liver injury clinically, and the increase of A/G may be caused by immunoglobulin (antibody) deficiency or albumin elevation that could be induced by over nutrition, high protein intake, or blood concentration. However, the changes in albumin and globulin in this study were in the normal range[21], and it is believed that these changes will not directly affect the health of the rats.
All doses of defoamer could increase the level of ALP in the blood of male and female rats. It is generally believed that when the liver is damaged or dysfunctional, ALP enters the blood through the lymphatic and hepatic sinuses, and the obstruction of bile excretion in the hepatic duct might induce a significant increase in ALP in the serum.
In summary, the changed biochemical indices related to the liver in this experiment were still within the normal range[21]. However, different changes in each index were found in the high dose group, and there were statistical differences compared with the control group. These results were combined with the histopathological results of the liver, revealing test agent-associated pathological changes in male rats of the medium and high dose groups, suggesting that the doses of defoamer used in this study may have the potential to damage the liver and require further investigation. The defoamer has a significant effect on blood UREA in rats and can increase the blood UREA levels in both male and female rats. However, the effect of the defoamer on CREA was not significant. UREA increase may indicate organic renal impairment, pre-renal oliguria, protein decomposition, or excessive intake in the clinic, and other indicators, such as serum creatinine, should be investigated to make a comprehensive judgment. In this study, there was no increase of CREA and no abnormalities were found in the renal histopathology assessment. Therefore, it is speculated that the rats may not have had serious renal damage. The increase of UREA caused by protein decomposition or excessive intake will be accompanied with CREA at a normal level, so it is believed that the UREA increase observed in this study may be related to protein intake and decomposition. Combined with the results that the increase of albumin might be related to protein intake, it can be presumed that some components in defoamers may have had an impact on protein metabolism of the treated animals, and this requires further exploration.
In addition, the RBC and MCV in female rats were also significantly affected, and the effects on these two indices in male rats were shown only in the medium and high dose groups, while no effect on hemoglobin was found in any rats. There was an interesting phenomenon observed in this study; the number of platelets of male rats in each group was significantly lower than that in the control group, while the number of platelets of female rats in each group was significantly higher than that in the control group. Thrombocytopenia is usually caused by insufficient platelet production, excessive destruction, or abnormal distribution[22, 23]. As a chemical substance, defoamers may cause thrombocytopenia by affecting the proliferation and growth of megakaryocytes in bone marrow, resulting in insufficient platelet production. They can also affect the immune mechanism of the body, resulting in the production of platelet antibodies, leading to excessive destruction of platelets, or by causing hypersplenism, leading to abnormal platelet distribution and finally leading to thrombocytopenia[24, 25]. This effect is mainly reflected in male rats. However, large studies have shown that the estrogen level is an important factor affecting the rhythmic changes of hemorheology in women[26], platelets might be affected by sex[27-30], and platelet reactivity in women is higher than that in men[27]. In this study, the number of platelets of female rats in each group was significantly higher than that of the control group. It is speculated that the effect of the defoamers on the platelet number of female rats is affected by the level of female hormones, but the mechanism of action needs to be further studied. Based on all the blood testing results, it was concluded that defoamers had obvious effects on platelets and immune cells in rats and had more effects on the blood cells in female rats than on the blood cells in male rats. Based on the definition of No Observed Adverse Effect Level (NOAEL) and Lowest Observed Adverse Effect Level (LOAEL) in Technical specifications for chemical toxicity identification, we defined a low dose as having no significant effect on health and the dose-dependent health effect indices were used to determine NOAEL and LOAEL. Specifically, the lowest dose level causing an adverse health effect is considered the LOAEL, with health effect as the index, and the highest dose level that does not cause any adverse health effect is the NOAEL. Accordingly, among all the indices measured in this study, the results of ABL and TBIL were consistent in female and male rats, which conforms to that principle. Moreover, liver injury might be the main health effect of the defoamer. Therefore, using ABL and TBIL as the health effect indices, the NOAEL of rats after 90-day exposure to the defoamer is 0.5 g/kg BW. However, this value needs to be further validated before use in the database as the separation point for the evaluation of defoamer safety.
The observed sub-chronic toxic effect on hematological indices may be caused by the addition or residual monomer impurity during the production process. Polyether-modified silicone defoamer is mainly composed of simethicone, which is often used as an additive in the food industry or cosmetics industry. Animal studies have shown that simethicone can reduce stress-induced increased colon permeability and high sensitivity to expansion[31]. The LD50 of acute oral toxicity of simethicone to rats is greater than 2, 008 mg/kg BW, and the 90-day feeding of simethicone did not cause any abnormalities in the indices. It is inferred that the toxic effect of the defoamer in this study might not be directly caused by simethicone. Isopropanol is another component that may cause toxicity in the experiment animals. The pervious results of sub-chronic toxicity testing of isopropanol showed that when the inhalation dose exceeded 4, 022 mg/m3, a neurotoxic effect and weight loss occurred after a week of exposure in rats. If neurotoxicity was an effect indicator, the NOAEL and LOAEL of isopropanol in rats were 1, 341 mg/m3 and 4, 022 mg/m3, respectively[32]. Since the highest dose of defoamer in this study was 2.0 g/kg BW, the content of isopropanol was insufficient to induce sub-chronic toxicity. The other components of the defoamer that are often nontoxic or weak toxicity polymeric compounds have a small probability of producing sub-chronic toxic effects. At present, the concentration of each chemical component in the defoamer is uncertain, and hence the defoamer can only be evaluated as a mixture for toxicity and safety evaluation. Subsequent studies are needed to analyze and identify the relevant toxic components in the defoamer and to determine the component concentrations, the presence of residues, and residue concentrations in desalinated seawater.
-
To the best of our knowledge, this is the first toxicity study of defoamer used in seawater desalination. Our findings indicated that 90-day exposure to the defoamer may cause liver injury in rats, but no significant impact was found on renal function. The effect of the defoamer on blood cells in female rats was greater than that observed in male rats. The NOAEL of 90-day exposure to defoamer was suggested to be 0.5 g/kg BW, if ABL and TBIL are the health effect indices. However, the sub-chronic health effects mentioned above may not be solely caused by a single component of the defoamer. The major toxic components and their modes of action (MOA) in vivo warrant further studies to provide guidance for the safe application of defoamer in seawater desalination.
-
The authors declare no conflict of interest.
doi: 10.3967/bes2019.045
-
Abstract:
Objective To explore the possible long-term health effects of the defoamer used in seawater desalination by sub-chronic toxicity testing. Methods Blood analysis, internal organ assessment, and histopathological examination were carried out in rats exposed to low, medium, and high (0.5, 1.0, and 2.0 g/kg BW, respectively) doses of defoamer for 90 days through oral administration. Results The high dose group showed decreased blood alanine aminotransferase and aspartate aminotransferase (P < 0.05). All doses resulted in a significant increase in albumin and decrease in globulin (P < 0.05). The direct bilirubin and indirect bilirubin were decreased in the medium and high dose groups (P < 0.05). All dose groups showed significant induction of alkaline phosphatase (P < 0.05). Pathological examination revealed a case of liver mononuclear cell infiltration in the medium dose group and three cases of liver congestion, steatosis of hepatic cells around the central vein, and punctate necrosis with multiple focal mononuclear cell infiltration in male rats administered the high dose. The No Observed Adverse Effect Level was 0.5 g/kg BW in rats, with albumin and total bilirubin as health effect indices. Conclusion Long-term defoamer exposure may cause liver injury but has no significant impact on renal function in rats. The effect on blood cells in female rats was more prominent than that in male rats. -
Key words:
- Seawater desalination /
- Defoamer /
- Sub-chronic toxicity
-
Figure 1. Weight change in female rats. Each value represents the mean ± standard deviation, n = 10 rats for each group.
Figure 2. Weight change in male rats. Each value represents mean ± standard, n = 10 rats for each group.
Figure 3. Food intake change in male and female rats. Each value represents mean ± standard error, n = 10 rats for each group.
Table 1. Chemical Components involved in the Preparation of the Defoamer
Name Molecular Formula Simethicone (CH3)3SiO[(CH3)2SiO]n-Si(CH3)3 Aerosil SiO2 Dehydrated sorbitol fatty acid ester C7H11O6-R Polyoxyethylene sorbitol anhydride fatty acid ester C64H126O26 Allyl polyoxypropylene ether CH2=CHCH2O(CH2CH2O)nH Hydrogen-containing silicone oil (CH3)3SiO[(CH3)2SiO]n[(CH3)(H)SiO]nSi(CH3)3 Isopropanol C3H8O Carboxymethylcellulose sodium RnOCH2COONa Water H2O  下载: 导出CSV
Table 2. Biochemical Indices Related to Hepatic Function of Male Rats (n = 10, x ± sd)
Groups ALT(U/L) AST (U/L) TP (g/L) ALB(g/L) GLB(g/L) A/G TBIL(μmol/L) DBIL(μmol/L) IBIL(μmol/L) ALP(U/L) Control 48.1 ± 7.4 127.8 ± 14.7 60.71 ± 1.42 36.91 ± 0.72 23.80 ± 1.28 1.55 ± 0.09 0.55 ± 0.16 0.25 ± 0.15 0.30 ± 0.17 110.0 ± 16.8 Low 51.3 ± 6.2 127.6 ± 16.3 59.09 ± 3.42 37.39 ± 0.96 21.70 ± 2.55* 1.75 ± 0.20* 0.63 ± 1.43 0.35 ± 0.83 0.28 ± 0.62 136.4 ± 31.9* Medium 53.6 ± 6.7 146.2 ± 23.8 59.96 ± 1.62 37.79 ± 0.52* 22.17 ± 1.21* 1.71 ± 0.09* 0.37 ± 0.18* 0.18 ± 0.17 0.19 ± 0.17 128.6 ± 21.8* High 38.5 ± 5.7* 78.5 ± 3.08* 59.45 ± 0.59 37.57 ± 0.59* 21.88 ± 0.79* 1.71 ± 0.09* 0.35 ± 0.19* 0.17 ± 0.05 0.18 ± 0.16 125.5 ± 29.8* Note. *Compared with the control group with P < 0.05.
下载: 导出CSV
Table 3. Blood Biochemical Indices Related to Hepatic Function of Female Rats (n = 10, x ± sd)
Groups ALT(U/L) AST(U/L) TP(g/L) ALB(g/L) GLB(g/L) A/G TBIL(μmol/L) DBIL(μmol/L) IBIL(μmol/L) ALP(U/L) Control 35.8 ± 5.1 111.6 ± 9.9 63.27 ± 1.80 39.62 ± 0.91 23.65 ± 1.19 1.68 ± 0.07 0.66 ± 0.21 0.13 ± 0.11 0.53 ± 0.26 68.1 ± 9.0 Low 39.1 ± 4.7 117.4 ± 17.8 63.28 ± 1.91 40.08 ± 0.85 22.17 ± 1.28* 1.81 ± 0.09* 0.60 ± 0.24 0.37 ± 0.14 0.23 ± 0.18* 77.1 ± 8.9* Medium 40.5 ± 4.4 122.4 ± 23.5 64.06 ± 1.49 41.05 ± 0.88* 23.01 ± 0.86* 1.78 ± 0.05* 0.49 ± 0.26* 0.13 ± 0.09 0.36 ± 0.25 80.9 ± 11.6* High 35.3 ± 7.3 87.0 ± 18.3* 62.04 ± 2.04 41.11 ± 1.28* 21.96 ± 1.19* 1.87 ± 0.09* 0.41 ± 0.28* 0.11 ± 0.11 0.30 ± 0.27 81.3 ± 23.2* Note. *Compared with the control group with P < 0.05.
下载: 导出CSV
Table 4. Blood Biochemical Indices Related to Renal Function of Rats (n = 10, x ± sd)
Groups Male Rats Female Rats UREA (mmol/L) CREA (μmol/L) UREA (mmol/L) CREA (μmol/L) Control 5.99 ± 0.75 35.9 ± 2.1 6.36 ± 0.42 35.4 ± 1.6 Low 7.35 ± 1.43* 32.3 ± 4.6 7.34 ± 0.59* 36.3 ± 2.9 Medium 7.53 ± 0.77* 37.3 ± 3.8 7.88 ± 1.01* 33.3 ± 2.4* High 7.40 ± 0.61* 35.5 ± 8.3 7.88 ± 1.09* 34.9 ± 7.8* Note. *Compared with the control group with P < 0.05.
下载: 导出CSV
Table 5. Blood Glucose and Cholesterol Levels of Rats (n = 10, x ± sd)
Groups Male Rats Female Rats GLU (mmol/L) CHOL (mmol/L) GLU (mmol/L) CHOL (mmol/L) Control 8.90 ± 1.54 2.14 ± 0.22 6.84 ± 0.97 2.05 ± 0.22 Low 9.21 ± 2.76 2.28 ± 0.40 6.03 ± 1.03 1.92 ± 0.24 Medium 8.26 ± 1.87 1.96 ± 0.18 7.58 ± 1.36 2.08 ± 0.15 High 8.22 ± 1.41 1.93 ± 0.14* 6.54 ± 0.91 1.91 ± 0.14 Note. *Compared with the control group with P < 0.05.
下载: 导出CSV
Table 6. The Effect of the Defoamer on Routine Blood Indices in Male Rats (n = 10, x ± sd)
Item Abbreviation Unit Control Low Medium High Immune cell indices White blood cell count WBC × 109/L 7.58 ± 1.73 10.50 ± 7.37 7.86 ± 3.19 6.76 ± 1.67 Percentage of lymphocyte Lymph% % 94.82 ± 2.18 97.19 ± 0.87* 96.81 ± 0.35* 96.00 ± 1.07 Percentage of granulocyte Gran% % 1.58 ± 0.91 1.05 ± 0.33 1.26 ± 0.21 1.61 ± 0.59 Red blood cell indices Red blood cell count RBC × 1012/L 6.98 ± 0.17 6.92 ± 0.92 7.42 ± 0.39* 7.22 ± 0.42 Hemoglobin HGB g/L 152.2 ± 2.7 148.7 ± 13.4 154.6 ± 3.4 154.1 ± 3.4 Mean corpuscular volume MCV Fl 53.89 ± 0.66 58.07 ± 6.22 56.31 ± 0.50* 56.43 ± 0.43* Platelet indices Platelet number PLT × 109/L 2096.5 ± 208.5 1047.2 ± 215.1* 1179.8 ± 108.7* 1047.29 ± 75.8* Note. *Compared with the control group with P < 0.05.
下载: 导出CSV
Table 7. The Effect of the Defoamer on Routine Blood Indices in Female Rats (n = 10, x ± sd)
Item Abbreviation Unit Control Low Medium High Immune cell indices White blood cell count WBC × 109/L 4.74 ± 0. 81 5.37 ± 3.40 4.41 ± 3.03 6.39 ± 1.91* Percentage of lymphocyte Lymph% % 97.44 ± 0.81 84.34 ± 2.30* 81.58 ± 2.39* 84.12 ± 1.79* Percentage of granulocyte Gran% % 0.96 ± 0.33 7.69 ± 1.56* 9.33 ± 1.74* 7.48 ± 1.29* Red blood cell indices Red blood cell count RBC × 1012/L 6.89 ± 0.13 5.64 ± 0.57* 6.08 ± 0.20* 6.14 ± 0.27* Hemoglobin HGB g/L 152.0 ± 6.38 144.0 ± 9.08 148.6 ± 5.13 153.1 ± 5.30 Mean corpuscular volume MCV Fl 57.17 ± 0.55 49.83 ± 0.54* 50.05 ± 0.72* 50.41 ± 0.89* Platelet indices Platelet number PLT × 109/L 1539.9 ± 104.5 4945.5 ± 508.5* 5362.2 ± 588.7* 5312.2 ± 580.9* Note. *Compared with the control group with P < 0.05.
下载: 导出CSV
Table 8. Results of Histopathological Examination (n = 10, x ± s)
Pathological Changes Female (n = 10) Male (n = 10) Control High Control High Liver Focus of mononuclear cell infiltration 2 2 5 1 Scattered hepatic cell steatosis 0 0 0 1 Hepatic congestion, hepatic cell steatosis, punctate necrosis with mononuclear cell infiltration 0 0 0 3 Spleen Hemosiderosis 1 0 0 0 Submembranous congestion 0 1 0 0 Spleen congestion 0 0 0 1 Kidney Glomerular mesangial hyperplasia 1 0 0 0 Stomach Mild erosion of gastric mucosal epithelium 1 0 0 0 Intestines Mild erosion of duodenal mucosa 0 0 0 2 Adrenal gland Cortical congestion 1 2 2 2 Atrophy 2 3 0 0 Ovary Luteal granulosa cell vacuolation 1 0 / /
下载: 导出CSV
-
[1] The State Council Gazette of the People's Republic of China. Town water supply: Opinions of the General Office of the State Council on speeding up the development of seawater desalination industry. 2012. [2] Chang-Hai LI, Zhang YX. Discussion on seawater desalination technology and its application. Electric Power Technology & Environmental Protection, 2011; 27, 48-51. http://www.wanfangdata.com.cn/details/detail.do?_type=perio&id=dlhjbh201101014 [3] Liu YH, Feng HJ, Yun-Hong GE. Analysis on Characteristics and Use of Product Water from Seawater Desalination Plants. China Water & Wastewater, 2009; 25, 88-92. http://www.wanfangdata.com.cn/details/detail.do?_type=perio&id=zgjsps200914024 [4] Eninke Q. Encyclopedia of chemistry technology. Encyclopedia of chemistry technology. New York: Marcel Dekker Inc, 1963; 776-7. [5] Ge CC, Wang YS, Yu HW, et al. Study On Foam and Antifoaming agent. Development & Application of Materials, 2010; 25, 81-5. http://d.old.wanfangdata.com.cn/Periodical/jxhg201002019 [6] Zhu TY, Mao LI, Cheng L, et al. Types and Characteristics Introduction of Antifoaming Agent. Lubricating Oil, 2017; 32, 23-5. http://www.wanfangdata.com.cn/details/detail.do?_type=perio&id=rhy201706005 [7] Chang GR, Chen GP, Chen L, et al. Preparation and application of silicon defoaming agent modified by polyether. Applied Chemical Industry, 2012; 41, 232-6. http://www.wanfangdata.com.cn/details/detail.do?_type=perio&id=sxhg201202014 [8] Li Y. Matters needing attention in the evaluation and application of defoamer. Paper and Papermaking, 2000; 4, 60-1. [9] Wu HL, Yang BN. Toxicity of LES defoamer. Cancer Aberration: Mutation, 1992; 4, 26-8. [10] Ye YM. Food additives and their safety. Drug Evaluation, 2005; 2, 81-90. http://d.old.wanfangdata.com.cn/Periodical/zxqykj200920047 [11] Linyong Y, Lilong A, Chunliang C. Study on the Toxicological Safety of a Common Type of Water-Based Defamer. Asian Journal of Ecotoxicology, 2010; 5, 143-8. [12] Foundation NS. NSF/ANSI 60-2012. Drinking Water Treatment Chemicals-Health Effects. The United States, 2012. [13] Ministry of Health, People's Republic of China. Hygienic safety assessment of chemical treatment agents for drinking water. Beijing:China Standard Press, 2012. [14] Wang Luyao DL, Zhao Kangfeng, Gu Wen, et al. Determine the cytotoxicity of scale inhibitor in seawater desalting by real-time cell analysis. Journal of Toxicology, 2018; 32, 131-4. [15] Organization for Economic Co-operation and Development. Guidelines for the testing of chemicals. 2018. [16] Lu Ya-qing, Zhang Nan, Wang Wen-zong, et al. Study on defoaming mechanism of polyether modified polysiloxane compounds. Silicone Material, 2010; 24, 80-4. http://www.wanfangdata.com.cn/details/detail.do?_type=perio&id=yjgcljyy201002003 [17] Luo Qian. Synthesis and properties of polyether modified silicone defoaming agent, Beijing: University of Chinese Academy of Sciences, 2014. [18] Wang Xixu, Zhu Xuefeng, Zuo Shengli, et al. Application of Defoaming Agent in Seawater Circulating Cooling System of Coastal NPPs. Radiation Protection Bulletin, 2015; 2, 21-4. http://www.wanfangdata.com.cn/details/detail.do?_type=perio&id=fsfhtx201502006 [19] Sun GF. Occupational health and occupational medicine. Beijing:People's Health Publishing House, 2012. [20] Ye Weifa, Zhong Zhenyi. Hepatobiliary Diagnosis. Tianjin:Tianjin science and technology press, 1997. [21] Evans GO. Animal Clinical Chemistry. Control and Reporting Center Press, 1996. [22] Provan D, Stasi R, Newland AC, et al. International consensus report on the investigation and management of primary immune thrombocytopenia. Blood, 2010; 115, 168-86. doi: 10.1182/blood-2009-06-225565 [23] Isenhart CE, Brandt JT. Platelet aggregation studies for the diagnosis of heparin-induced thrombocytopenia. Am J Clin Pathol, 1993; 99, 324. doi: 10.1093/ajcp/99.3.324 [24] Li Ping, Yang Renchi. Progress in the study of cellular immune mechanism of idiopathic thrombocytopenic purpura. Journal of Clinical Internal Medicine, 2010; 27, 365-8. [25] Su Liping, Hao Guoping. Study on cellular immune function in patients with chronic idiopathic thrombocytopenic purpura. Chinese Journal of Hematology, 2000; 21, 144-4. [26] Xu Youmei, Xu Xiao. The effect of menstrual cycle on Hemorheology. Jiangxi Medical Journal, 1995; 3, 129-33. (In Chinese) http://www.wanfangdata.com.cn/details/detail.do?_type=perio&id=xdzxyjhzz201714010 [27] Berglund U, Wallentin L, Von SH. Platelet function and plasma fibrinogen and their relations to gender, smoking habits, obesity and beta-blocker treatment in young survivors of myocardial infarction. Thromb Haemost, 1988; 60, 21-4. doi: 10.1055/s-0038-1647627 [28] Faraday N, Goldschmidtclermont PJ, Bray PF. Gender differences in platelet GPⅡb-Ⅲa activation. Thromb Haemost, 1997; 77, 748-54. doi: 10.1055/s-0038-1656045 [29] Lommatzsch M, Zingler D, Schuhbaeck K, et al. The impact of age, weight and gender on BDNF levels in human platelets and plasma. Neurobiol Aging, 2005; 26, 115-23. doi: 10.1016/j.neurobiolaging.2004.03.002 [30] Simon LM, Edelstein LC, Nagalla S, et al. Human platelet microRNA-mRNA networks associated with age and gender revealed by integrated plateletomics. Blood, 2014; 123, e37. doi: 10.1182/blood-2013-12-544692 [31] Bueno L, Beaufrand C, Theodorou V, et al. Influence of simethicone and alverine on stress-induced alterations of colonic permeability and sensitivity in rats:beneficial effect of their association. Journal of Pharmacy & Pharmacology, 2013; 65, 567-73. [32] Clayton Gd CF. Patty's industrial hygiene and toxicology(4th ed). New York: John Wiley and Sons Inc, 1994. -

 点击查看大图

计量
- 文章访问数: 1536
- HTML全文浏览量: 413
- PDF下载量: 46
- 被引次数: 0

 Quick Links