

 下载:
下载:

-
Acute respiratory infections (ARIs), which are one of the most common diseases, are the leading cause of morbidity and mortality in children and adults worldwide[1]. According to the World Health Organization (WHO), lower respiratory tract infections killed more than 3, 000, 000 people in 2016, making it the third overall cause of death[2]. The viruses most frequently detected in patients with ARIs include influenza-A virus (IFV-A), adenovirus (AdV), human coronaviruses (HCoVs), rhinovirus/enterovirus (EV/RV), parainfluenza viruses (PIVs), and Mycoplasma pneumoniae (M. pneu); however, the clinical presentations of respiratory tract infections are similar, making it difficult to distinguish between etiologic agents of viral and bacterial pneumoniae without laboratory diagnosis[3]. An accurate and rapid laboratory diagnosis can have a positive impact on patient management, reducing the length of hospital stay, avoiding the unnecessary use of antibiotics, and suggesting the use of appropriate antiviral agents[4].
With the introduction of the real-time PCR assay, a sensitive and specific amplification method, the diagnosis of respiratory infections has improved greatly. It is currently possible to search for up to 22 different respiratory pathogens, including viruses and bacteria, using a multiplex PCR format[5, 6]. Unlike conventional viral cell cultures, these new technologies allow the detection of viruses that are not detected at all by conventional methods. In addition, it is possible to detect co-infections that may influence disease severity or therapeutic strategies[7]. Notably, the use of this technology provides the best results when respiratory samples are collected in a timely fashion[8].
-
A total of 445 nasopharyngeal swab specimens were collected from patients with febrile respiratory syndrome (FRS) between May 2012 and May 2015. The specimens were transferred from sentinel surveillance hospital of Qinghai Province to the key laboratory of China CDC, and stored at -70 ℃ until tested. Inclusion criteria were fever, chills, elevated, reduced, or abnormal white blood cells of acute onset, and one or more of the following clinical manifestations of the respiratory tract: sore throat, throat discomfort, nasal congestion, runny nose, nasopharyngeal hyperemia, nasopharyngeal edema, cough, shortness of breath, abnormal auscultation breath sounds, chest pain, and inflammatory changes in the lungs observed upon imaging analysis[9]. Patients provided clinical information by completing a standard questionnaire under the guidance of the trained clinician.
-
Commercially available QIAamp MinElute Virus Spin Kits (Qiagen, Hilden, Germany) were used to extract the viral and bacterial nucleic acids (DNA or RNA), essentially as recommended by the manufacturer, resulting in a total of 80 μL of total nucleic acids being extracted from 200 μL clinical specimens. Negative water controls were included in every run. All of the PCR-ready samples were stored at -70 ℃ until use.
The samples were tested for respiratory viruses and bacteria using the RespiFinderSmart22 assay (PathoFinder BV, the Netherlands)[5]. Each sample was simultaneously analyzed for the following 22 pathogens (including 18 viruses and 4 bacteria): influenza A (IFV-A), influenza A (H1N1) pdm09 virus [IFV-A (H1N1) pdm09], influenza B (IFV-B), respiratory syncytial virus type A (RSV-A), respiratory syncytial virus type B (RSV-B), human metapneumovirus (hMPV), parainfluenza virus type 1 (PIV-1), parainfluenza virus type 2 (PIV-2), parainfluenza virus type 3 (PIV-3), parainfluenza virus type 4 (PIV-4), rhinovirus/enterovirus (RV/EV), human coronavirus NL63 (HCoV-NL63), human coronavirus HKU1 (HCoV-HKU1), human coronavirus 229E (HCoV-229E), human coronavirus OC43 (HCoV-OC43), human bocavirus (HBoV), adenovirus (AdV), Bordetella pertussis (B. pert), Chlamydia pneumoniae (C. pneu), Legionella pneumophila (L. pneu), and Mycoplasma pneumoniae (M. pneu). We set up parallel control experiments, including six paramyxovirus detection protocols, six human coronavirus detection protocols, and HRV and HAdV detection protocols established in our laboratory[10, 11]. Amplification, detection, and data analysis were performed using the LightCycler480 real-time PCR system (Roche, USA) according to the manufacturer's instructions.
-
Statistical analyses were performed using the SAS software (Version 9.3, USA). Chi-squared and Fisher's exact tests were used for comparisons between groups in terms of categorical variables wherever appropriate. A P value of < 0.05 was considered to be statistically significant.
-
This project was approved by the Institutional Review Boards of the Centre of Disease Control and Prevention of China and the Ethical Review Committee of Beijing Hospital. Individual written informed consent was obtained from the parents or guardians of all of the participants.
-
A total of 445 nasopharyngeal swab specimens from FRS patients with available clinical information were analyzed. Overall, 265 (59.55%) of the patients were male and 180 (40.45%) were female. The median age was 16 years [interquartile range (IQR)3-61]. The patients were divided into six age groups: (0-1)-year-old, (1-5)-year-old, (5-18)-year-old, (18-40)-year-old, (40-65)-year-old, and ≥ 65-year-old. The number of people in each age group was 77, 70, 80, 60, 68, and 90, respectively.
-
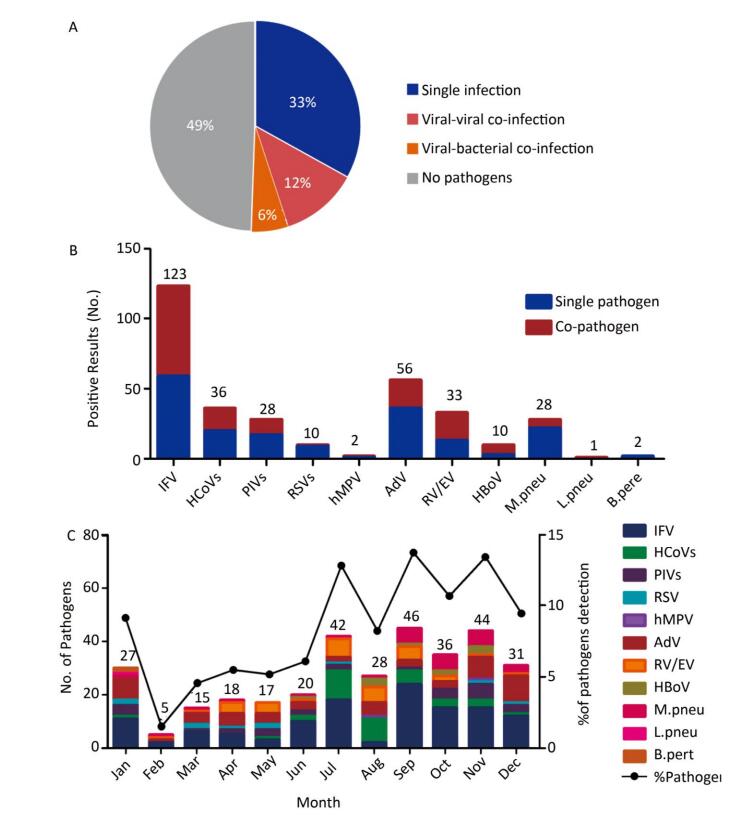
No pathogens were detected in 220 (49%) samples, while 147 (38%) of the specimens showed single infections, 53 (12%) showed viral-viral co-infections, and 25 (6%) of the specimens were viral-bacterial co-infections (Figure 1A). The positive detection rate in females was 53.33% (96/180), while it was 48.68% (129/265) in males, which did not differ significantly (P= 0.3346). Similarly, the positive detection rate in different age groups was diverse, but these differences were not statistically significant (P= 0.2124) (Table 1).
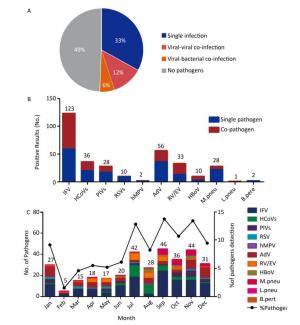
Figure 1. The etiology characteristics of acute febrile respiratory syndrome in Qinghai. (A) Detection rate of single infection or co-infections in 445 respiratory samples. The color pie chart represents the rate of any pathogen detection, and the gray part represents the rate of no-pathogen detection. (B) The numbers of single infection and co-infections for individual respiratory pathogen. (C) Distribution of the AFRS cases from January to December.
Table 1. Distribution of Virus in Different Groups
Virus Gender* Age-group* (y) Totol (N = 445) F (n = 180) M (n = 265) 0-1 (n = 77) 1-5 (n = 70) 5-18 (n = 80) 18-40 (n = 60) 40-65 (n = 68) > 65 (n = 90) IFV 68 (42.50) 55 (39.86) 25 (47.17) 7 (21.21) 17 (34.69) 25 (42.37) 23 (47.92) 26 (46.43) 123 (41.28) HCoVs 17 (10.63) 19 (13.77) 4 (7.55) 1 (3.03) 2 (4.08) 12 (20.34) 8 (16.67) 9 (16.07) 36 (12.08) PIVs 13 (8.13) 15 (10.87) 7 (13.21) 10 (30.30) 2 (4.08) 3 (5.08) 2 (4.17) 4 (7.14) 28 (9.40) RSV 4 (2.50) 6 (4.35) 2 (3.77) 1 (3.03) 2 (4.08) 3 (5.08) 1 (2.08) 1 (1.79) 10 (3.36) hMPV 2 (1.25) 0 (0.00) 0 (0.00) 0 (0.00) 0 (0.00) 0 (0.00) 0 (0.00) 2 (3.57) 2 (0.67) AdV 32 (20.00) 24 (17.39) 10 (18.87) 5 (15.15) 18 (36.73) 9 (15.25) 10 (20.83) 4 (7.14) 56 (18.79) EV/RV 17 (10.63) 16 (11.59) 2 (3.77) 4 (12.12) 7 (14.29) 7 (11.86) 4 (8.33) 9 (16.07) 33 (11.07) HBoV 7 (4.38) 3 (2.17) 3 (5.66) 5 (15.15) 1 (2.04) 0 (0.00) 0 (0.00) 1 (1.79) 10 (3.36) totol 160 (100) 138 (100) 53 (100) 33 (100) 49 (100) 59 (100) 48 (100) 56 (100) 298 (100) Fisher's 1.52 × 10⁶ 3.52 × 10⁻³³ Exact values 0.7008 0.0001 Note.*: Values are shown as No.(%). IFV: influenza; HCoV: human coronavirus; PIV: parainfluenza virus; RSV: respiratory syncytial virus; hMPV: human metapneumovirus; AdV: adenovirus; EV/RV: enterovirus/rhinovirus; HBoV: human bocavirus. Overall, 329 pathogens were detected, among which 298 (90.58%) were viruses and 31 (9%) were bacteria. Among the viruses, influenza virus (IFV) was most commonly detected, with a proportion of 41.28% (123/298), followed by AdV with a proportion of 18.79% (56/298) (Figure 1B, Table 1). Among IFV infections, the most commonly detected virus was IFV-A (118/123), followed by IFV-B (3/123) and IFV-A (H1N1) pdm09 (2/123). Among the bacteria, 28 were identified as M. pneu, 2 were B. pert, 1 was L. pneu, and C. pneu was not detected. Among all of the pathogens, IFV, AdV, HCoVs, RV/EV, PIVs, and M. pneu were in the top of five, with detection rates of 37.38% (123/329), 17.02% (56/329), 10.94% (36/329), 10.03% (33/329), 8.51% (28/329), and 8.51% (28/329), respectively.
-
The distribution of respiratory viruses among groups is shown in Table 2. The proportion of viruses differed between males and females, but the difference was not statistically significant (P= 0.7008). The most commonly detected viruses in males and females were IFV, AdV, HCoVs, and EV/RV, while two positive hMPV infections were detected in the male group.
Table 2. Distribution of Co-infection
Group Virus NO.* Virus NO.* Dual Infections (n = 62) Inter- AdV + RV/EV 1 (1.61) RV/EV + M. pneu 1 (1.61) AdV + IFV 14 (22.58) PIV + IFV 2 (3.23) AdV + PIV 1 (1.61) PIV + AdV 1 (1.61) HBoV + B. pert 1 (1.61) IFV + M. pneu 14 (22.58) HBoV + M. pneu 1 (1.61) PIV + B. pert 1 (1.61) HCoV + IFV 6 (9.68) PIV + RV/EV 1 (1.61) HCoV + AdV 2 (3.23) RSV + AdV 3 (4.84) HCoV + RV/EV 1 (1.61) RSV + HBoV 1 (1.61) hMPV + RV/EV 1 (1.61) RSV + IFV 1 (1.61) RV/EV + IFV 1 (1.61) Intra- IFV-A + IFV-H1N1pdm09 1 (1.61) HCoV-OC43 + HCoV-HKU1 5 (8.06) IFV-A + IFV-B 1 (1.61) PIV-1 + PIV-3 1 (1.61) Triple and above Infections (n = 16) Inter- AdV + RV/EV + IFV 2 (12.5) RSV + AdV + IFV 1 (6.25) AdV + IFV + M. pneu 2 (12.5) AdV + RV/EV + IFV + M. pneu 2 (12.5) HCoV + RV/EV + IFV 1 (6.25) PIV + RSV + AdV + IFV 3 (18.75) RV/EV + IFV + M. pneu 2 (12.5) PIV + AdV + IFV + M.pneu 1 (6.25) PIV + AdV + IFV 2 (12.5) Note. *: Values are shown as No.(%). AdV: adenovirus; EV/RV: enterovirus/rhinovirus; IFV: influenza; PIV: parainfluenza virus; HBoV: human bocavirus; B. pert: Bordetella pertussis; M. pneu: Mycoplasma pneumoniae; HCoV: human coronavirus; IFV: influenza; hMPV: human metapneumovirus. Conversely, the proportion of respiratory viruses differed significantly among different age groups (P= 0.0001). Among (0-1)-year-old, (1-5)-year-old, and (5-18)-year-old, the top three detected viruses were similar, consisting of IFV, AdV and PIVs, while the three most common viruses among (18-40)-year-old and (40-65)-year-old were IFV, HCoVs, and AdV. In the over 65-year-old age group, the top three respiratory viruses were IFV, HCoVs, and EV/RV. The most common respiratory viruses in the (0-1)-year-old, (1-5)-year-old, (5-18)-year-old, (18-40)-year-old, (40-65)-year-old, and over 65-year-old age groups were IFV (n = 25), PIVs (n = 10), AdV (n = 18), IFV (n = 25), IFV (n = 23), and IFV (n = 26).
-
All of the pathogens were analyzed according to the monthly distribution, and the most common viruses were mapped in Figure 1C. Overall, the total number of respiratory pathogens was found to be highest in September (n = 46) and November (n = 44). Only IFV and AdV were screened throughout the year. For IFV, four peak months were identified, July (n = 18), September (n = 24), October (n = 15) and November (n = 15). AdV peaked in January (n = 8) and December (n = 10). HCoVs and RV/EV peaked in July, with 11 and 7 cases, respectively. Although the monthly trend of the pathogens was not obvious, they were more likely to be found in July, September, and November.
-
Co-infection was detected in 78 specimens, with a detection rate of 17.53% (78/445) being observed for all of the specimens and 34.67% (78/225) for positive specimens. Co-infection was significantly (χ2 = 4.6074, P = 0.0312) less common in male patients (38/265, 14.34%) than in female patients (40/180, 22.22%). The co-infection rate varied significantly among age groups (χ2 = 12.8745, P= 0.0246). The distribution of co-infections is shown in Table 2. Dual infections were the most frequently detected co-infection mode, and IFV/AdV (n = 14) and IFV/PIV (n = 14) were the most common co-infection combinations. Intra-species co-infections were seen in IFV, HCoV, and PIV.
Among the respiratory viruses, IFV (64/123, 52.03%), RV/EV (20/33, 60.61%), and HBoV (7/10, 70.00%) were more commonly detected as single pathogens, with a proportion over 50%, whereas HCoVs (20/36, 55.56%), PIVs (17/28, 60.71%), RSV (9/10, 90.00%), and AdV (36/56, 64.28%) were primarily detected in co-infections. One of two hMPV-positive cases was a co-infection. Among bacteria, 22 M. pneu (22/28, 78.57%) and 2 B. pert (2/2, 100%) were detected in co-infections, while 1 L. pneu (1/1, 100%) was observed as a single infection (Figure 1B).
All of the experimental results were validated using single or multiple PCR assays established in our laboratory (data not shown).
-
Acute respiratory tract infections (ARTIs) are a common clinical condition, and pathogens are considered to be an important cause of these infections[12]. Accurate and rapid identification of the pathogens responsible for ARTIs is critically important for the application of appropriate antiviral therapies and prevention of excessive use of antibiotics[13]. Due to their sensitivity and rapidity, molecular technologies play a key role in early diagnosis and have evolved into laboratory diagnostic criteria[14]. A wide variety of pathogens can lead to respiratory infections, and pathogenic spectrum studies provide more accurate and clear information[15-17]. In the present study, a commercial diagnosis kit was used for detection of 18 respiratory virus and four bacteria by multiplex real time PCR, and at least one agent was identified in 51% of the nasopharyngeal swabs. This high rate of detection is similar to that reported in previous studies in which molecular methods were used[1, 18, 19]. Although the detection rate of other findings is low[20], differences in virus-detection rates may depend on a variety of factors, including the specimen type, method used, working group, and when the study was performed[21].
It has been reported that men were more susceptible to viral respiratory infections than women[22]; however, in the present study women were found to be slightly more susceptible, accounting for (53.33%) of the positive cases, although there were no significant differences between male and female patients (P = 0.3346). There were also no significant differences in the detection rate between the six age groups (P = 0.2124). The high overall detection rate and gender and age group analysis suggested that the overall population was susceptible to multiple respiratory viruses, which were also transmitted within the community.
Respiratory virus distribution data showed that there were differences in distribution among genders and age groups. There were no significant differences among genders, although there were significant differences among age groups. The three most common viruses detected differed among age groups. Javadi et al.[21] identified the most common agents as RV/EV in the (0-4)-year-old age group and IFV-B in the (5-50)-year-old age group in Iran. In a study conducted in the United States, the most prevalent agents were found to be HBoV in the (0-4)-year-old age group and RV/EV in the (5-50)-year-old age group[22]. These results suggest that the prevalence of respiratory viruses changes based on geographic region and age group.
The most common respiratory viruses detected in the present study were IFV (37.39%) and AdV (17.02%). IFV, which was one of the most important pathogens, has the potential for epidemics in the public health, ranging from mild upper respiratory infections to severe pneumonia leading to death[23]. In our study, IFV-A was not only the agent most commonly detected in the IFV group, but also the most common of all detected viruses. Liao et al.[24] found the most common pathogen for causing respiratory infections in adults in China to be IFV-A, which was similar to our findings, indicating that IFV-A play an important role in ARTIs. AdV is considered to be an important cause of ophthalmology, as well as gastrointestinal and nervous system syndromes, and is also known to be an important cause of upper and lower respiratory tract infections in children[25]. In the present study, AdV had the second highest detection rate, followed by IFV. Li et al.[25] reported that the detection rate of AdV in children in China was 13.8%, which was similar to the results of the present study. In an investigation in South Korea, the prevalence of AdV in children was only 4%, and the detection rate among adults was only 0.2%[26], suggesting that the detection rate of the disease varies from region to region, and that Qinghai has a high AdV prevalence.
Since the outbreak of severe acute respiratory syndrome (SARS) coronavirus, human coronaviruses (HCoVs) have received increased attention. Human coronaviruses are associated with respiratory syndromes ranging from mild upper to severe lower respiratory tract infections, including pneumonia and bronchiolitis[27]. In this study, the HCoVs group included four common respiratory coronaviruses with a detection rate of 8.09%, which was different from other reported cases in which HCoVs were rarely detected in ARTIs[28]. Similar to HCoVs, RV/EV and PIVs had a detection rate of 7.42% and 6.29%. RV/EV is now considered to be a major cause of lower ARTIs and asthmatic exacerbation[29]. PIVs can also cause upper respiratory disease and lower respiratory tract disease in people[30]. HCoVs, RV/EV, PIVs, and IFV were the major respiratory viruses among the 18 detected viruses. Notably, the detection rate of RSV was lower than the aforementioned viruses. RSV is known as the most common cause of bronchiolitis and pneumonia in infants and young children worldwide, with a detection rate of 28.1%[31]. This difference in detection rate indicates that RSV has geographical features.
Co-infection was a common phenomenon, with an incidence of 5% to 62%[32]. In this study, 18% of the samples were found to contain more than two pathogens at the same time, and the detection rate of co-infection was higher than that of individual infection. Specifically, almost all of the pathogens were mixed infections, and HCoVs, PIVs, RSV, and AdV were more common in mixed infections. Zhang et al.[33] found the most prevalent viral agents in co-infections to be IFVs and RV, which was similar to our finding that the IFV group was most commonly detected with other pathogens. However, in another study, HBoV and HMPV were found to be the most common co-infecting viruses[22]. Although the detection rate of co-infection was high, further study is necessary to determine its clinical significance. Most studies conducted to date have shown that the presence of multiple pathogens in a respiratory sample does not affect the clinical manifestations of ARTIs[29, 32, 33]. The development of quantitative real-time PCR provides a route for viral load assessment and may be a better choice for the interpretation of positive co-infection results, but its potential value needs further clarification[34].
ARTIs are usually seasonal, particularly in regions with temperate climates. In the Northern Hemisphere, respiratory viruses are reportedly more active during the fall and winter (generally from November to March)[22]. Interestingly, IFV (IFV-A mainly) did not peak in the autumn months or winter in the present study, but it began to appear in July and September (Figure 1C). HCoVs and RV/EV peaked in July, and AdV peaked in winter. When compared to previous reports[22], peak-time differences could be explained by fewer cases, annual variability, or regional differences in the present study.
It should be noted that this study had some limitations. First, we were unable to obtain accurate clinical diagnostic data for cases and were unable to assess the clinical significance of the pathogens. However, objective test results and epidemiological analysis could also provide meaningful information for the clinic. Second, although 455 patients in 3 years may be considered too short and too few patients to conduct trend studies, we believe our preliminary data provide insights that will be useful for further research.
In conclusion, in the present study, IFV-A was found to be the most prevalent respiratory pathogen among 22 detected pathogens, followed by AdV, HCoVs, RV/EV, PIVs, and M. pneu. When compared with the viruses, bacteria appeared less frequently, and co-infections were the most common phenomenon for virus pathogens. Moreover, the distribution of pathogens varied among age groups. In our region, respiratory viruses were generally active in July, September, and November, and the peak months for the identified agents were different from each other over a three-year period. Finally, the results indicated that a multiplex real-time PCR assay could be a suitable and effective method for the early detection and monitoring of respiratory pathogens to control the spread of infection and contribute to public health surveillance efforts.
-
The authors would like to thank the staffs of Center for Disease Control and Prevention of Qinghai Province for providing specimens.
doi: 10.3967/bes2019.058
Viral and Bacterial Etiology of Acute Febrile Respiratory Syndrome among Patients in Qinghai, China
-
Abstract:
Objective This study was conducted to investigate the viral and bacterial etiology and epidemiology of patients with acute febrile respiratory syndrome (AFRS) in Qinghai using a commercial routine multiplex-ligation-nucleic acid amplification test (NAT)-based assay. Methods A total of 445 nasopharyngeal swabs specimens from patients with AFRS were analyzed using the RespiFinderSmart22kit (PathoFinder BV, Netherlands) and the LightCycler 480 real-time PCR system. Results Among the 225 (225/445, 51%) positive specimens, 329 positive pathogens were detected, including 298 (90.58%) viruses and 31 (9%) bacteria. The most commonly detected pathogens were infiuenza virus (IFV; 37.39%; 123/329), adenovirus (AdV; 17.02%; 56/329), human coronaviruses (HCoVs; 10.94%; 36/329), rhinovirus/enterovirus (RV/EV; 10.03%; 33/329), parainfiuenza viruses (PIVs; 8.51%; 28/329), and Mycoplasma pneumoniae (M. pneu; 8.51%; 28/329), respectively. Among the co-infected cases (17.53%; 78/445), IFV/AdV and IFV/M. pneu were the most common co-infections. Most of the respiratory viruses were detected in summer and fall. Conclusion In our study, IFV-A was the most common respiratory pathogen among 22 detected pathogens, followed by AdV, HCoV, RV/EV, PIV, and M. pneu. Bacteria appeared less frequently than viruses, and co-infection was the most common phenomenon among viral pathogens. Pathogens were distributed among different age groups and respiratory viruses were generally active in July, September, and November. Enhanced surveillance and early detection can be useful in the diagnosis, treatment, and prevention of AFRS, as well as for guiding the development of appropriate public health strategies. -
Figure 1. The etiology characteristics of acute febrile respiratory syndrome in Qinghai. (A) Detection rate of single infection or co-infections in 445 respiratory samples. The color pie chart represents the rate of any pathogen detection, and the gray part represents the rate of no-pathogen detection. (B) The numbers of single infection and co-infections for individual respiratory pathogen. (C) Distribution of the AFRS cases from January to December.
Table 1. Distribution of Virus in Different Groups
Virus Gender* Age-group* (y) Totol (N = 445) F (n = 180) M (n = 265) 0-1 (n = 77) 1-5 (n = 70) 5-18 (n = 80) 18-40 (n = 60) 40-65 (n = 68) > 65 (n = 90) IFV 68 (42.50) 55 (39.86) 25 (47.17) 7 (21.21) 17 (34.69) 25 (42.37) 23 (47.92) 26 (46.43) 123 (41.28) HCoVs 17 (10.63) 19 (13.77) 4 (7.55) 1 (3.03) 2 (4.08) 12 (20.34) 8 (16.67) 9 (16.07) 36 (12.08) PIVs 13 (8.13) 15 (10.87) 7 (13.21) 10 (30.30) 2 (4.08) 3 (5.08) 2 (4.17) 4 (7.14) 28 (9.40) RSV 4 (2.50) 6 (4.35) 2 (3.77) 1 (3.03) 2 (4.08) 3 (5.08) 1 (2.08) 1 (1.79) 10 (3.36) hMPV 2 (1.25) 0 (0.00) 0 (0.00) 0 (0.00) 0 (0.00) 0 (0.00) 0 (0.00) 2 (3.57) 2 (0.67) AdV 32 (20.00) 24 (17.39) 10 (18.87) 5 (15.15) 18 (36.73) 9 (15.25) 10 (20.83) 4 (7.14) 56 (18.79) EV/RV 17 (10.63) 16 (11.59) 2 (3.77) 4 (12.12) 7 (14.29) 7 (11.86) 4 (8.33) 9 (16.07) 33 (11.07) HBoV 7 (4.38) 3 (2.17) 3 (5.66) 5 (15.15) 1 (2.04) 0 (0.00) 0 (0.00) 1 (1.79) 10 (3.36) totol 160 (100) 138 (100) 53 (100) 33 (100) 49 (100) 59 (100) 48 (100) 56 (100) 298 (100) Fisher's 1.52 × 10⁶ 3.52 × 10⁻³³ Exact values 0.7008 0.0001 Note.*: Values are shown as No.(%). IFV: influenza; HCoV: human coronavirus; PIV: parainfluenza virus; RSV: respiratory syncytial virus; hMPV: human metapneumovirus; AdV: adenovirus; EV/RV: enterovirus/rhinovirus; HBoV: human bocavirus.  下载: 导出CSV
Table 2. Distribution of Co-infection
Group Virus NO.* Virus NO.* Dual Infections (n = 62) Inter- AdV + RV/EV 1 (1.61) RV/EV + M. pneu 1 (1.61) AdV + IFV 14 (22.58) PIV + IFV 2 (3.23) AdV + PIV 1 (1.61) PIV + AdV 1 (1.61) HBoV + B. pert 1 (1.61) IFV + M. pneu 14 (22.58) HBoV + M. pneu 1 (1.61) PIV + B. pert 1 (1.61) HCoV + IFV 6 (9.68) PIV + RV/EV 1 (1.61) HCoV + AdV 2 (3.23) RSV + AdV 3 (4.84) HCoV + RV/EV 1 (1.61) RSV + HBoV 1 (1.61) hMPV + RV/EV 1 (1.61) RSV + IFV 1 (1.61) RV/EV + IFV 1 (1.61) Intra- IFV-A + IFV-H1N1pdm09 1 (1.61) HCoV-OC43 + HCoV-HKU1 5 (8.06) IFV-A + IFV-B 1 (1.61) PIV-1 + PIV-3 1 (1.61) Triple and above Infections (n = 16) Inter- AdV + RV/EV + IFV 2 (12.5) RSV + AdV + IFV 1 (6.25) AdV + IFV + M. pneu 2 (12.5) AdV + RV/EV + IFV + M. pneu 2 (12.5) HCoV + RV/EV + IFV 1 (6.25) PIV + RSV + AdV + IFV 3 (18.75) RV/EV + IFV + M. pneu 2 (12.5) PIV + AdV + IFV + M.pneu 1 (6.25) PIV + AdV + IFV 2 (12.5) Note. *: Values are shown as No.(%). AdV: adenovirus; EV/RV: enterovirus/rhinovirus; IFV: influenza; PIV: parainfluenza virus; HBoV: human bocavirus; B. pert: Bordetella pertussis; M. pneu: Mycoplasma pneumoniae; HCoV: human coronavirus; IFV: influenza; hMPV: human metapneumovirus.
下载: 导出CSV
-
[1] Goktas S, Sirin MC. Prevalence and Seasonal Distribution of Respiratory Viruses During the 2014-2015 Season in Istanbul. Jundishapur J Microbiol, 2016; 9, e39132. [2] WHO, the top 10 global causes of deaths, 2016. http://www.who.int/mediacentre/factsheets/fs310/en/.[2018-5-24]. [3] Njouom R, Yekwa EL, Cappy P, et al. Viral etiology of influenza-like illnesses in Cameroon, January-December 2009. J Infect Dis, 2012; 206, S29-35. doi: 10.1093/infdis/jis573 [4] Paba P, Farchi F, Mortati E, et al. Screening of respiratory pathogens by Respiratory Multi Well System (MWS) r-gene assay in hospitalized patients. New Microbiol, 2014; 37, 231-6. http://www.wanfangdata.com.cn/details/detail.do?_type=perio&id=5a70e4eb13c9532728576c9002d9d0d0 [5] Dabisch-Ruthe M, Vollmer T, Adams O, et al. Comparison of three multiplex PCR assays for the detection of respiratory viral infections:evaluation of xTAG respiratory virus panel fast assay, RespiFinder 19 assay and RespiFinder SMART 22 assay. BMC Infect Dis, 2012; 12, 163. doi: 10.1186/1471-2334-12-163 [6] Bruijnesteijn van Coppenraet LE, Swanink CM, van Zwet AA, et al. Comparison of two commercial molecular assays for simultaneous detection of respiratory viruses in clinical samples using two automatic electrophoresis detection systems. J Virol Methods, 2010; 169, 188-92. doi: 10.1016/j.jviromet.2010.07.032 [7] Paranhos-Baccala G, Komurian-Pradel F, Richard N, et al. Mixed respiratory virus infections. J Clin Virol, 2008; 43, 407-10. doi: 10.1016/j.jcv.2008.08.010 [8] Brittain-Long R, Westin J, Olofsson S, et al. Prospective evaluation of a novel multiplex real-time PCR assay for detection of fifteen respiratory pathogens-duration of symptoms significantly affects detection rate. J Clin Virol, 2010; 47, 263-7. doi: 10.1016/j.jcv.2009.12.010 [9] Yu J, Xie Z, Zhang T, et al. Comparison of the prevalence of respiratory viruses in patients with acute respiratory infections at different hospital settings in North China, 2012-2015. BMC Infect Dis, 2018; 18, 72. doi: 10.1186/s12879-018-2982-3 [10] Liu GS, Niu PH, Zhao SC, et al. Detection of six common human paramyxoviruses in patients with acute febrile respiratory symptoms using a novel multiplex real-time RT-PCR assay. J Med Virol, 2019; 91, 564-9. doi: 10.1002/jmv.v91.4 [11] Niu P, Shen J, Zhu N, et al. Two-tube multiplex real-time reverse transcription PCR to detect six human coronaviruses. Virol Sin, 2016; 31, 85-8. doi: 10.1007/s12250-015-3653-9 [12] Zaas AK, Garner BH, Tsalik EL, et al. The current epidemiology and clinical decisions surrounding acute respiratory infections. Trends Mol Med, 2014; 20, 579-88. [13] Pillet S, Lardeux M, Dina J, et al. Comparative evaluation of six commercialized multiplex PCR kits for the diagnosis of respiratory infections. PLoS One, 2013; 8, e72174. doi: 10.1371/journal.pone.0072174 [14] Quick J, Cumley N, Wearn CM, et al. Seeking the source of Pseudomonas aeruginosa infections in a recently opened hospital:an observational study using whole-genome sequencing. BMJ Open, 2014; 4, e006278. doi: 10.1136/bmjopen-2014-006278 [15] Yoshii Y, Shimizu K, Morozumi M, et al. Detection of pathogens by real-time PCR in adult patients with acute exacerbation of bronchial asthma. BMC Pulm Med, 2017; 17, 150. doi: 10.1186/s12890-017-0494-3 [16] Chen H, Weng H, Lin M, et al. The Clinical Significance of FilmArray Respiratory Panel in Diagnosing Community-Acquired Pneumonia. Biomed Res Int, 2017; 2017, 7320859. http://www.wanfangdata.com.cn/details/detail.do?_type=perio&id=10.1097/POC.0000000000000158 [17] Parrott G, Kinjo T, Nabeya D, et al. Evaluation of Anyplex Ⅱ RV16 and RB5 real-time RT-PCR compared to Seeplex (R) RV15 OneStep ACE and PneumoBacter ACE for the simultaneous detection of upper respiratory pathogens. J Infect Chemother, 2017; 23, 859-61. doi: 10.1016/j.jiac.2017.07.013 [18] Richter J, Panayiotou C, Tryfonos C, et al. Aetiology of Acute Respiratory Tract Infections in Hospitalised Children in Cyprus. PLoS One, 2016; 11, e0147041. doi: 10.1371/journal.pone.0147041 [19] Do AH, van Doorn HR, Nghiem MN, et al. Viral etiologies of acute respiratory infections among hospitalized Vietnamese children in Ho Chi Minh City, 2004-2008. PLoS One, 2011; 6, e18176. doi: 10.1371/journal.pone.0018176 [20] Brittain-Long R, Nord S, Olofsson S, et al. Multiplex real-time PCR for detection of respiratory tract infections. J Clin Virol, 2008; 41, 53-6. doi: 10.1016/j.jcv.2007.10.029 [21] Javadi A, Adibi P, Ataei B, et al. Surveillance of acute respiratory infections among outpatients:A pilot study in Isfahan city. J Res Med Sci, 2015; 20, 115-21. [22] Cicek C, Arslan A, Karakus HS, et al. Prevalence and seasonal distribution of respiratory viruses in patients with acute respiratory tract infections, 2002-2014. Mikrobiyol Bul, 2015; 49, 188-200. doi: 10.5578/mb.9024 [23] Yuksel H, Yilmaz O, Akcali S, et al. Common viral etiologies of community acquired lower respiratory tract infections in young children and their relationship with long term complications. Mikrobiyol Bul, 2008; 42, 429-35. [24] Liao X, Hu Z, Liu W, et al. New Epidemiological and Clinical Signatures of 18 Pathogens from Respiratory Tract Infections Based on a 5-Year Study. PLoS One, 2015; 10, e0138684. doi: 10.1371/journal.pone.0138684 [25] Li Y, Zhou W, Zhao Y, et al. Molecular typing and epidemiology profiles of human adenovirus infection among paediatric patients with severe acute respiratory infection in China. PLoS One, 2015; 10, e0123234. doi: 10.1371/journal.pone.0123234 [26] Seo YB, Cheong HJ, Song JY, et al. Epidemiologic differences of four major respiratory viruses between children, adolescents, and adults in Korea. J Infect Chemother, 2014; 20, 672-7. doi: 10.1016/j.jiac.2013.07.009 [27] Fouchier RA, Hartwig NG, Bestebroer TM, et al. A previously undescribed coronavirus associated with respiratory disease in humans. Proc Natl Acad Sci USA, 2004; 101, 6212-6. doi: 10.1073/pnas.0400762101 [28] Liu WK, Liu Q, Chen DH, et al. Epidemiology of acute respiratory infections in children in Guangzhou:a three-year study. PLoS One, 2014; 9, e96674. doi: 10.1371/journal.pone.0096674 [29] Jin Y, Zhang RF, Xie ZP, et al. Newly identified respiratory viruses associated with acute lower respiratory tract infections in children in Lanzou, China, from 2006 to 2009. Clin Microbiol Infect, 2012; 18, 74-80. doi: 10.1111/j.1469-0691.2011.03541.x [30] Pan Y, Zhang Y, Shi W, et al. Human parainfluenza virus infection in severe acute respiratory infection cases in Beijing, 2014-2016:A molecular epidemiological study. Influenza Other Respir Viruses, 2017; 11, 564-8. doi: 10.1111/irv.2017.11.issue-6 [31] Malasao R, Okamoto M, Chaimongkol N, et al. Molecular Characterization of Human Respiratory Syncytial Virus in the Philippines, 2012-2013. PLoS One, 2015; 10, e0142192. doi: 10.1371/journal.pone.0142192 [32] Goka EA, Vallely PJ, Mutton KJ, et al. Single and multiple respiratory virus infections and severity of respiratory disease:a systematic review. Paediatr Respir Rev, 2014; 15, 363-70. [33] Zhang D, He Z, Xu L, et al. Epidemiology characteristics of respiratory viruses found in children and adults with respiratory tract infections in southern China. Int J Infect Dis, 2014; 25, 159-64. doi: 10.1016/j.ijid.2014.02.019 [34] Jansen RR, Wieringa J, Koekkoek SM, et al. Frequent detection of respiratory viruses without symptoms:toward defining clinically relevant cutoff values. J Clin Microbiol, 2011; 49, 2631-6. doi: 10.1128/JCM.02094-10 -

 点击查看大图
图(1) / 表ll (2)
计量
- 文章访问数: 3488
- HTML全文浏览量: 721
- PDF下载量: 192
- 被引次数: 0

 Quick Links