

 下载:
下载:


-
To implement the national policy of focusing on grassroots and prevention, and to promote a shift from hospitals to the community as the main locus of cardiovascular disease (CVD) prevention and control efforts, the National Center for Cardiovascular Diseases compiles a report on Cardiovascular Health and Diseases in China by experts in related fields nationwide every year, which provides detailed scientific information and support for health administrators and professionals.
In the past 30 years, clinical technology service capabilities based on hospitals have continued to be enhanced, and the accessibility and quality index of medical care have made remarkable progress in China, ranking the first among middle-income countries[1]. The number of inpatients with CVD has increased rapidly in China. Many cardiovascular technologies are at or near the world’s leading level, and significant progress has been achieved in China on solving the problem of “treatment difficulty” of CVD. However, owing to the prevalence of unhealthy lifestyles, such as unhealthy diet, insufficient physical activity and smoking closely related to CVD among Chinese residents, a huge population with CVD risk factors, accelerated population aging, and other reasons, the incidence and mortality rate of CVD are still increasing, and the turning point of the decline in disease burden has not appeared yet in China. In terms of the proportion of disease mortality among urban and rural residents, CVD still ranks the first. In 2020, CVD accounted for 48.00% and 45.86% of the causes of death in rural and urban areas, respectively; two out of every five deaths were due to CVD.
To promote the transition from a disease-centered approach to a people-centered approach in healthcare and focus on disease prevention and health promotion, the Outlines of “Healthy China 2030” Planning and the “Healthy China Action (2019–2030)” were successively released, marking a new stage in the development of China’s health industry. China has entered a new transition phase from high-speed to high-quality development; CVD prevention and control should also shift from a previous emphasis on scale-oriented growth to a focus on strategic and key technological development to curb the increasing incidence and mortality rates of CVD.
In the experience of developed countries, the improvements in risk factors at the population level make the greatest contribution to reducing deaths from coronary heart disease (CHD). In China, CVD prevention and control should adhere to the principle of “prevention first, primary care first” and implement “zero-level prevention” targeting the occurrence of hypertension, dyslipidemia, and diabetes. Interventions should focus on diet, physical activity, obesity, smoking, sleep, and psychological well-being and create a social environment conducive to healthy lifestyles. Strategies should be researched and developed to effectively increase awareness, treatment rates, and control rates of hypertension, dyslipidemia, and diabetes, and build a primary prevention system with the core goal of improving control rates of the “three highs” (high blood pressure, blood lipids, and blood sugar). In addition, greater allocation of medical resources to address the rapidly increasing number of cardiovascular emergencies and effective targeted measures to improve medical quality would be required. Furthermore, rehabilitation and secondary prevention medical services would need to be provided after discharge aimed at decreasing the risk of recurrence, rehospitalization, and disability among CVD survivors. “Internet + smart healthcare” based on big data is a crucial approach to CVD prevention and control and improving healthcare quality in the new era. Therefore, efforts should be made to actively promote healthcare informatization, intelligentization, networking, and automation supported by health information technology, telemedicine, smart healthcare, and big data.+
-
China is the largest tobacco consumer worldwide but also the largest tobacco use victim. The Global Burden of Disease (GBD) 2019 study reported that between 1990 and 2019, the number of deaths caused by smoking in China increased from 1.5 million to 2.4 million, an increase of 57.9%[2].
Smoking and second-hand smoke exposure is one of the major preventable risk factors for death among Chinese adults, with a relative risk of death (RR) of 1.23 for smoking and a population-attributable risk of death of 7.9% in the Chinese population[3].
The China Adult Tobacco Survey showed that in 2018, the smoking rate of people aged ≥ 15 years in China was 26.6%, down from 2010 and 2015, among which the smoking rate of men was 50.5% and that of women was 2.1%[4].
In 2021, data from the Global Youth Tobacco Survey, China indicated that 16.7% of secondary school students attempted smoking and 4.7% smoked. Vocational high school students had the highest rate of attempted smoking (28.9%), followed by senior high school students (18.9%) and junior high school students (12.9%)[5].
In 2018, the proportion of second-hand smoke exposure among non-current smokers aged ≥ 15 years in China was 68.1%, and the proportion of those who witnessed indoor smoking was 71.9%[6]. At present, the proportion of e-cigarette users is 0.9%[7].
Data from the China Health Literacy Survey, which surveyed 84,839 participants in 31 provinces, autonomous regions, and municipalities across China, showed that in 2018, the tobacco dependency rate of people aged 20–69 years in China was 13.1% and the prevalence of tobacco dependency among current smokers was 49.7%. Approximately, 183.5 million smokers were tobacco-dependent, of whom 177.5 million were men[8].
A prospective cohort study of chronic diseases in China (CKB) recruited 461,047 adults aged 30–79 years. After a median follow-up of 11.2 years, the results indicated that among those without cardiovascular and metabolic disease at baseline, smokers had a 23% and 14% increased risk of first ischemic heart disease and ischemic stroke, respectively, and a 40% increased risk of death, compared with people who had never smoked[9].
In 2018, the smoking cessation rate among people aged ≥ 15 years in China was 20.1%. Among those who quit smoking in the previous 12 months, the main reason for more than half of them quitting was related to their health, and the top three reasons for quitting were fear of their future health (38.7%), illness (26.6%), and family objection to smoking (14.9%)[10], as shown in Figure 1.
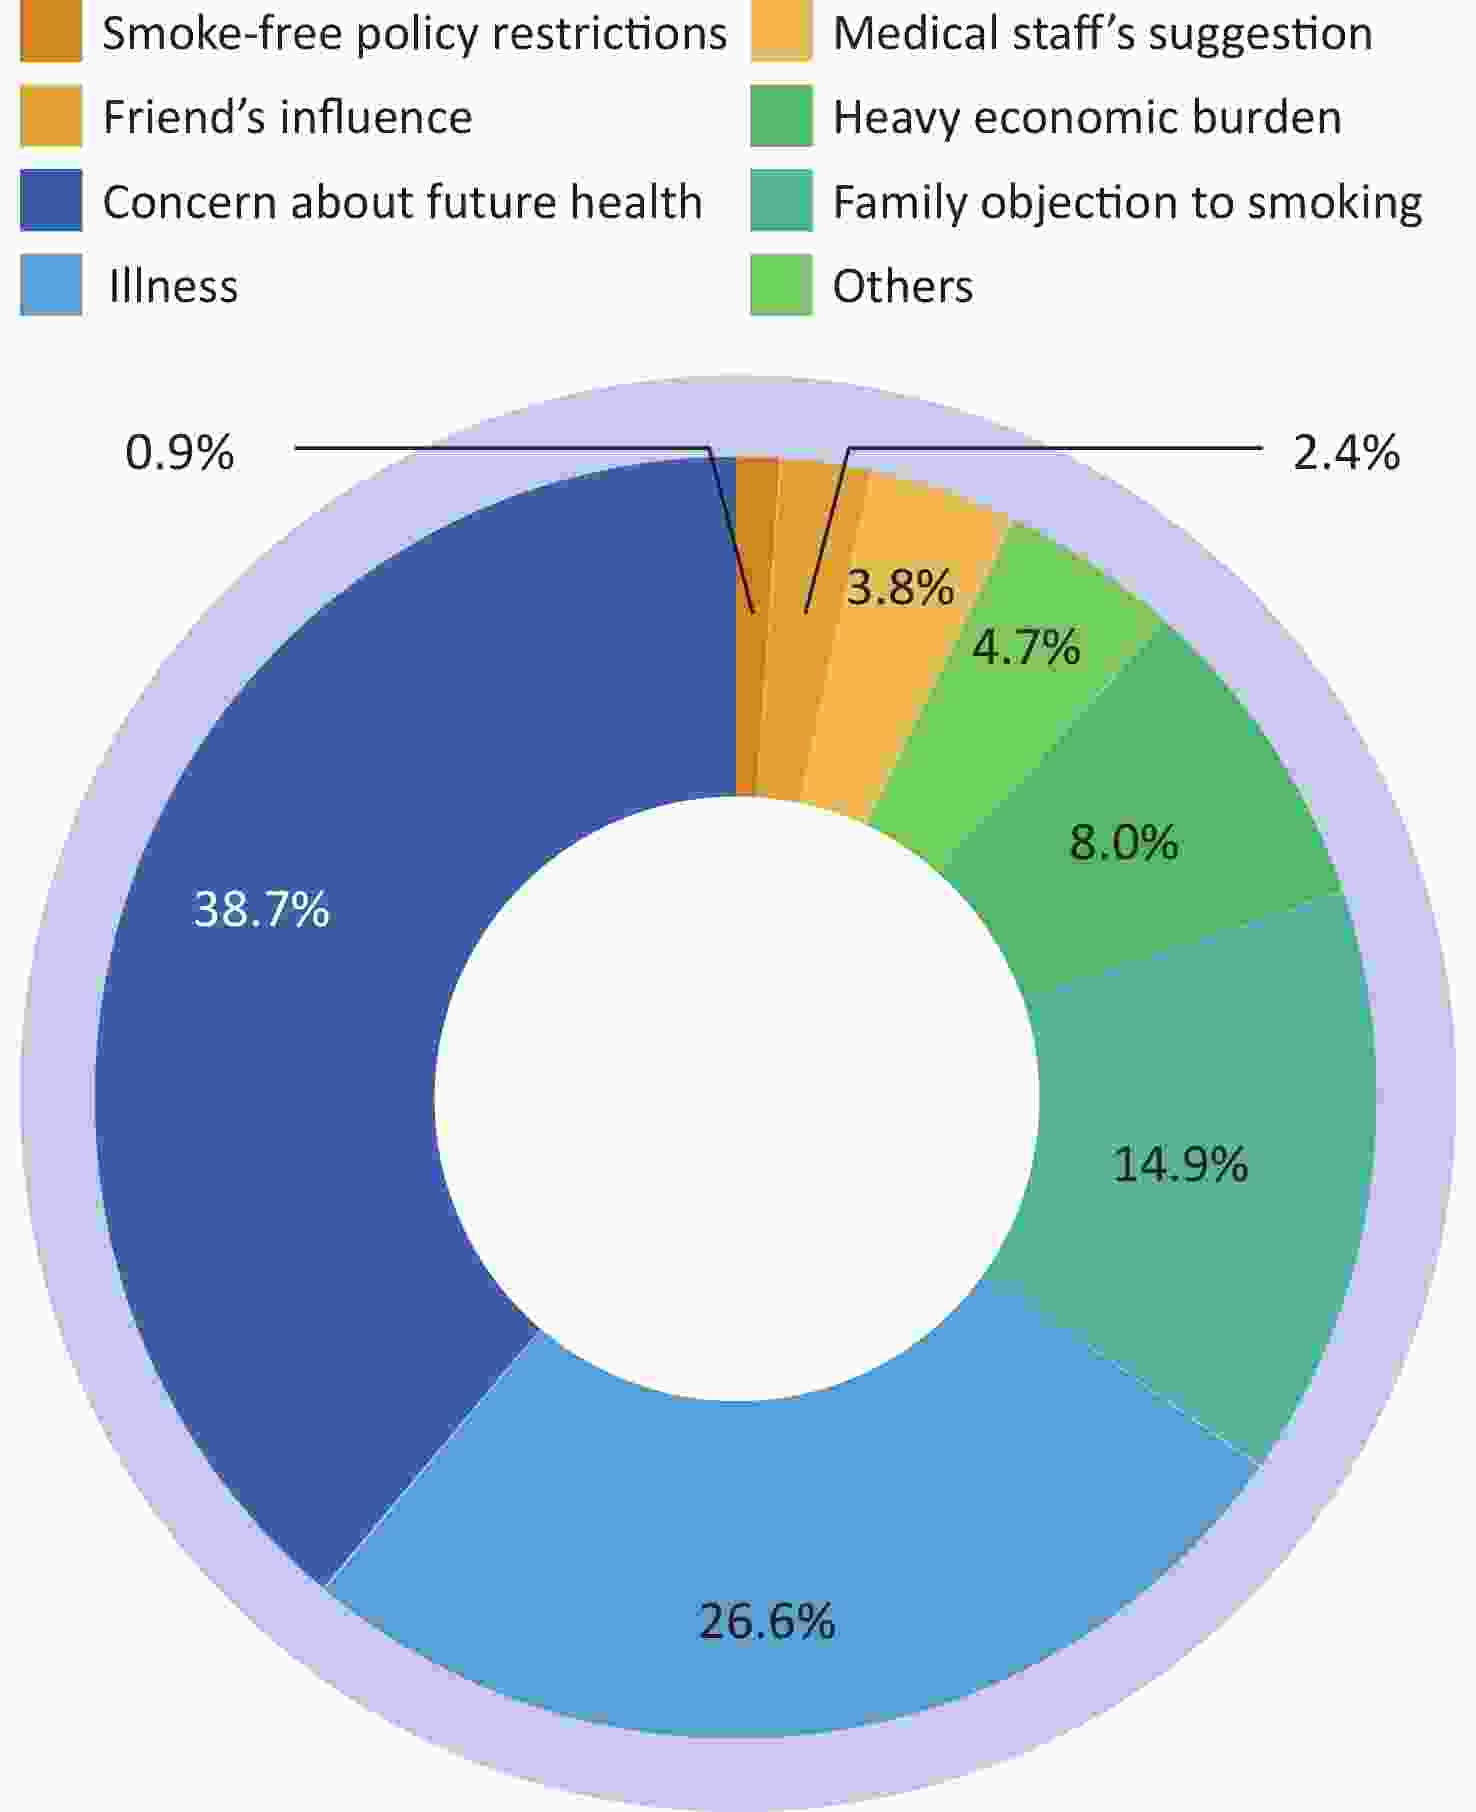
Figure 1. In 2018, the main reason for trying to quit smoking among smokers aged ≥ 15 years in China in the previous 12 months.
-
Overall, the dietary nutrition of Chinese people has improved. According to data from the China Nutrition and Health Surveillance (2015–2017), the average daily energy intake of 2,007.4 kcal is adequate for the supply of the three macronutrients, namely carbohydrates, protein, and fat[11].
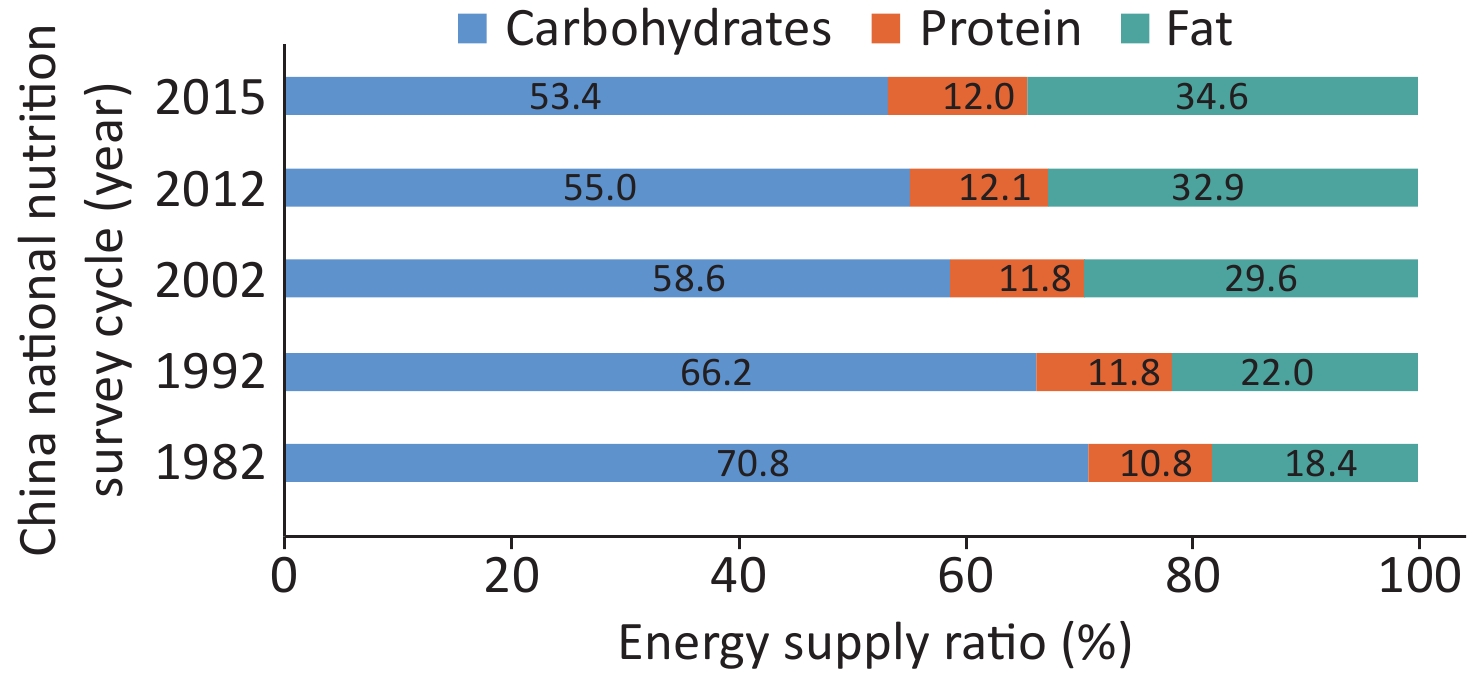
The total energy intake among Chinese residents showed a downward trend, with little change in protein intake; however, the carbohydrate-to-energy supply ratio significantly decreased. The fat-to-energy supply ratio increased and exceeded the upper limit recommended by the dietary guidelines (recommended range: 20%–30%) since 2012 (Figure 2). From 2015 to 2017, the fat-to-energy supply ratio in rural areas exceeded the upper limit recommended by 30% for the first time, reaching 33.2%[12-15].
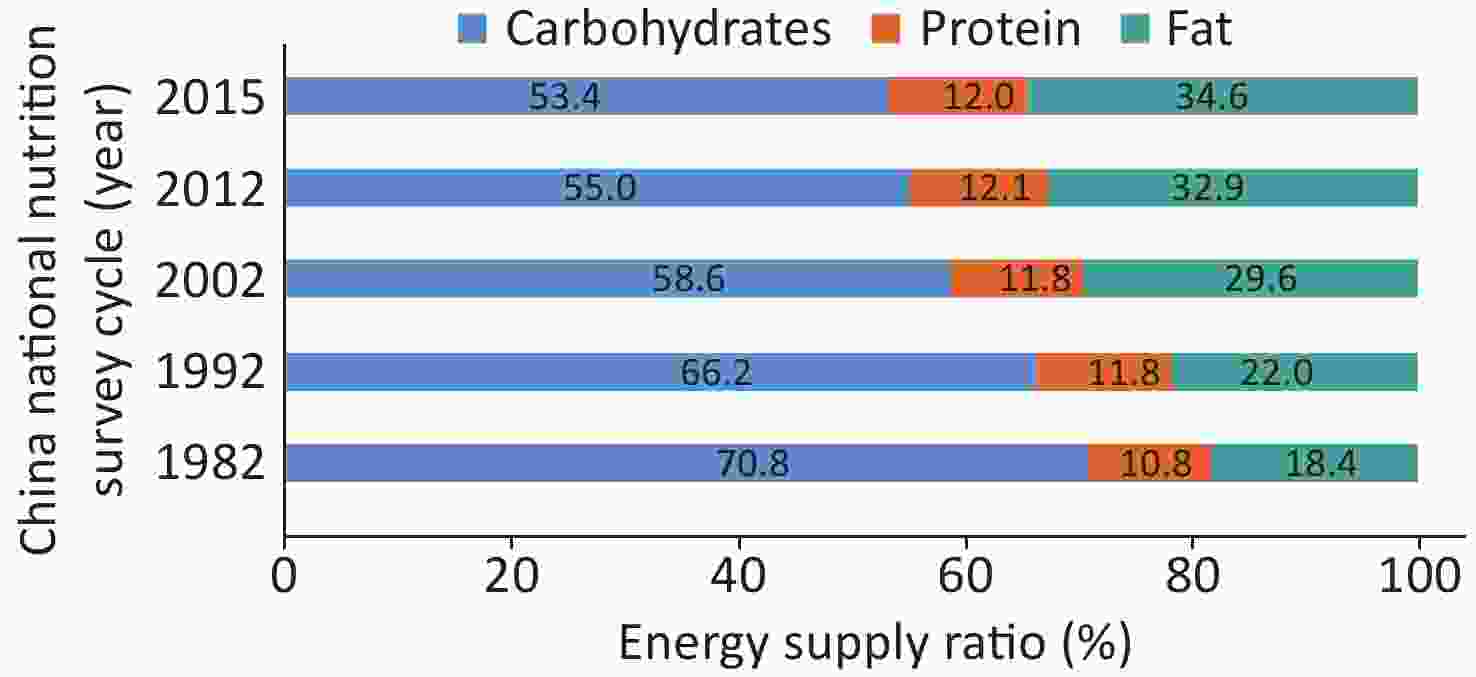
Figure 2. Trends in the energy supply ratio of carbohydrate, protein, and fat among Chinese residents from 1982 to 2015.
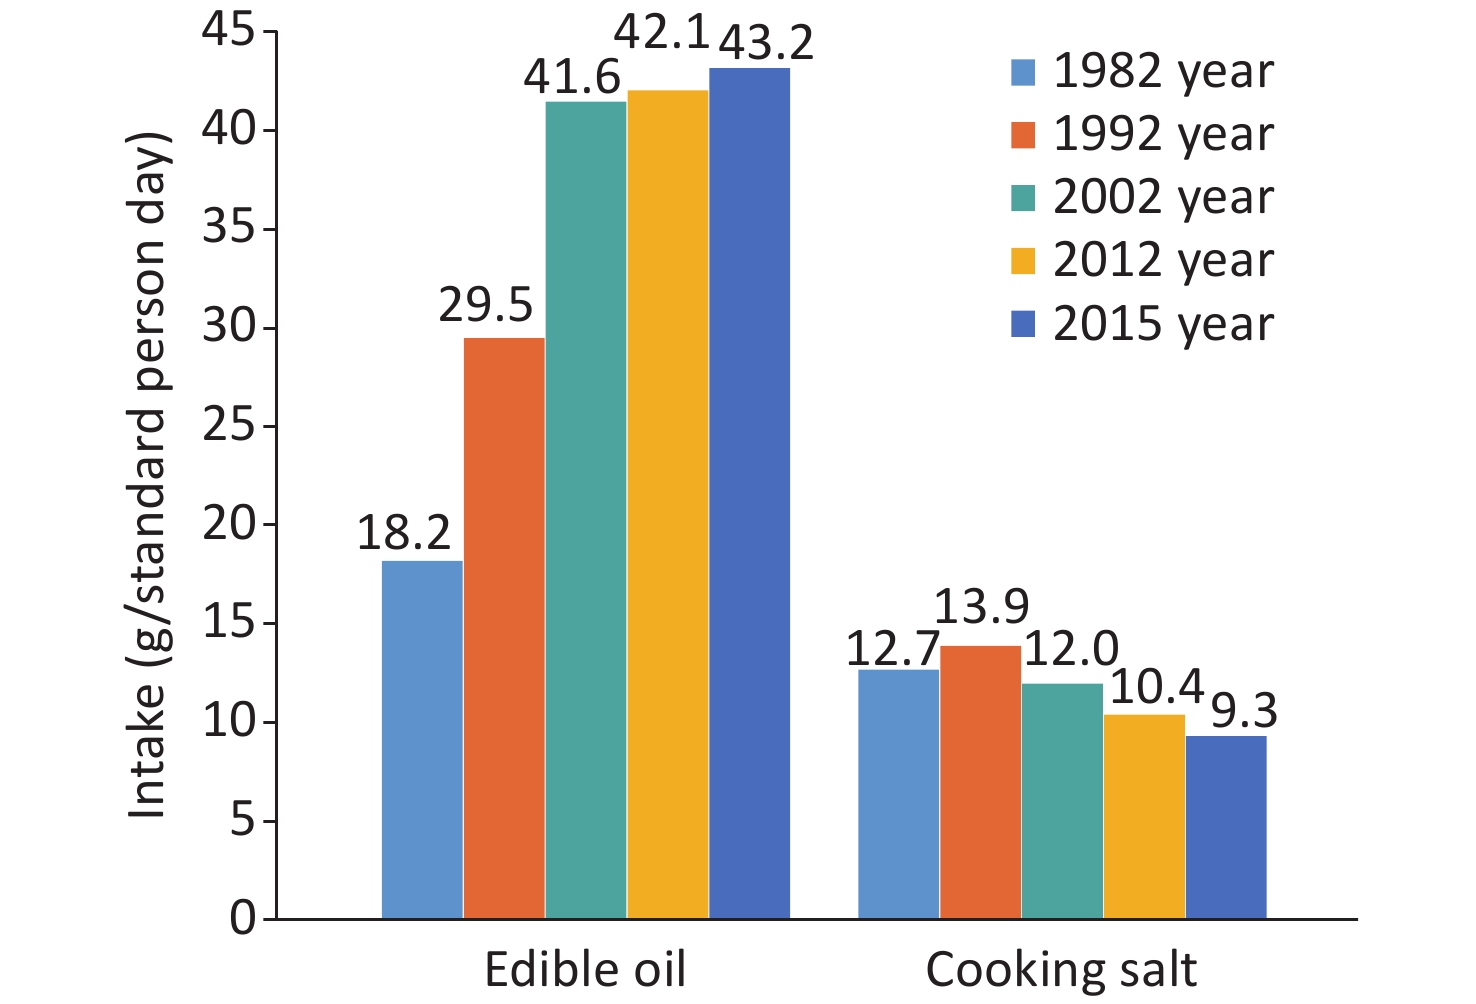
From 1982 to 2015, the main food intake by Chinese residents changed, with the intake of grains and vegetables decreasing and that of animal food increasing. The intake of fruits, eggs, aquatic products, dairy products, and soybeans remained low (Figure 3). A significant increase in edible oil but household cooking salt was decreased. However, the intake of both edible oil and cooking salt far exceeded the recommended amounts (Figure 4)[12-14].
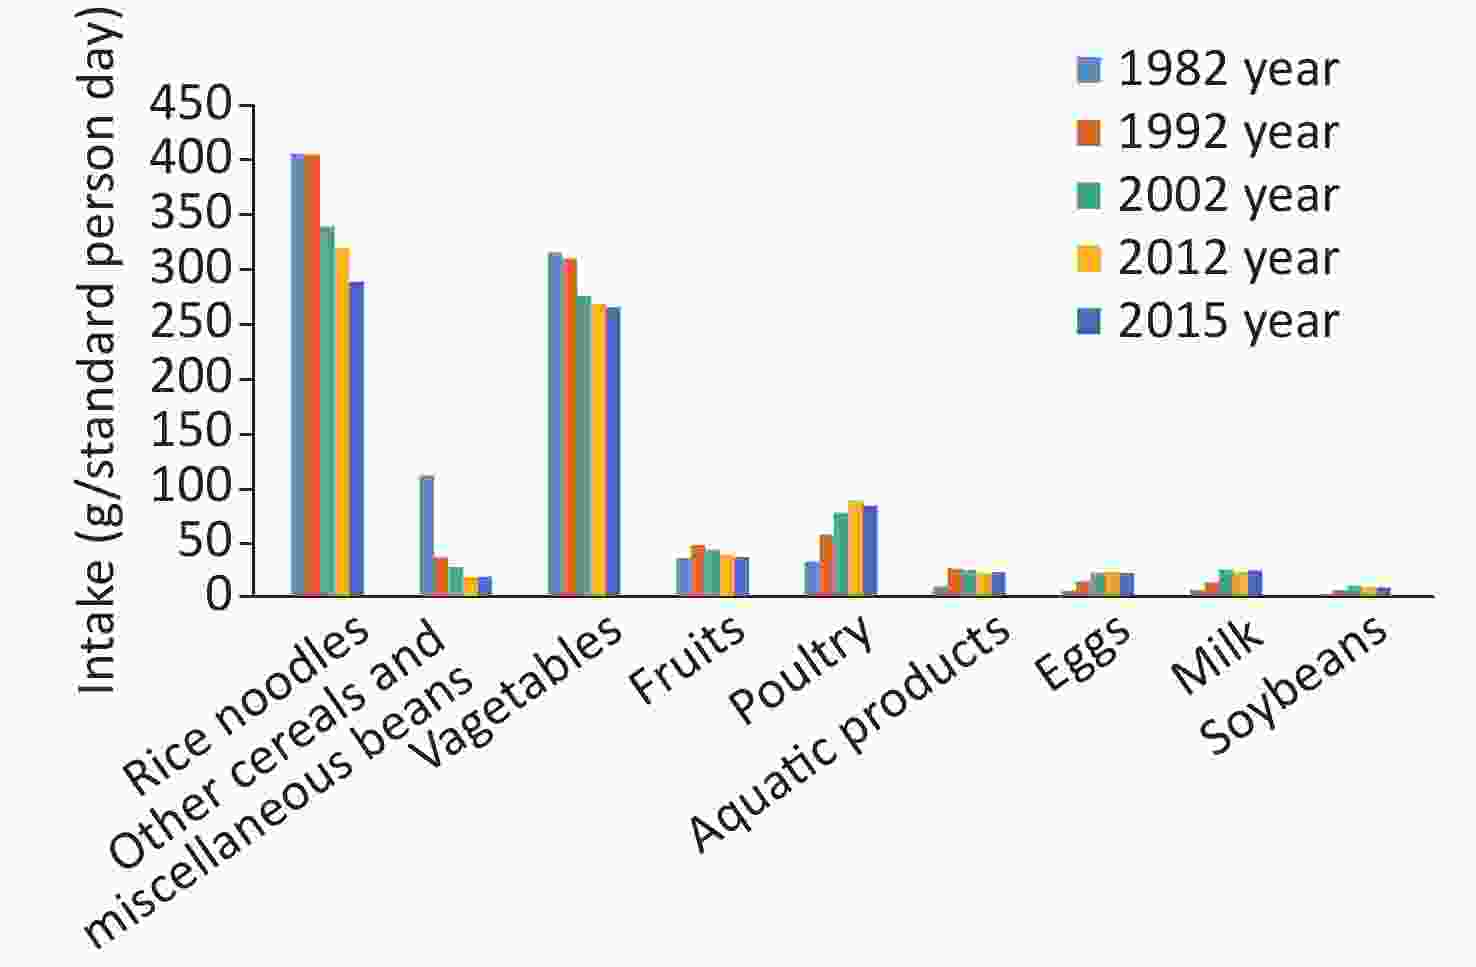
Figure 3. Trends in food intake of Chinese residents from 1982 to 2015.
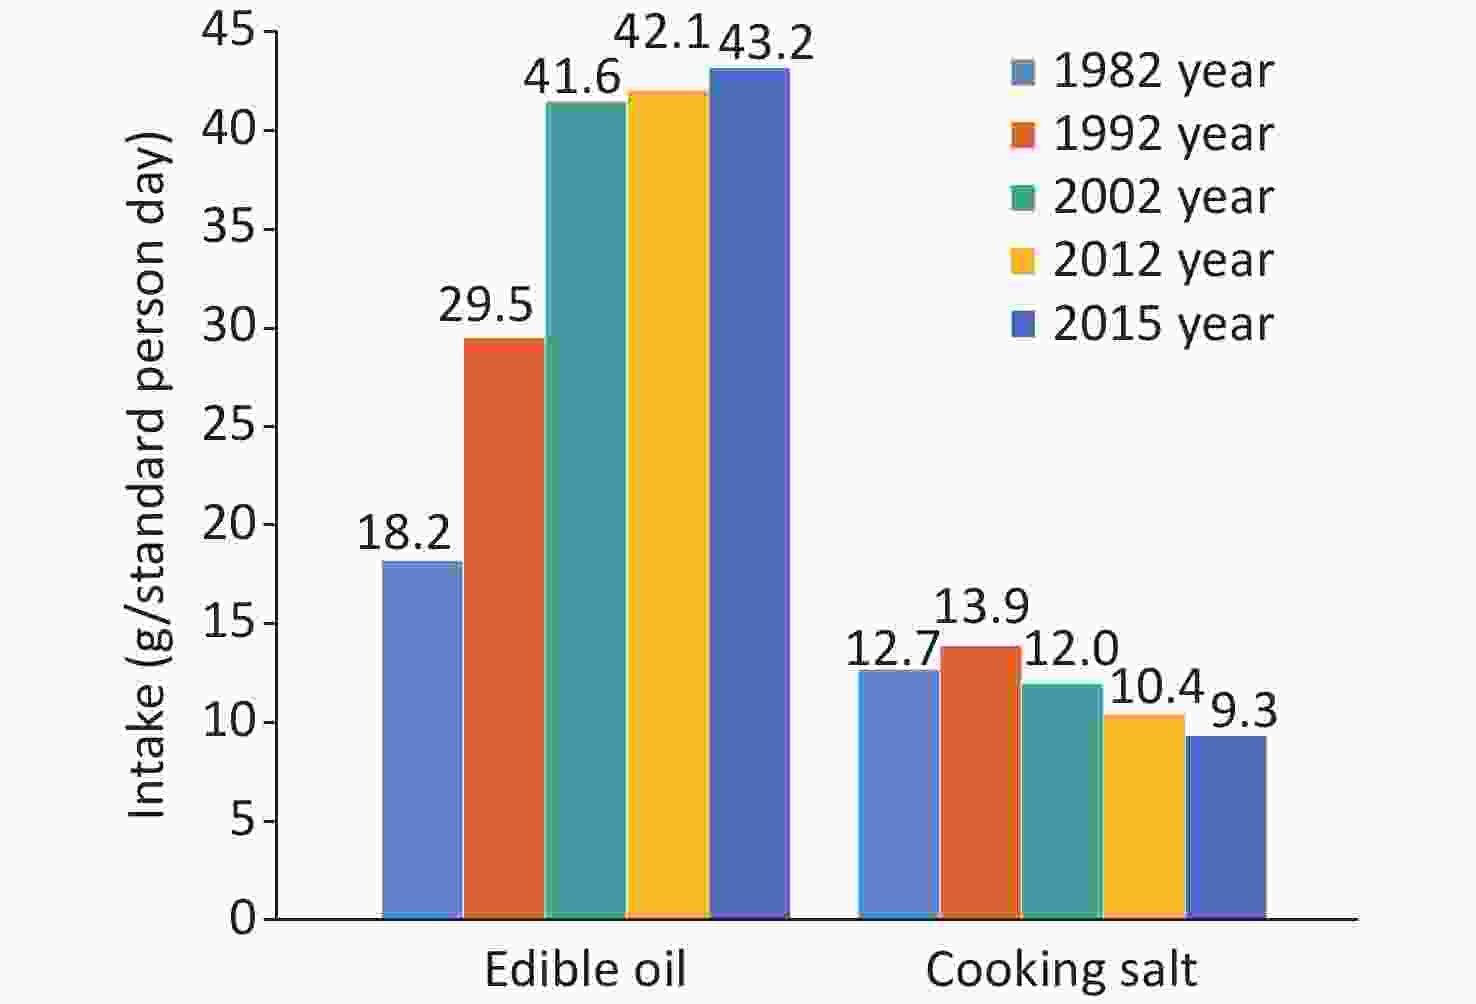
Figure 4. Changes of edible oil and cooking salt intake of Chinese residents from 1982 to 2015.
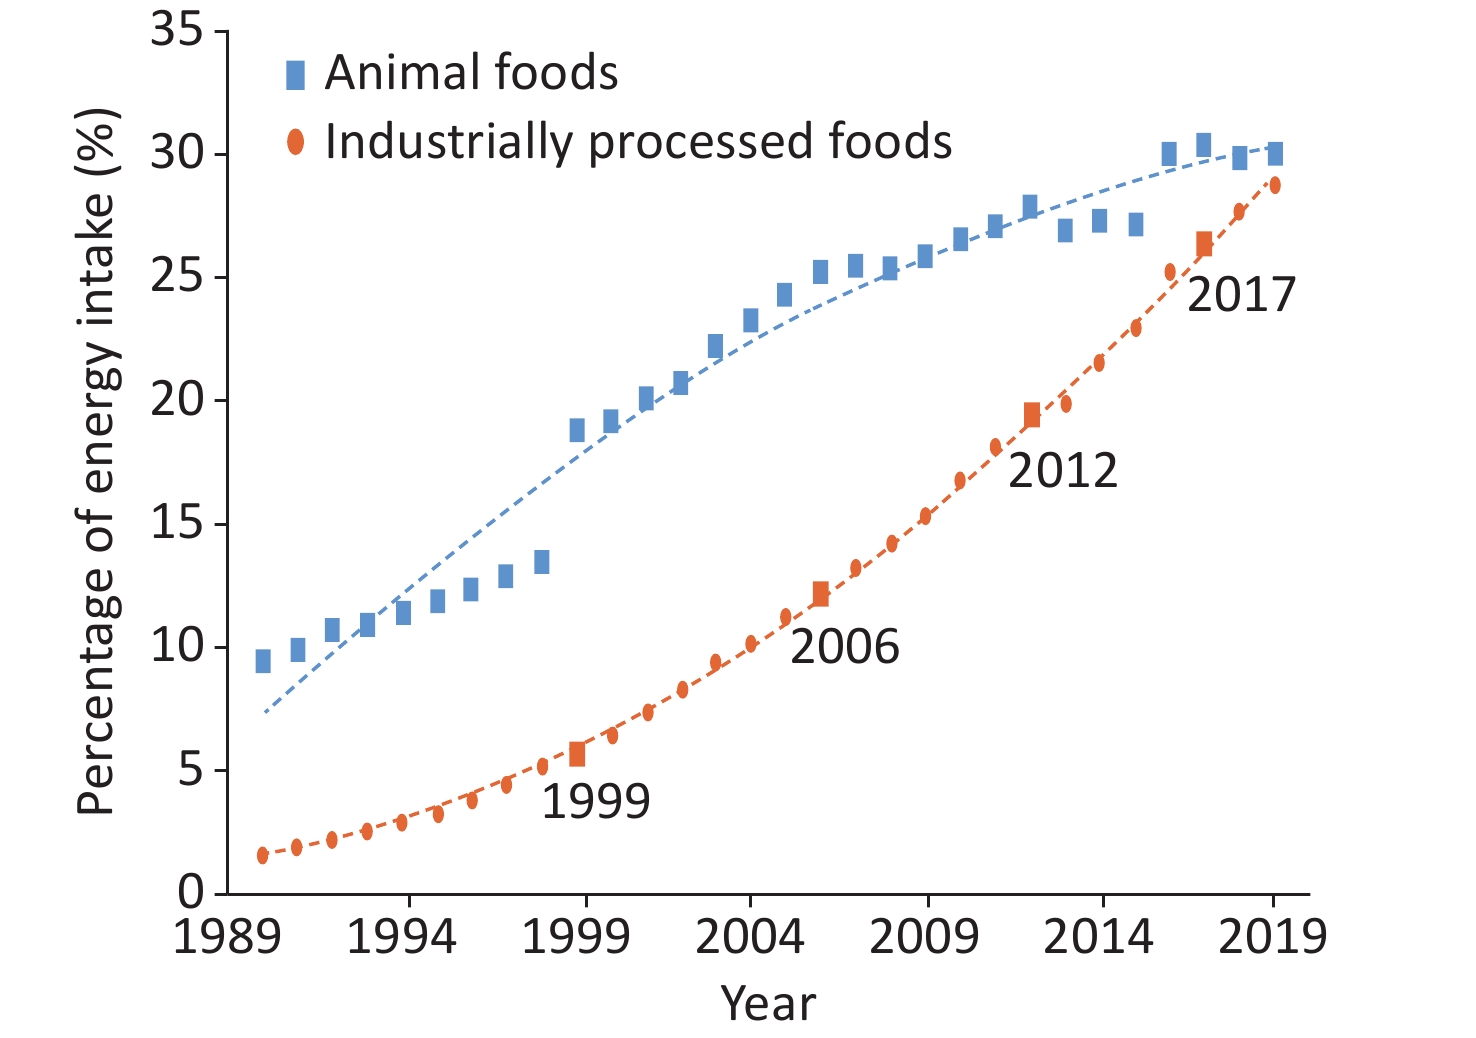
From 1990 to 2019, the proportion of energy intake from industrially processed foods in China increased from 1.5% to 28.7%, and that from animal foods increased from 9.5% in 1990 to 30.0% in 2019 (Figure 5)[15].
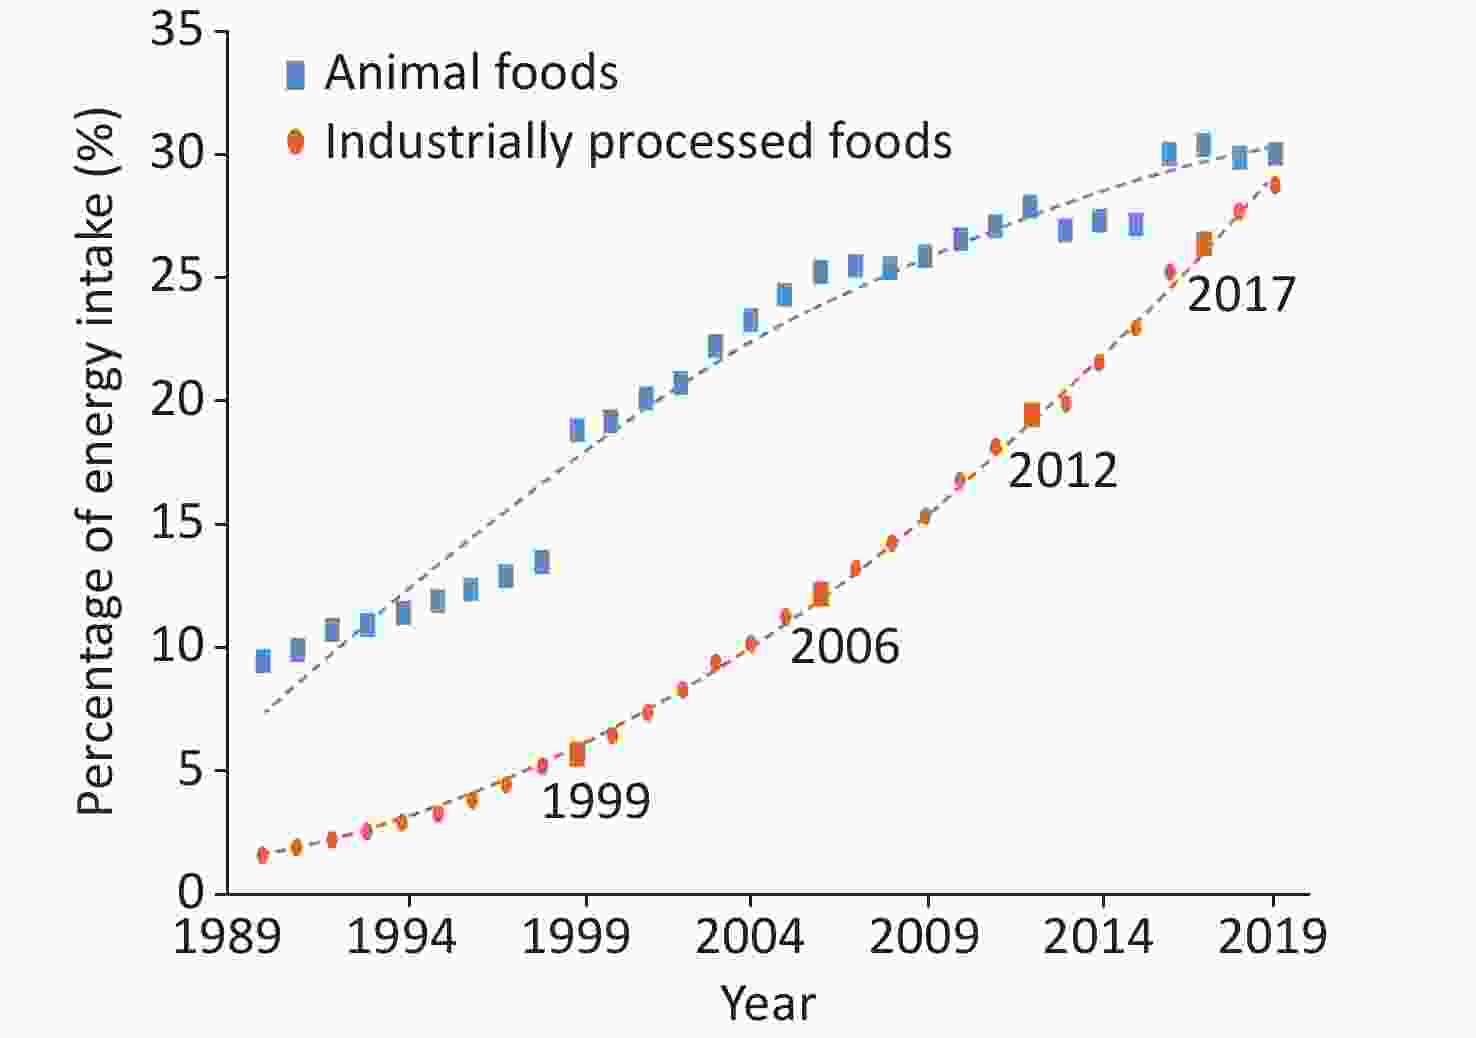
Figure 5. Trends in the proportion of energy intake of animal foods and industrially processed foods in China from 1990 to 2019.
In 2016–2017, 18.9% of Chinese children and adolescents aged 6–17 years regularly consumed sugar-sweetened beverages (at least once a day or ≥ 5 times a week, although not daily)[14].
In 2018, the average annual alcohol intake of Chinese residents aged ≥ 18 years increased by 0.4 L per person compared to that in 2012. The regular alcohol consumption rate (among those who had consumed alcohol in the previous 1 year, drinking ≥ 5 days per week) was 19.9%, and the excessive alcohol consumption rate (average daily pure alcohol intake ≥ 61 g for men and ≥ 41 g for women) was 8.6%, a decrease of 0.7% compared with that in 2012[14].
The Chinese Healthy Diet study, a multicenter, single-blind, and randomized intervention trial, found that a 28-d consumption of a Chinese heart-healthy diet (including Shandong, Huaiyang, Guangdong, and Sichuan cuisines, with a 5%–8% reduction in fat, 3.5%–5.5% increase in protein, 0%–5% increase in carbohydrate, reduction in sodium intake from nearly 6,000 mg/d to 3,000 mg/d, increase in dietary fiber from 11 g/d to 30 g/d, and increase in potassium from < 1,700 mg/d to 3,700 mg/d), reduced systolic and diastolic blood pressure by 10.0 mmHg (1 mmHg = 0.133 kPa) and 3.8 mmHg, respectively. The incremental cost-benefit ratio of 1 mmHg reduction in systolic blood pressure was 0.4 yuan per day, which suggested an economic and effective influence of this dietary strategy on blood pressure reduction[16].
The Study of the Relationship between Low Sodium Salt and Stroke showed that the risk of stroke was reduced by 14% through replacing common salt with the salt substitute and that the salt substitute group gained an average of 0.054 additional quality-adjusted life years (QALY) per person at a savings of approximately 110 yuan. The salt substitute group dominated in preventing strokes and obtaining QALY, with better health outcomes at a lower cost[17].
-
Physical Activity and Fitness in China—The Youth Study was conducted on Chinese schoolchildren and adolescents, which recruited 120,000 to 130,000 students from primary and secondary schools across all administrative provinces in mainland China. The attainment rates of physical activity in 2017 were 38.5% and 35.3% for primary school students in grades 4–6 and middle school students, respectively; these rates were higher than those in 2016 (33.5% and 32.5%, respectively), and did not change significantly for senior high school students (24.4% vs. 24.2%)[18-19].
In 2017, only 5.12% of primary and secondary school students met the 24-h exercise guidelines, which stipulate moderate to vigorous physical activity ≥ 60 min/d, spare time screen viewing ≤ 2 h/d, and adequate sleep time (6–13 years of age: 9–11 h; 14–17 years of age: 8–10 h)[20]. In 2016, the prevalence of ≥ 2 h screen time among primary and secondary school students was 8.7%, 11.5%, and 9.0% for television, mobile phones, and computers, respectively, whereas these values increased to 23.7%, 27.7%, and 17.5%, respectively, on weekends.
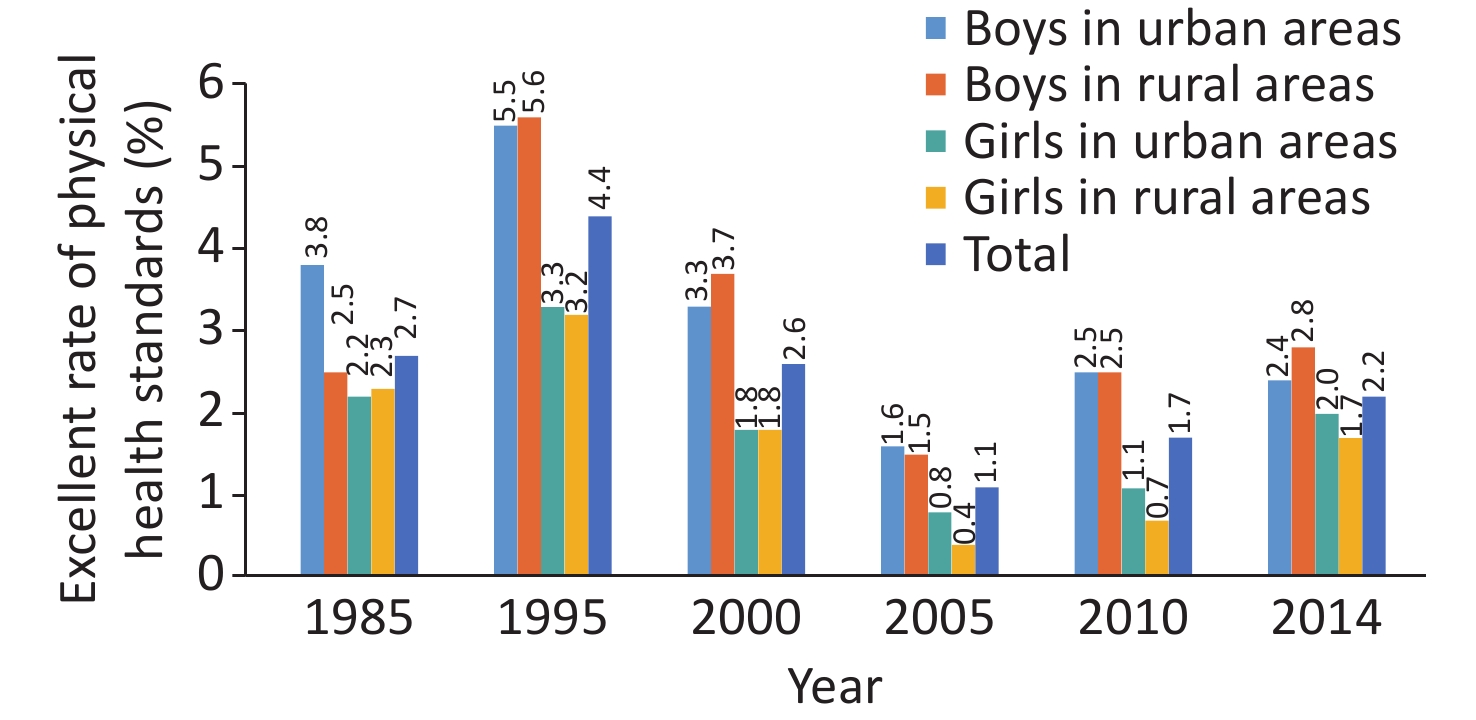
From 1985 to 2014, the China National Survey of Students’ Physical Constitution and Health conducted six surveys on 738,523 Han Chinese students aged 13–18 years, and the results showed a downward trend in the excellent rate of achieving the physical constitution and health standards among secondary school students, with statistically significant differences between years (P < 0.001, Figure 6)[21]. The analysis of 4,341 children and adolescents aged 6–17 years by the China Health and Nutrition Survey (CHNS) showed that from 2004 to 2015, the rate of physical inactivity among Chinese children and adolescents increased by 5.5%, the physical activity decreased by 5.8 metabolic equivalent (MET)·h/week, and the average time spent in sedentary behavior increased by 1.8 h/week[22].

Figure 6. Excellent rate of physical health standards among Chinese Han middle school students from 1985 to 2014.
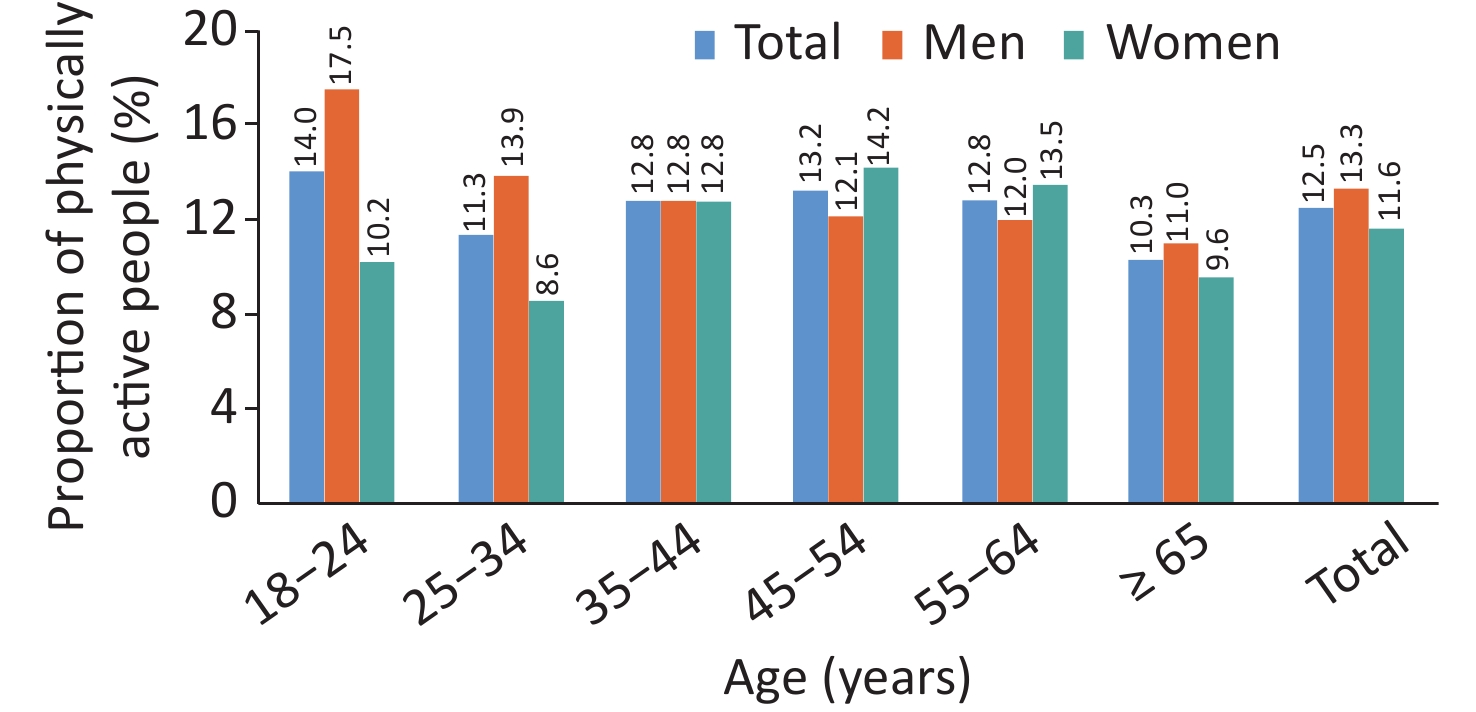
According to the China Chronic Disease and Nutrition Surveillance (CCDNS) data from a cross-sectional survey of 298 counties (districts) in 31 provinces, autonomous regions, and municipalities, 12.5% of Chinese adults aged ≥ 18 years regularly practiced physical activity (no less than three times a week, moderate to vigorous physical activity for at least 30 min each time) in 2015, which was higher than that in 2010 (11.9%) but still at a low level. People aged 25–34 years had the lowest rates of regular physical activity; those aged ≥ 65 years were the exception (Figure 7)[23].
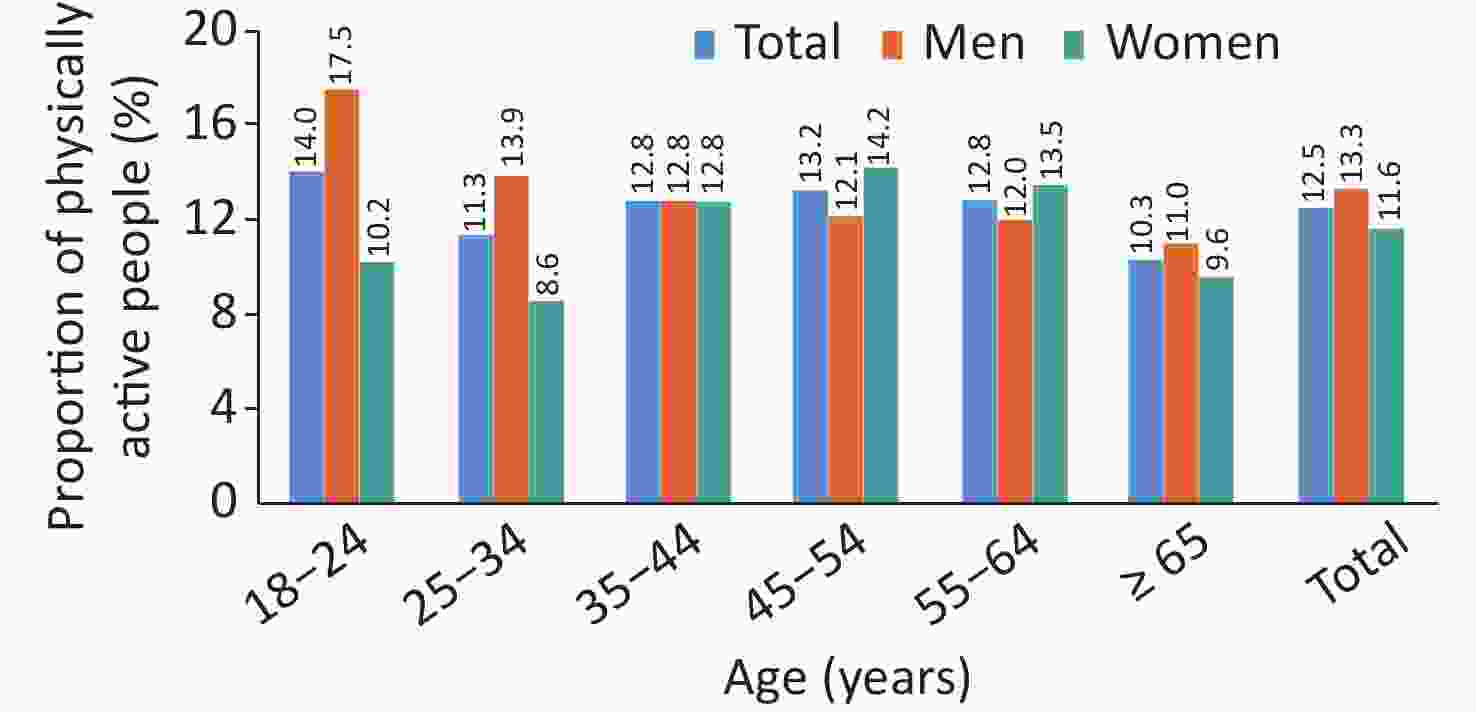
Figure 7. Proportion of physically active adults aged 18 years and older in China.
According to CHNS, the total physical activity among Chinese adults decreased from 399 MET·h/7 d in 1991 to 213 MET·h/7 d in 2009[24]. The occupational physical activity decreased by 31% in men from 1991 to 2011, with a similar trend in women[25].
Data from the CCDNS indicated that the average spare time spent in sedentary behavior among adults aged ≥ 18 years in 2018 was 3.2 h/d, which was similar to that in 2013 (3.3 h/d) and significantly higher than that in 2010 (2.7 h/d)[26-27].
According to the 2016 World Health Organization (WHO) data on physical activity from 168 countries from 2001 to 2016, among people aged 40–74 years, reaching the recommended physical activity goals could prevent 18.3% of premature deaths in China, which would be equivalent to avoiding 1.0165 million premature deaths in this age group every year[28].
In the CKB cohort study, more than 487,000 adults with no prior CVD history at baseline were followed up for an average of 7.5 years. A significant negative correlation was observed between total physical activity and cardiovascular death. Compared with the lowest activity group (≤ 9.1 MET·h/d), the risk of cardiovascular death in the highest quintile (≥ 33.8 MET·h/d) decreased by 41%. For every 4 MET·h/d increase in physical activity, the risk decreased by 12%. Thus, increasing occupational or non-occupational activities can decrease the risk of cardiovascular death[29].
The CKB data also showed that every 1 standard deviation increase in physical activity (14 MET·h/d) was associated with a 0.15 kg/m2 decrease in body mass index (BMI), 0.58 cm decrease in waist circumference, and 0.48% decrease in body fat. An increase of 1 standard deviation (1.5 h/d) in spare time spent in sedentary behavior was associated with an increase of 0.19 kg/m2 in BMI, 0.57 cm in waist circumference, and 0.44% in body fat. In addition, there is a synergistic effect of physical activity and sedentary behavior on obesity (BMI ≥ 28 kg/m2)[30].
Comprehensive analysis of data from the China Chronic Disease and Risk Factors Monitoring (CCDRFS) (2007) and the China Health Service Survey (2003) has indicated that the proportions of Chinese residents with CHD (12.3%), stroke (15.7%), hypertension (8.5%), cancer (11.3%), or type 2 diabetes mellitus (13.5%) are directly attributable to insufficient physical activity (below WHO recommendations) in 2007. Simultaneously, being overweight or obese caused by a lack of physical activity further increases the risk.
The lack of physical activity resulted in an economic burden of USD 6.7 billion in 2007, accounting for 15.2% of the total economic expenditure for major chronic diseases in that year. The direct medical economic burden accounted for 15.7% of the total direct economic burden due to major non-communicable diseases in China[31].
-
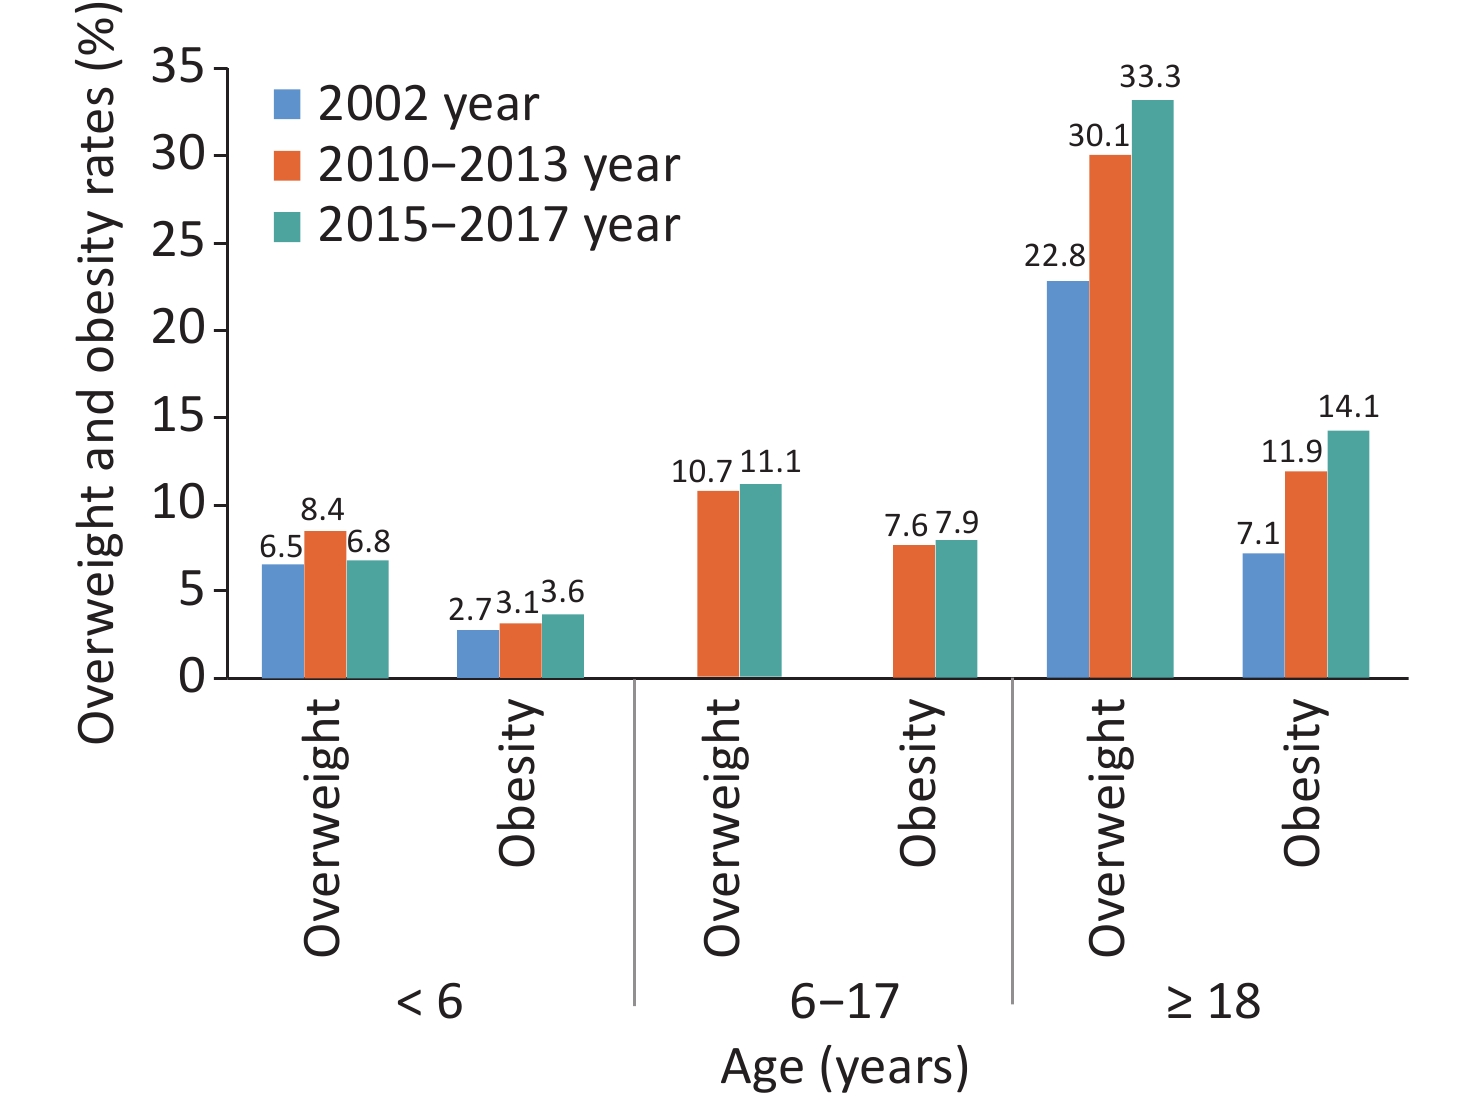
From the three nationally representative data analyses from 2002 to 2017, the prevalence of overweight and obesity among Chinese residents are generally on the rise (Figure 8). According to the China Nutrition and Health Surveillance Report from 2015 to 2017, the prevalence of overweight and obesity was 6.8% and 3.6% among Chinese children younger than 6 years; 11.1% and 7.9% among those aged 6–17 years; and 33.3% and 14.1% among adults aged ≥ 18 years, respectively, in 2017[32].

Figure 8. Changes in the prevalence of overweight and obesity in China from 2002 to 2017.
By 2030, the proportions of overweight and obesity in Chinese adults (Chinese standard), children and adolescents aged 7–17 years (Chinese standard), and children aged ≤ 6 years (WHO diagnostic standards) have been predicted to reach 65.3%, 31.8%, and 15.6%, respectively. The number of overweight and obese people may reach 789.95 million, 58.92 million, and 18.19 million, respectively[33].
Little attention is paid to obesity. In 2018, the weight measurement rate of Chinese residents aged ≥ 18 years in the previous month was 59.2%[34].
According to the GBD study, the number of CVD deaths due to high BMI in China was 549,500 in 2019. The age-standardized CVD mortality rate due to high BMI was 38.64 per 100,000, and 11.98% of CVD deaths were due to high BMI[35].
Results from the Guangzhou Biobank Cohort Study of 19,405 Chinese individuals aged ≥ 50 years, recruited between 2003 and 2008, and followed up for an average of 11.5 years, showed that after adjusting for potential confounding factors, in the population with a BMI ≥ 22.5 kg/m2, each increase of 5 kg/m2 in BMI was associated with a 37% increase in CVD mortality rate[36].
In the Shanghai Women’s and Men’s Health Study, which analyzed data from 48,377 women and 35,989 men aged 40–59 years, weight gain of 5 kg from adulthood to middle age in the middle-aged population with a BMI ≥ 23 kg/m2 was associated with a more than 20% increase in future CVD mortality risk (HR = 1.26 for men, HR = 1.23 for women)[37].
A childhood obesity prevention program randomly assigned 1,641 children from 40 schools to a comprehensive intervention group (diet and physical activity) and a control group. The 12-month health economic evaluation results showed that the intervention cost was 35.53 yuan per child in the public sector and 536.95 yuan in the social sector. Compared to the control group, the incremental cost-effectiveness ratio for gaining one additional QALY was 8,888 yuan in the public sector and 73,831 yuan in the social sector, both of which demonstrated good value for money[38].
-
A meta-analysis of 23 studies has indicated that the prevalence of depression among Chinese inpatients with CHD was 51%, and 0.50%–25.44% had major depression[39]. The Guidelines for Primary Diagnosis and Treatment of Depression (2021) point out that approximately 15%–30% of patients with acute CHD and 20% of patients with CHD and chronic heart failure (HF) have comorbid depression[40].
A follow-up study of 190 patients with newly diagnosed CHD over 36 months found that the incidences of anxiety and depression increased steadily over time, with the anxiety rate increasing from 42.6% at baseline to 51.1% and the depression rate increasing from 33.3% to 43.7%[41].
The INTERHEART study indicated a 21.66% prevalence of depression in China in patients with acute myocardial infarction (AMI), a proportion significantly higher than that of the control group, at 10.36%; both values were lower than those in 51 other countries and regions. However, depression was associated with a higher risk of AMI in China than in other countries (China: OR = 2.27; other countries: OR = 1.37)[42].
A meta-analysis of 41 clinical studies in hypertensive patients showed a total prevalence of depression of 26.8%, with China having a higher prevalence (28.5%) than other countries (22.1%)[43].
The China Health and Retirement Longitudinal Study (CHARLS) evaluated depression in 6,810 non-CVD individuals and found that persistent depression was significantly associated with an increased risk of CVD (RR = 1.77) and death (RR = 1.63) compared to no depression[44].
According to data from the CKB study, the overall prevalence of major depression was 0.61% among 486,541 adults aged 30–79 years. After a median follow-up of 7.2 years, compared to the general population, patients with major depression had a 32% increased risk of ischemic heart disease (HR = 1.32, 95% CI: 1.15–1.53). The risk was significantly higher in urban residents (HR = 1.72, 95% CI: 1.39–2.14)[45].
-
According to the nationwide sampling surveys of hypertension conducted in 1958–1959, 1979–1980, 1991, and 2002, the crude prevalence of hypertension among people aged ≥ 15 years were 5.1%, 7.7%, 13.6%, and 17.6%, respectively, showing an increasing trend (Table 1).
Table 1. Survey results on the prevalence of hypertension in China from 1958 to 2018
Study name Year Age (years) Sampling method Sample size (people) Prevalence (%) Key project of Chinese Academy of Medical Sciences: Hypertension Research 1958–1959 ≥ 15 Non-random sampling 739,204 5.1 National Hypertension Sampling Survey 1979–1980 ≥ 15 Random sampling 4,012,128 7.7 National Hypertension Sampling Survey 1991 ≥ 15 Stratified random sampling 950,356 13.6 China Health and Nutrition Survey 2002 ≥ 18 Multi-stage stratified cluster random sampling 272,023 18.8 Chinese Residents Nutrition and Chronic Diseases Survey 2012 ≥ 18 Multi-stage stratified random sampling − 25.2 China Hypertension Survey 2012–2015 ≥ 18 Multi-stage stratified random sampling 451,755 27.9 (weighted rate 23.2) China Health and Nutrition Survey 2015 20–79 Multi-stage stratified cluster random sampling 8,907 34.1 (standardized rate 25.6) China Chronic Disease and Risk Factor Surveillance 2018 ≥ 18 Multi-stage stratified cluster random sampling 179,873 27.5 (weighted rate) Note. −, No specific data are available. The China Hypertension Survey (CHS) indicated a 27.9% crude prevalence of hypertension in Chinese adults aged ≥ 18 years from 2012 to 2015 and a weighted rate of 23.2%. The number of adults with hypertension in China is estimated at 245 million. The crude detection rate of high normal blood pressure was 39.1%, and the weighted rate was 41.3%. A total of 435 million people in China are estimated to have high normal blood pressure[46].
In 2018, the CCDRFS project investigated 298 counties in 31 provinces, autonomous regions, and municipalities in mainland of China and recruited 179,873 adults aged ≥ 18 years using a multi-stage stratified cluster random sampling method[27]. The prevalence of hypertension was 27.5%[47].
The CHNS prospective cohort study of 12,952 Chinese adults aged > 18 years indicated that the age-specific prevalence of hypertension increased from 40.8 per 1,000 person-years in 1993–1997 to 48.6 per 1,000 person-years in 2011–2015[48].
From 1991 to 2015, the CHNS showed that the age-standardized detection rate of high normal blood pressure in adults aged ≥ 18 years increased from 30.1% to 43.1%[49].
In 2015, the hypertension awareness, treatment, and control rates among adults aged ≥ 18 years in China were 51.6%, 45.8%, and 16.8%, respectively[46], indicating significant improvements over those reported in previous surveys (Table 2).
Table 2. Awareness, treatment, and control rates of hypertension in various studies in China
Study name Year Age (years) Sampling method Sample size
(people)Awareness rate
(%)Prevalence
(%)Control rate
(%)National Hypertension Sampling Survey 1991 ≥ 15 Multi-level random sampling 950,356 27.0 12.0 3.0 China Health and Nutrition Survey 2002 ≥ 18 Multi-stage stratified cluster random sampling 272,023 30.2 24.7 6.1 Chinese Residents Nutrition and Chronic Diseases Survey 2012 ≥ 18 Multi-stage stratified random sampling − 46.5 41.1 13.8 China Nutrition and Health Surveillance 2010–2012 ≥ 18 Multi-stage stratified cluster random sampling 120,428 46.5 41.1 14.6 Investigation of the prevalence, awareness, treatment, and control rates of hypertension in the Chinese working population 2012–2013 18–60 Multi-stage cluster sampling 37,856 57.6
(standardization rate 47.8)30.5
(standardization rate 20.6)11.2
(standardization rate 8.5)China Hypertension Survey 2012–2015 ≥ 18 Multi-stage stratified random sampling 451,755 51.6
(weighted rate 46.9)45.8
(weighted rate 40.7)16.8
(weighted rate 15.3)Early screening and comprehensive intervention program for high-risk groups of cardiovascular disease in China 2014 35–75 Convenience sampling 640,539 46.5 (standardization rate) 38.1 (standardization rate) 11.1 (standardization rate) China Health and Nutrition Survey 2015 20–79 Multi-stage stratified cluster random sampling 8,907 43.8 (standardization rate 27.2) 39.2 (standardization rate 23.6) 13.8 (standardization rate 8.4) China Chronic Disease and Risk Factor Surveillance 2018 ≥ 18 Multi-stage stratified cluster random sampling 179,873 41.0 (weighted rate) 34.9 (weighted rate) 11.0 (weighted rate) Note. −, No specific data are available. A study conducted in 130 hospitals across 23 provinces, autonomous regions, and municipalities in China from 2016 to 2019 showed that for every unit increase in the sodium-to-potassium ratio, blood pressure increased by 0.46/0.24 mmHg[50]. Another study involved 20,995 high-risk individuals for CVD (72.6% with a history of stroke and 88.4% with a history of hypertension) followed up for an average of 4.74 years, with a total of 4,172 deaths. It found that compared to the regular salt group, the salt substitute group had a 14% reduction in the risk of stroke (RR = 0.86), a 13% reduction in major cardiovascular events (RR = 0.87), a 12% reduction in overall mortality risk (RR = 0.88), and a significant reduction in fatal and non-fatal acute coronary syndrome (ACS) events[51].
The Blood Pressure Intervention Strategy for Elderly Hypertension (STEP) involved 8,511 older hypertensive patients in a multicenter randomized controlled trial with a median follow-up of 3.34 years. The STEP indicated that the primary outcome event rate was significantly lower in the intensive treatment group (target systolic blood pressure of 110 to < 130 mmHg) than in the standard treatment group (target systolic blood pressure of 130 to < 150 mmHg) (3.5% vs. 4.6%, RR = 0.74, 95% CI: 0.60–0.92)[52].
The China Rural Hypertension Control Project showed that a comprehensive hypertension intervention model led by village doctors (implemented by trained village doctors under the supervision of primary care physicians) significantly improved hypertension control rates in rural China. After 18 months, 57.0% of hypertensive patients in the intervention group had a blood pressure < 130/80 mmHg, whereas only 19.9% in the control group. The mean blood pressure decreased by 26.3/14.6 mmHg from baseline in the intervention group and only 11.8/7.5 mmHg in the control group[53].
By the end of 2019, about 109 million patients with hypertension were registered nationwide, with a 29.28% increase in the rate of standardized management of such patients compared to that in 2009. The gap in the rate of standardized management of patients with hypertension among the eastern, central, and western regions has gradually narrowed. The blood pressure control rate among managed hypertensive individuals increased from 50.88% in 2009 to 67.72% in 2019[54].
A health economic evaluation study based on the Systolic Blood Pressure Intervention Trial showed that over the entire life cycle, moving from standard to intensive systolic blood pressure treatment increased the per capita QALY from 9.51 to 9.87 [+ 0.36 (95% CI: 0.13–0.71), with an incremental cost of USD 10,997 per additional QALY. The simulation results indicated that the probability of cost-effectiveness of intensive treatment was 82.8%, taking one time China’s per capita Gross Domestic Product (GDP) as the threshold of willingness to pay[55].
A microsimulation model based on the STEP trial included 10,000 Chinese adults aged 60–80 years with an assumed baseline systolic blood pressure > 140 mmHg. This study compared the lifelong health benefits and medical costs of intensive treatment with those of standard treatment. The results showed that the intensive treatment group had an average increase of 0.16 QALY compared with the standard treatment group, with an incremental cost of 12,614 yuan per additional QALY. Probabilistic sensitivity analysis suggested that intensive treatment was cost-effective[56].
The screening strategy with three-time points on different days helps evaluate the prevalence of hypertension in the Chinese population under 18 years of age. The China Children and Adolescents Cardiovascular Health Survey (2012–2015) (CCACH)[57] and National Survey of Six Provinces and Cities (2018–2019)[58] showed that the prevalence of hypertension differed at a single time point screened according to the different standards in China and the United States. The prevalence of hypertension after three consecutive blood pressure measurements on different days was similar to the final prevalence of hypertension (CCACH: 3.7% vs. 3.3%; National Survey of Six Provinces and Cities: 8.4% vs. 5.9%).
The results of the China Health and Nutrition Survey (CHNS) conducted from 1991 to 2015 showed that the prevalence of hypertension among school-age children in monitored areas increased from 8.5% to 19.2%. Isolated diastolic hypertension accounted for over two-thirds of cases, with its prevalence increasing from 6.2% to 14%[59].
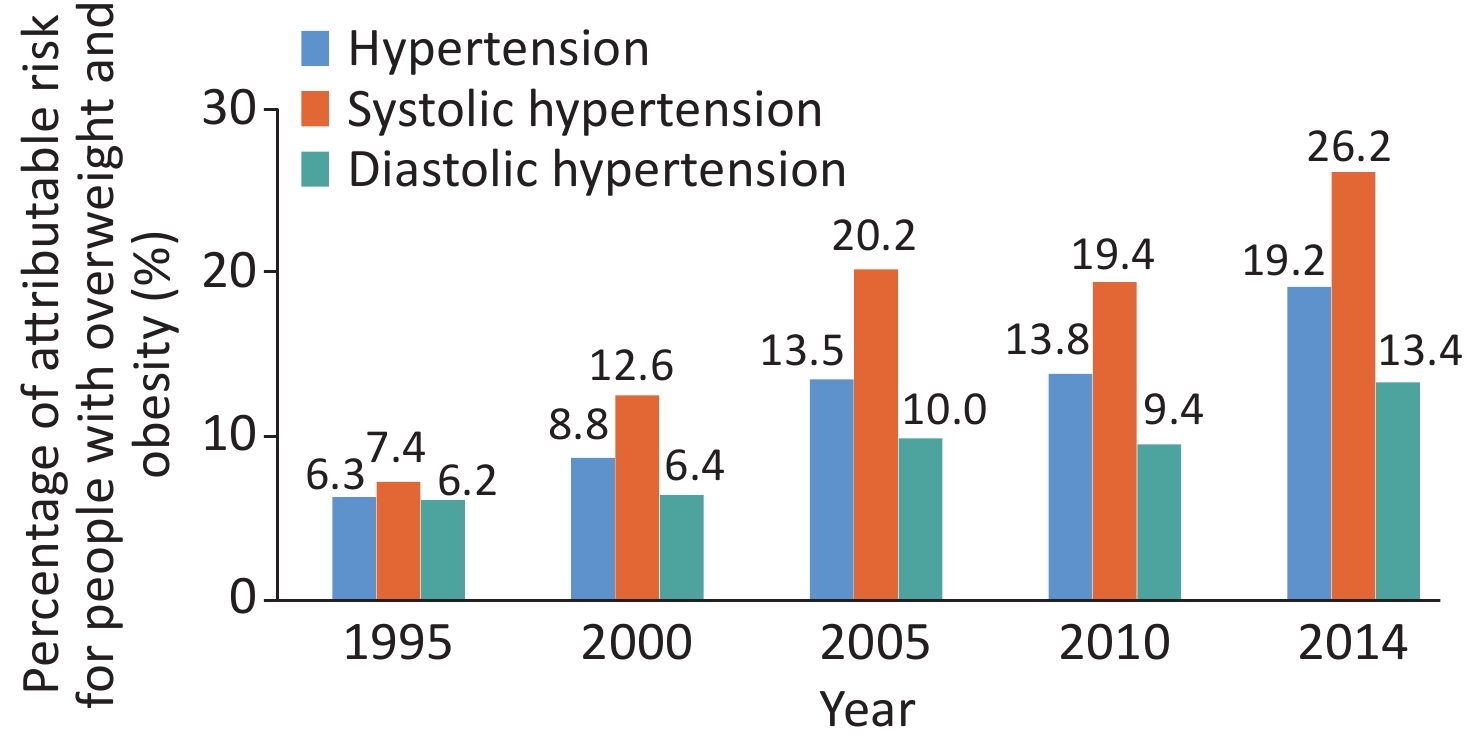
Obesity is the most important risk factor for childhood hypertension, and children with obesity are a high-risk group that requires focused prevention and control. Data analysis from the National Student Physical Fitness and Health Survey conducted between 1995 and 2014, which included 943,128 children and adolescents aged 7 to 17 years, showed that the independent contribution (population attributable risk percentage, PAR%) of overweight and obesity to the risk of hypertension increased from 6.3% to 19.2%. The PAR% increase for systolic hypertension was twice that for diastolic hypertension during the same period[60] (Figure 9).
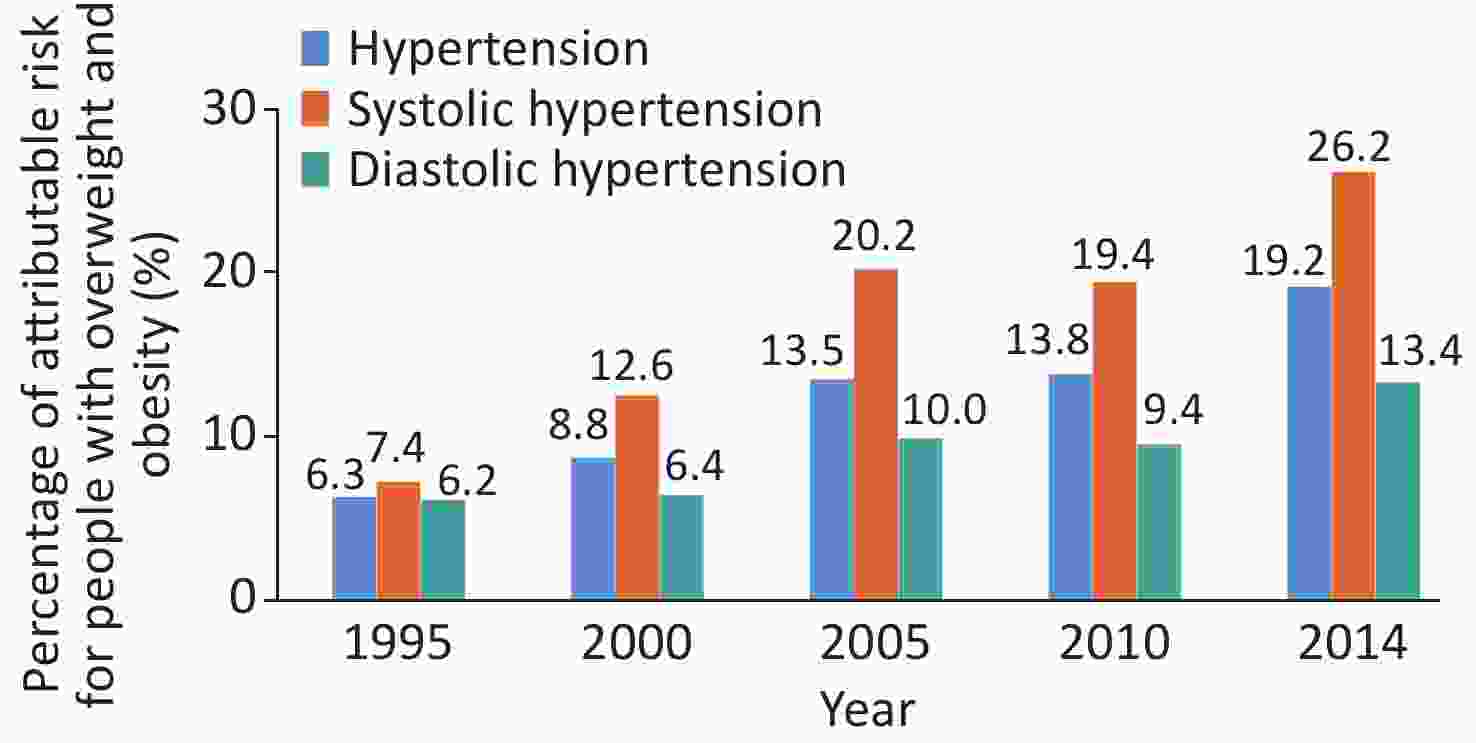
Figure 9. Nationwide percentage trend of attributable risk of hypertension in overweight and obese children from 1995 to 2014.
-
The results from 179,728 adults aged ≥ 18 years in the Chinese Adults Nutrition and Chronic Diseases Surveillance (CANCDS) in 2015 indicated that the total cholesterol (TC), low-density lipoprotein cholesterol (LDL-C), non-high-density lipoprotein cholesterol (non-HDL-C), and triglyceride (TG) levels were higher than those in 2002, increased by 0.70, 0.75, 0.74, and 0.35 mmol/L, respectively[61].
An analysis by the Non-communicable Disease Risk Factor Collaborative Group has found that in 1980, the average non-HDL-C level in the Chinese population was among the lowest worldwide, whereas by 2018, it reached or exceeded the non-HDL-C level of many high-income Western countries, which was about 4 mmol/L[62].
In 2004 and 2014, 1,660 and 1,649 children and adolescents aged 6–18 years in Beijing were recruited for the Beijing Children and Adolescent Metabolic Syndrome Study. The levels of TC, LDL-C, non-HDL-C, and TG in children and adolescents in 2014 were significantly higher than those in 2004 increased by 0.21, 0.12, 0.27, and 0.07 mmol/L, respectively, with HDL-C increased by 0.07 mmol/L[63]. The CHNS[64] in 2002, the China National Survey on Chronic Kidney Disease[65] in 2010, the CHNS[66] in 2011, and the Chinese Residents Nutrition and Chronic Disease Survey[67] in 2012 have indicated that the prevalence of dyslipidemia (defined as the presence of any type of dyslipidemia, including TC ≥ 6.22 mmol/L, LDL-C ≥ 4.14 mmol/L, HDL-C <1.04 mmol/L, and TG ≥ 2.26 mmol/L) in Chinese people aged ≥ 18 years has increased significantly, from 18.6% in 2002 to 40.4% in 2012.
The CHS study from 2012 to 2015[68] and the China-PEACE Million Persons Project (China-PEACE MPP) from 2014 to 2019[69], which focused on early screening and comprehensive intervention in high-risk CVD populations aged ≥ 35 years, reported similar prevalence of dyslipidemia: 34.7% and 33.8%, respectively.
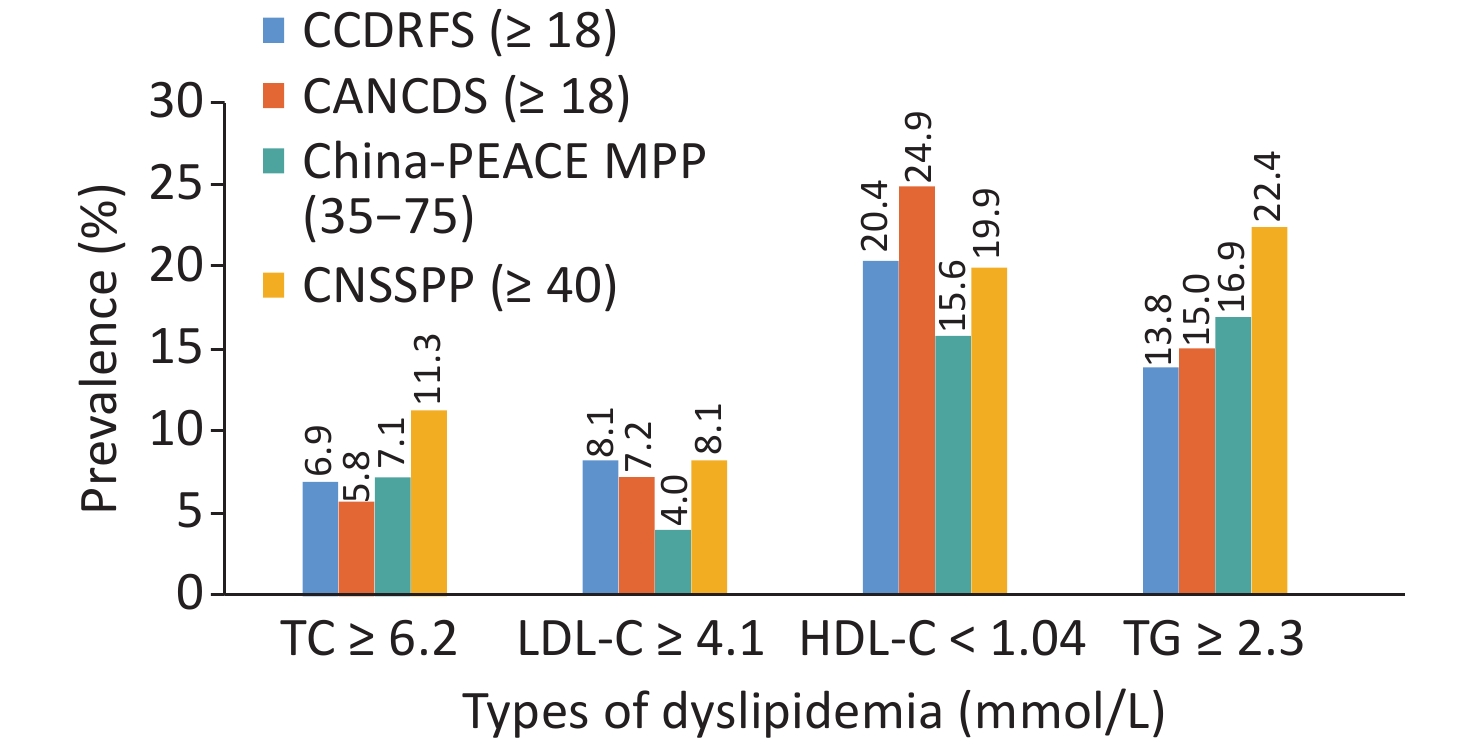
According to the data from the fourth CCDRFS[70] 2013–2014 and the CANCDS 2015[61], the survey results of the 2014 China Stroke Screening and Prevention Project (CNSSPP)[71] and the 2014–2019 China-PEACE MPP Project[69] both showed that the main forms of dyslipidemia in China are low HDL-C and high TG (Figure 10).

Figure 10. Prevalence of different types of dyslipidemia in Chinese adults.
The School-based Cardiovascular and Bone Health Promotion Program in 2017, which surveyed 14,395 children and adolescents aged 6–16 years, reported a 20.3% of total detection rate of dyslipidemia (TC ≥ 5.18 mmol/L, LDL-C ≥ 3.37 mmol/L, HDL-C ≤ 1.04 mmol/L, TG ≥ 1.7 mmol/L)[72].
According to the GBD data in 2019, 61% of the CVD burden in China was attributed to atherosclerotic CVD (ASCVD). An elevated LDL-C level (theoretical minimum risk exposure level of 0.7–1.3 mmol/L) was the second largest attributable risk factor for ASCVD, second only to high blood pressure (theoretical minimum risk exposure level of systolic blood pressure 110–115 mmHg)[73].
Based on the risk stratification defined by the 10-year ASCVD risk assessment process in the 2016 Chinese Guideline for the Management of Dyslipidemia in Adults (Revised version in 2016), the China-PEACE MPP survey identified 236,579 individuals (10.2% of the total population) at high risk for ASCVD over 10 years. The attainment rate for LDL-C < 2.6 mmol/L was 42.9%, whereas the treatment rate for those not meeting the target was only 4.5%. Among them, 71,785 individuals (3.2% of the total population) were at extremely high risk of ASCVD, with an attainment rate of 26.6% for LDL-C < 1.8 mmol/L and a treatment attainment rate of 14.1%. The treatment target attainment rate of LDL-C was 44.8%[69].
From November 2014 to May 2018, the Improving Care for Cardiovascular Disease in China (CCC) project included 6,523 patients with a history of myocardial infarction or coronary artery revascularization who experienced recurrent acute coronary syndrome (ACS) in 192 selected hospitals nationwide. The statin treatment rate upon admission was 50.6%, and the LDL-C target attainment rate (< 1.8 mmol/L) was 36.1%. Among patients aged ≥ 75 years, the statin treatment rate upon admission was even lower at 33.9%, and the LDL-C target attainment rate was only 24.7%[74-75].
Results from the PURE-China study (n = 47,262) with a median follow-up of 11.9 years showed that among modifiable cardiovascular risk factors, elevated non-HDL-C accounted for 7.8% of the attributable fraction in the CVD population, ranking third after high blood pressure and lower education levels. For myocardial infarction, elevated non-HDL-C accounted for 11.0% of the attributable fraction, ranking second after high blood pressure. Compared to individuals with non-HDL-C ≤ 3.2 mmol/L, those with non-HDL-C > 4.0 mmol/L had adjusted risk ratios of 1.26 for CVD, 1.42 for myocardial infarction, and 1.25 for stroke[76].
The CCC project recruited 104,516 hospitalized patients with ACS from 2014 to 2019. Based on the Chinese Expert Consensus on Lipid Management of very High-risk Atherosclerotic Cardiovascular Disease Patients published by the Chinese Society of Cardiology, 75.1% of the patients had high-risk ASCVD. The LDL-C attainment rate (< 1.4 mmol/L) upon admission was only 6.6%. After analyzing the prescription information of 40,875 patients, 95.1% of patients were found to be still receiving statin monotherapy upon discharge[77]. The DYSIS II-China study, which included 752 patients with ACS receiving lipid-lowering therapy in the DYSIS-China study with a 6-month follow-up, showed that 58.8% of patients did not meet the LDL-C standard; the LDL-C level was 0.7 ± 0.7 mmol/L away from the target value, and 91.4% of patients were treated with statin monotherapy[78]. These two studies suggested that the LDL-C reaching strategy for ASCVD patients in China is in urgent need of optimization and that combined lipid-lowering is insufficient in clinical practice.
-
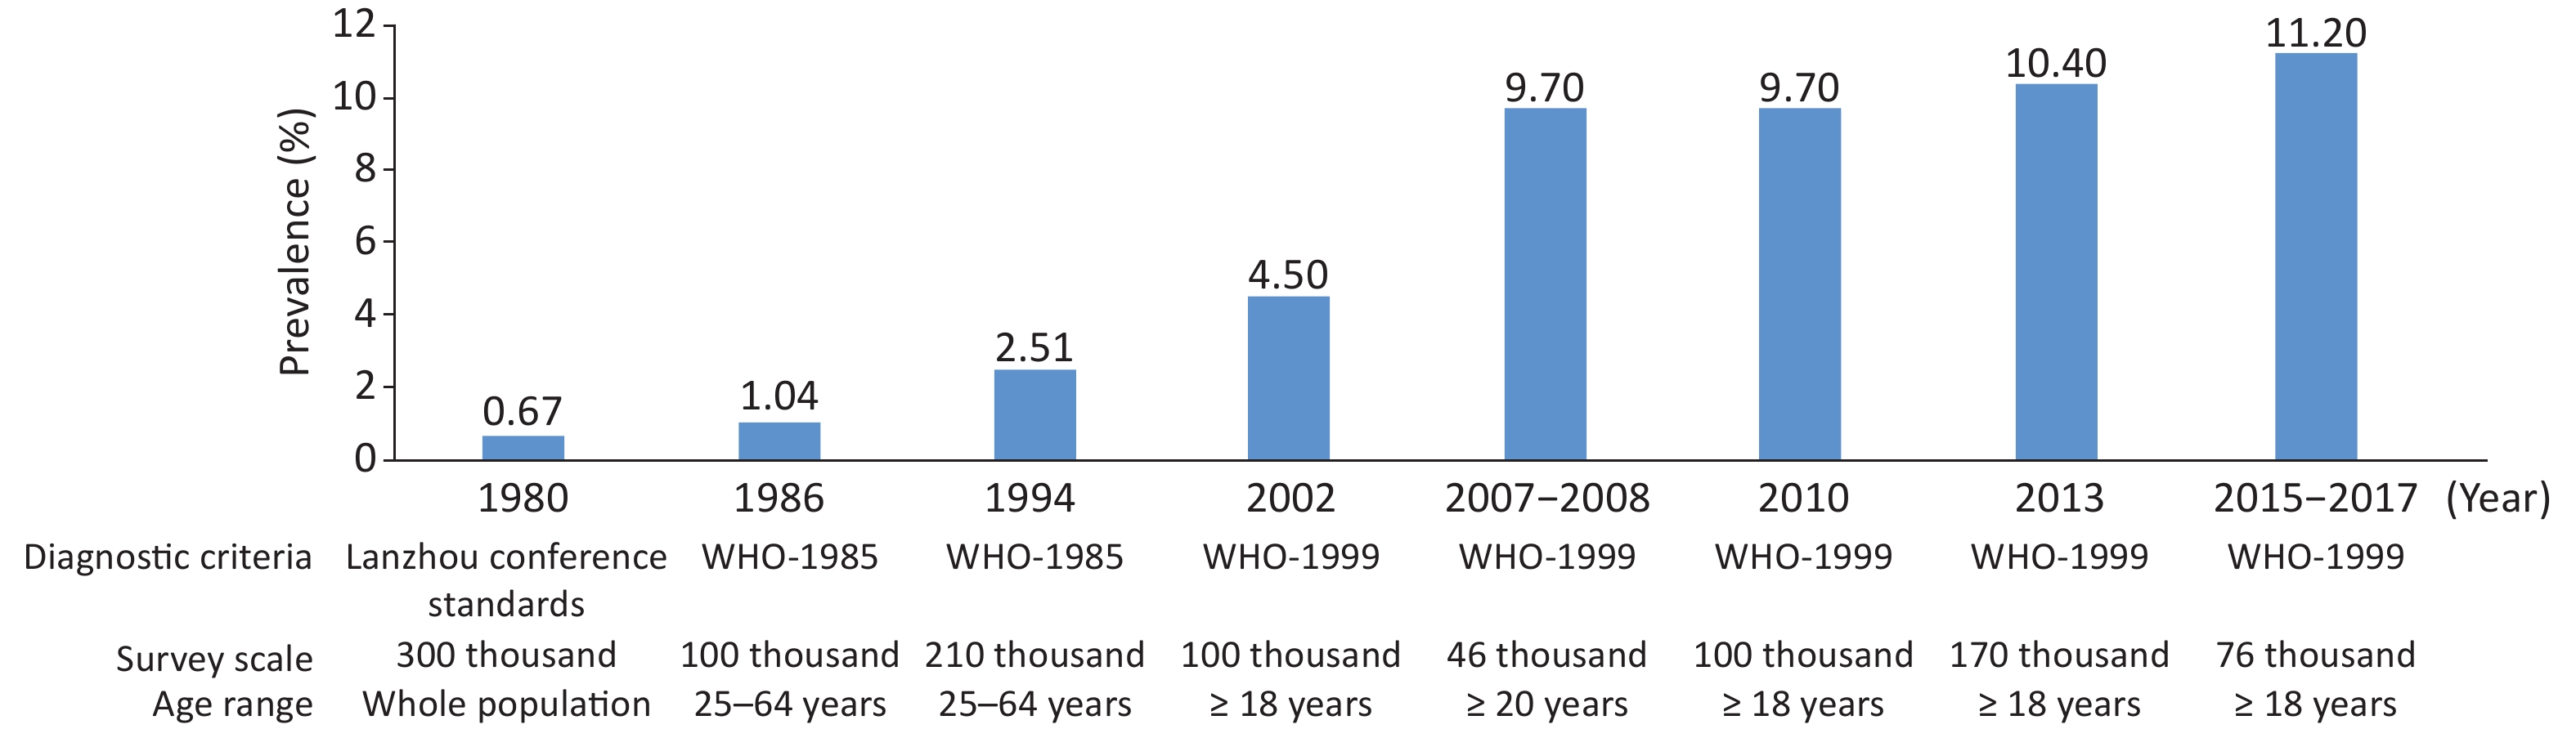
The prevalence of diabetes in the Chinese population has a significantly increasing trend (Figure 11). A survey of 300,000 people in 1980 indicated a diabetes prevalence of 0.67%[79]. From 2015 to 2017, a cross-sectional survey of 75,880 adults aged ≥ 18 years in 31 provinces, autonomous regions, and municipalities indicated that, according to the American Diabetes Association standard, the prevalence of diabetes was 12.8% with 6.0% of previously diagnosed diabetes (95% CI: 5.4%–6.7%) and that of newly diagnosed diabetes was 6.8%, and the detection rate of diabetes in early stages was 35.2%. Based on the WHO diagnostic criteria, the prevalence of diabetes was 11.2%. An estimated 129.8 million adults have diabetes in China (70.4 million men and 59.4 million women)[80].
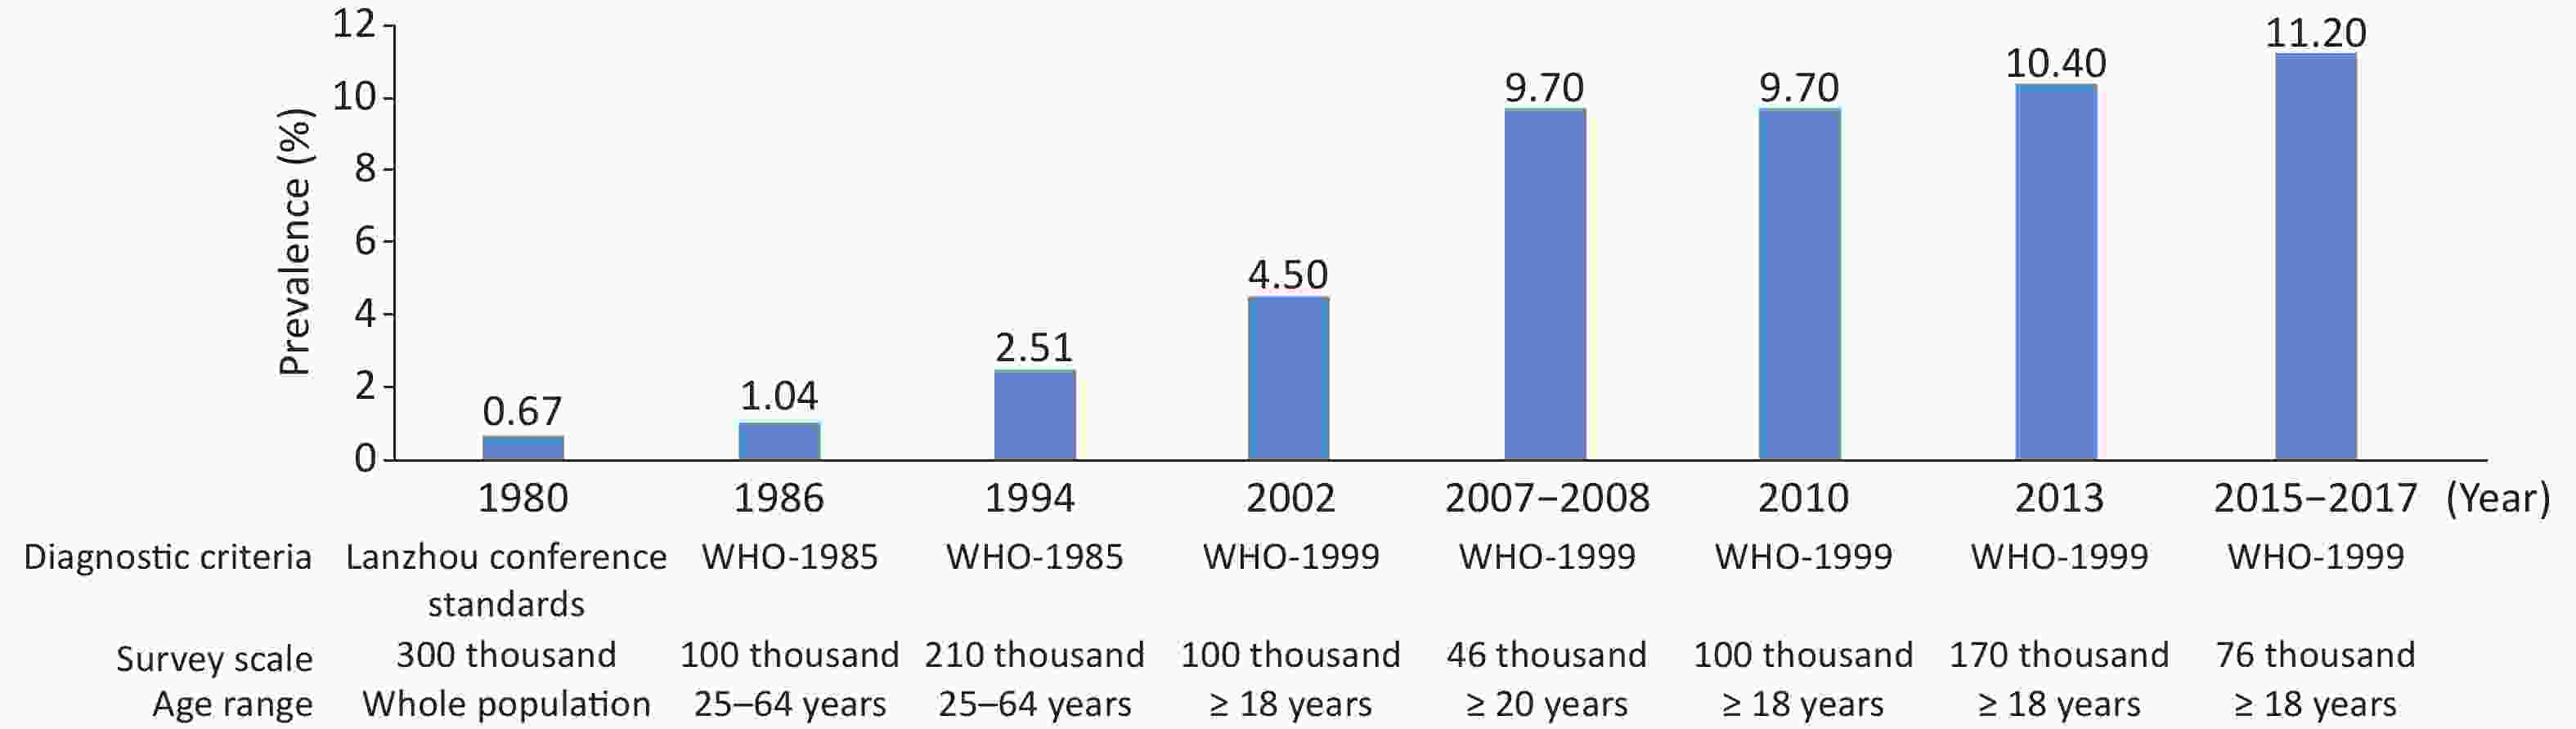
Figure 11. Investigation of the prevalence of diabetes in China from 1980 to 2017.
A tertiary hospital-based study used data from the National Hospital Quality Monitoring System (HQMS) database to assess the prevalence of diabetic microvascular and macrovascular complications among Chinese inpatients with diabetes, including 92,413 inpatients with type 1 diabetes and 6,094,038 with type 2 diabetes. The incidence of macrovascular complications in type 1 and type 2 diabetes increased from 7.3% and 14.5% in 2013 to 13.2% and 18.4% in 2017, and the incidence of microvascular complications increased from 29.9% and 19.0% in 2013 to 31.6% and 21.0% in 2017, respectively[81].
A survey of 30,693 inpatients with type 2 diabetes from 2013 to 2018 showed that the crude prevalence of CHD in patients with type 2 diabetes in China was 23.5%. Based on data from the Chinese population census in 2010, the age-standardized prevalence of CHD was 13.9% (16.0% for men and 11.9% for women)[82].
The Da Qing Diabetes Prevention Study in China enrolled 577 adults with impaired glucose tolerance from 33 clinics who were identified through oral glucose tolerance tests. The participants were randomly assigned to either a control group or one of three intervention groups (diet, exercise, or diet plus exercise). The interventions began in 1986 and were completed in 1992. During 30 years of follow-up, compared with the control group, the intervention group had a median delay in diabetes onset of 3.96 years, a 39% lower cumulative incidence of diabetes. The risks of cardiovascular disease (CVD) events, composite microvascular events, CVD deaths, and all-cause death were 26%, 35%, 33%, and 26%, respectively. The incidences of stroke and severe retinopathy significantly decreased and the average life expectancy increased by 1.44 years compared with the control group[83].
A health economic evaluation study based on a randomized controlled trial assessed the long-term (50-year) Cost-effectiveness of structured education in Chinese patients with type 2 diabetes. The results showed that patients who received structured education had increased life expectancy and QALY, lower cumulative complication rates, and greater savings in direct medical costs than those who received conventional education. The sensitivity analyses indicated that structured education had a 100% probability of being cost-effective[84]. Structured education is considered an extremely cost-effective option for the treatment of patients with type 2 diabetes, with the potential to improve clinical outcomes and reduce costs.
-
A national cross-sectional survey conducted from September 2009 to September 2010 among 47,204 adults aged > 18 years from 13 provinces, autonomous regions, and municipalities in China assessed the prevalence of chronic kidney disease (CKD). The overall prevalence of CKD was 10.8%. Therefore, the number of patients with CKD in China was estimated to be approximately 120 million. The adjusted prevalence of an estimated glomerular filtration rate (eGFR) < 60 mL/(min·1.73 m²) was 1.7%, and that of a urinary albumin to creatinine ratio > 30 mg/g was 9.4%[85].
The CHARLS from 2015 to 2016 included 6,706 participants aged ≥ 60 years with renal function decline [eGFR < 60 mL/(min·1.73 m²)]. The overall prevalence was 10.3%. The prevalence of renal function decline increased with age (60–64 years, 3.3%; 65–69 years, 6.4%; 70–74 years, 11.4%; 75–79 years, 22.2%; and ≥ 80 years, 33.9%)[86].
The China Kidney Disease Data Network 2016 annual report indicated that the proportion of hospitalized patients with a comorbid CKD diagnosis was 4.86% of the total hospitalized patients in that year. The prevalence of CKD varied among patients with different diseases, 13.90%, 11.41%, and 7.96% in those with diabetes, hypertension, and 7.96% in CVD, respectively[87].
-
A total of 48,556 and 104,098 participants aged ≥ 18 years were included in the China Nutrition and Health Survey in 2002 and 2010–2012 by the cluster random sampling method, respectively. According to the diagnostic criteria of the Diabetology Branch of the Chinese Medical Association, the prevalence of metabolic syndrome (MS) increased from 6.6% in 2002 to 15.4% in 2012[88-89].
In the China Nutrition and Health Survey 2010–2012, data were collected from 16,872 adolescents aged 10–17 years. According to the diagnostic criteria proposed by the Pediatric Branch of the Chinese Medical Association and the Cook criterion, the prevalence of MS was 2.4% and 4.3%, respectively[90].
-
Among the factors affecting disability-adjusted life years (DALY) and death burden in China, ambient air pollution and indoor air pollution are the 3rd and 13th greatest risk factors affecting the DALY in China. Compared with the 1990 values, the total number of deaths associated with indoor air pollution decreased by 72.7%, and DALY losses decreased by 80.2%[91] in 2019.
In 2021, 218 of the 339 cities at the prefecture level and above met the outdoor air quality standards, with an attainment rate of 64.3% and an increase of 3.5% from 2020. The levels of six major air pollutants (PM2.5, PM10, sulfur dioxide [SO2], nitrogen dioxide [NO2], carbon monoxide [CO], and ozone [O3]) have decreased since 2020[92].
A series of studies based on data on air pollution and causes of mortality in 272 cities in China from 2013 to 2015 reported that an increased risk of CVD mortality was associated with an increase in PM2.5, coarse particulate matter (diameter 2.5–10.0 μm), O3, SO2, NO2, and CO. In addition, air pollution is reported to increase the mortality risk of CVD, CHD, and hypertension[93-97]. Another study based on a time series of 250 counties in China from 2013 to 2018 found that exposure to heavy PM2.5 pollution events led to a 1.09% increase in the risk of CVD death[98].
Deaths attributable to PM2.5 pollution in China from 2000 to 2016 were estimated to be 30.8 million. Since 2013, the total number of deaths caused by PM2.5 exposure has been gradually decreasing[99].
A study concerning the economic costs and health benefits of different carbon emission reduction pathways reported that approximately 118,000 and 614,000 deaths due to PM2.5 could be avoided by carbon emission reduction by 2030 and 2050, respectively[100]. A study on the benefits of China’s carbon and air quality pollution prevention policies on human health predicted that by 2030, the number of deaths related to PM2.5 and ozone will be reduced by 235,200 and 53,400, respectively[101].
Since the implementation of the Beijing Air Pollution Prevention and Control Action Plan, the evaluation results of the economic benefits of air quality improvement from 2013 to 2017 were −19.82, −18.93, 15.707, 15.264, and 22.330 billion yuan, accounting for −0.85%, −0.81%, 6.68%, 6.16%, and 8.77% of the GDP in this fiscal year, respectively. The total profit in the five years was 49.426 billion yuan, accounting for 4.11% of the total GDP[102].
An empirical study based on data from medical insurance reimbursement in a sample city of China showed that for every 10 μg/m3 reduction in PM2.5 concentration, the average medical cost of patients would be reduced by 1,699 yuan, and the loss of ordinary working and living time would be reduced by 1.24 days. If the city’s annual PM2.5 concentration is reduced to the national standard (35 μg/m3), it will bring more than 1.28 billion yuan for health benefits, accounting for 18% of the city’s annual investment in environmental protection[103].
-
The Outline of the “Healthy China 2030” plan calls for “implementing the strategy of comprehensive prevention and control of chronic diseases and strengthening the development of the National Demonstration Area for Comprehensive Prevention and Control of Non-communicable Diseases.” By 2020, a total of 488 national demonstration areas were formed in 31 provinces, autonomous regions, and municipalities, covering 17.1% of the counties (including the largest county) in China[104]. The target of covering 15% of the demonstration area was achieved in 2020, as proposed by the General Office of the State Council in the Medium- and Long-Term Plan for Chronic Disease Prevention and Control in China (2017–2025). The construction of demonstration areas, as an important tool for the implementation of the comprehensive chronic disease prevention and control strategy in the 14th Five-Year Plan, is promoting a fundamental shift in CVD prevention and control strategies from high-risk groups to the whole population.
The Lishan District in Anshan started the construction of a demonstration area in 2013. From 2013 to 2020, the number of health units, such as healthy schools, canteens, restaurants, theme parks, paths, cabins, and communities, increased from 73 to 116, an increase of 59%. The construction of the health unit and other demonstration areas improved the risk factors for CVD in the population, wherein the overweight rate decreased by 15.00% (36.79% vs. 31.27%), obesity by 40.30% (16.90% vs. 10.09%), smoking by 36.27% (30.63% vs. 19.52%), passive smoking by 50.95% (75.12% vs. 36.85%), and alcohol consumption by 53.13% (32.73% vs. 15.34%). In the past 7 years, peoples’ healthy behavior has gradually developed. The use rate of the salt-restriction spoon increased from 3.22% to 15.34%, and that of the oil control pot increased from 1.26% to 12.95%. The proportion of people needing knowledge of chronic diseases increased from 48.65% to 65.74%. The prevalence of hypertension and diabetes decreased significantly (34.69% vs. 23.51%; 16.76% vs. 8.96%) and the average life expectancy increased by 1.57 years (78.00 vs. 79.57 years)[105].
In 2014, the Qiaokou District of Wuhan was selected as the third national demonstration area. Through comprehensively promoting national health management services and establishing a mechanism for the division of labor and collaboration in health management among disease control and prevention agencies, hospitals, and primary healthcare institutions, ten community healthcare centers and private hospitals in Qiaokou District have set up special hypertension intervention clinics according to their characteristics. The results of a sampling survey in 2017 showed that the self-reported rate of hypertension increased from 16.88% in 2013 to 23.71% (the actual prevalence rates were 33.71% and 33.54%, respectively), and the treatment and control rate of hypertension increased from 22.22% in 2013 to 51.09%[106].
-
The prevalence of CVD has been increasing in China. The number of patients with CVD is estimated to be 330 million, 13 million with stroke, 11.39 million with CHD, 8.9 million with HF, 5 million with pulmonary heart disease, 4.87 million with atrial fibrillation (AF), 2.5 million with rheumatic heart disease, 2 million with congenital heart disease, 45.3 million with peripheral arterial disease, and 245 million with hypertension.
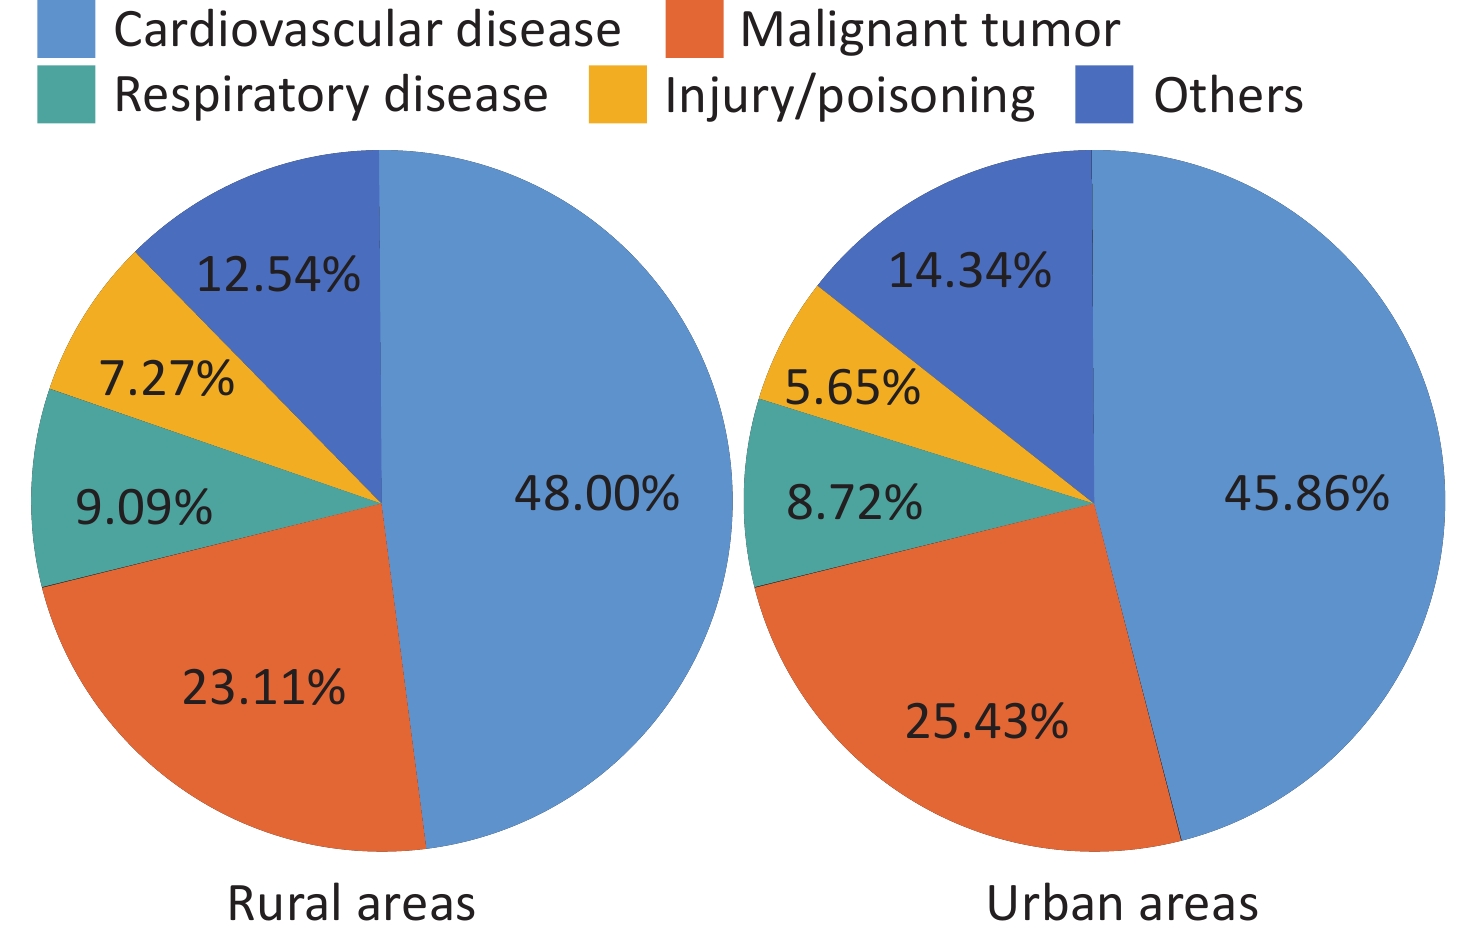
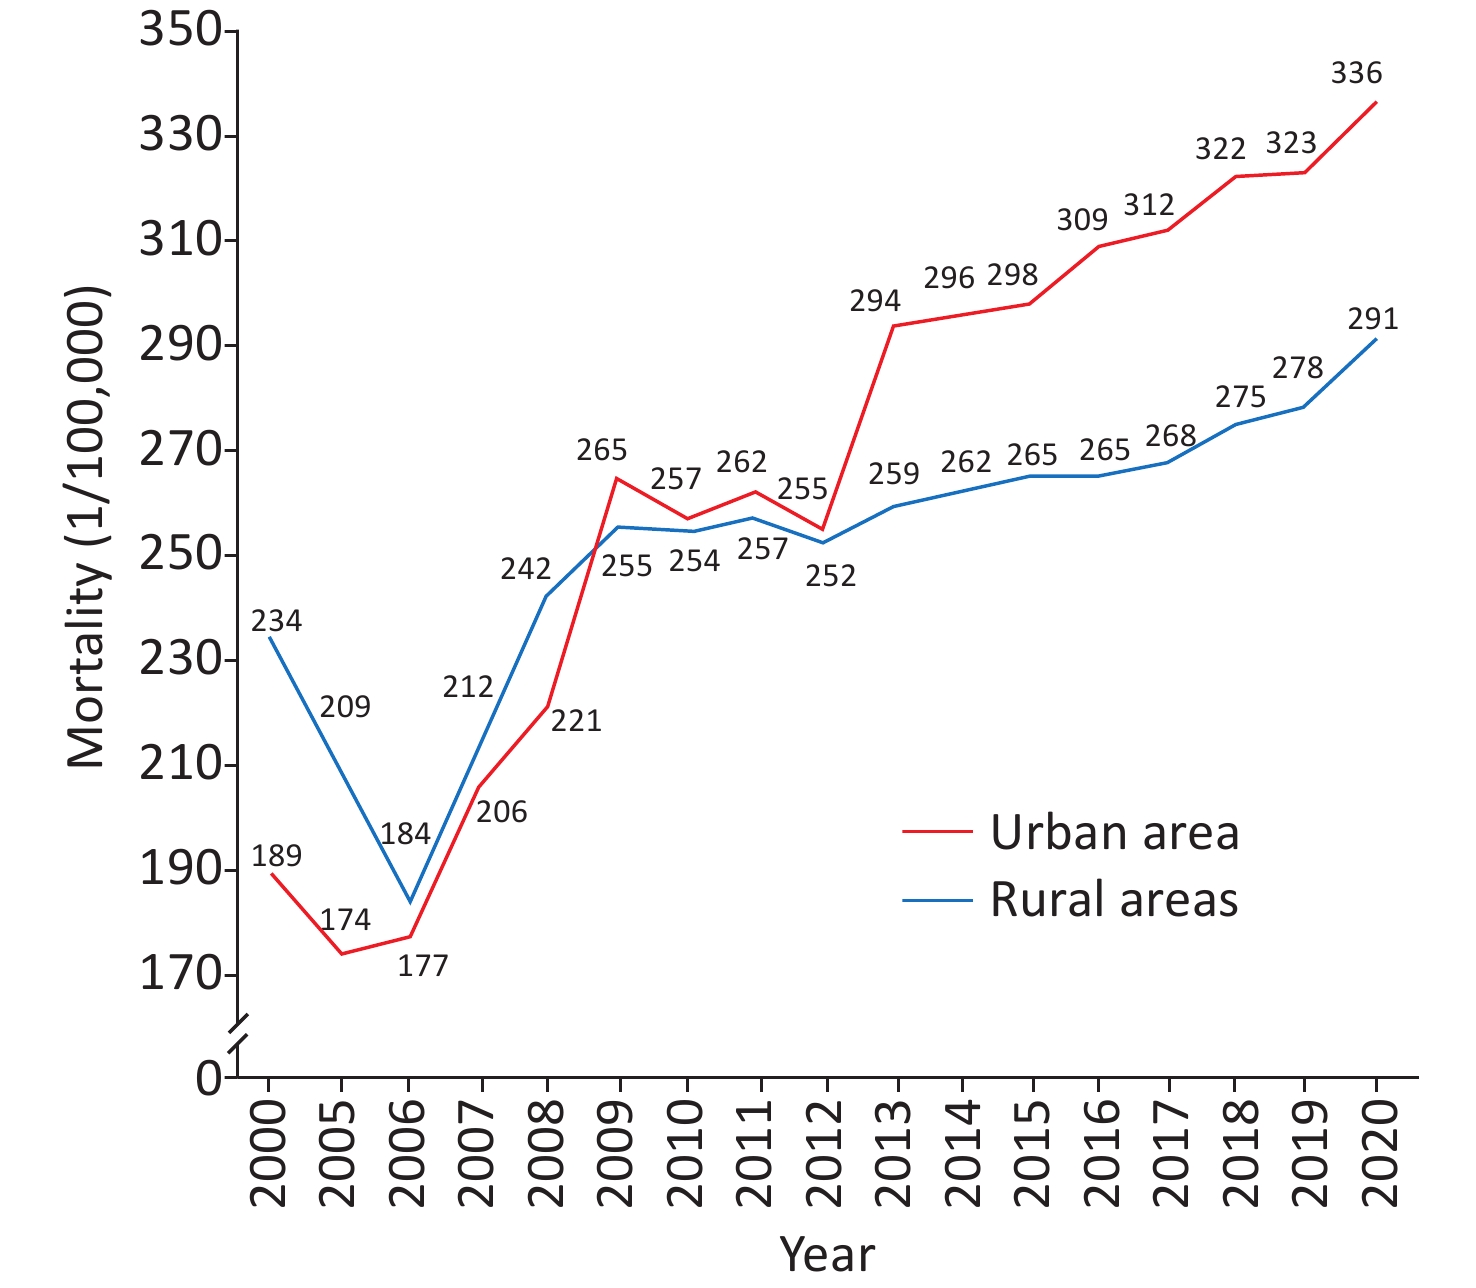
CVD was the main cause of death among rural and urban residents. In 2020, CVD accounted for 48.00% and 45.86% of deaths in rural and urban areas, respectively (Figure 12). Two out of every five deaths were attributable to CVD. CVD mortality in rural areas has exceeded that in urban areas since 2009 (Figure 13).
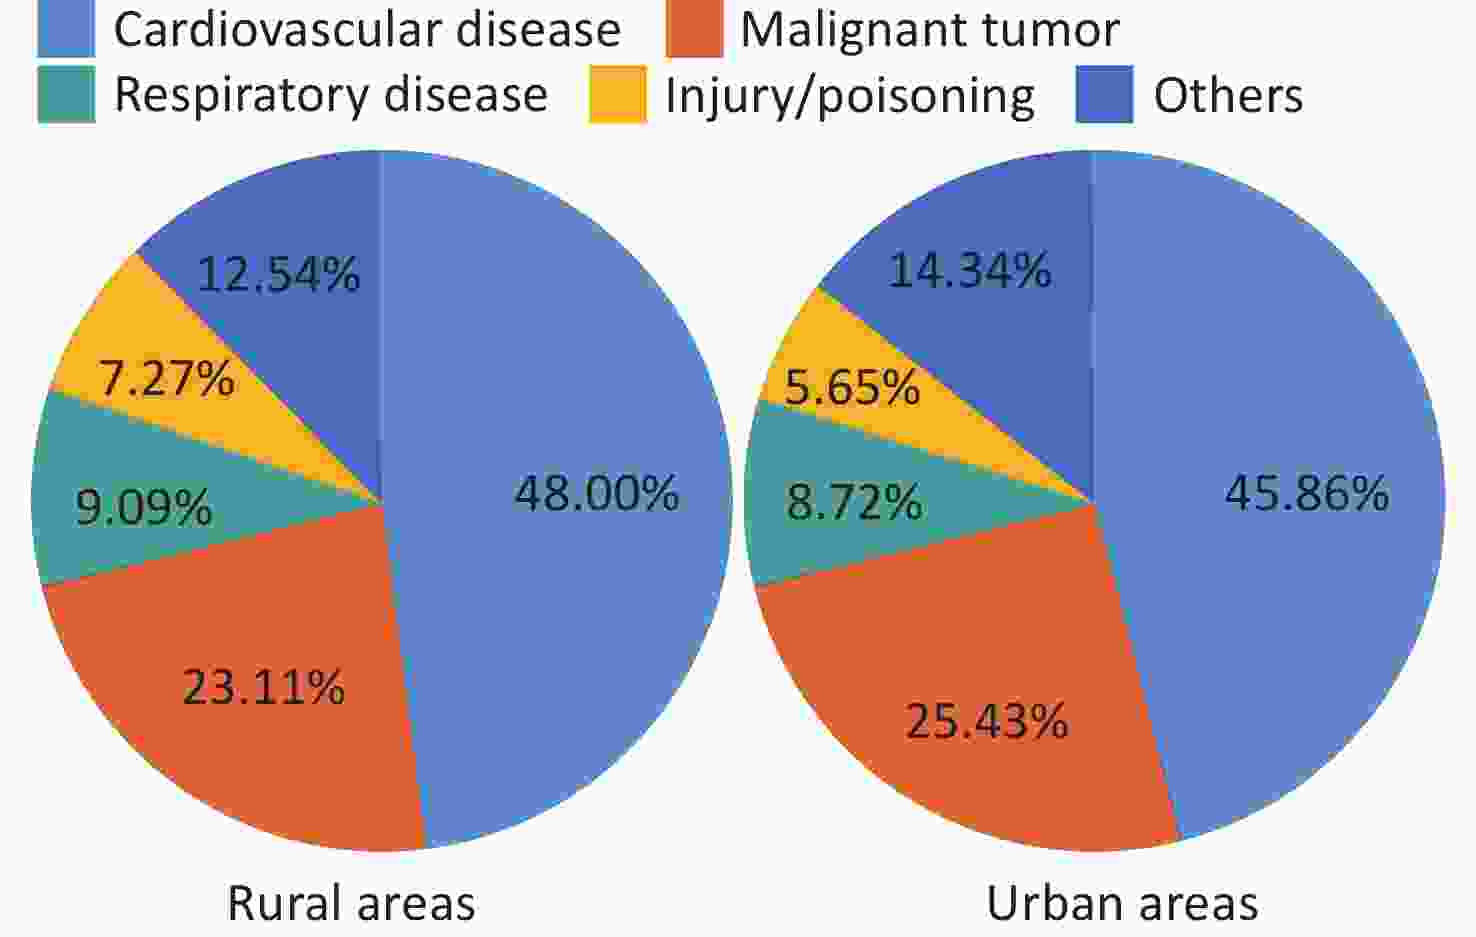
Figure 12. Proportion of major causes of death among urban and rural residents in China in 2020.
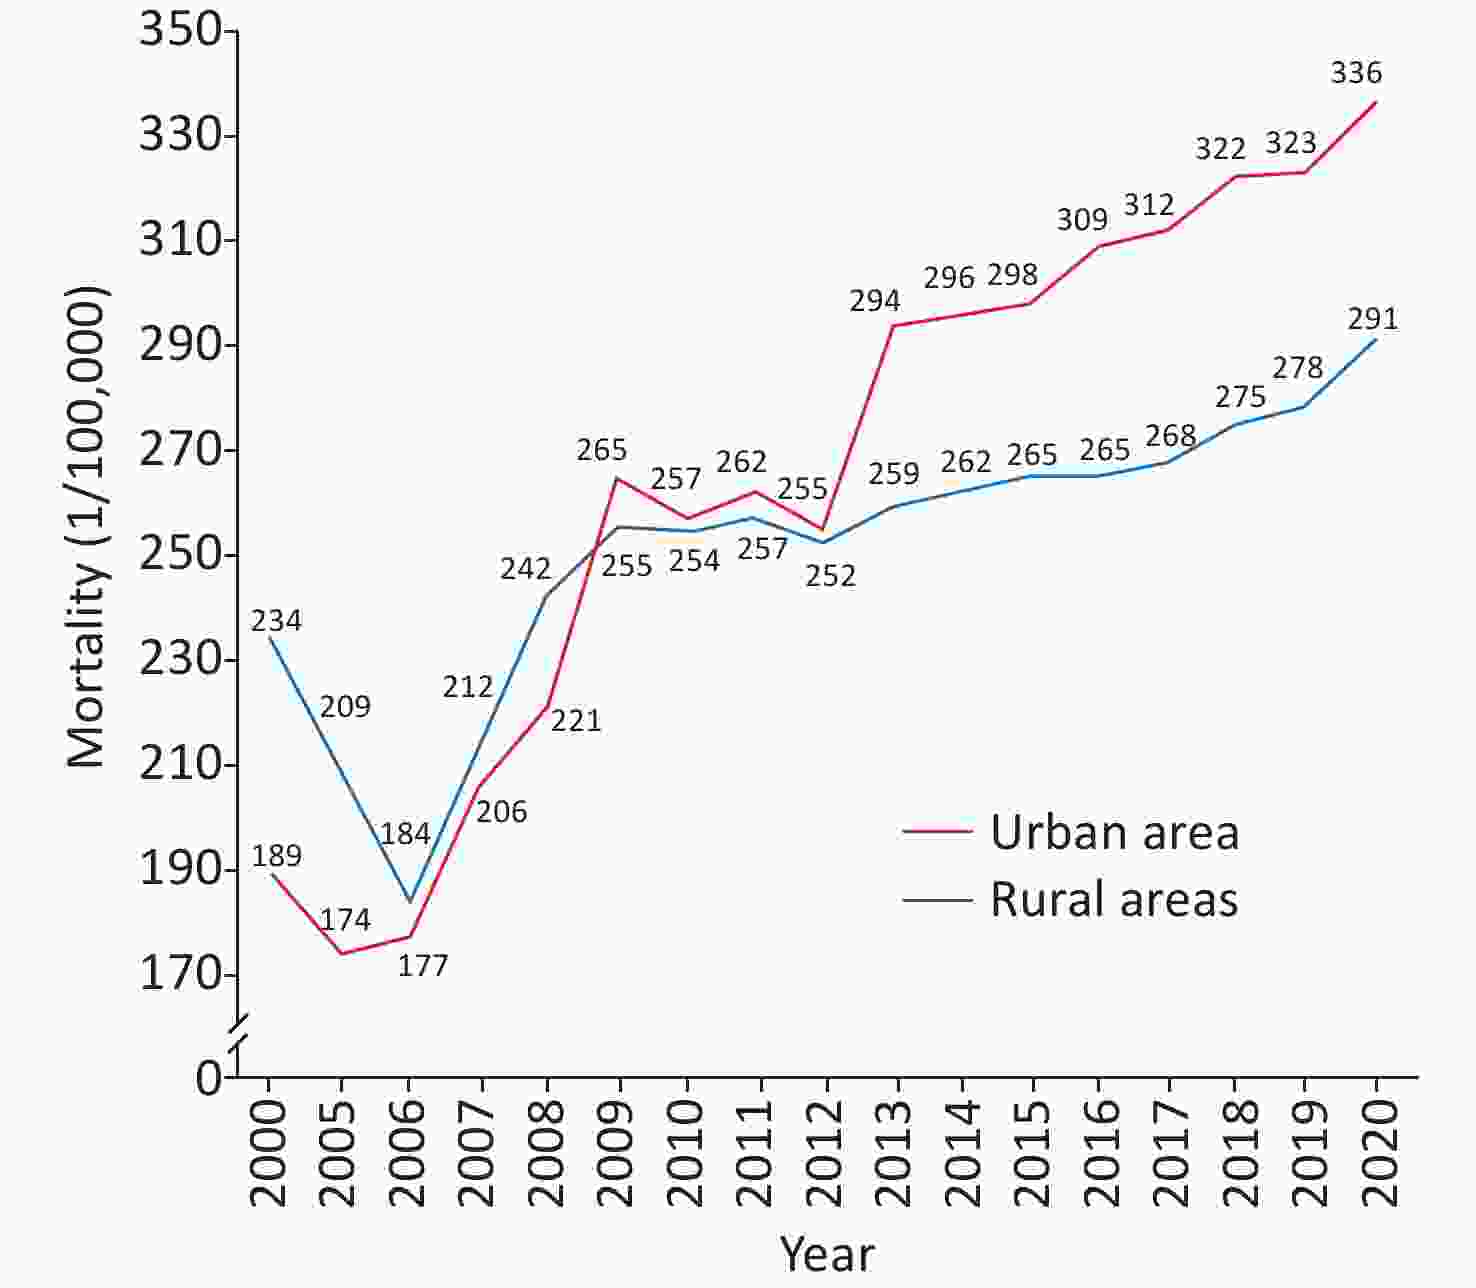
Figure 13. Changes in cardiovascular disease mortality in urban and rural residents in China from 2000 to 2020.
In 2020, the mortality due to CVD in rural areas was 336.13/100,000, 171.36/100,000 due to heart disease and 164.77/100,000 due to CVD. The mortality due to CVD in urban areas was 291.04/100,000: 155.86/100,000 due to heart disease and 135.18/100,000 due to CVD.
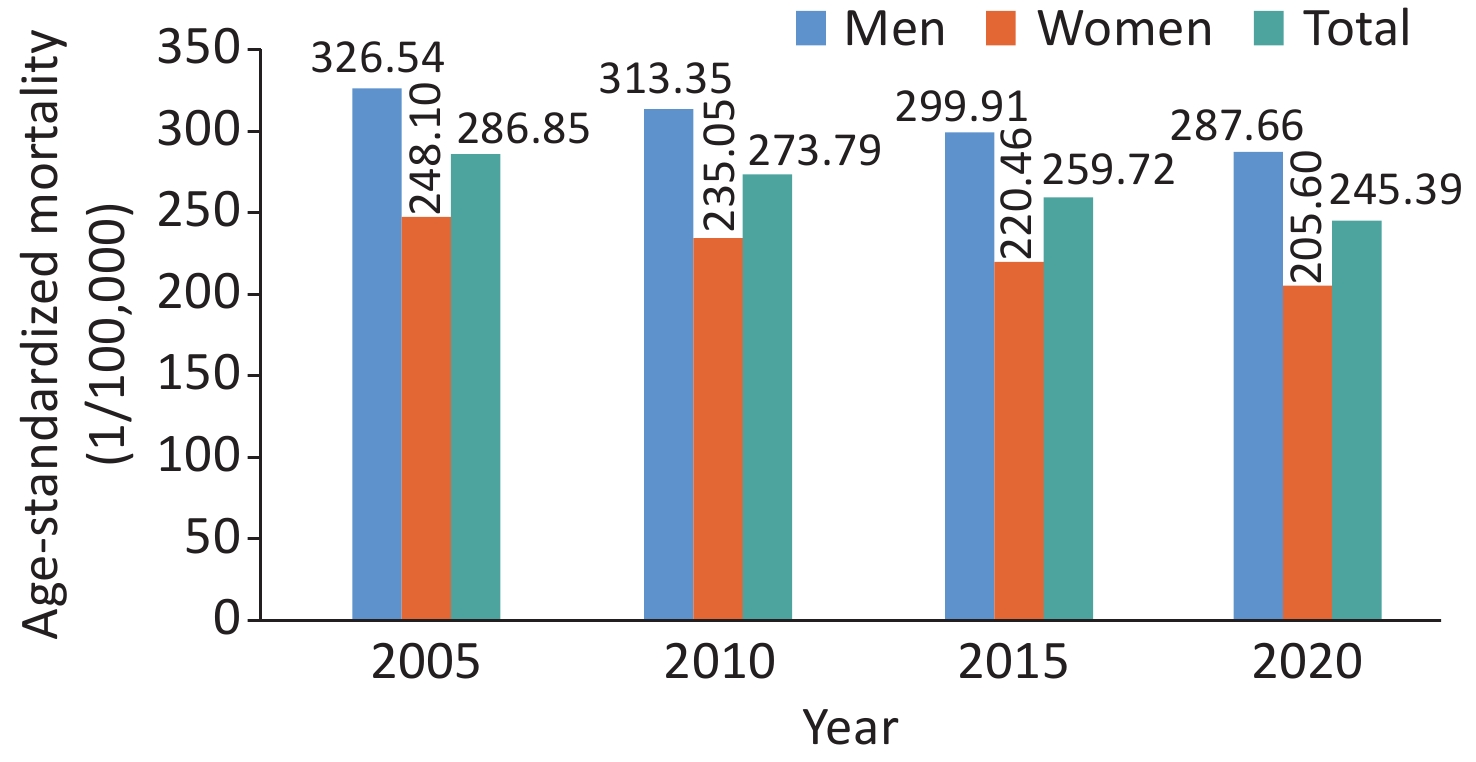
The number of CVD deaths in China increased from 3.09 million in 2005 to 4.58 million in 2020. The age-standardized mortality rate of CVD decreased from 286.85/100,000 in 2005 to 245.39/100,000 in 2020 (Figure 14). In 2020, the burden of premature CVD mortality in China was reduced by 19.27% compared with that in 2005. In 2020, ischemic heart disease, hemorrhagic stroke, and ischemic stroke were the three major causes of CVD death in China[107].
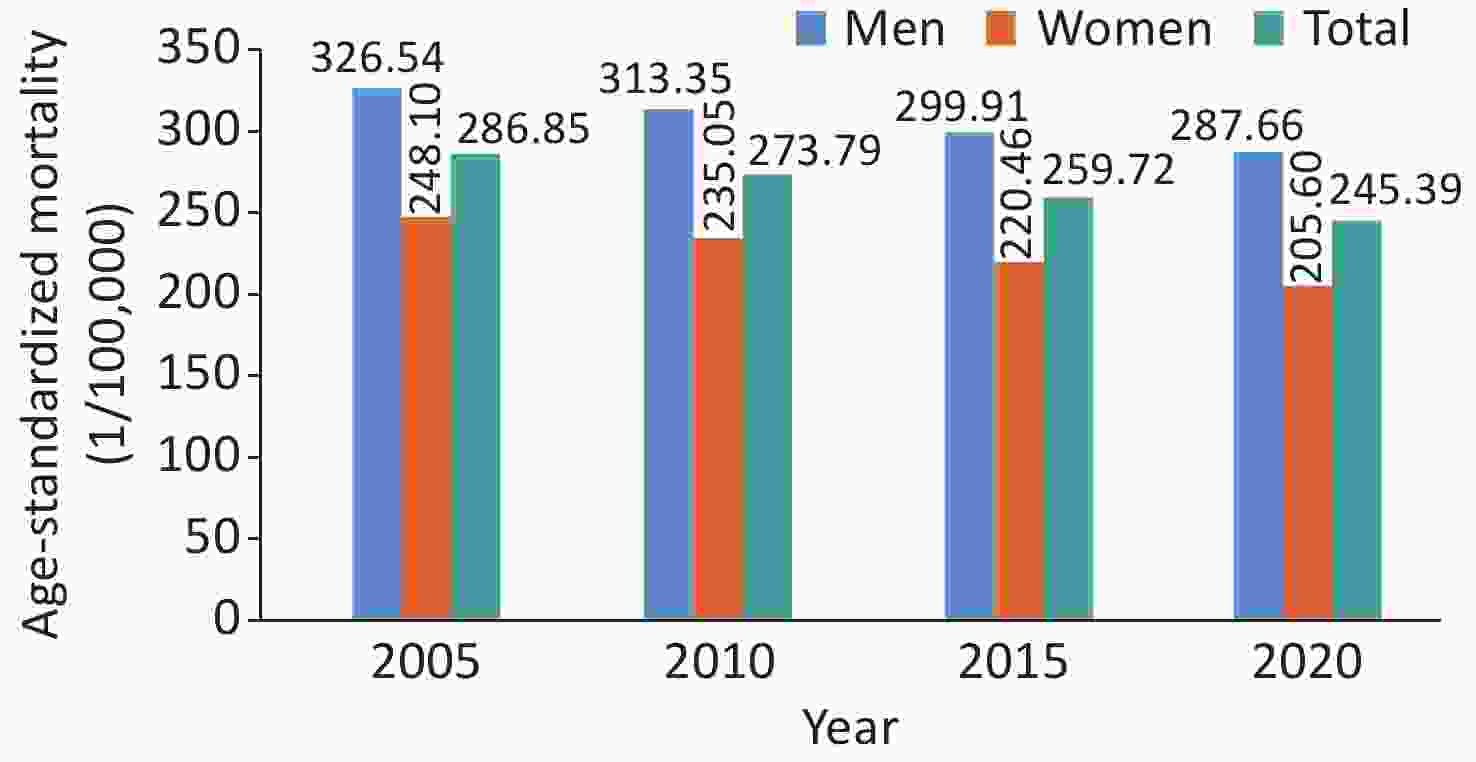
Figure 14. Age-standardized mortality of cardiovascular diseases in China from 2005 to 2020.
-
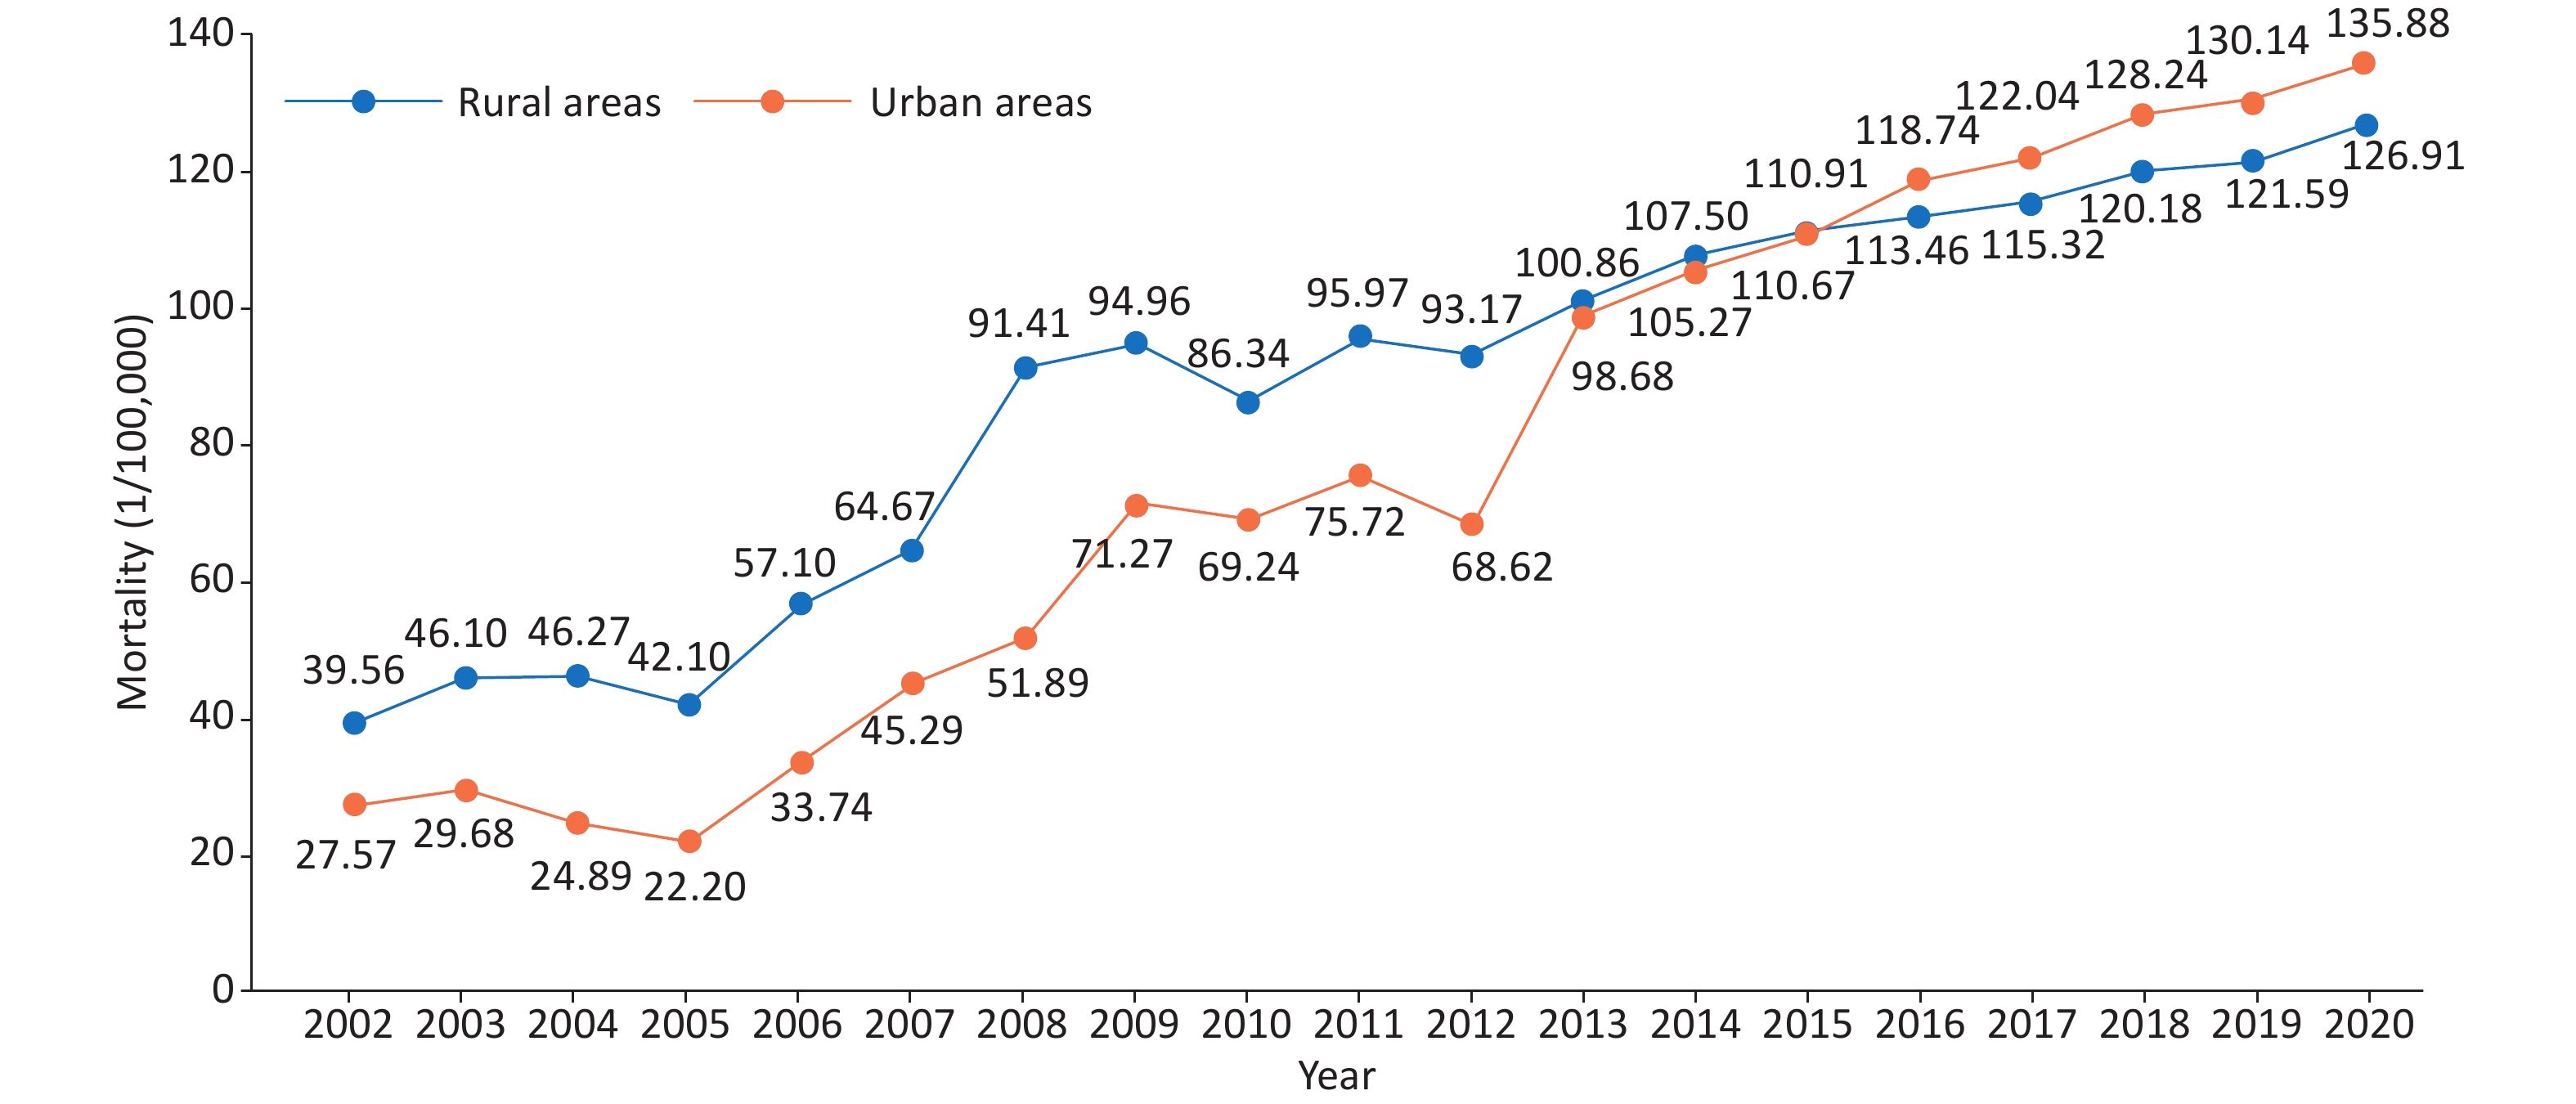
According to the China Health Statistics Yearbook 2021, in 2020, the mortality due to CHD was 126.91/100,000 among urban residents and 135.88/100,000 among rural residents and has been increasing since 2012. The mortality due to CHD in rural areas increased significantly and exceeded that in urban areas by 2016 (Figure 15)[108].
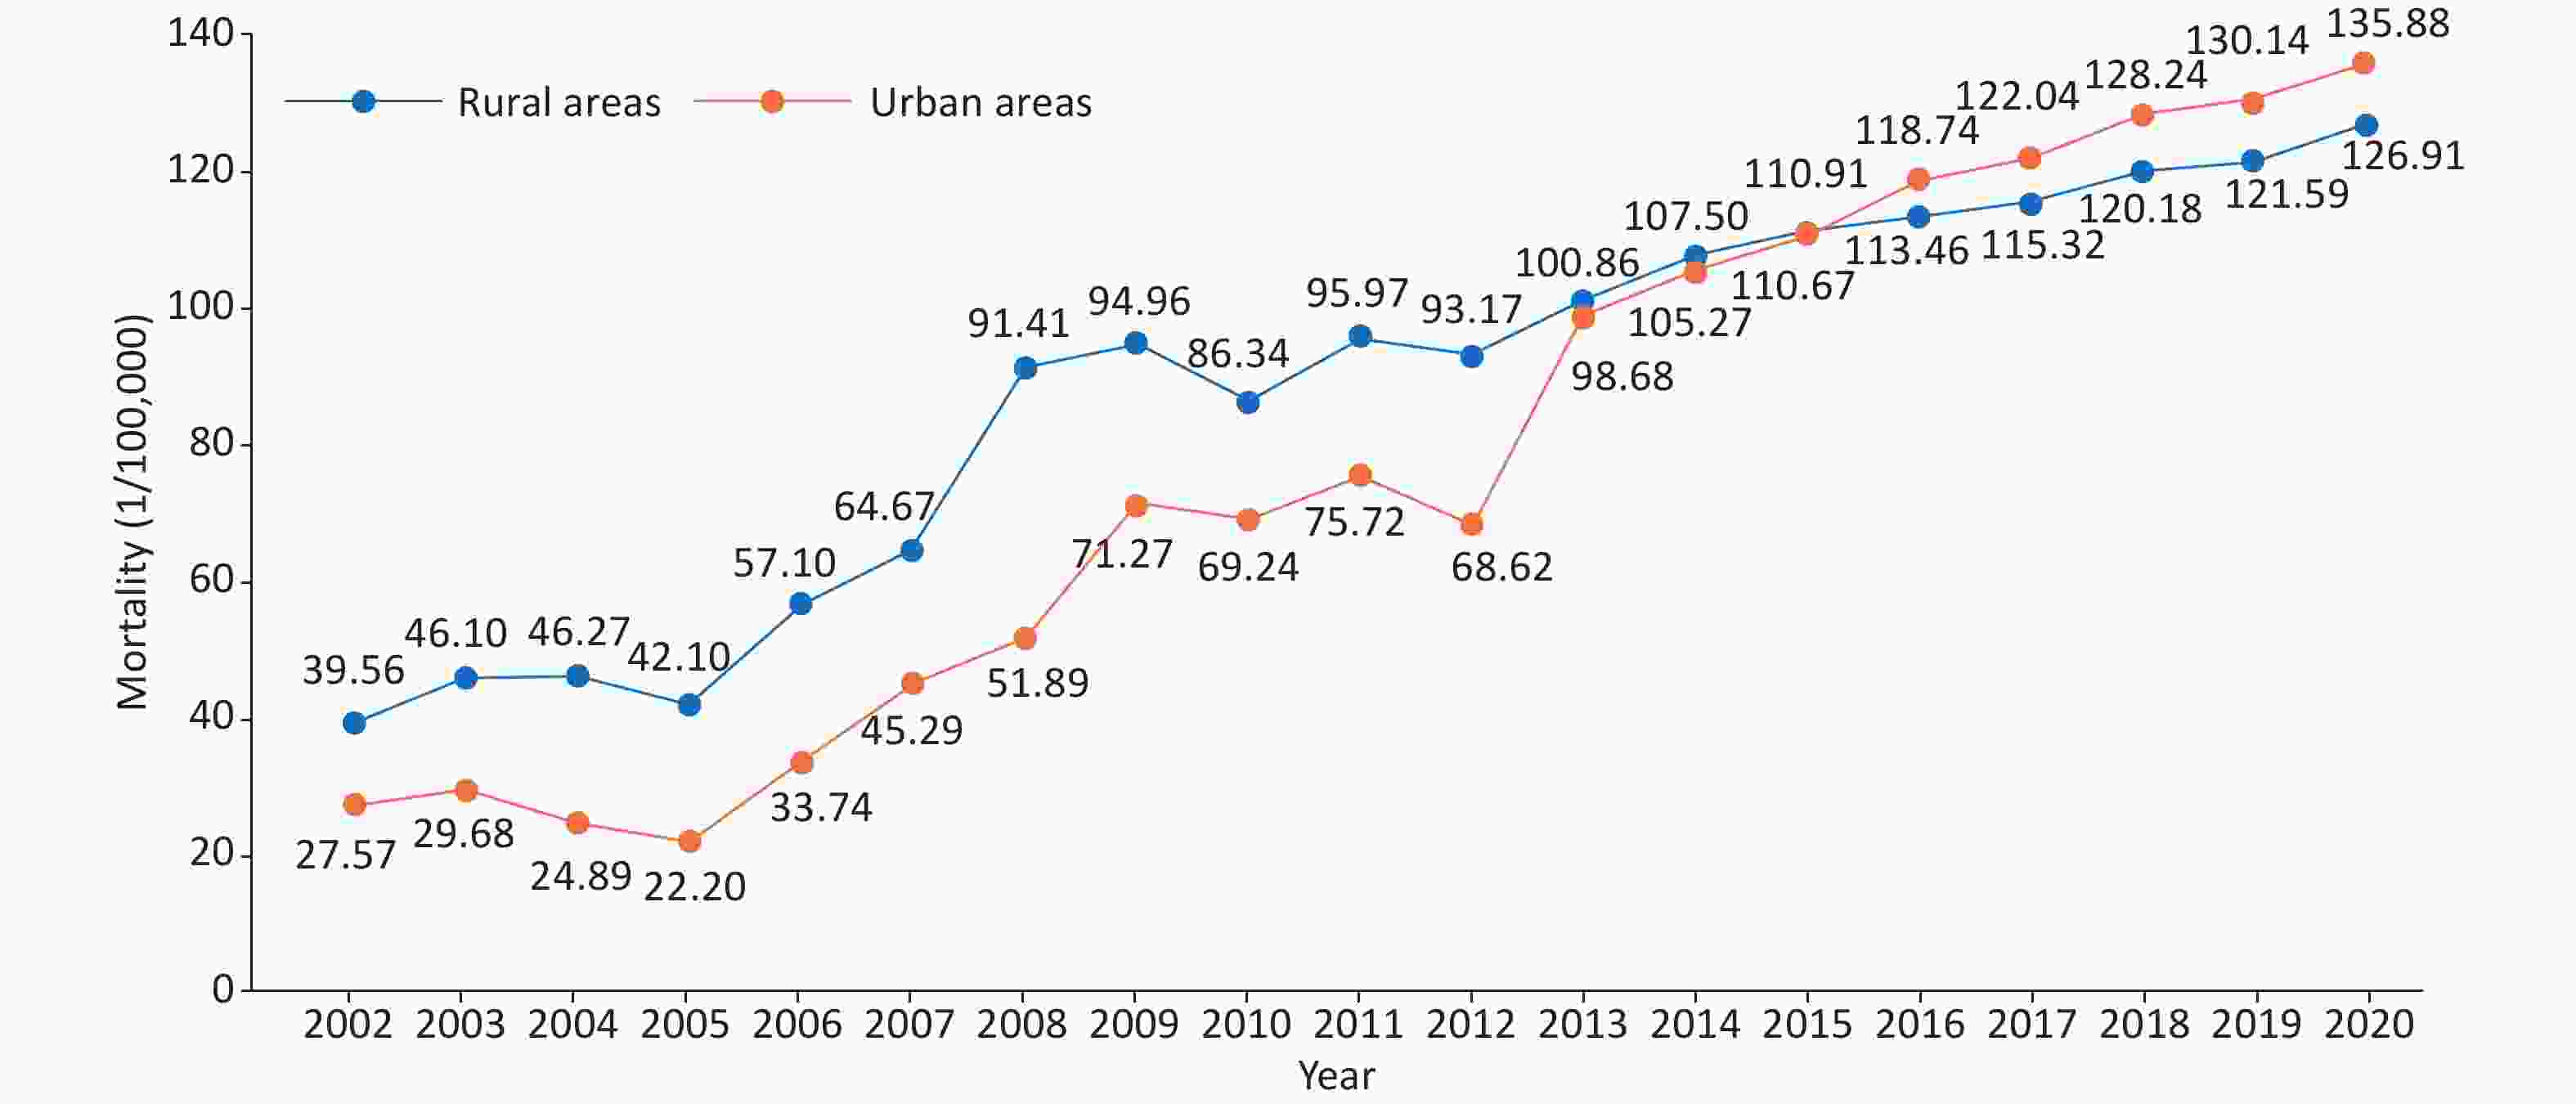
Figure 15. Trends in coronary heart disease mortality in urban and rural residents in China from 2002 to 2020.
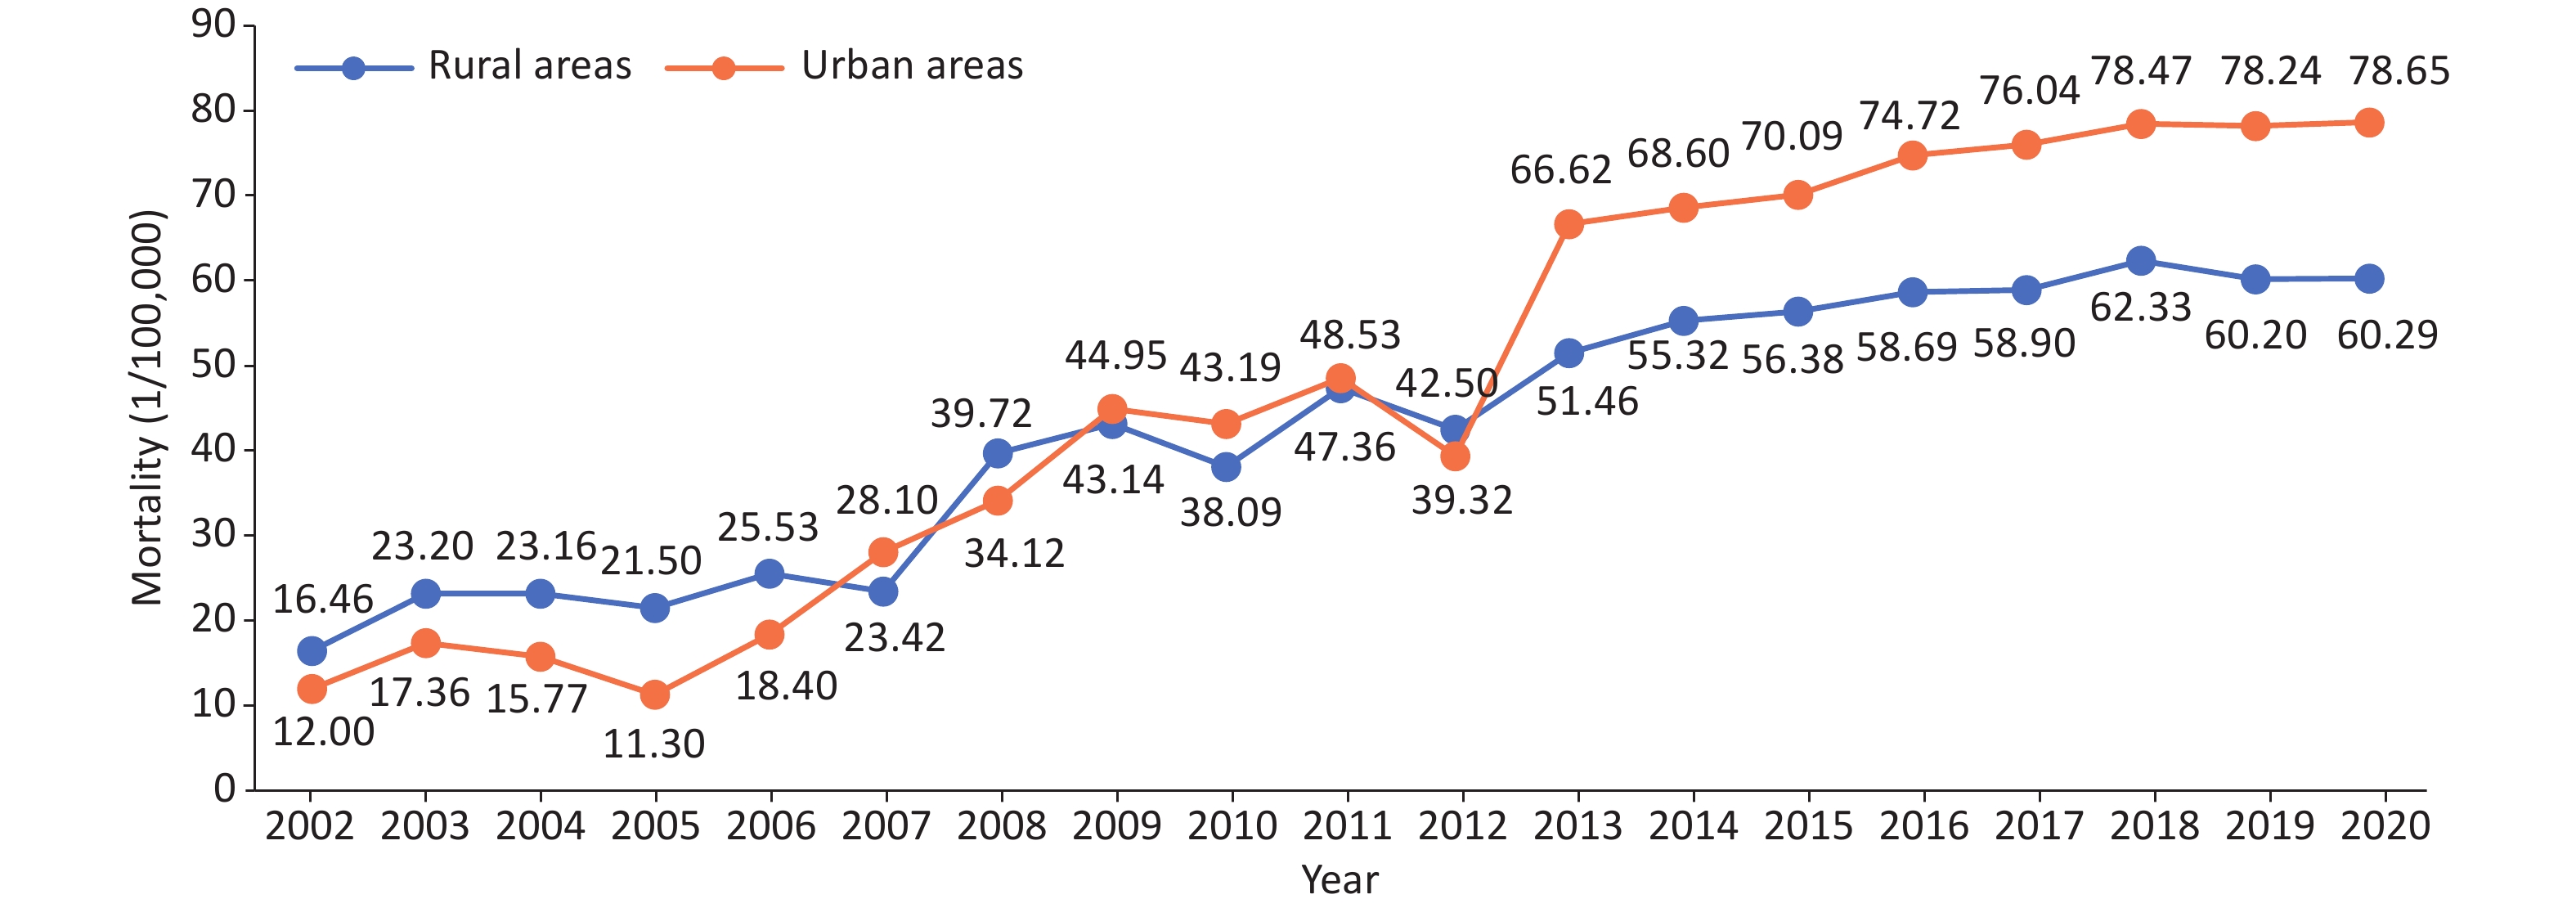
From 2002 to 2020, the mortality due to AMI showed an increasing trend, which has increased rapidly since 2005. This mortality in rural areas not only exceeded that in urban areas in 2007, 2009, 2010, and 2011 but also increased significantly since 2012. In 2013, the mortality in rural areas exceeded that in urban areas (Figure 16).
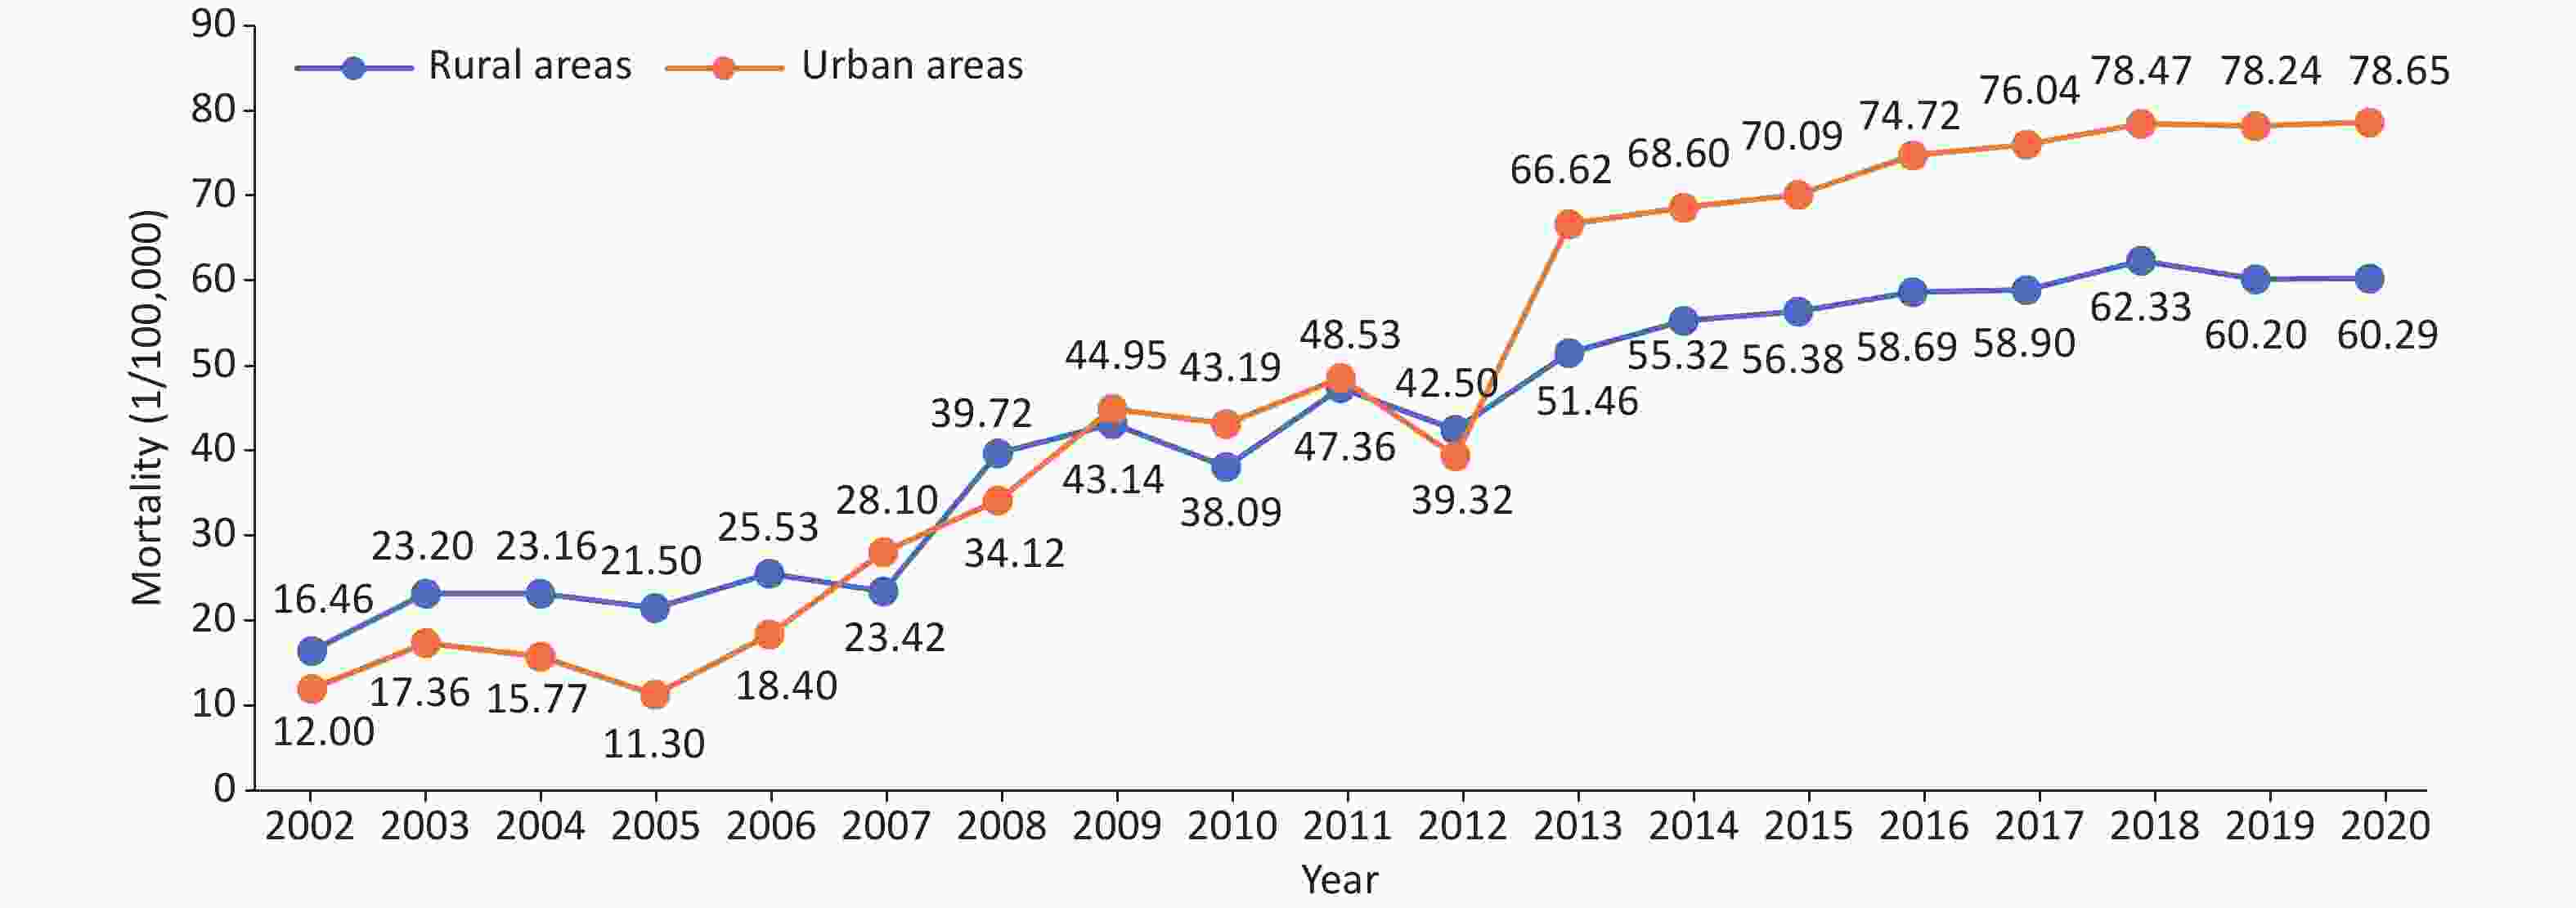
Figure 16. Trends in acute myocardial infarction mortality among urban and rural residents in China from 2002 to 2020.
According to the Fifth National Health Services Survey in China, 2013, the prevalence of CHD among Chinese residents aged ≥ 15 years and > 60 years was 10.2‰ and 27.8‰, respectively. Compared with the fourth survey data in 2008 (7.7‰), the total prevalence increased. There would be 11,396,104 patients with CHD among Chinese residents aged ≥ 15 years. This number was 1.08 million more than the number of patients with CHD across all age groups in 2008, as calculated from data from the Fourth National Health Services Survey[109].
In the China PEACE study, 162 secondary and tertiary hospitals were selected from 31 provinces, autonomous regions, and municipalities in China. In the 10 years from 2001 to 2011, the number of inpatients with ST Elevation Myocardial Infarction (STEMI) increased each year per 100,000 people in China. In the general population, the hospitalization rate for STEMI increased from 3.7/100,000 in 2001 to 8.1/100,000 in 2006 and 15.8/100,000 in 2011[110].
The China Acute Myocardial Infarction Registry (CAMI) study indicated that from 2013 to 2014, the in-hospital mortality of patients with AMI was significantly different in different levels of hospitals in China, with rates of 3.1%, 5.3%, and 10.2% in provincial, city, and county hospitals, respectively[111].
The CAMI study analyzed data from 80 hospitals that admitted ≥ 50 patients with STEMI and were able to provide emergency percutaneous coronary intervention (PCI) from 2013 to 2016. A total of 29,581 patients with STEMI were admitted to these hospitals, and the in-hospital mortality was 6.3%. Combined with the Chinese guidelines for STEMI diagnosis and treatment and the American myocardial infarction quality standard, the comprehensive quality score (OBCS) indicated in-hospital mortality rates of patients with STEMI in lower OBCS (< 71.1%), moderate OBCS (71.1%–76.5%), and higher OBCS (> 76.5%) hospitals of 7.2%, 6.6%, and 5.4%, respectively[112].
The CCC-ACS evaluated the hospital-level application of nine class I management strategies recommended by the Chinese and U.S. guidelines, including 57,560 patients with STEMI admitted to 143 tertiary hospitals nationwide from November 2014 to July 2019. The results showed that the medical quality of STEMI inpatients was not in line with the strategies recommended by the guidelines, and only one-fifth of patients received all the medical treatment of the nine strategies. The medical quality varied greatly among hospitals[113].
A study using CAMI data to assess the benefit of late PCI in infarct-associated coronary arteries 12 h after the onset of STEMI showed that the 2-year incidence of main adverse cardiovascular and cerebrovascular events, all-cause mortality, myocardial infarction, stroke, and revascularization was significantly reduced in patients undergoing PCI compared with drug therapy. Subgroup analysis consistently showed that PCI was superior to drug therapy. After 2 years of follow-up, the left ventricular ejection fraction (LVEF) improved in the PCI group, but not in the drug treatment group. Late PCI is common in clinical practice in China and is associated with significant improvements in cardiac function and survival compared with drug therapy alone[114].
One study analyzed the computed tomography coronary angiography results of 165 patients (680 vessels and 1,505 vascular segments) and found that the average post-processing and interpretation time of artificial intelligence was 2.3 ± 0.6 min per case, which was reduced by 76%, 72%, and 69%, respectively, compared with those with low, medium, and high experience. In the detection of obstructive coronary heart disease, the overall diagnostic sensitivities of artificial intelligence for each patient, each vessel, and each vascular segment were 90.5%, 81.4%, and 72.9%, respectively, and the specificities were 82.3%, 93.9%, and 95.0%, respectively, compared with invasive coronary angiography. The diagnostic performance of artificial intelligence was higher than that of the less experienced manual reading. The diagnostic performance of artificial intelligence combined with manual reading was higher than that of manual reading alone. Artificial intelligence greatly reduces the post-processing time, and artificial intelligence combined with manual reading can significantly improve diagnostic performance compared to mere manual reading[115].
A study investigated the changes in the quality performance of coronary artery bypass grafting (CABG) in hospitals across China years after the implementation of nationally registered quality improvement measures and analyzed the data of 66,971 patients with simple CABG in a cohort study involving 74 tertiary hospitals in China from January 2013 to December 2018. The in-hospital mortality of CABG decreased from 0.9% to 0.6%, the inter-hospital heterogeneity of outcomes after CABG was significantly reduced, and the proportion of evidence-based guidelines to guide surgical procedures and secondary prevention gradually increased[116].
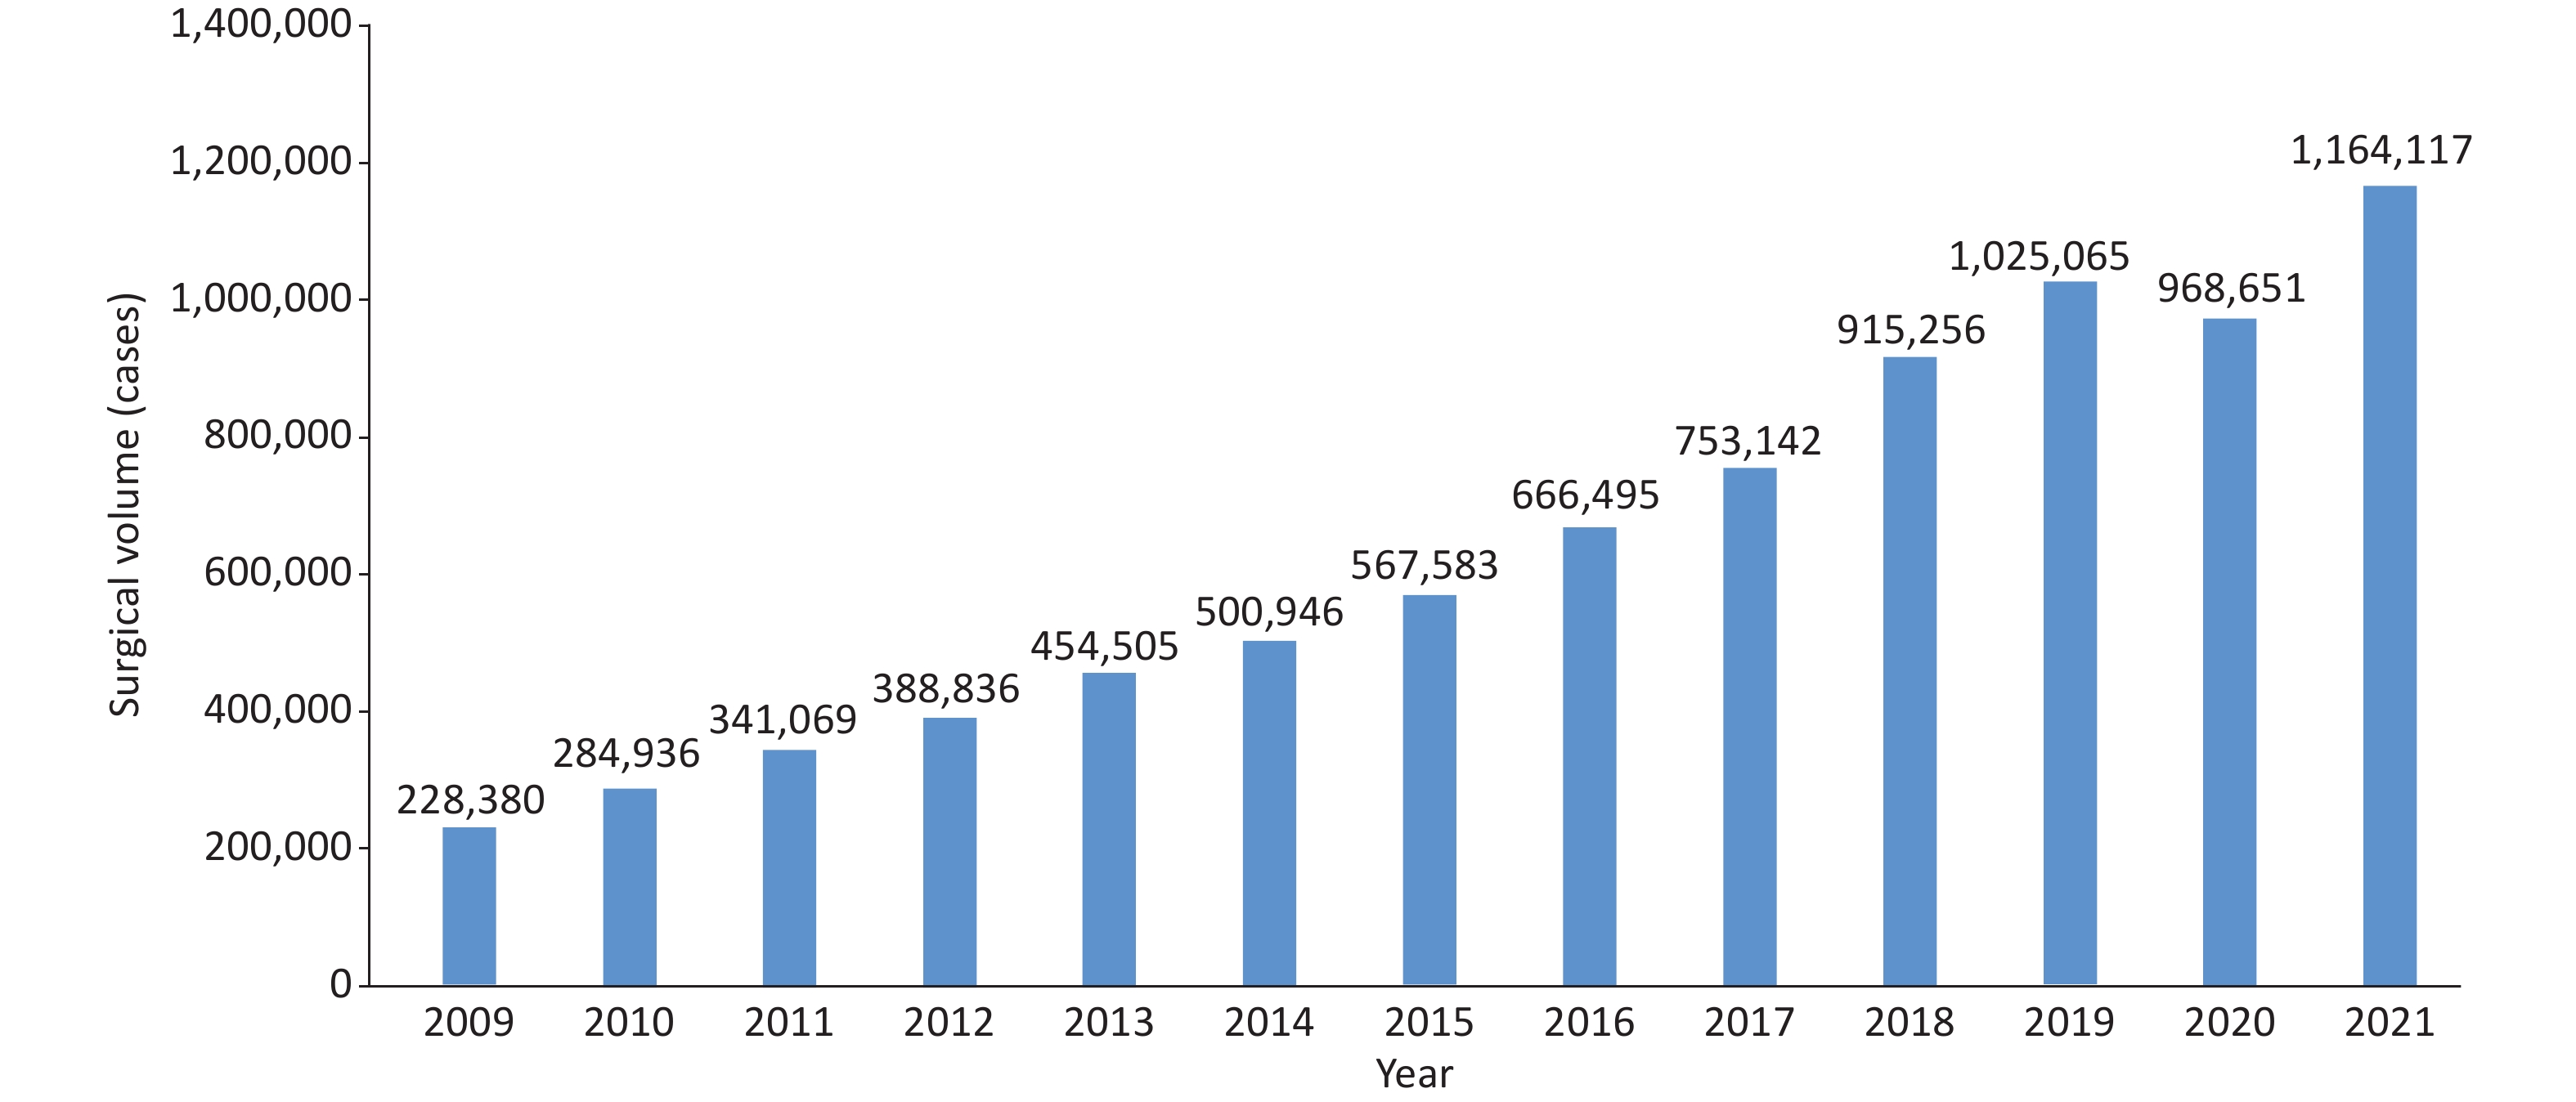
In 2021, the total number of registered cases of coronary intervention in China was 1,164,117 (excluding military hospital cases), an increase of 20.18% compared with that in 2020 (Figure 17). The average number of stent/balloon implants per patient by 2021 is expected to be 1.48. From 2019 to 2021, the utilization rates of drug-coated balloons were 6.4%, 10.9%, and 15.0%, respectively, showing a continuous increase. The surgical mortality has remained consistently low since 2009, at 0.38% in 2021, the same as in 2020.
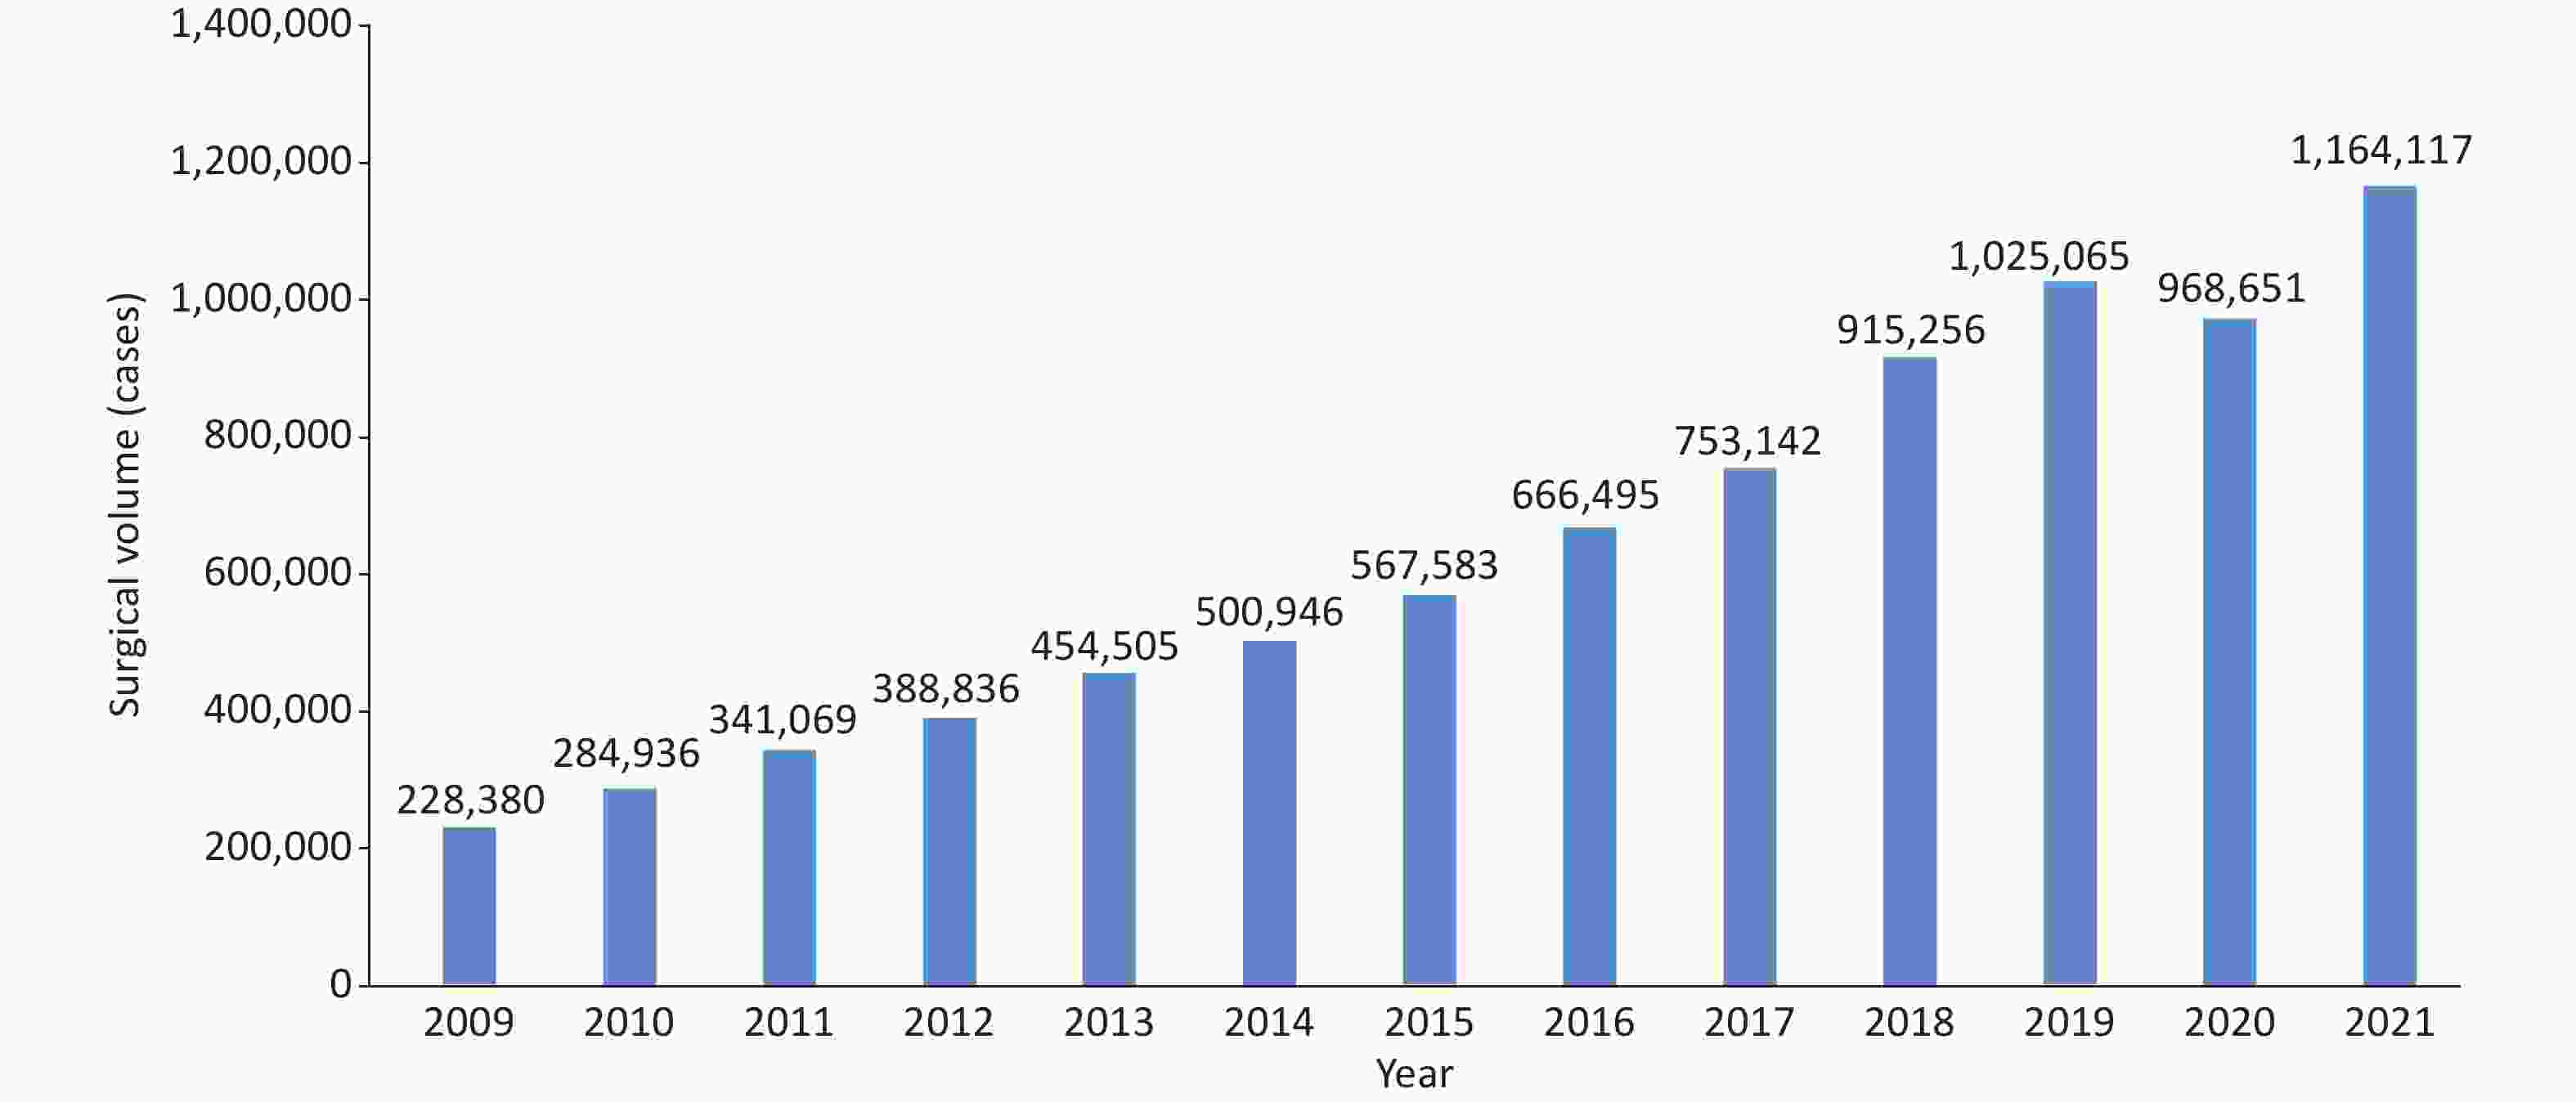
Figure 17. Surgical volume of percutaneous coronary intervention in China from 2009 to 2021.
-
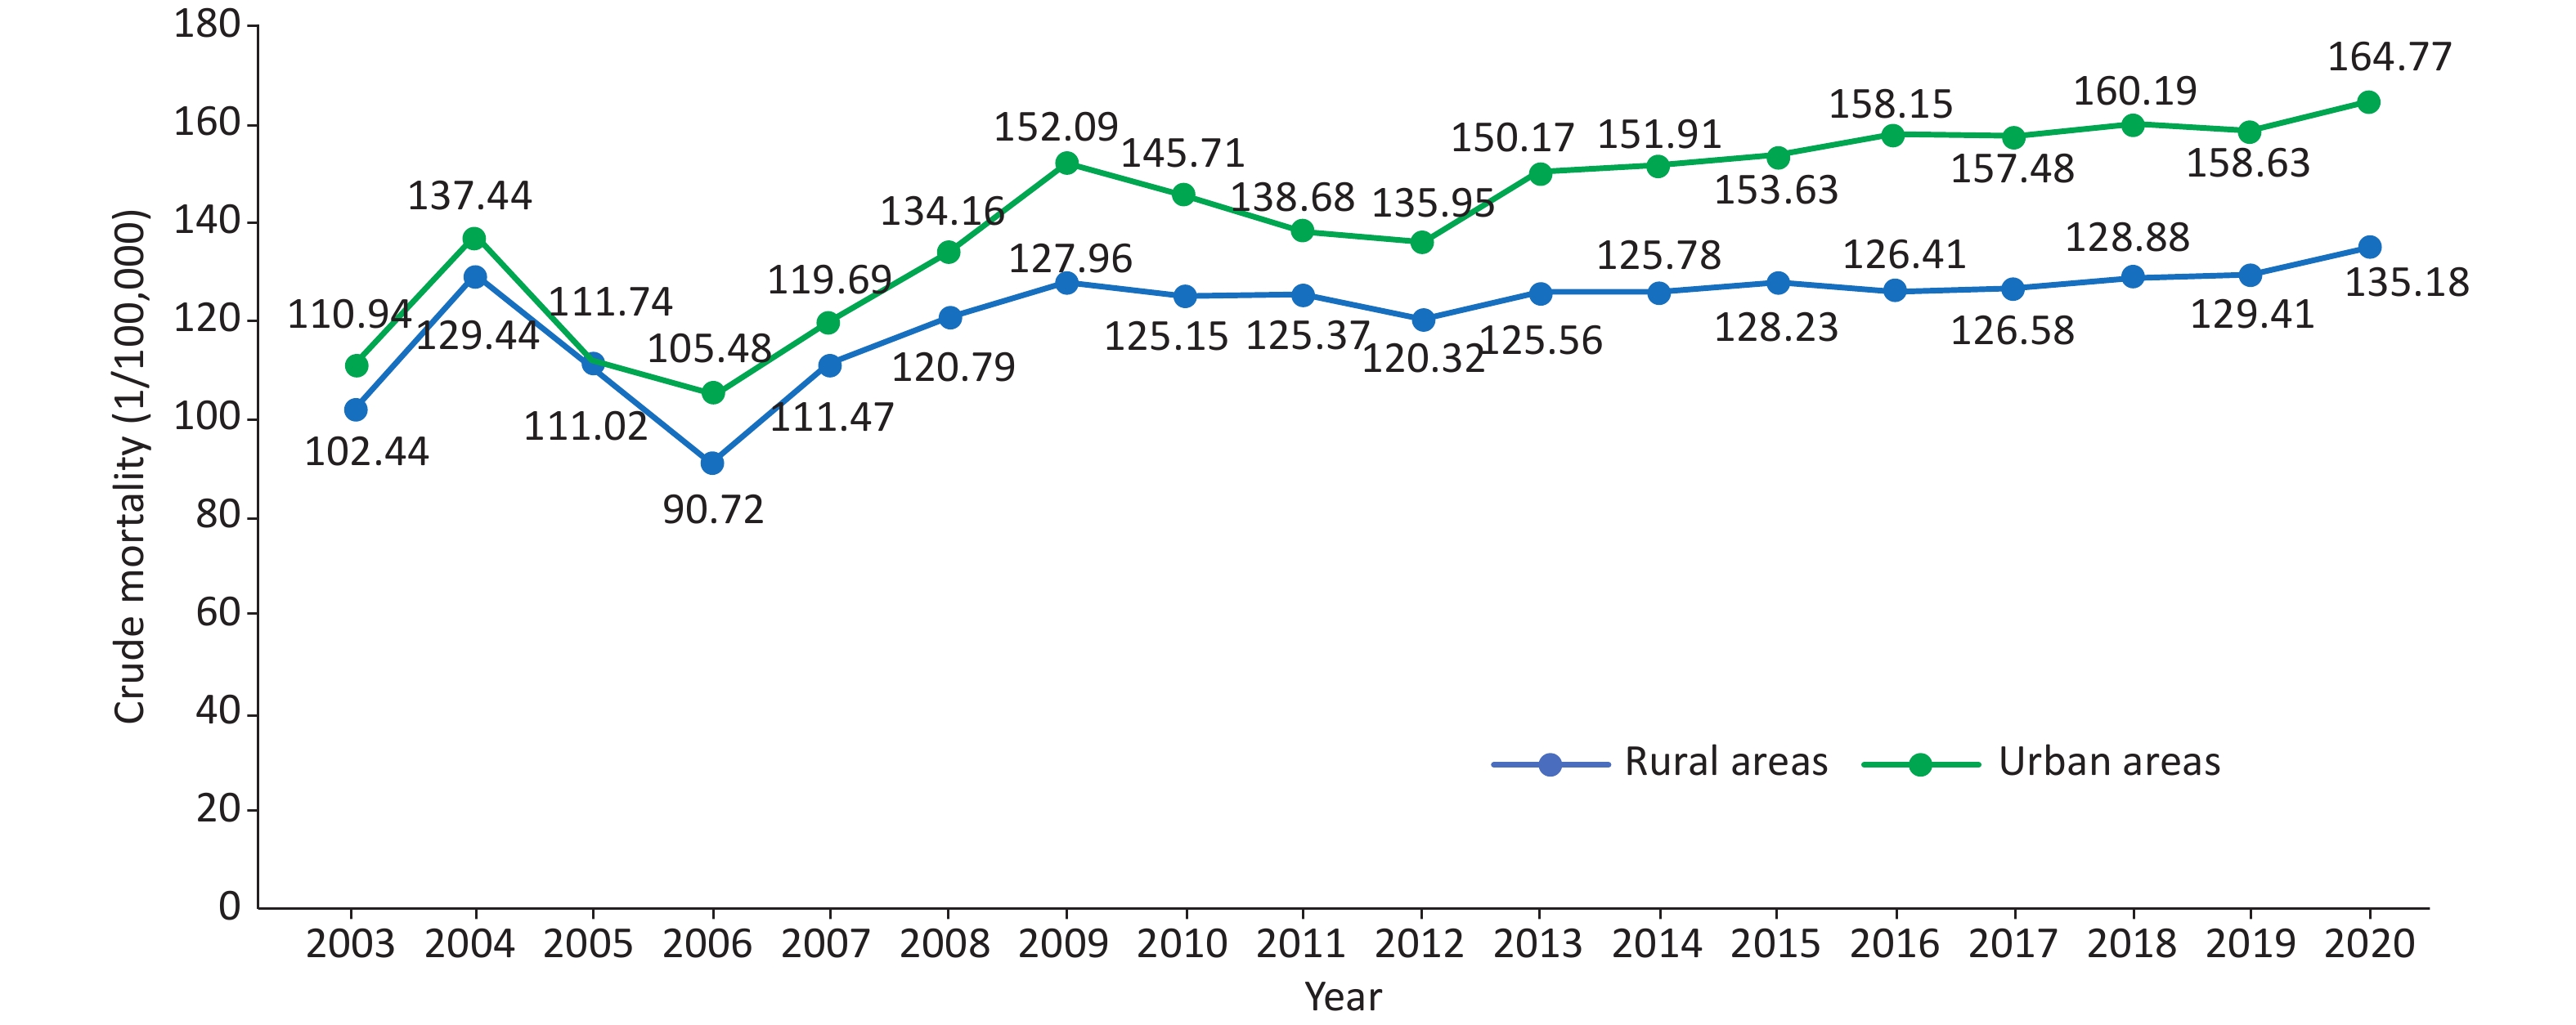
Mortality due to cerebrovascular disease showed an overall increasing trend from 2003 to 2020 (Figure 18). According to the China Health Statistical Yearbook 2021, the mortality of cerebrovascular diseases among urban residents in 2020 was 135.18/100,000, accounting for 21.30% of the total deaths and ranking third among all causes of death, whereas that among rural residents was 164.77/100,000, accounting for 23.53% and ranking second. Mortality due to cerebrovascular disease was higher in men than in women, and higher in rural areas than in cities[108].

Figure 18. Trends of crude mortality of cerebrovascular diseases in urban and rural residents in China from 2003 to 2020.
The GBD 2019 data showed that the total number of stroke incidences in China was 3.9 million, an increase of 124% compared with that in 1990. In 2019, the age-standardized incidence of stroke was 200/100,000, of which that of ischemic stroke was 144/100,000, hemorrhagic stroke was 44/100,000, and subarachnoid hemorrhage was 11/100,000. Compared with 1990, the age-standardized incidence of stroke decreased by 9% in 2019, with ischemic stroke increasing by 35%, and hemorrhagic stroke and subarachnoid hemorrhage decreasing by 53% and 39%, respectively (Table 3)[117-118].
Table 3. The number of cases and age-standardized incidences of different subtypes of stroke and their changes in China in 1990 and 2019
Items Number of incidences
(ten thousand, 95% UI)Variation of the number of incidences
(%, 95% UI)Age-standardized incidence
(1/100,000, 95% UI)Variation of age-standardized incidence
(%, 95% UI)1990 2019 1990 2019 Stroke 170 (150 to 200) 390 (340 to 450) 124 (108 to 129) 221 (196 to 249) 200 (176 to 230) −9 (−16 to −3) IS 80 (70 to 100) 280 (230 to 340) 226 (211 to 243) 107 (89 to 130) 144 (121 to 173) 35 (29 to 40) HS 70 (50 to 80) 80 (70 to 100) 18 (12 to 24) 95 (77 to 113) 44 (37 to 52) −53 (−56 to −50) SAH 10 (10 to 20) 20 (10 to 20) 36 (26 to 45) 18 (15 to 22) 11 (9 to 13) −39 (−44 to −35) Note. HS, hemorrhagic stroke; IS, ischemic stroke; SAH, subarachnoid hemorrhage; 95% UI, 95% uncertain interval. From the GBD 2019 data, the age-standardized prevalence of stroke in China was 1,468.9/100,000, of which ischemic stroke was 1,255.9/100,000, hemorrhagic stroke was 214.6/100,000, and subarachnoid hemorrhage was 81.4/100,000. Compared with 1990, the age-standardized prevalence of stroke in 2019 increased by 13.2%, of which ischemic stroke increased by 33.5% and hemorrhagic stroke and subarachnoid hemorrhage decreased by 31.9% and 21.9%, respectively[91,117].
In 2019, the age-standardized DALY rate of stroke in China was 24,125/100,000, which was 41.6% lower than that in 1990. The age-standardized years of life lost rate decreased by 45.7%, but the age-standardized years lived with disability rate increased by 15.9%[117].
From August 2015 to July 2019, a study used data from 1,006,798 inpatients with stroke or transient ischemic attack from 1,476 hospitals in the China Stroke Center Alliance to evaluate the clinical characteristics of patients and improvements in clinical outcomes. In 2019, the management measures were significantly improved, with the intravenous injection of recombinant plasminogen activator, dysphagia screening, and anticoagulants for AF increasing by 60.3%, 14.7%, and 31.4%, respectively; the rate of in-hospital mortality and non-ordered discharge decreased by 9.7%, and the incidence of complications decreased by 27.1%[119].
Health economics evaluation of delayed endovascular therapy (EVT) for patients with acute ischemic stroke in China indicated that, compared with other time windows, the most cost-effective method is to perform EVT 61–120 min after stroke onset. Compared with 301–360 min after onset, the incremental cost-effectiveness ratio of EVT performed 61–120 min after onset was 16,409 yuan/QALY. For each hour of EVT delay, the average loss was 0.45 QALY and 165.02 healthy days, and the average net economic loss was 15,105 yuan. Early EVT treatment for patients with acute ischemic stroke in China is cost-effective[120].
The prediction results from the combined decision tree and Markov model showed that the CYP2C19 genotype led to an additional 0.031 QALY for antiplatelet therapy in patients with acute mild stroke and high-risk transient ischemic attack, with an incremental cost of 420.13 yuan. The incremental cost-effectiveness ratio for each additional QALY was 13,552.74 yuan. Probabilistic sensitivity analysis indicated the probability of cost-effectiveness of genetic testing as 95.7% if the threshold of willingness to pay was 72,100 yuan/QALY[121].
-
According to the statistics of the online registration system of the National Health Commission and the data reported by the provincial quality control center, 99,306 cardiac pacemakers were implanted nationwide in 2021, representing a 15.2% increase compared to 2020. Clinical research on the feasibility, safety, and effectiveness of Hitchcock Purkinje system pacing, including bundle or left bundle branch pacing, in patients with bradyarrhythmia has rapidly progressed in China. The left bundle branch pacing technology originated in China and has been described in more than 70 academic articles in international journals since 2019.
Leadless pacemakers can reduce lead- and bag-related complications compared with conventional transvenous pacemakers. On February 10, 2015, the Arrhythmia Center of Fuwai Hospital of the Chinese Academy of Medical Sciences completed the first domestic leadless pacemaker implantation. In December 2019, the leadless pacemaker was listed in China. Presently, more than ten domestic centers have implemented this technology.
From 2020 to 2021, a stratified multi-stage sampling study of 114,039 residents from 22 provinces, autonomous regions, and municipalities found that the prevalence of AF in Chinese residents aged ≥ 18 years was 1.6%, with the prevalence in men (1.7%) higher than in women (1.4%); prevalence in rural areas (1.7%) was higher than in urban areas (1.6%), and that in the central regions (2.5%) being higher than in the western (1.5%) and eastern (1.1%) regions[122].
Studies indicated a 24.8% overall prevalence of stroke in Chinese patients with AF, of whom 26.9% were patients with valvular AF and 24.2% were patients with non-valvular AF[123].
The Chinese AF Registration Study included 7,977 patients with non-valvular AF from 32 hospitals from 2011 to 2014, and the results showed that 36.5% and 28.5% of patients with CHA2DS2-VASc scores ≥ 2 and 1, respectively, were treated with oral anticoagulants. Anticoagulants were also used in 21.4% of the patients with 0 points. The treatment rate of anticoagulants ranged from 9.6% to 68.4% in tertiary hospitals and 4.0% to 28.2% in non-tertiary hospitals[124]. A study that investigated the preadmission medication history of patients attending three tertiary hospitals suggested that only 24.41% of patients diagnosed with AF after admission received guideline-compliant anticoagulants[125].
Radiofrequency catheter ablation (RFCA) is widely used in more than 600 hospitals in China. According to data from the National Arrhythmia Intervention Quality Control Center, the number of radiofrequency catheter ablation operations has continued to grow rapidly from 2009 to 2021, with an annual growth rate of 13.2% to 17.5% (Figure 19). In 2021, 210,609 patients with RFCA were included in the direct reporting system for interventional therapy of arrhythmia, an increase of 34% over 2019, and 154 patients with RFCA per million people were treated. The proportion of AF RFCA is increasing every year, and the proportions of AF RFCA in the total RFCA from 2018 to 2021 were 31.9%, 33.0%, 32.2%, and 46.4%, respectively. Circumferential pulmonary vein isolation remained a major procedure, accounting for 60.2% of total ablations[126]. The incidence of periprocedural ischemic stroke was 0.4% and that of intracranial hemorrhage stroke was 0.1%[127].
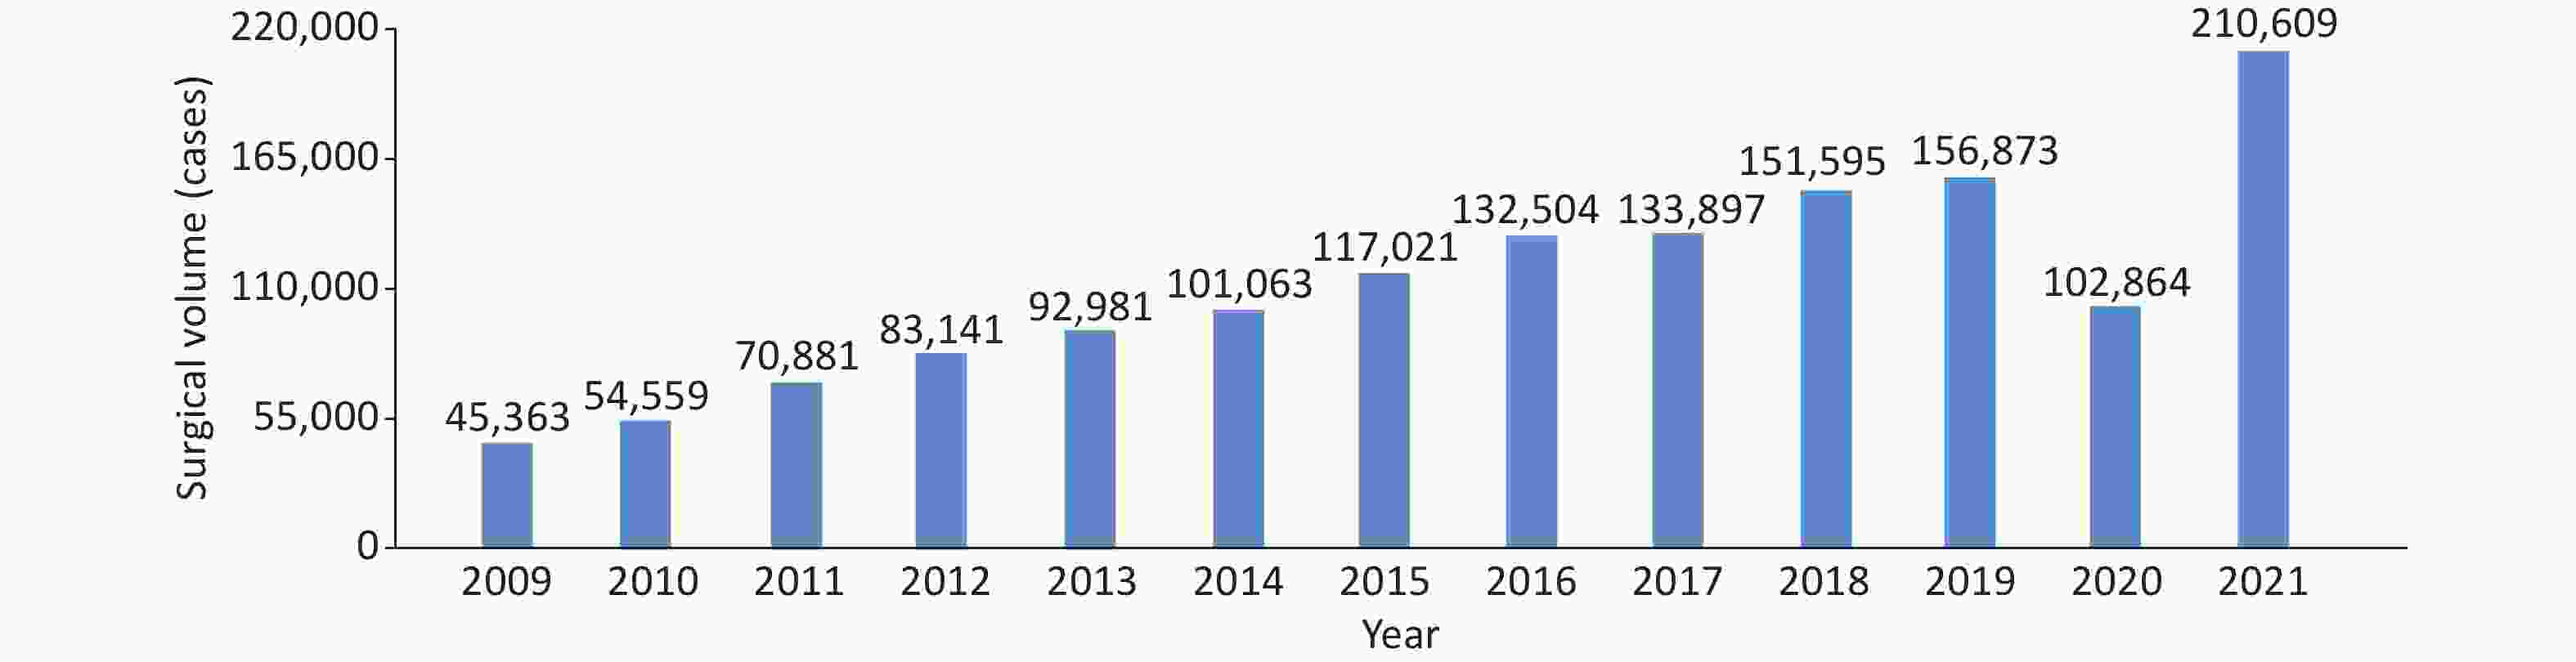
Figure 19. Surgical volume of radiofrequency catheter ablation in China from 2009 to 2021.
A retrospective analysis of the medical records of residents of different ethnic groups (Han, Uyghur, Kazakh, and Hui) in 11 regions of Xinjiang showed that 1,244 of 3,224,103 residents experienced sudden cardiac death (SCD), with a total incidence of 38.6/100,000. Men had a higher risk of SCD than women[128].
In 2021, 6,547 patients with implantable cardioverter defibrillator (ICD) implantation were included in the direct reporting system for interventional therapy of arrhythmias, an increase of 36% over 2020, with four implants per million people. Among them, 2,876 patients (44%) had dual-chamber ICDs.
Among 230 patients with long QT syndrome (LQTS) from ten hospitals in China, LQT1 (KCNQ1 mutation, 37%), LQT2 (KCNH2 mutation, 48%), and LQT3 (SCN5A mutation, 2%) were the main subtypes[129].
An analysis of electrocardiograms of 1,215 students in competitive sports programs at Peking Sport University indicated an early repolarization rate of 35.9%; early repolarization was more common in men, occurred most frequently in inferior wall leads, and mostly showed contusive morphology[130].
Cardiac Contractility Modulation (CCM) is primarily used in patients with chronic HF with a narrow QRS (< 120 ms). On December 30, 2014, the Fuwai Hospital of the Chinese Academy of Medical Sciences successfully performed the first CCM implantation in China. As of May 2016, eight CCM devices have been implanted in five centers nationwide. The 6-month follow-up results demonstrated safety and significant improvements in the patient’s NYHA functional class, 6-min walking distance, and Minnesota Living with Heart Failure score[131].
Predictive results from a discrete event simulation model showed that the average QALY gained for treating paroxysmal AF with antiarrhythmic drugs (AAD) was 4.98, with a gain of 9.63 life years (LY), at an average cost of USD 15,374. Patients receiving second-generation cryoballoon ablation (CB2) had an average QALY gain of 5.92, with 10.74 LY, and an average cost of USD 26,811. The application of a steerable tip ablation catheter (STAI) resulted in an average QALY gain of 6.55, with 11.57 LY, at an average cost of USD 24,722. The incremental cost-effectiveness ratios for STAI versus AAD and CB2 versus AAD were USD 5,927 and 12,167/QALY, respectively. Assuming a willingness-to-pay threshold of USD 30,390/QALY in China, both ablation therapies were more cost-effective than AAD for patients with paroxysmal AF[132].
-
From October 2012 to December 2015, 31,499 residents aged ≥ 35 years underwent echocardiography in a study using a stratified multi-stage random sampling method. A total of 1,309 patients had valvular heart disease (VHD), and the weighted prevalence rate of VHD was 3.8%. Approximately 25 million patients were estimated to have VHD in China. Rheumatic valvular disease remains the main cause of VHD in China, and the number of patients with degenerative valvular disease has increased significantly in recent years. Among Chinese patients with VHD, 55.1% had rheumatic valvular disease and 21.3% had degenerative valvular disease[133].
Researchers from Zhongshan Hospital Affiliation to Fudan University analyzed the data of 325,910 patients who underwent transthoracic echocardiography in the hospital from January 2011 to December 2015. A total of 3,673 patients (1.13%) were diagnosed with bicuspid aortic valve, accounting for 69.1% of men, 58.4% of patients with obvious aortic valve dysfunction, 52.5% of patients with ascending aortic dilatation, and 19.2% of patients with aortic root dilatation[134].
-
Congenital heart disease is the main congenital malformation in China. It ranks first among birth defects in many areas of China. Regional differences exist in the detection rate of congenital heart disease, and the rates vary primarily between 2.9‰ and 16‰.
A meta-analysis of the detection rate and spatial distribution characteristics of neonatal congenital heart disease in China including data on 76,961,354 neonates in 617 studies from 1980 to 2019 indicated that the detection rate of national neonatal congenital heart disease increased from 0.201‰ in 1980–1984 to 4.905‰ in 2015–2019. The detection rate of congenital heart disease increased gradually from the west to the east and decreased gradually from the south to the north[135].
A survey of 122,765 newborns from 12 hospitals in eastern China and six hospitals in western China from August 2011 to November 2012 indicated a 8.98% detection rate of neonatal congenital heart disease in China, with a higher rate in females (11.11‰) than in males (7.15‰)[136].
According to the China Health Statistics Yearbook 2021, in 2020, the mortality rate due to congenital heart disease in urban residents in China was 0.61/100,000, and that in rural areas was higher, at 0.76/100,000[108].
In 2021, according to data from 728 hospitals performing cardiac surgery in China (including Hong Kong) collected by the cardiopulmonary bypass branch of the Chinese Society of Biomedical Engineering, a total of 71,693 patients received surgery for congenital heart disease, accounting for 25.8% of all cardiac and aortic surgeries, and the proportion showed a decreasing trend, the lowest over the years. This decrease might have been associated with the decline in the number of births, annual birth rate, and popularity of prenatal diagnosis and prenatal screening. The number of heart surgeries performed in patients aged < 18 years was 41,985, accounting for 58.6% of the total number of congenital heart disease surgeries in 2021, representing a decrease of 1.5% compared with that in 2020. The adult congenital heart disease correction surgery was increasing each year, accounting for a high proportion of cardiovascular surgeries in China[137].
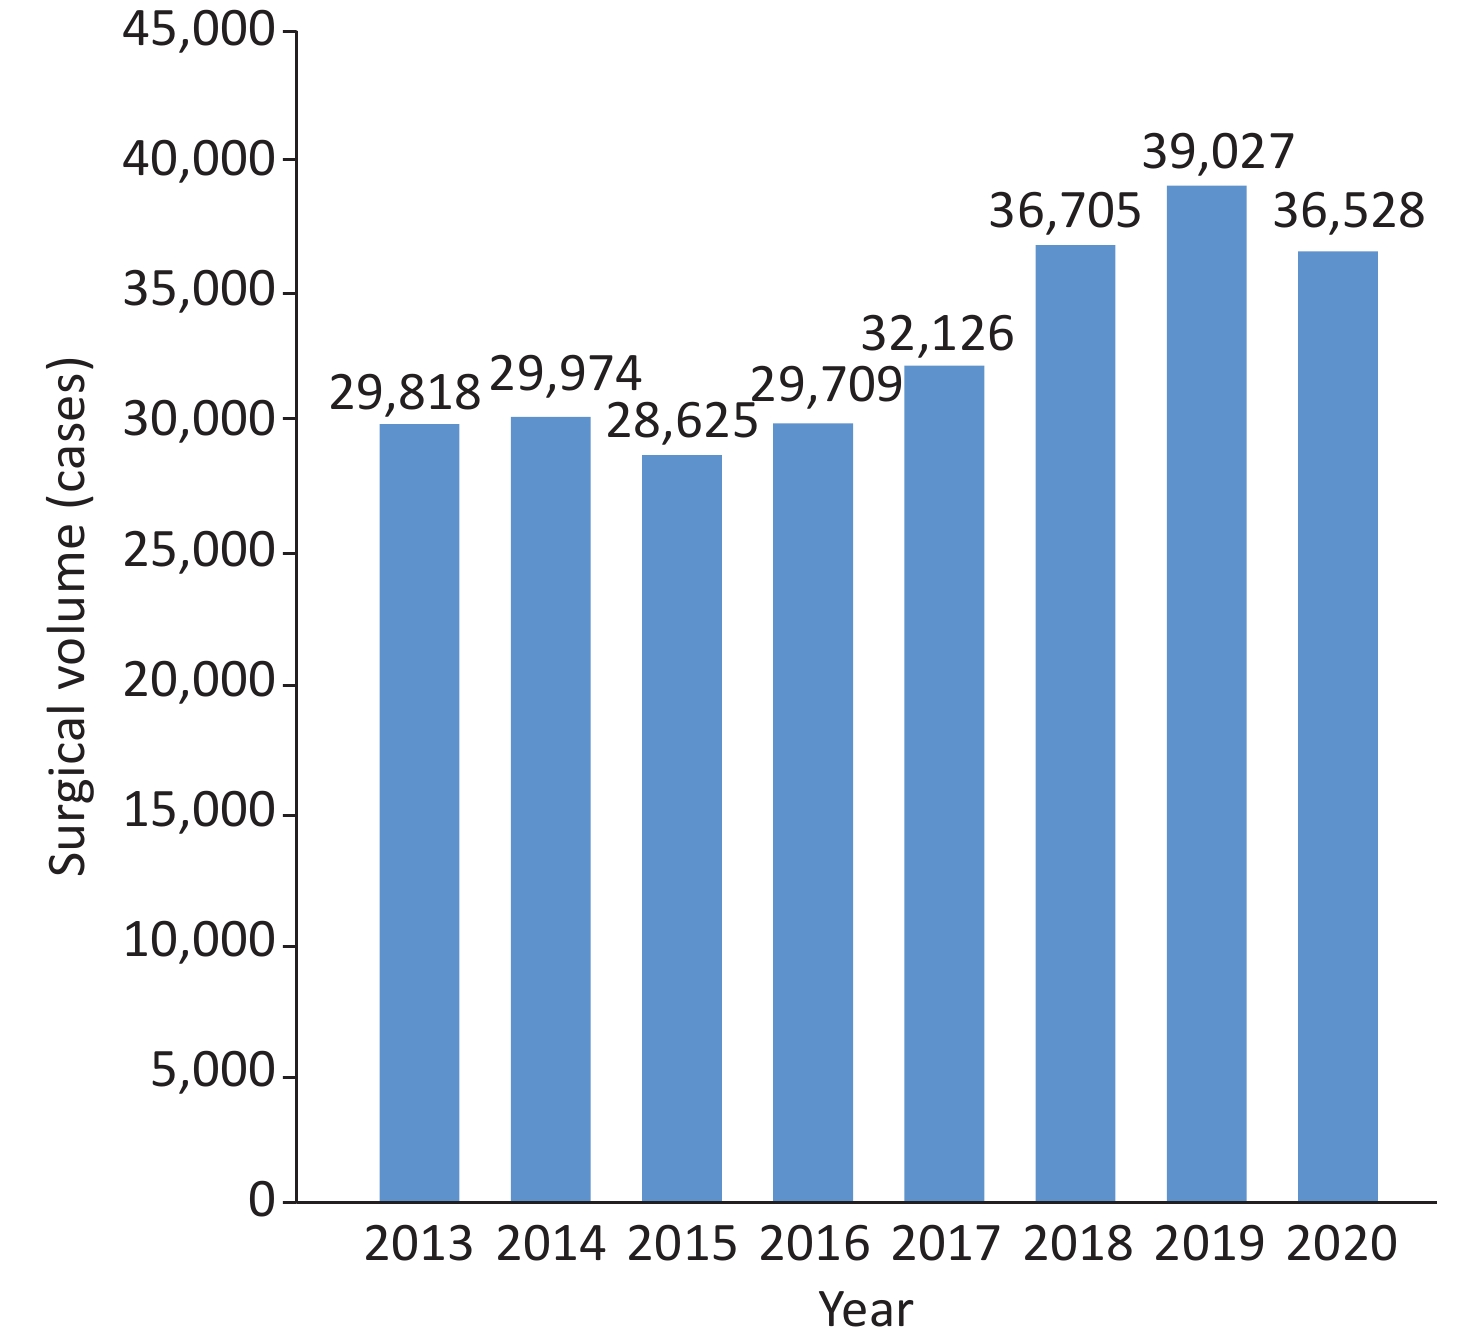
According to the data from the National Cardiovascular Disease Quality Control Information Platform, 36,528 patients with congenital heart disease were treated with interventional therapy in China in 2020 (Figure 20). Among these patients, the overall ordered discharge rate was 97.1%, the in-hospital mortality rate was 0.5%, and the non-ordered discharge rate was 0.8%. The 30-day readmission rate was 1.1%, with no significant changes in 2018 (1.0%) and 2019 (1.3%). The average total medical expenses were 68,601.0 yuan, with increases in 2018 (49,779.8 yuan) and 2019 (57,943.1 yuan)[138].
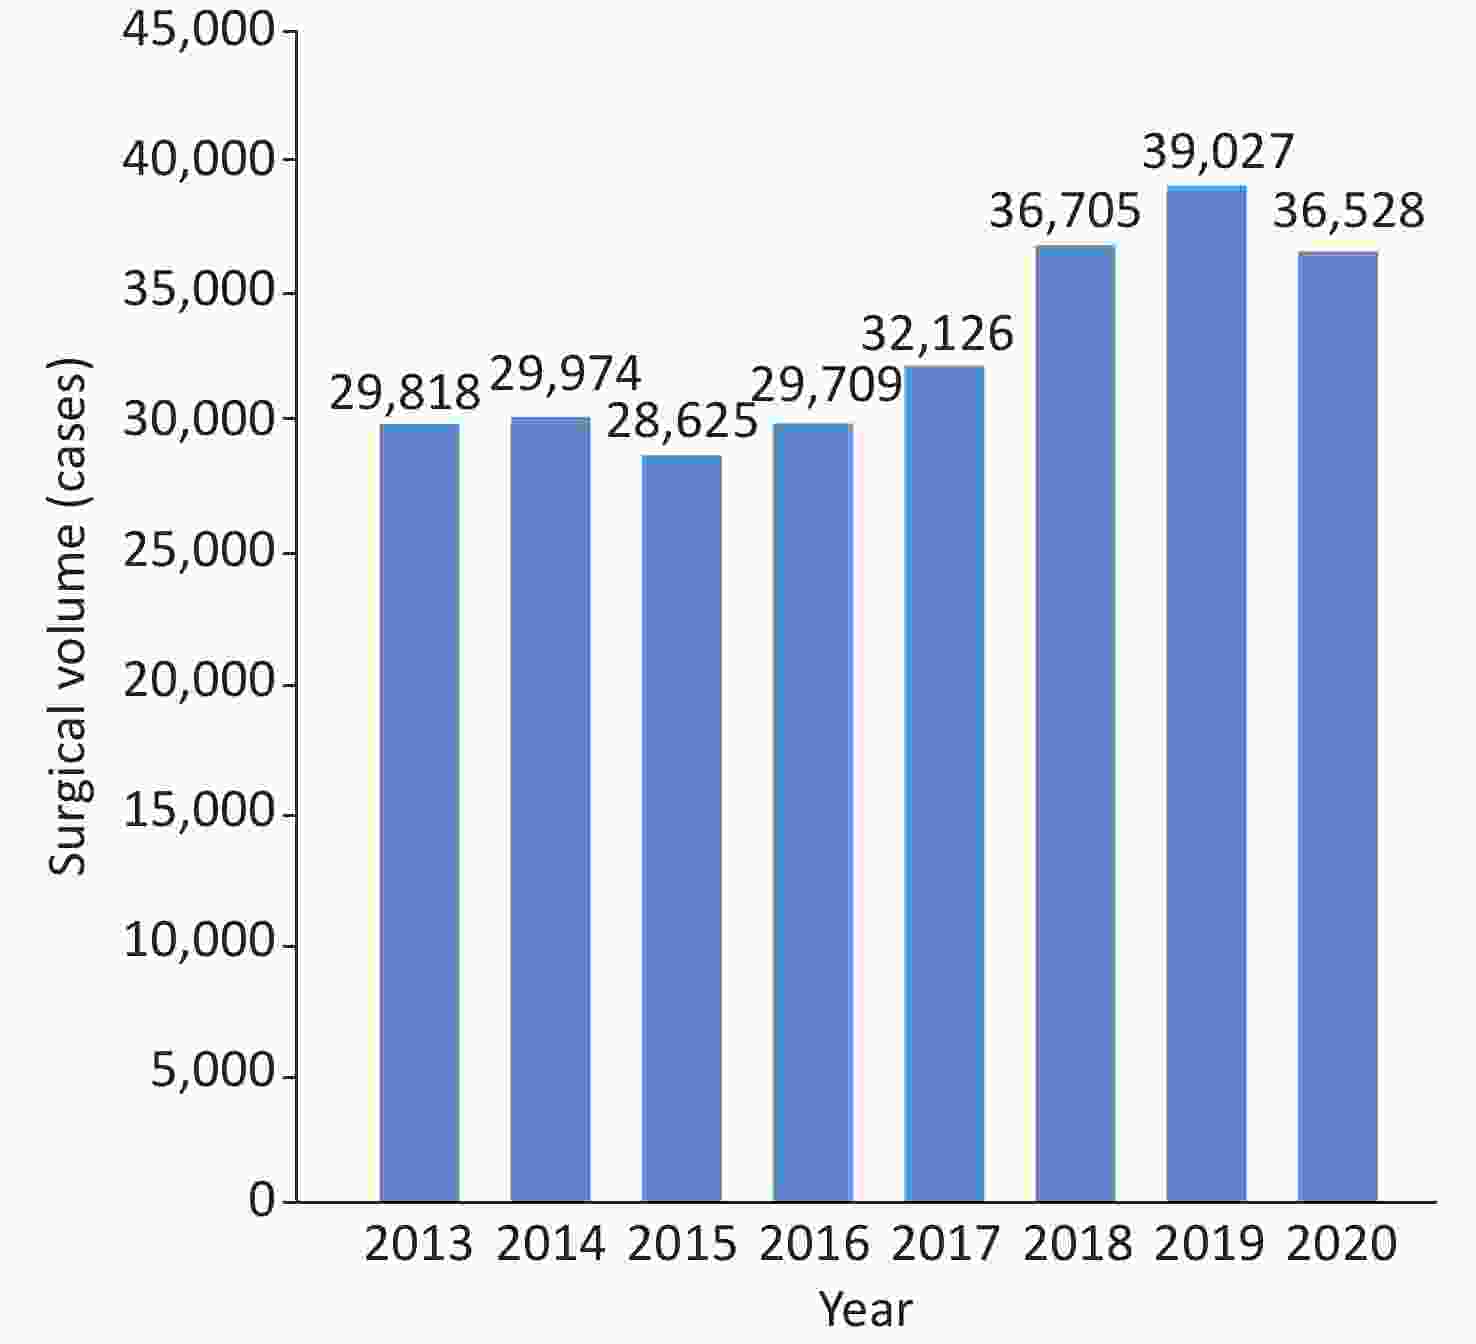
Figure 20. Surgical volume of interventional treatment of congenital heart disease in China from 2013 to 2020.
-
From October 2001 to February 2002, a stratified cluster sampling survey was conducted among 8,080 residents (4,064 men and 4,016 women) in nine provinces and cities in China. The crude prevalence of hypertrophic cardiomyopathy (HCM) was 0.16%. The prevalence of HCM was higher in men (0.22%) than in women (0.10%). After adjusting for age and sex, the prevalence was 80/100,000. Based on these data, more than 1 million adult patients were estimated to have HCM in China[139].
According to the above survey of nine provinces (regions), the prevalence of dilated cardiomyopathy (DCM) in China was 19/100,000[140]. From July 2011 to December 2011, 49,751 residents were investigated in 120 villages in the non-Keshan disease areas of seven provinces in northern China. Six DCM cases were detected and the estimated prevalence was 1.2/10,000[141].
The Chinese Society of Cardiology analyzed 10,714 patients with HF from 42 hospitals in China in 1980, 1990, and 2000, and found DCM proportions were 6.4%, 7.4%, and 7.6%, respectively[142].
A survey by the Cardiovascular Group of the Pediatric Branch of the Chinese Medical Association reported that a total of 4,981 children with cardiomyopathy were admitted to 33 hospitals in China from July 2006 to December 2018, accounting for 0.079% (4,981/6,319,678) of pediatric hospitalized children in the same period. DCM accounted for the most cases (1,641 [32.95%]), followed by endocardial fibroelastosis (1,283 [25.76%]), and left ventricular non-compaction (635 [12.75%]). The overall number of inpatients is increasing each year[143].
A retrospective longitudinal cohort study covering three large tertiary medical centers in China included 564 inpatient children with HCM from 2010 to 2019. During a median follow-up of 2.6 years, 149 children (26.4%) died; the main cause of death was HF. The survival probabilities at 5 and 10 years were 71.1% and 57.1%, respectively. Among them, children with inborn metabolic defects diagnosed with HCM in infancy had the worst prognoses, and the 5-year estimated survival rates were 16.9% and 56.0%, respectively[144].
In a domestic study, 529 patients with HCM were subjected to gene detection. Definite pathogenic mutations were detected in 43.9% of the patients, and MYH7 and MYBPC3 genes were the most common mutations[145]. In 2020, a study at the Fu Wai Hospital of the Chinese Academy of Medical Sciences found that common genetic variants are also important contributors to the development of HCM, suggesting a non-Mendelian inheritance pattern with ethnic specificity[146].
Arrhythmogenic cardiomyopathy (ACM) is mainly caused by mutations in the gene encoding desmoglein. Domestic studies have shown that pathogenic mutations can be detected in 63.3% of patients with ACM, of which PKP2 was the most common[147]. The founder mutation p.Phe531Cys of the homozygous DSG2 gene was found to be a risk factor for ACM in China, which was at a frequency of 8.47% with full penetrance[148]. Homozygous c.245G > A/p.G82D mutation in the patatin-like PNPLA2 gene is associated with the phenotypic penetrance of ACM[149].
In 2022, Chinese scholars analyzed metabolic profiles of myocardial tissue and plasma of patients with HCM through metabolomics and lipidomics, combined with machine learning algorithms to accurately diagnose HCM and predict the prognosis of such patients; they found three types of HCM metabolic subtypes with different cardiac functions and prognoses using a consistent clustering method. Finally, pentose phosphate and the redox pathway were proposed as potential therapeutic targets for HCM by integrating the metabolome and proteome data[150].
-
A survey among 15,518 residents from 20 cities and rural areas in China showed that the prevalence of chronic HF was 0.9% in the population aged 35–74 years in 2000. It is conservatively estimated that there are approximately 4 million patients with chronic heart failure in China[151].
From 2012 to 2015, CHS analyzed 22,158 participants and found that the prevalence of HF was 1.3% among adults aged ≥ 35 years. The prevalence of left ventricular systolic dysfunction (LVEF < 50%) was 1.4%, and that of moderate/severe diastolic dysfunction was 2.7%[152].
The China-HF study enrolled 13,687 patients with HF from 132 hospitals in China from January 2012 to September 2015, and the in-hospital mortality was 4.1%[153].
In the China Heart Failure Medical Quality Control Report in 2020, an analysis of 33,413 HF patients with recorded hospital outcomes, who were treated at 113 hospitals nationwide from January 2017 to October 2020, indicated a mortality of 2.8% among hospitalized patients[154].
From January 2011 to September 2012, 3,335 patients with acute HF in 14 hospitals in Beijing were followed up for 5 years. The 5-year all-cause mortality rate was 55.4%, the CVD mortality rate was 49.6%, and the median survival time was 34 months[155].
According to the China Heart Failure Medical Quality Control Report in 2020, the average age of patients with HF was 67 ± 14 years and 60.8% were men. The incidence of valvular disease in patients with HF has decreased annually. Hypertension (56.3%) and CHD (48.3%) were the main causes of HF in China. Infection is the primary cause of HF, followed by myocardial ischemia and fatigue. HF with decreased ejection fraction, intermediate ejection fraction, and preserved ejection fraction accounted for 40.2%, 21.8%, and 38.0%, respectively[154].
The overall usage rate of diuretics in hospitalized patients with HF in China has not changed significantly. The usage rate of digoxin showed a downward trend owing to the influence of international clinical studies. In the meantime, the usage rate of aldosterone receptor antagonists and β-receptor blockers has increased significantly. The overall usage rate of renin-angiotensin system blockers showed an upward trend, but because of the advent of angiotensin receptor enkephalinase inhibitors, the usage rate of angiotensin-converting enzyme inhibitors and angiotensin II receptor antagonists has decreased[154].
According to statistics from the online registration system of the National Health Commission of China and data reported by the provincial quality control center, the number of cardiac resynchronization therapy (CRT) implants in 2021 was 5,333, representing an increase of 37% compared to that in 2020. The number of implants per million people was 3.6. Among them, the proportion of cardiac resynchronization treatment defibrillator (CRT-D) implants has increased annually, accounting for 66% in 2021.
According to data from the China Heart Transplantation Registration System, 66 medical institutions in China were qualified to perform heart transplantations as of 2021. From 2015 to 2021, the annual numbers of heart transplant procedures implemented and reported by transplantation centers in China were 279, 368, 446, 490, 679, 557, and 738, respectively. A total of 3,557 procedures were completed and reported in 7 years.
In 2021, non-ischemic cardiomyopathy was reported 75.2% of heart transplant recipients in China and 80.3% of pediatric heart transplant recipients. The in-hospital survival rate among Chinese heart transplant recipients was 91.0%, and multiple organ failure and transplant HF accounted for > 40% of early causes of death. From 2015 to 2021, the 1-year survival rate after heart transplantation in China was 85.4%, and the 3-year survival rate was 79.9%. The 1-year and 3-year survival rates after heart transplantation in adults were 85.1% and 79.5%, respectively, and those in children were 89.7% and 84.8%, respectively.
-
The results from the largest nationwide, multicenter, prospective Pulmonary Arterial Hypertension (PAH) registry study in China revealed that congenital heart disease was the most common cause of PAH in the country. From August 2009 to December 2019, 2,031 patients with PAH were enrolled in 34 tertiary hospitals across 31 provinces, autonomous regions, and municipalities in China, with an average age of 35 ± 12 years. Women accounted for 76.2% of the patients, and 45.2% had PAH associated with congenital heart disease (PAH-CHD). Idiopathic PAH (IPAH) accounted for 38.8%, connective tissue disease-associated PAH (PAH-CTD) accounted for 13.1%, and other subtypes of PAH accounted for 3.0%[156].
According to the data from the Chinese systemic lupus erythematosus (SLE) treatment and research group in 2014, with PH defined as a resting pulmonary artery systolic pressure ≥ 40 mmHg, as measured by echocardiography, the prevalence of PAH was 3.8% (74/1,934) in patients with SLE[157].
Before 2006, no targeted drugs for PAH were available in China. The 1-, 3-, and 5-year survival rates of IPAH and familial PAH were 68.0%, 38.9%, and 20.8%[158], respectively. In the era of targeted drugs, the survival status of IPAH has improved significantly, with 1- and 3-year survival rates of 92.1% and 75.1%, respectively[159].
From January 2007 to January 2019, a nationwide multicenter observational study included 140 patients with Takayasu arteritis-associated pulmonary hypertension (TA-PH), with an average age of 41.4 years. Women were more affected (81%), and the 1-, 3-, and 5-year survival rates were 94.0%, 83.2%, and 77.2%, respectively[160]. For patients with TA-PH found suitable anatomy for percutaneous pulmonary artery intervention, percutaneous pulmonary artery balloon angioplasty reduced the risk of death by 82% (HR = 0.18) and was found to be safe. This suggested that percutaneous pulmonary artery angioplasty could be an effective treatment option for some TA-PH patients[161].
-
A registry-based study conducted in Hong Kong, China, from January 2004 to December 2016 included 2,214 hospitalized patients with newly diagnosed venous thromboembolism (VTE). Among them, 1,444 (65.2%) had deep vein thrombosis (DVT), and 770 (34.8%) had pulmonary embolism (PE). Over a span of 13 years, VTE incidence showed a significant increase from 28.1/100,000 person-years to 48.3/100,000 person-years[162].
In a study on VTE hospitalization and mortality rates in China, 105,723 patients with VTE were enrolled from 90 hospitals in China from January 2007 to December 2016. Of the cases, 43,589 (41.2%) were PE combined with DVT, and 62,134 (58.8%) were simple DVT. The age- and sex-adjusted hospitalization rate increased from 3.2/100,000 in 2007 to 17.5/100,000 in 2016. The in-hospital mortality rate decreased from 4.7% in 2007 to 2.1% in 2016, and the length of hospital stay decreased from 14 to 11 days[163].
In the China PE registration study from 2009 to 2015, a total of 7,438 adult hospitalized patients with acute symptomatic PE treated at medical institutions in 31 provinces, autonomous regions, and municipalities were included. High-risk (hemodynamic instability), moderate-risk (simplified PE severity index [sPESI] ≥ 1), and low-risk (sPESI = 0) patients accounted for 4.2%, 67.1%, and 28.7%, respectively. CT pulmonary angiography was the most commonly used diagnostic method (87.6%), and anticoagulation therapy was the most commonly used initial treatment method (83.7%). The proportion of initial systemic thrombolytic therapy decreased from 14.8% to 5.0%, and the mortality of acute PE decreased from 3.1% to 1.3%[164].
The Dissolve-2 study enrolled a total of 13,609 patients (6,623 from internal medicine departments and 6,986 from surgical departments) who were hospitalized for more than 72 h because of medical or surgical emergencies from 60 tertiary hospitals in China between March and September 2016. According to the ninth version of the CHEST guidelines, medical inpatients were divided into low-risk (63.4%) and high-risk (36.6%) groups, and surgical inpatients were divided into low-risk (13.9%), moderate-risk (32.7%), and high-risk (53.4%) groups according to the risk of VTE. The main VTE risk factor for surgical inpatients was open surgery (52.6%), whereas that for medical inpatients was acute infection (42.2%). The proportion of all patients receiving preventive measures recommended in the ninth version of the CHEST guidelines was 14.3% (19.0% of surgical patients and 9.3% of medical patients), whereas 10.3% (11.8% of surgical patients and 6.0% of medical patients) received appropriate preventive measures[165].
-
Based on the medical insurance data of more than 300 million urban residents in China from 2015 to 2016, the annual incidence of acute aortic dissection in mainland China was approximately 2.78/100,000 and was significantly higher in men than in women (3.96/100,000 vs. 1.59/100,000)[166]. The results of a domestic registration study of aortic dissection (Sino-RAD) indicated that the average age of Chinese patients with aortic dissection was approximately 51.8 years, an age approximately 10 years lower than that in Europe and America[167-168].
Sino-RAD showed that for type A aortic dissection, the rate of open surgery treatment was 89.6%, drug treatment was 7.8%, endovascular treatment was 1.4%, hybrid treatment was 1.2%, and in-hospital mortality was 5.5%[169]. For type B aortic dissection, the rate of drug therapy alone was 21.3%, and the mortality was 9.8%. Surgical treatment and mortality rates were 4.4% and 8.0%, respectively. The intracavitary treatment rate was 69.6% and the mortality rate was 2.5%[170].
From 2009 to 2019, the Sino-RAD study used a multicenter, case-crossover design and included 8,182 patients with acute aortic dissection from 14 tertiary hospitals in 11 cities in China. The study found that the risk of aortic dissection increased as the temperature decreased, and there was a statistically significant difference when the mean temperature was below 24 °C. Compared to 28 °C, the risk of aortic dissection increased by 1.84 times and 1.36 times at −10 °C and 1 °C, respectively. Compared to no change in temperature, a temperature decrease of 7 °C within the subsequent 6 days increased the cumulative risk of aortic dissection by 1.66 times[170].
Different types of aortic dissection require different surgical methods, and their hospitalization days and costs were also different. According to the HQMS, in 2021, the average stay length of thoracic endovascular aneurysm repair surgery in China was 15.5 days, and the average hospitalization cost was 170,600 yuan. The average length of stay for simple graft replacement of the ascending aorta with an aortic valve (Bentall surgery) was approximately 22.1 days, and the average hospitalization cost was 215,500 yuan. The average length of stay for patients undergoing total aortic arch replacement was approximately 21.5 days, and the average hospitalization cost was 273,100 yuan.
Screening of 5,402 people aged ≥ 40 years with relevant risk factors in three cities and two rural communities in central China indicated a prevalence of abdominal aortic aneurysm of 0.33% in people aged 55–75 years, a value higher than those in the other age groups (0.51% vs. 0.11%)[171]. A cross-sectional survey conducting abdominal aortic ultrasound screening on a total of 3,560 people aged > 60 years in four cities in Liaoning reported a positive detection rate of abdominal aortic aneurysm of 0.9%[172].
According to the HQMS, in 2021, the average length of stay for abdominal aortic prosthesis replacement surgery in China was 23.1 days, and the average hospitalization cost was 151,500 yuan. The average length of stay for endovascular abdominal aortic repair (EVAR) was 13.1 days, and the average hospitalization cost was 188,300 yuan.
The HQMS data have shown an increasing trend in the number of both intravascular and open surgical procedures for aortic diseases in China in recent years. From 2017 to 2021, the number of intravascular surgical cases included in the HQMS increased from 21,320 to 46,651 (118.8% increase), Bentall procedures increased from 3,105 to 5,901 (90.0% increase), and total arch replacement procedures increased from 3,707 to 9,400 (153.6% increase).
From 2017 to 2021, the in-hospital mortality for TEVAR procedures in the HQMS decreased from 2.0% to 1.3%, with that for EVAR procedures decreasing from 1.7% to 1.3%. The rate of in-hospital mortality and non-medically ordered discharge for TEVAR procedures decreased from 4.9% to 4.0%, and that for Bentall procedures from 4.4% to 2.5%. The in-hospital mortality of Bentall surgery is 1.5%–1.9%, and that of total arch replacement surgery is 5.9%–7.4%. The rate of in-hospital mortality and non medical leave of EVAR are 3.7%–3.9%, and that for total arch replacement surgery ranged from 11.2% to 14.6%.
-
A stratified random sampling survey in mainland of China indicated a 6.6% prevalence of lower extremity arterial disease (LEAD) in the general population aged ≥ 35 years. Based on these data, the number of patients with LEAD in China has been inferred to be approximately 45.3 million. Among them, 1.9% of the patients received revascularization. A total of 860,000 patients in China have been estimated to receive revascularization[173]. The prevalence of LEAD in patients with type 2 diabetes can reach up to 21.2%[174].
-
The results of carotid ultrasonography in 106,918 urban and rural community residents aged ≥ 40 years were collected and analyzed in the Chinese Stroke Prevention Program. The data showed that the prevalence of moderate and above carotid stenosis was 0.5%[175].
A cross-sectional study conducted from 2017 to 2019 at two tertiary hospitals in northern and southern China's health management centers included 38,642 participants with a median age of 46 years. The prevalence of carotid atherosclerotic disease (CASD) was 30.0%[176]. In a screening of 9,215 individuals (mean age of 60 ± 9 years) at high risk of stroke conducted in eight community hospitals in Beijing, the prevalence of CASD was as high as 74.7%[177].
According to the China Stroke Prevention and Control Report in 2020, the number of reported cases of carotid endarterectomy in 2019 was 6,600, and 18,649 carotid artery stenting procedures were performed[178].
-
An inter-arm systolic blood pressure difference ≥15 mmHg is a powerful index for predicting subclavian artery stenosis (SCAS) > 50% and can be used for epidemiological screening and diagnosis of SCAS. A study of 3,133 older people aged ≥ 60 years in a community in Shanghai indicated that 1.8% of the population had an inter-arm systolic pressure difference ≥ 15 mmHg[179]. A single center study has investigated the etiological composition of SCAS in hospitalized patients and found that AS accounted for 95.9% in patients above 40 years of age, whereas the main cause in patients younger than 40 years of age was Takayasu arteritis (90.5%)[180].
-
Mesenteric Arterial Disease (MAD) includes stenosis/occlusion or thrombosis of the abdominal aorta, superior mesenteric artery, or inferior mesenteric artery. Epidemiological data on MAD were lacking, but clinical observations have shown a high rate of underdiagnosis, misdiagnosis, and high mortality for acute or chronic MAD. A meta-analysis of case reports on mesenteric arterial embolism and thrombosis from 1994 to 2006 revealed a misdiagnosis rate of 61.3% and a mortality rate of 60.6% among 111 confirmed cases[181]. Another meta-analysis of the literature on the misdiagnosis of ischemic bowel disease from 1998 to 2008 found a misdiagnosis rate of 63.4% (312/492)[182].
-
A single-center study involving 2,905 patients with renal artery stenosis (RAS) over 18 years found that the main causes of RAS in the Chinese population were artery stenosis (82.4%), arteritis (11.9%), and fibromuscular dysplasia (4.3%). Artery stenosis increased from 50% in 1999–2000 to 85% in 2015–2016. Non-artery stenosis causes were more common in patients younger than 40 years[183].
-
A large cohort study of 710,000 patients reported that 18% of patients with cancer had CVD risk factors or CVD. 13% of patients with cancer had at least one CVD risk factor and 5% had one type of CVD. After adjustment for age, sex, tumor stage, and treatment received, patients with cancer in addition to HF had the poorest prognosis, with a 79% increase in all-cause mortality, followed by myocardial infarction, with a 50% increase in all-cause mortality[184].
-
In 2016, a survey on the current situation of cardiac rehabilitation work in hospitals across the country included 124 tertiary hospitals in seven regions of mainland China. Only 30 (24%) hospitals provided cardiac rehabilitation services, and only 2.2 hospitals with an average population of 100 million were able to perform cardiac rehabilitation. Among the 13 hospitals that completed 36 surveys and performed cardiac rehabilitation, 3 (23%) performed in-hospital phase I rehabilitation, 3 (23%) performed phase II rehabilitation, and 7 (54%) performed stage I and stage II rehabilitation simultaneously[185].
-
The number of rehabilitation beds in Chinese medical institutions was increasing. In 2020, the total number of rehabilitation beds in national hospitals was 246,907[108]. The number of rehabilitation professionals was also increasing. A 2009 survey reported the presence of 16,000 rehabilitation physicians, 14,000 rehabilitation therapists, and 12,000 rehabilitation nurses. By 2018, the number of rehabilitation physicians had increased to 38,000, and the number of rehabilitation nurses had increased to 15,000[186-187].
Early rehabilitation improves neurological function in patients with acute ischemic stroke. Research indicates that compared to early rehabilitation (within 72 h to 7 days after onset), super-early rehabilitation (within 72 h) for patients with ischemic stroke resulted in significant increases in the National Institutes of Health Stroke Scale and Fugl-Meyer Assessment (FMA) scores at 1 and 3 months after onset[188]. Another study showed that rehabilitation therapy started between 24 and 48 h after stroke onset, compared to therapy started between 72 and 96 h, led to lower modified Rankin Scale scores at 90 days, and significantly improved FMA scores in the lower limbs during the first week after stroke onset[189].
A study of 82 patients with cerebral hemorrhage showed that early intervention training from 2 to 7 days after the onset of the disease was more conducive to the improvement of motor function, neurological function, and activities of daily living compared with rehabilitation training from 3 to 4 weeks after the onset of the disease[190].
-
Basic research on high-level CVD in China began in 2005, with influential papers published in two major journals, Circulation and Circulation Research. Data from Cell, Nat Med, Circulation, J Am Coll Cardiol, Eur Heart J, Circ Res, and Nat Commun havedemonstrated the rapid development of high-level basic research on CVD in China in recent years (Figure 21).

Figure 21. Basic research papers on cardiovascular diseases published by the first author/corresponding author in China over the years.
From August 2021 to August 2022, 74 basic research articles with the first and corresponding authors from Chinese institutions were published on heart and vascular anatomy, development, and functional pathogenesis, involving AMI, HF, ischemia-reperfusion, cardiomyopathy, cardiac remodeling, myocarditis arrhythmia, aneurysm/dissection, atherosclerosis, and vascular remodeling. The main research topics included heart protection and regeneration, single-cell sequencing technology, and gene therapy.
-
From September 1, 2021 to August 5, 2022, the National Medical Products Administration approved the entry of 59 medical devices into the evaluation channel for innovative medical devices. Among them, 26 were cardiovascular products, accounting for 44.1%, indicating that cardiovascular technology is the dominant type of medical device innovation in China. In addition, 52 original domestic products (88.1%) were included.
From September 1, 2021 to August 5, 2022, the National Medical Products Administration approved 189 class III medical device registration certificates in the cardiovascular field. Among them, 130 were domestic products and 4 products have entered the evaluation channel for innovative medical devices. Compared with the data from September 1, 2020 to August 5, 2021 (including 142 approved registration certificates and 101 approved domestic products, 11 of which entered the evaluation channel for innovative medical devices), the speed of approval of the cardiovascular devices by the National Medical Products Administration has continued to accelerate. Simultaneously, current industrialization in the field of cardiovascular medical devices in China has entered a rapid development stage. The 130 domestic products comprised 115 interventional products, 3 imaging products, 7 blood flow measurement systems, 2 open surgery products, 1 artificial intelligence software, and 2 diagnostic products.
-
In 2020, the person times of discharged patients with CVD and cerebrovascular diseases in Chinese hospitals was 24.2883 million, accounting for 14.68% of the person times of discharged patients during the same period (including all diseases associated with hospitalization). Among them, there were 12.8994 million person-times with CVD, accounting for 7.80%, and 11.3889 million person-times with cerebrovascular disease, accounting for 6.89% (Figure 22).

Figure 22. Trends in the person times of Chinese patients discharged with cardiovascular diseases and diabetes from 1980 to 2020.
Among the person times of discharged patients with CVD, IHD (7.9899 million person-times) and cerebral infarction (7.6102 million person-times) were the main diseases, accounting for 32.90% and 31.33%, respectively. In 2020, the person-times of discharged patients with diabetes was 4.0739 million (Figure 23).
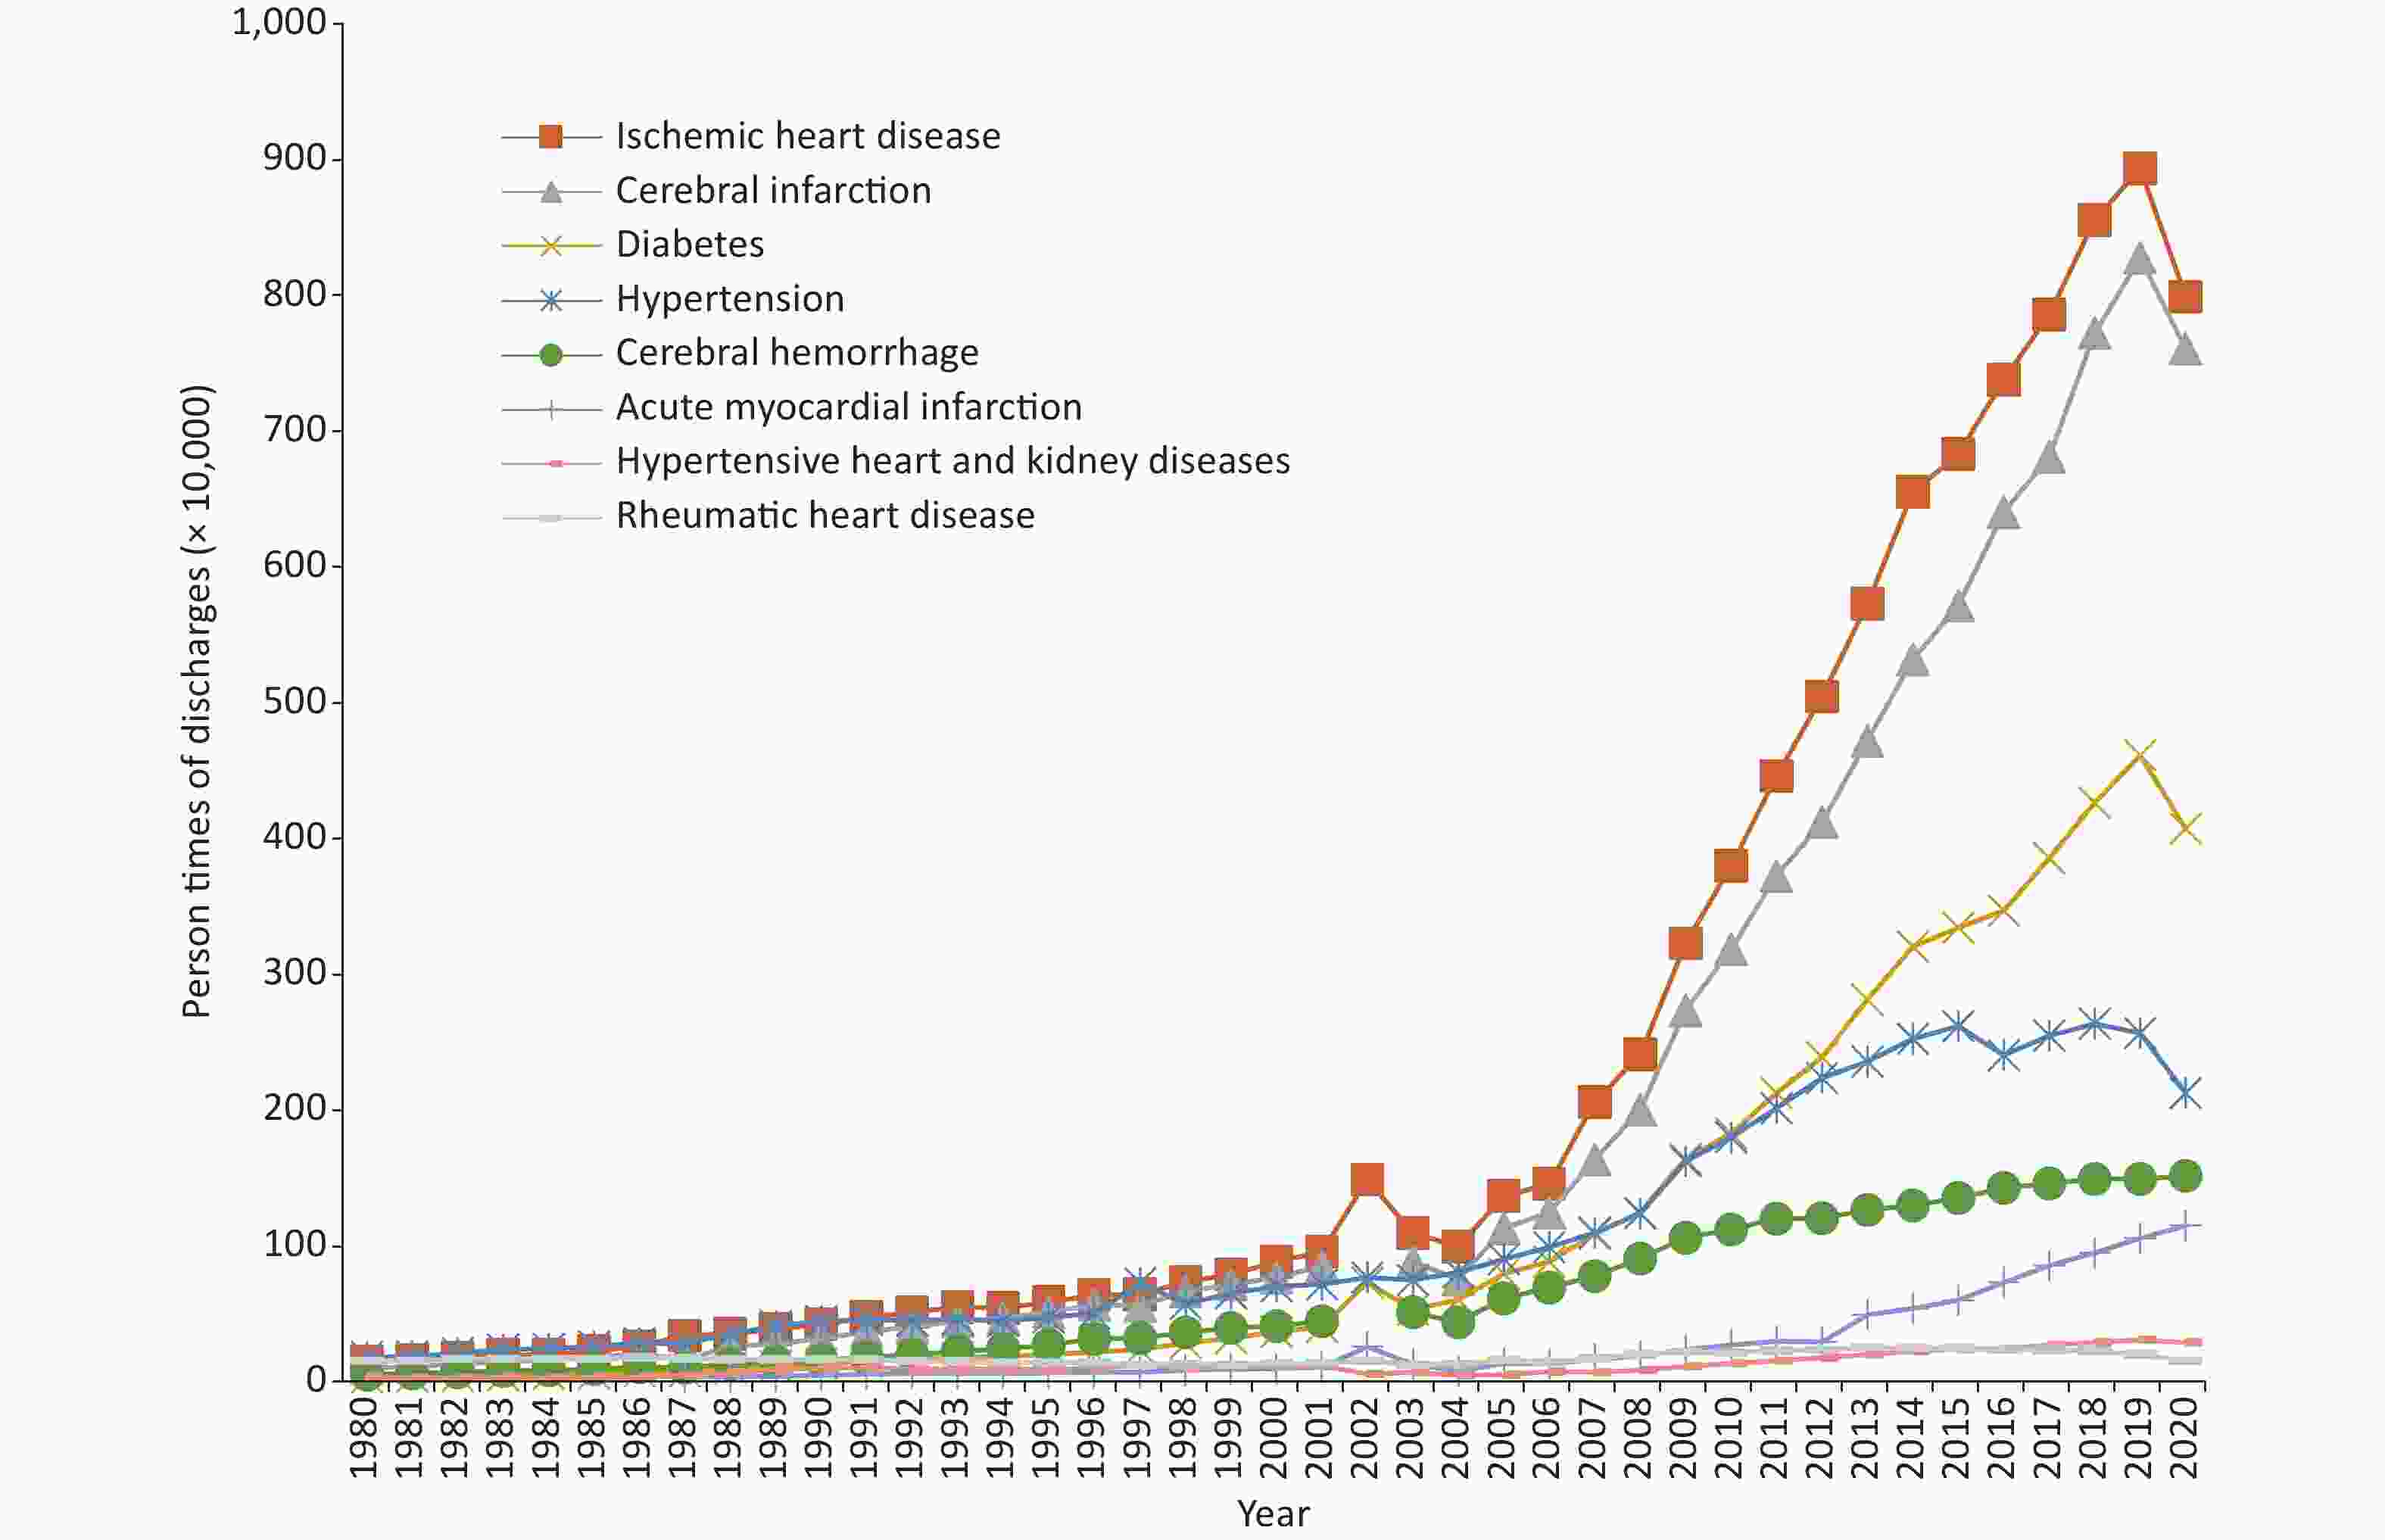
Figure 23. Trends in the person times of discharged patients with some cardiovascular diseases and diabetes in China from 1980 to 2020.
From 1980 to 2020, the average annual growth rate of diabetes discharge was 12.60%: 11.36% for cerebral infarction, 10.44% for ischemic heart disease (IHD), 8.65% for cerebral hemorrhage, 6.35% for hypertension, 5.63% for hypertensive heart and kidney diseases, and 0.01% for chronic rheumatic heart disease. From 1987 to 2020, the average annual growth rate of the person times of patients discharged with AMI was 10.88%. From 2018 to 2020, the average annual growth rate of the person times of patients discharged with HF was 15.28%: 7.15% for angina pectoris, 5.63% for PE, −4.45% for arrhythmia, and −7.07% for acute rheumatic fever.
In 2020, the total cost of hospitalization for CVD and cerebrovascular disease in China was 270.901 billion yuan. The total hospitalization cost for CVD was 165.222 billion yuan, including 116.959 billion yuan for IHD (including 43.135 billion yuan for angina pectoris and 34.685 billion yuan for AMI), 17.082 billion yuan for arrhythmia, 14.461 billion yuan for HF, 13.260 billion yuan for hypertension (including 2.496 billion yuan for hypertensive heart and kidney diseases), 1.849 billion yuan for PE, 1.520 billion yuan for chronic rheumatic heart disease, and 91 million yuan for acute rheumatic fever. The total hospitalization cost for cerebrovascular disease was 105.679 billion yuan, including 74.770 billion yuan for cerebral infarction and 30.909 billion yuan for cerebral hemorrhage. The total cost of hospitalization for diabetes was 31.641 billion yuan. The trend of total hospitalization expenses for patients with AMI, cerebral infarction, and cerebral hemorrhage is shown in Figure 24A.
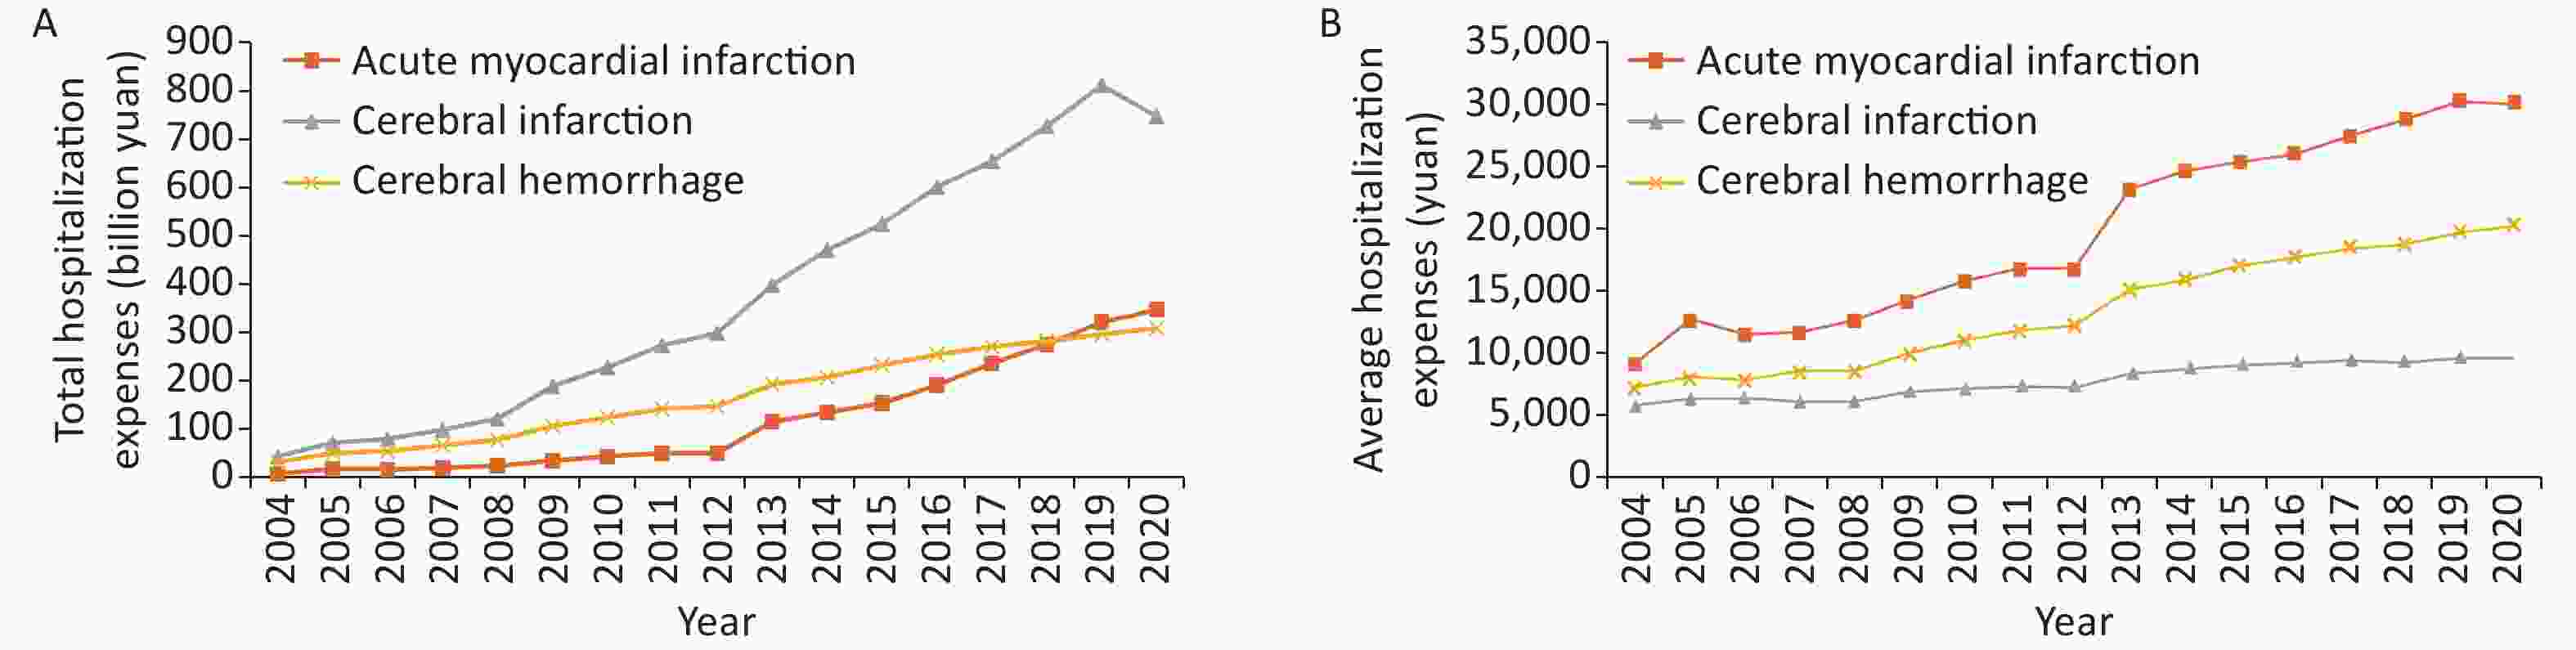
Figure 24. Trends of total and average hospitalization expenses for three cardiovascular diseases from 2004 to 2020 (current year price).
In 2020, the average annual expense for IHD was 14,638.22 yuan (15,369.94 yuan for angina pectoris and 30,159.06 yuan for AMI), 9,824.93 yuan for cerebral infarction, 20,397.61 yuan for cerebral hemorrhage, 6,235.41 yuan for hypertension (8,589.18 yuan for hypertensive heart and kidney diseases), 17,528.28 yuan for PE, 17,587.40 yuan for arrhythmia, 9,416.21 yuan for HF, 9,806.14 yuan for chronic rheumatic heart disease, and 5,941.20 yuan for acute rheumatic fever. In addition, the expense for diabetes was 7,766.69 yuan. The trend of the average hospitalization expenses for AMI, cerebral infarction, and cerebral hemorrhage is shown in Figure 24B.
After a correction for the influence of price factors, since 2004, the average annual growth rates of total hospitalization expenses for AMI, cerebral infarction, and cerebral hemorrhage were 24.65%, 16.81%, and 12.79%, respectively. Compared with that in 2018, the total hospitalization cost increased by 16.14% for HF, 6.45% for angina pectoris, 5.82% for PE, 3.52% for arrhythmia, 0.10% for IHD, −2.12% for hypertensive heart and kidney diseases, −4.34 for diabetes, −5.29% for acute rheumatic fever, −16.64% for hypertension, and −16.64% for chronic rheumatic heart disease.
After a correction for the influence of price factors, since 2004, the average annual growth rates of average expenses per hospitalization for AMI, cerebral hemorrhage, and cerebral infarction were 5.32%, 4.36%, and 1.11%, respectively. Since 2018, the average expenses per hospitalization for arrhythmia increased by 8.34%, 3.60% for IHD, −2.10% for diabetes, 1.92% for acute rheumatic fever, 1.33% for chronic rheumatic heart disease, 0.74% for HF, 0.18% for PE, −0.66% for angina pectoris, −2.01% for hypertensive heart and kidney diseases, and −2.73 for hypertension.
doi: 10.3967/bes2023.106
Report on Cardiovascular Health and Diseases in China 2022: an Updated Summary
-
Abstract: In the past 30 years, the accessibility and quality index of medical care have made remarkable progress in China, ranking the first among middle-income countries. Many cardiovascular technologies are at or near the world's leading level, and significant progress has been achieved in China solving the problem of “treatment difficulty” of cardiovascular diseases (CVD). However, due to the prevalence of unhealthy lifestyles among Chinese residents, a huge population with CVD risk factors, accelerated population aging, and other reasons, the incidence and mortality rate of CVD are still increasing, and the turning point of the decline in disease burden has not appeared yet in China. In terms of proportions of disease mortality among urban and rural residents, CVD still ranks the first. In 2020, CVD accounted for 48.00% and 45.86% of the causes of death in rural and urban areas, respectively; two out of every five deaths were due to CVD. It is estimated that the number of current CVD patients in China is around 330 million, including 13 million stroke, 11.39 million coronary heart disease, 8.9 million heart failure, 5 million pulmonary heart disease, 4.87 million atrial fibrillation, 2.5 million rheumatic heart disease, 2 million congenital heart disease, 45.3 million peripheral artery disease, and 245 million hypertension cases. China has entered a new stage of transformation from high-speed development to high-quality development, and the prevention and control of CVD in China should also shift from previous emphasis on scale growth to strategies focusing more on strategic and key technological development in order to curb the trend of increasing incidence and mortality rates of CVD.
-
Key words:
- Cardiovascular disease /
- Epidemiology /
- Health influencing factor /
- Risk factor /
- Prevalence /
- Mortality /
- Community-based prevention and control /
- Rehabilitation /
- Basic research /
- Medical device development
注释:1) Conflicts of Interest: -
Figure 1. In 2018, the main reason for trying to quit smoking among smokers aged ≥ 15 years in China in the previous 12 months.
Figure 2. Trends in the energy supply ratio of carbohydrate, protein, and fat among Chinese residents from 1982 to 2015.
Note: Data from the National Nutrition Survey from 1982 to 2012 and the Chinese Adult Chronic Diseases and Nutrition Monitoring in 2015.
Figure 3. Trends in food intake of Chinese residents from 1982 to 2015.
Note: Data from the National Nutrition Survey from 1982 to 2012 and the Chinese Adult Chronic Diseases and Nutrition Monitoring in 2015.
Figure 4. Changes of edible oil and cooking salt intake of Chinese residents from 1982 to 2015.
Note: Data from the National Nutrition Survey from 1982 to 2012 and the Chinese Adult Chronic Diseases and Nutrition Monitoring in 2015.
Figure 5. Trends in the proportion of energy intake of animal foods and industrially processed foods in China from 1990 to 2019.
Figure 6. Excellent rate of physical health standards among Chinese Han middle school students from 1985 to 2014.
Figure 7. Proportion of physically active adults aged 18 years and older in China.
Note: Regular physical activity refers to moderate-to-intensity physical activity for at least 30 min at least three times per week.
Figure 8. Changes in the prevalence of overweight and obesity in China from 2002 to 2017.
Note: Data are from the China Nutrition and Health Surveillance Report from 2015 to 2017. To ensure comparability, the same criteria for overweight and obesity were used for the data from the China Nutrition and Health Survey in 2002 and China Nutrition and Health Surveillance in 2010–2013 and 2015–2017. The WHO growth and development standards were adopted for children aged < 6 years, the criteria for Overweight and Obesity Screening for children and adolescents, and the criteria for adult weight determination for adults aged ≥ 18 years.
Figure 9. Nationwide percentage trend of attributable risk of hypertension in overweight and obese children from 1995 to 2014.
Note: The model was adjusted for age, sex, height, region, and economic level.
Figure 10. Prevalence of different types of dyslipidemia in Chinese adults.
Note: CCDRFS, China Chronic Disease and Risk Factors Monitoring; CANCDS, Chinese Adults Nutrition and Chronic Diseases Surveillance; China-PEACE MPP, China-PEACE Million Persons Project; CNSSPP, China Stroke Screening and Prevention Project; TC, Total cholesterol; LDL-C Low-density lipoprotein cholesterol; non-HDL-C, Non-high-density lipoprotein cholesterol; TG, triglyceride.
Figure 11. Investigation of the prevalence of diabetes in China from 1980 to 2017.
Note. Prevalence of diabetes in the urban population in 2020.
Figure 12. Proportion of major causes of death among urban and rural residents in China in 2020.
Figure 13. Changes in cardiovascular disease mortality in urban and rural residents in China from 2000 to 2020.
Figure 14. Age-standardized mortality of cardiovascular diseases in China from 2005 to 2020.
Figure 15. Trends in coronary heart disease mortality in urban and rural residents in China from 2002 to 2020.
Figure 16. Trends in acute myocardial infarction mortality among urban and rural residents in China from 2002 to 2020.
Figure 17. Surgical volume of percutaneous coronary intervention in China from 2009 to 2021.
Figure 18. Trends of crude mortality of cerebrovascular diseases in urban and rural residents in China from 2003 to 2020.
Figure 19. Surgical volume of radiofrequency catheter ablation in China from 2009 to 2021.
Figure 20. Surgical volume of interventional treatment of congenital heart disease in China from 2013 to 2020.
Figure 21. Basic research papers on cardiovascular diseases published by the first author/corresponding author in China over the years.
Figure 22. Trends in the person times of Chinese patients discharged with cardiovascular diseases and diabetes from 1980 to 2020.
Note: Cardiovascular diseases include ischemic heart disease (angina pectoris, acute myocardial infarction, and other ischemic heart diseases; ischemic heart disease in the annual report of health statistics was recorded as CHD before 2002), chronic rheumatic heart disease, acute rheumatic fever, pulmonary embolism, arrhythmia, heart failure, and hypertension (including hypertensive heart and kidney diseases); cerebrovascular diseases include cerebral hemorrhage and cerebral infarction.
Figure 23. Trends in the person times of discharged patients with some cardiovascular diseases and diabetes in China from 1980 to 2020.
Figure 24. Trends of total and average hospitalization expenses for three cardiovascular diseases from 2004 to 2020 (current year price).
Table 1. Survey results on the prevalence of hypertension in China from 1958 to 2018
Study name Year Age (years) Sampling method Sample size (people) Prevalence (%) Key project of Chinese Academy of Medical Sciences: Hypertension Research 1958–1959 ≥ 15 Non-random sampling 739,204 5.1 National Hypertension Sampling Survey 1979–1980 ≥ 15 Random sampling 4,012,128 7.7 National Hypertension Sampling Survey 1991 ≥ 15 Stratified random sampling 950,356 13.6 China Health and Nutrition Survey 2002 ≥ 18 Multi-stage stratified cluster random sampling 272,023 18.8 Chinese Residents Nutrition and Chronic Diseases Survey 2012 ≥ 18 Multi-stage stratified random sampling − 25.2 China Hypertension Survey 2012–2015 ≥ 18 Multi-stage stratified random sampling 451,755 27.9 (weighted rate 23.2) China Health and Nutrition Survey 2015 20–79 Multi-stage stratified cluster random sampling 8,907 34.1 (standardized rate 25.6) China Chronic Disease and Risk Factor Surveillance 2018 ≥ 18 Multi-stage stratified cluster random sampling 179,873 27.5 (weighted rate) Note. −, No specific data are available.  下载: 导出CSV
Table 2. Awareness, treatment, and control rates of hypertension in various studies in China
Study name Year Age (years) Sampling method Sample size
(people)Awareness rate
(%)Prevalence
(%)Control rate
(%)National Hypertension Sampling Survey 1991 ≥ 15 Multi-level random sampling 950,356 27.0 12.0 3.0 China Health and Nutrition Survey 2002 ≥ 18 Multi-stage stratified cluster random sampling 272,023 30.2 24.7 6.1 Chinese Residents Nutrition and Chronic Diseases Survey 2012 ≥ 18 Multi-stage stratified random sampling − 46.5 41.1 13.8 China Nutrition and Health Surveillance 2010–2012 ≥ 18 Multi-stage stratified cluster random sampling 120,428 46.5 41.1 14.6 Investigation of the prevalence, awareness, treatment, and control rates of hypertension in the Chinese working population 2012–2013 18–60 Multi-stage cluster sampling 37,856 57.6
(standardization rate 47.8)30.5
(standardization rate 20.6)11.2
(standardization rate 8.5)China Hypertension Survey 2012–2015 ≥ 18 Multi-stage stratified random sampling 451,755 51.6
(weighted rate 46.9)45.8
(weighted rate 40.7)16.8
(weighted rate 15.3)Early screening and comprehensive intervention program for high-risk groups of cardiovascular disease in China 2014 35–75 Convenience sampling 640,539 46.5 (standardization rate) 38.1 (standardization rate) 11.1 (standardization rate) China Health and Nutrition Survey 2015 20–79 Multi-stage stratified cluster random sampling 8,907 43.8 (standardization rate 27.2) 39.2 (standardization rate 23.6) 13.8 (standardization rate 8.4) China Chronic Disease and Risk Factor Surveillance 2018 ≥ 18 Multi-stage stratified cluster random sampling 179,873 41.0 (weighted rate) 34.9 (weighted rate) 11.0 (weighted rate) Note. −, No specific data are available.
下载: 导出CSV
Table 3. The number of cases and age-standardized incidences of different subtypes of stroke and their changes in China in 1990 and 2019
Items Number of incidences
(ten thousand, 95% UI)Variation of the number of incidences
(%, 95% UI)Age-standardized incidence
(1/100,000, 95% UI)Variation of age-standardized incidence
(%, 95% UI)1990 2019 1990 2019 Stroke 170 (150 to 200) 390 (340 to 450) 124 (108 to 129) 221 (196 to 249) 200 (176 to 230) −9 (−16 to −3) IS 80 (70 to 100) 280 (230 to 340) 226 (211 to 243) 107 (89 to 130) 144 (121 to 173) 35 (29 to 40) HS 70 (50 to 80) 80 (70 to 100) 18 (12 to 24) 95 (77 to 113) 44 (37 to 52) −53 (−56 to −50) SAH 10 (10 to 20) 20 (10 to 20) 36 (26 to 45) 18 (15 to 22) 11 (9 to 13) −39 (−44 to −35) Note. HS, hemorrhagic stroke; IS, ischemic stroke; SAH, subarachnoid hemorrhage; 95% UI, 95% uncertain interval.
下载: 导出CSV
-
[1] GBD 2015 Healthcare Access and Quality Collaborators. Healthcare access and quality index based on mortality from causes amenable to personal health care in 195 countries and territories, 1990-2015: a novel analysis from the global burden of disease study 2015. Lancet, 2017; 390, 231−66. doi: 10.1016/S0140-6736(17)30818-8 [2] GBD 2019 Tobacco Collaborators. Spatial, temporal, and demographic patterns in prevalence of smoking tobacco use and attributable disease burden in 204 countries and territories, 1990–2019: a systematic analysis from the global burden of disease study 2019. Lancet, 2021; 397, 2337−60. doi: 10.1016/S0140-6736(21)01169-7 [3] He J, Gu DF, Wu XG, et al. Major causes of death among men and women in China. N Engl J Med, 2005; 353, 1124−34. doi: 10.1056/NEJMsa050467 [4] Xiao L, Nan Y, Di XB, et al. Study on smoking behavior and its changes among Chinese people aged 15 years and above in 2018. Chin J Epidemiol, 2022; 43, 811−7. (In Chinese [5] Zeng XY, Di XB, Liu SW, et al. Smoking behavior among secondary school students - China, 2021. China CDC Wkly, 2022; 4, 441−7. doi: 10.46234/ccdcw2022.099 [6] Huang YY, Di XB, Nan Y, et al. Secondhand smoke exposure and its influencing factors among Chinese people aged 15 years and above in 2010 and 2018. Chin J Epidemiol, 2022; 43, 824−9. (In Chinese [7] Xiao L, Yin X, Di XB, et al. Awareness and prevalence of e-cigarette use among Chinese adults: policy implications. Tob Control, 2022; 31, 498−504. doi: 10.1136/tobaccocontrol-2020-056114 [8] Liu Z, Li YH, Cui ZY, et al. Prevalence of tobacco dependence and associated factors in China: findings from nationwide China health literacy survey during 2018-19. Lancet Reg Health West Pac, 2022; 24, 100464. doi: 10.1016/j.lanwpc.2022.100464 [9] Han YT, Hu YZ, Yu CQ, et al. Lifestyle, cardiometabolic disease, and multimorbidity in a prospective Chinese study. Eur Heart J, 2021; 42, 3374−84. doi: 10.1093/eurheartj/ehab413 [10] Li XH. China adult tobacco survey report in 2018. People’s Medical Publishing House. 2020. (In Chinese [11] Yu DM, Zhao LY, Ju LH, et al. Status of energy and primary nutrients intake among Chinese population in 2015-2017. Food Nutr China, 2021; 27, 5−10. (In Chinese [12] Huang LN, Wang ZH, Wang HJ, et al. Nutrition transition and related health challenges over decades in China. Eur J Clin Nutr, 2021; 75, 247−52. doi: 10.1038/s41430-020-0674-8 [13] Chinese Nutrition Society. Scientific research report on dietary guidelines for Chinese residents 2021. People’s Medical Publishing House. 2022. (In Chinese [14] Disease Prevention and Control Bureau of the National Health Commission. Chinese residents nutrition and chronic diseases report 2020. People’s Medical Publishing House. 2022. (In Chinese [15] Fardet A, Aubrun K, Rock E. Nutrition transition and chronic diseases in China (1990-2019): industrially processed and animal calories rather than nutrients and total calories as potential determinants of the health impact. Public Health Nutr, 2021; 24, 5561−75. doi: 10.1017/S1368980021003311 [16] Wang YF, Feng L, Zeng G, et al. Effects of cuisine-based Chinese heart-healthy diet in lowering blood pressure among adults in China: multicenter, single-blind, randomized, parallel controlled feeding trial. Circulation, 2022; 146, 303−15. doi: 10.1161/CIRCULATIONAHA.122.059045 [17] Li KC, Huang LP, Tian MY, et al. Cost-effectiveness of a household salt substitution intervention: findings from 20 995 participants of the salt substitute and stroke study. Circulation, 2022; 145, 1534−41. doi: 10.1161/CIRCULATIONAHA.122.059573 [18] Fan X, Cao ZB. Physical activity among Chinese school-aged children: national prevalence estimates from the 2016 physical activity and fitness in China-the youth study. J Sport Health Sci, 2017; 6, 388−94. doi: 10.1016/j.jshs.2017.09.006 [19] Zhu Z, Tang Y, Zhuang J, et al. Physical activity, screen viewing time, and overweight/obesity among Chinese children and adolescents: an update from the 2017 physical activity and fitness in China-the youth study. BMC Public Health, 2019; 19, 197. doi: 10.1186/s12889-019-6515-9 [20] Chen ST, Liu Y, Tremblay MS, et al. Meeting 24-h movement guidelines: prevalence, correlates, and the relationships with overweight and obesity among Chinese children and adolescents. J Sport Health Sci, 2021; 10, 349−59. doi: 10.1016/j.jshs.2020.07.002 [21] Song Y, Luo DM, Hu PJ, et al. Trends of prevalence of excellent health status and physical fitness among Chinese Han students aged 13 to 18 years from 1985 to 2014. J Peking Univ (Health Sci), 2020; 52, 317−22. (In Chinese [22] Yang X, Leung AW, Jago R, et al. Physical activity and sedentary behaviors among Chinese children: recent trends and correlates. Biomed Environ Sci, 2021; 34, 425−38. [23] Li C, Wang LM, Zhang X, et al. Leisure-time physical activity among Chinese adults-China, 2015. China CDC Wkly, 2020; 2, 671−7. [24] Ng SW, Popkin BM. Time use and physical activity: a shift away from movement across the globe. Obes Rev, 2012; 13, 659−80. doi: 10.1111/j.1467-789X.2011.00982.x [25] Ng SW, Howard AG, Wang HJ, et al. The physical activity transition among adults in China: 1991-2011. Obes Rev, 2014; 15, 27−36. [26] Chinese Center for Disease Control and Prevention, China Center for Disease Control and Prevention of Chronic Non communicable Diseases. Report on chronic disease risk factor surveillance in China 2013. Military Medical Science Press. 2016. (In Chinese [27] Chinese Center for Disease Control and Prevention, China Center for Disease Control and Prevention of Chronic Non Communicable Diseases. Report on chronic disease risk factor surveillance in China 2018. Military Medical Science Press. 2021. (In Chinese [28] Strain T, Brage S, Sharp SJ, et al. Use of the prevented fraction for the population to determine deaths averted by existing prevalence of physical activity: a descriptive study. Lancet Glob Health, 2020; 8, e920−30. doi: 10.1016/S2214-109X(20)30211-4 [29] Bennett DA, Du HD, Clarke R, et al. Association of physical activity with risk of major cardiovascular diseases in Chinese men and women. JAMA Cardiol, 2017; 2, 1349−58. doi: 10.1001/jamacardio.2017.4069 [30] Du HD, Bennett D, Li LM, et al. Physical activity and sedentary leisure time and their associations with BMI, waist circumference, and percentage body fat in 0.5 million adults: the China Kadoorie Biobank study. Am J Clin Nutr, 2013; 97, 487−96. doi: 10.3945/ajcn.112.046854 [31] Zhang J, Chaaban J. The economic cost of physical inactivity in China. Prev Med, 2013; 56, 75−8. doi: 10.1016/j.ypmed.2012.11.010 [32] Zhao LY, Ding GQ, Zhao WH. Report on Chinese residents’ nutrition and chronic diseases surveillance 2015-2017. People’s Medical Publishing House. 2022. (In Chinese [33] Wang YF, Zhao L, Gao LW, et al. Health policy and public health implications of obesity in China. Lancet Diabetes Endocrinol, 2021; 9, 446−61. doi: 10.1016/S2213-8587(21)00118-2 [34] Disease Prevention and Control Bureau of the National Health Commission. Report on Chinese residents’ nutrition and chronic diseases. People’s Medical Publishing House. 2022. (In Chinese [35] Global Burden Disease 2019. Global health data exchange. http://ghdx.healthdata.org. [2023-05-21 [36] Jiang CQ, Xu L, Zhang WS, et al. Adiposity and mortality in older Chinese: an 11-year follow-up of the Guangzhou Biobank cohort study. Sci Rep, 2020; 10, 1924. doi: 10.1038/s41598-020-58633-z [37] Jia GC, Shu XO, Liu Y, et al. Association of adult weight gain with major health outcomes among middle-aged Chinese persons with low body weight in early adulthood. JAMA Netw Open, 2019; 2, e1917371. doi: 10.1001/jamanetworkopen.2019.17371 [38] Zanganeh M, Adab P, Li B, et al. Cost-effectiveness of a school-and family-based childhood obesity prevention programme in China: the “CHIRPY DRAGON” cluster-randomised controlled trial. Int J Public Health, 2021; 66, 1604025. doi: 10.3389/ijph.2021.1604025 [39] Ren YP, Yang H, Browning C, et al. Prevalence of depression in coronary heart disease in China: a systematic review and meta-analysis. Chin Med J (Engl), 2014; 127, 2991−8. [40] Chinese Medical Association, Chinese Medical Journals Publishing House, Chinese Society of General Practice, et al. Guideline for primary care of major depressive disorder (2021). Chin J Gen Pract, 2021; 20, 1249−60. (In Chinese [41] Wang DD, Dai F, Liu WJ, et al. Longitudinal change and prognostic value of anxiety and depression in coronary heart disease patients. Ir J Med Sci, 2021; 190, 107−16. doi: 10.1007/s11845-020-02302-7 [42] Teo KK, Liu L, Chow CK, et al. Potentially modifiable risk factors associated with myocardial infarction in China: the INTERHEART China study. Heart, 2009; 95, 1857−64. doi: 10.1136/hrt.2008.155796 [43] Li ZZ, Li YY, Chen LZ, et al. Prevalence of depression in patients with hypertension: a systematic review and meta-analysis. Medicine (Baltimore), 2015; 94, e1317. doi: 10.1097/MD.0000000000001317 [44] Li HB, Qian F, Hou CB, et al. Longitudinal changes in depressive symptoms and risks of cardiovascular disease and all-cause mortality: a nationwide population-based cohort study. J Gerontol A Biol Sci Med Sci, 2020; 75, 2200−6. doi: 10.1093/gerona/glz228 [45] Liu N, Pan XF, Yu CQ, et al. Association of major depression with risk of ischemic heart disease in a mega-cohort of Chinese adults: the China Kadoorie Biobank study. J Am Heart Assoc, 2016; 5, e004687. doi: 10.1161/JAHA.116.004687 [46] Wang ZW, Chen Z, Zhang LF, et al. Status of hypertension in China: results from the China hypertension survey, 2012-2015. Circulation, 2018; 137, 2344−56. doi: 10.1161/CIRCULATIONAHA.117.032380 [47] Zhang M, Wu J, Zhang X, et al. Prevalence and control of hypertension in adults in China, 2018. Chin J Epidemiol, 2021; 42, 1780−9. (In Chinese [48] Luo YM, Xia F, Yu XX, et al. Long-term trends and regional variations of hypertension incidence in China: a prospective cohort study from the China health and nutrition survey, 1991-2015. BMJ Open, 2021; 11, e042053. doi: 10.1136/bmjopen-2020-042053 [49] Yi Q, Zha MM, Yang QW, et al. Trends in the prevalence of hypertension according to severity and phenotype in Chinese adults over two decades (1991-2015). J Clin Hypertens (Greenwich), 2021; 23, 1302−15. doi: 10.1111/jch.14306 [50] Sun NL, Jiang YN, Wang HY, et al. Survey on sodium and potassium intake in patients with hypertension in China. J Clin Hypertens (Greenwich), 2021; 23, 1957−64. doi: 10.1111/jch.14355 [51] Neal B, Wu YF, Feng XX, et al. Effect of salt substitution on cardiovascular events and death. N Engl J Med, 2021; 385, 1067−77. doi: 10.1056/NEJMoa2105675 [52] Zhang WL, Zhang SY, Deng Y, et al. Trial of intensive blood-pressure control in older patients with hypertension. N Engl J Med, 2021; 385, 1268−79. doi: 10.1056/NEJMoa2111437 [53] Sun YX, Mu JJ, Wang DW, et al. A village doctor-led multifaceted intervention for blood pressure control in rural China: an open, cluster randomised trial. Lancet, 2022; 399, 1964−75. doi: 10.1016/S0140-6736(22)00325-7 [54] You LL, Zhao JH, Chen XY, et al. National essential public health services programs over the past decade research report two: progress and achievements of the implementation of national essential public health services programs over the past decade. Chin Gen Pract, 2022; 25, 3209−20. (In Chinese [55] Li C, Chen KY, Cornelius V, et al. Applicability and cost-effectiveness of the systolic blood pressure intervention trial (SPRINT) in the Chinese population: a cost-effectiveness modeling study. PLoS Med, 2021; 18, e1003515. doi: 10.1371/journal.pmed.1003515 [56] Fan JL, Zheng WJ, Liu W, et al. Cost-effectiveness of intensive versus standard blood pressure treatment in older patients with hypertension in China. Hypertension, 2022; 79, 2631−41. doi: 10.1161/HYPERTENSIONAHA.122.20051 [57] Dong J, Dong HB, Yan YK, et al. Prevalence of hypertension and hypertension phenotypes after three visits in Chinese urban children. J Hypertens, 2022; 40, 1270−7. doi: 10.1097/HJH.0000000000002977 [58] Liu K, Li C, Gong HB, et al. Prevalence and risk factors for hypertension in adolescents aged 12 to 17 years: a school-based study in China. Hypertension, 2021; 78, 1577−85. doi: 10.1161/HYPERTENSIONAHA.121.17300 [59] Ye XX, Yi Q, Shao J, et al. Trends in prevalence of hypertension and hypertension phenotypes among Chinese children and adolescents over two decades (1991-2015). Front Cardiovasc Med, 2021; 8, 627741. doi: 10.3389/fcvm.2021.627741 [60] Dong YH, Ma J, Song Y, et al. Secular trends in blood pressure and overweight and obesity in Chinese boys and girls aged 7 to 17 years from 1995 to 2014. Hypertension, 2018; 72, 298−305. doi: 10.1161/HYPERTENSIONAHA.118.11291 [61] Song PK, Man QQ, Li H, et al. Trends in lipids level and dyslipidemia among Chinese adults, 2002-2015. Biomed Environ Sci, 2019; 32, 559−70. [62] NCD Risk Factor Collaboration (NCD-RisC). Repositioning of the global epicentre of non-optimal cholesterol. Nature, 2020; 582, 73−7. doi: 10.1038/s41586-020-2338-1 [63] Ding WQ, Cheng H, Yan YK, et al. 10-year trends in serum lipid levels and dyslipidemia among children and adolescents from several schools in Beijing, China. J Epidemiol, 2016; 26, 637−45. doi: 10.2188/jea.JE20140252 [64] Zhao WH, Zhang J, You Y, et al. Epidemiologic characteristics of dyslipidemia in people aged 18 years and over in China. Chin J Prev Med, 2005; 39, 306−10. (In Chinese [65] Pan L, Yang ZH, Wu Y, et al. The prevalence, awareness, treatment and control of dyslipidemia among adults in China. Atherosclerosis, 2016; 248, 2−9. doi: 10.1016/j.atherosclerosis.2016.02.006 [66] Dai J, Min JQ, Yang YJ. A study on the epidemic characteristics of dyslipidemia in adults of nine provinces of China. Chin J Cardiol, 2018; 46, 114−8. (In Chinese [67] Disease Prevention and Control Bureau of the National Health Commission. Report on Chinese residents’ nutrition and chronic diseases 2015. People’s Medical Publishing House. 2015. (In Chinese [68] China Hypertension Survey Investigators. Status of dyslipidemia among adults aged 35 years and above in China. Chin Circ J, 2019; 34, 681−7. (In Chinese [69] Lu Y, Zhang HB, Lu JP, et al. Prevalence of dyslipidemia and availability of lipid-lowering medications among primary health care settings in China. JAMA Netw Open, 2021; 4, e2127573. doi: 10.1001/jamanetworkopen.2021.27573 [70] Zhang M, Deng Q, Wang LH, et al. Prevalence of dyslipidemia and achievement of low-density lipoprotein cholesterol targets in Chinese adults: a nationally representative survey of 163, 641 adults. Int J Cardiol, 2018; 260, 196−203. doi: 10.1016/j.ijcard.2017.12.069 [71] Opoku S, Gan Y, Fu WN, et al. Prevalence and risk factors for dyslipidemia among adults in rural and urban China: findings from the China national stroke screening and prevention project (CNSSPP). BMC Public Health, 2019; 19, 1500. doi: 10.1186/s12889-019-7827-5 [72] Cheng H, Xiao P, Hou DQ, et al. Epidemiological characteristics and related factors of dyslipidemia among Beijing children and adolescents aged 6-16 years in 2017. Chin Circ J, 2020; 35, 566−72. (In Chinese [73] Zhang MN, Li MT, Zhi XY, et al. Trends of a burden on atherosclerotic cardiovascular disease and its related risk factors in China, 1990 to 2019. Chin J Epidemiol, 2021; 42, 1797−803. (In Chinese [74] Xing YY, Liu J, Hao YC, et al. Prehospital statin use and low-density lipoprotein cholesterol levels at admission in acute coronary syndrome patients with history of myocardial infarction or revascularization: findings from the Improving care for cardiovascular disease in China (CCC) project. Am Heart J, 2019; 212, 120−8. doi: 10.1016/j.ahj.2019.02.019 [75] Xing YY, Liu J, Liu J, et al. Statin use and low-density lipoprotein cholesterol levels in patients aged 75 years and older with acute coronary syndrome in China. Chin J Cardiol, 2019; 47, 351−9. (In Chinese [76] Li SD, Liu ZG, Joseph P, et al. Modifiable risk factors associated with cardiovascular disease and mortality in China: a PURE substudy. Eur Heart J, 2022; 43, 2852−63. doi: 10.1093/eurheartj/ehac268 [77] Zeng YH, Liu J, Liu J, et al. The expanding needs on lipid-lowering treatment in patients with acute coronary syndrome by applying newly issued definition of extreme high-risk by Chinese society of cardiology. Chin J Cardiol, 2020; 48, 1039−46. (In Chinese [78] Gong YJ, Li X, Ma X, et al. Lipid goal attainment in post-acute coronary syndrome patients in China: results from the 6-month real-world dyslipidemia international study II. Clin Cardiol, 2021; 44, 1575−85. doi: 10.1002/clc.23725 [79] Zhong XL. Diabetes mellitus survey in China. Chin Med J (Engl), 1982; 95, 423−30. [80] Li YZ, Teng D, Shi XG, et al. Prevalence of diabetes recorded in mainland China using 2018 diagnostic criteria from the American diabetes association: national cross sectional study. BMJ, 2020; 369, m997. [81] Liu YH, Ning X, Zhang LY, et al. Prevalence of long-term complications in inpatients with diabetes mellitus in China: a nationwide tertiary hospital-based study. BMJ Open Diabetes Res Care, 2022; 10, e002720. doi: 10.1136/bmjdrc-2021-002720 [82] Wang CC, Xie ZL, Huang X, et al. Prevalence of cardiovascular disease risk factors in Chinese patients with type 2 diabetes mellitus, 2013-2018. Curr Med Res Opin, 2022; 38, 345−54. doi: 10.1080/03007995.2021.2022382 [83] Gong QH, Zhang P, Wang JP, et al. Morbidity and mortality after lifestyle intervention for people with impaired glucose tolerance: 30-year results of the Da Qing diabetes prevention outcome study. Lancet Diabetes Endocrinol, 2019; 7, 452−61. doi: 10.1016/S2213-8587(19)30093-2 [84] Jiang XJ, Jiang H, Tao LB, et al. The cost-effectiveness analysis of self-efficacy-focused structured education program for patients with type 2 diabetes mellitus in mainland China setting. Front Public Health, 2021; 9, 767123. doi: 10.3389/fpubh.2021.767123 [85] Zhang LX, Wang F, Wang L, et al. Prevalence of chronic kidney disease in China: a cross-sectional survey. Lancet, 2012; 379, 815−22. doi: 10.1016/S0140-6736(12)60033-6 [86] Jin HY, Zhou JY, Wu CK. Prevalence and health correlates of reduced kidney function among community-dwelling Chinese older adults: the China health and retirement longitudinal study. BMJ Open, 2020; 10, e042396. doi: 10.1136/bmjopen-2020-042396 [87] Zhang LX, Zhao MH, Zuo L, et al. China kidney disease network (CK-NET) 2016 annual data report. Kidney Int Suppl (2011), 2020; 10, e97−185. doi: 10.1016/j.kisu.2020.09.001 [88] Yao CH, Hu YS, Zhai FY, et al. Adults prevalence of metabolic syndrome in China in 2002. Chin J Diabetes, 2007; 15, 332−5. (In Chinese [89] He YN, Zhao WH, Zhao LY, et al. Prevalence of metabolic syndrome in Chinese adults in 2010-2012. Chin J Epidemiol, 2017; 38, 212−5. (In Chinese [90] He YN, Zhao WH, Zhao LY. The epidemic status of metabolic syndrome among Chinese adolescents aged 10-17 years in 2010-2012. Chin J Prev Med, 2017; 51, 513−8. (In Chinese [91] Institute for Health Metrics and Evaluation (IHME). Global burden of disease study 2019 (GBD 2019) results. https://ghdx.healthdata.org/gbd-results-tool. [2023-05-21 [92] Ministry of Ecology and Environment of the People’s Republic of China. Bulletin on the state of China’s ecological environment 2021. http://www.gov.cn/xinwen/2022-05/28/5692799/files/349e930e68794f3287888d8dbe9b3ced.pdf. [2023-03-26]. (In Chinese [93] Liu C, Yin P, Chen RJ, et al. Ambient carbon monoxide and cardiovascular mortality: a nationwide time-series analysis in 272 cities in China. Lancet Planet Health, 2018; 2, e12−8. doi: 10.1016/S2542-5196(17)30181-X [94] Yin P, Chen RJ, Wang LJ, et al. Ambient ozone pollution and daily mortality: a nationwide study in 272 Chinese cities. Environ Health Perspect, 2017; 125, 117006. doi: 10.1289/EHP1849 [95] Chen RJ, Yin P, Meng X, et al. Associations between ambient nitrogen dioxide and daily cause-specific mortality: evidence from 272 Chinese cities. Epidemiology, 2018; 29, 482−9. doi: 10.1097/EDE.0000000000000829 [96] Wang LJ, Liu C, Meng X, et al. Associations between short-term exposure to ambient sulfur dioxide and increased cause-specific mortality in 272 Chinese cities. Environ Int, 2018; 117, 33−9. doi: 10.1016/j.envint.2018.04.019 [97] Chen RJ, Yin P, Meng X, et al. Fine particulate air pollution and daily mortality. A nationwide analysis in 272 Chinese cities. Am J Respir Crit Care Med, 2017; 196, 73−81. doi: 10.1164/rccm.201609-1862OC [98] Sun Y, Zhang Y, Chen C, et al. Impact of heavy PM2.5 pollution events on mortality in 250 Chinese counties. Environ Sci Technol, 2022; 56, 8299−307. doi: 10.1021/acs.est.1c07340 [99] Liang FC, Xiao QY, Huang KY, et al. The 17-y spatiotemporal trend of PM2.5 and its mortality burden in China. Proc Natl Acad Sci USA, 2020; 117, 25601−8. doi: 10.1073/pnas.1919641117 [100] Tang R, Zhao J, Liu YF, et al. Air quality and health co-benefits of China's carbon dioxide emissions peaking before 2030. Nat Commun, 2022; 13, 1008. doi: 10.1038/s41467-022-28672-3 [101] Yang JZ, Zhao Y, Cao J, et al. Co-benefits of carbon and pollution control policies on air quality and health till 2030 in China. Environ Int, 2021; 152, 106482. doi: 10.1016/j.envint.2021.106482 [102] Lu YL, Fan ZY, Jiang HQ, et al. Economic Benefit of air quality improvement during implementation of the air pollution prevention and control action plan in Beijing. Environ Sci, 2021; 42, 2730−9. (In Chinese [103] Li D, Xiao H, Ma S, et al. Health benefits of air quality improvement: empirical research based on medical insurance reimbursement data. Front Public Health, 2022; 10, 855457. doi: 10.3389/fpubh.2022.855457 [104] Jiang YY, Qi L, Mao F, et al. Research on the status of multi-sector cooperation in national chronic disease comprehensive control and prevention demonstration areas. Chin J Health Policy, 2019; 12, 59−66. (In Chinese [105] Zhang WW, Wang LJ. Evaluation on construction of demonstration area for comprehensive prevention and control of chronic diseases, Lishan district, Anshan City, 2013-2020. Prev Med Trib, 2022; 28, 81−4. (In Chinese [106] Zhang H, Xiong JY, Guan WB, et al. Analyzing the management effects of chronic diseases: taking national demonstration zone of chronic diseases comprehensive prevention and control as an example. Chin Hosp, 2019; 23, 15−7. (In Chinese [107] Wang W, Liu YN, Liu JM, et al. Mortality and years of life lost of cardiovascular diseases in China, 2005-2020: empirical evidence from national mortality surveillance system. Int J Cardiol, 2021; 340, 105−12. doi: 10.1016/j.ijcard.2021.08.034 [108] National Health Commission. China health statistics yearbook 2021. Peking Union Medical College Press. 2021. (In Chinese [109] Center for Health Statistics and Information. An analysis report of national health services survey in China, 2013. Peking Union Medical College Press. 2016. (In Chinese [110] Li J, Li X, Wang Q, et al. ST-segment elevation myocardial infarction in China from 2001 to 2011 (the China PEACE-retrospective acute myocardial infarction study): a retrospective analysis of hospital data. Lancet, 2015; 385, 441−51. doi: 10.1016/S0140-6736(14)60921-1 [111] Xu HY, Yang YJ, Wang CS, et al. Association of hospital-level differences in care with outcomes among patients with acute ST-segment elevation myocardial infarction in China. JAMA Netw Open, 2020; 3, e2021677. doi: 10.1001/jamanetworkopen.2020.21677 [112] Zhao YY, Yang JG, Xu HB, et al. Association between the composite measures of hospital performance and in-hospital mortality for patients with acute ST-segment elevation myocardial infarction in China. Chin Circ J, 2019; 34, 437−43. (In Chinese [113] Hao YC, Zhao D, Liu J, et al. Performance of management strategies with class I recommendations among patients hospitalized with ST-segment elevation myocardial infarction in China. JAMA Cardiol, 2022; 7, 484−91. doi: 10.1001/jamacardio.2022.0117 [114] Hu MJ, Peng Y, Gao XJ, et al. Coronary intervention in ST-segment elevation myocardial infarction patients with symptom onset >12 hours: data from China acute myocardial infarction registry. Angiology, 2023; 74, 171−80. doi: 10.1177/00033197221098885 [115] Liu CY, Tang CX, Zhang XL, et al. Deep learning powered coronary CT angiography for detecting obstructive coronary artery disease: the effect of reader experience, calcification and image quality. Eur J Radiol, 2021; 142, 109835. doi: 10.1016/j.ejrad.2021.109835 [116] Li X, Gu DC, Wang XQ, et al. Trends of coronary artery bypass grafting performance in a cohort of hospitals in China between 2013 and 2018. Circ Cardiovasc Qual Outcomes, 2021; 14, e007025. doi: 10.1161/CIRCOUTCOMES.120.007025 [117] Ma QF, Li R, Wang LJ, et al. Temporal trend and attributable risk factors of stroke burden in China, 1990-2019: an analysis for the global burden of disease study 2019. Lancet Public Health, 2021; 6, e897−906. doi: 10.1016/S2468-2667(21)00228-0 [118] Sun T, Chen SY, Wu K, et al. Trends in incidence and mortality of stroke in China from 1990 to 2019. Front Neurol, 2021; 12, 759221. doi: 10.3389/fneur.2021.759221 [119] Gu HQ, Yang X, Wang CJ, et al. Clinical characteristics, management, and in-hospital outcomes in patients with stroke or transient ischemic attack in China. JAMA Netw Open, 2021; 4, e2120745. doi: 10.1001/jamanetworkopen.2021.20745 [120] Ni WY, Kunz WG, Goyal M, et al. Quality of life and cost consequence of delays in endovascular treatment for acute ischemic stroke in China. Health Econ Rev, 2022; 12, 4. doi: 10.1186/s13561-021-00352-w [121] Cai ZL, Cai D, Wang RW, et al. Cost-effectiveness of CYP2C19 genotyping to guide antiplatelet therapy for acute minor stroke and high-risk transient ischemic attack. Sci Rep, 2021; 11, 7383. doi: 10.1038/s41598-021-86824-9 [122] Shi SB, Tang YH, Zhao QY, et al. Prevalence and risk of atrial fibrillation in China: a national cross-sectional epidemiological study. Lancet Reg Health West Pac, 2022; 23, 100439. doi: 10.1016/j.lanwpc.2022.100439 [123] Hu DY, Sun YH, Zhou ZQ, et al. Risk factors for stroke in Chinese with non valvular atrial fibrillation: a case-control study. Chin J Intern Med, 2003; 42, 157−61. (In Chinese [124] Chang SS, Dong JZ, Ma CS, et al. Current status and time trends of oral anticoagulation use among Chinese patients with nonvalvular atrial fibrillation: the Chinese atrial fibrillation registry study. Stroke, 2016; 47, 1803−10. doi: 10.1161/STROKEAHA.116.012988 [125] Bai Y, Liu XY, Liu Y, et al. Prevalence of recommended anticoagulation by guidelines preadmission and its impact on the incidence of acute myocardial infarction (AMI) and in-hospital outcomes after AMI in atrial fibrillation patients. J Thromb Thrombolysis, 2022; 54, 91−6. doi: 10.1007/s11239-021-02622-0 [126] Huang CX, Zhang S, Ma CS, et al. A report from registered catheter ablation of atrial fibrillation in China-2008. Chin J Card Arrhythmia, 2011; 15, 247−51. (In Chinese [127] Liu Y, Zhan XZ, Xue YM, et al. Incidence and outcomes of cerebrovascular events complicating catheter ablation for atrial fibrillation. Europace, 2016; 18, 1357−65. doi: 10.1093/europace/euv356 [128] Zhang JH, Zhou XH, Xing Q, et al. Epidemiological investigation of sudden cardiac death in multiethnic Xinjiang Uyghur Autonomous Region in Northwest China. BMC Public Health, 2019; 19, 116. doi: 10.1186/s12889-019-6435-8 [129] Gao YF, Liu WL, Li CL, et al. Common genotypes of long QT syndrome in China and the role of ECG prediction. Cardiology, 2016; 133, 73−8. doi: 10.1159/000440608 [130] Cao XN, Li Y, Wang Y, et al. Analysis of prevalence, related leads and forms of early repolarization in Chinese college athletes. Chin J Card Pacing Electrophysiol, 2015; 29, 102−5. (In Chinese [131] Hua W, Fan XH, Su YG, et al. The efficacy and safety of cardiac contractility modulation in patients with nonischemic cardiomyopathy: Chinese experience. Int J Heart Rhythm, 2017; 2, 29−33. doi: 10.4103/IJHR.IJHR_13_16 [132] Hu M, Han Y, Zhao WY, et al. Long-term cost-effectiveness comparison of catheter ablation and antiarrhythmic drugs in atrial fibrillation treatment using discrete event simulation. Value Health, 2022; 25, 975−83. doi: 10.1016/j.jval.2021.10.014 [133] Yang Y, Wang ZW, Chen Z, et al. Current status and etiology of valvular heart disease in China: a population-based survey. BMC Cardiovasc Disord, 2021; 21, 339. doi: 10.1186/s12872-021-02154-8 [134] Wang YS, Wu BT, Li J, et al. Distribution patterns of valvular and vascular complications in bicuspid aortic valve. Int Heart J, 2020; 61, 273−80. doi: 10.1536/ihj.19-467 [135] Zhao LJ, Chen LZ, Yang TB, et al. Birth prevalence of congenital heart disease in China, 1980-2019: a systematic review and meta-analysis of 617 studies. Eur J Epidemiol, 2020; 35, 631−42. doi: 10.1007/s10654-020-00653-0 [136] Zhao QM, Liu F, Wu L, et al. Prevalence of congenital heart disease at live birth in China. J Pediatr, 2019; 204, 53−8. doi: 10.1016/j.jpeds.2018.08.040 [137] Chinese Society of Extracorporeal Circulation. White book of Chinese cardiovascular surgery and extracorporeal circulation in 2021. Chin J Extracorpor Circ, 2022; 20, 196−9. (In Chinese [138] National Center for Cardiovascular Quality Improvement. 2021 Medical quality report of cardiovascular diseases in China: an executive summary. Chin Circ J, 2021; 36, 1041−64. (In Chinese [139] Zou YB, Song L, Wang ZM, et al. Prevalence of idiopathic hypertrophic cardiomyopathy in China: a population-based echocardiographic analysis of 8080 adults. Am J Med, 2004; 116, 14−8. doi: 10.1016/j.amjmed.2003.05.009 [140] Wang ZM, Zou YB, Song L, et al. Prevalence of idiopathic hypertrophic cardiomyopathy in 8080 adults by echocardiography. Chin J Cardiol, 2004; 32, 1090−4. (In Chinese [141] Li SE, Hou J, Wang T, et al. The prevalence of dilated cardiomyopathy in northern non-endemic areas of Keshan disease. Chin J Control Endem Dis, 2013; 28, 184−7. (In Chinese [142] Chinese Society of Cardiology. Retrospective investigation of hospitalized patients with heart failure in some parts of China in 1980, 1990 and 2000. Chin J Cardiol, 2002; 30, 450−4. (In Chinese [143] Cooperation Group of Precision Diagnosis and Treatment of Cardiomyopathy in Children, the Subspecialty Group of Cardiology, the Society of Pediatrics, Chinese Medical Association. Investigation and analysis of cardiomyopathy in children from 33 hospitals in China: a multicenter study of 4 981 cases from 2006 to 2018. Chin J Appl Clin Pediatr, 2021; 36, 983−9. (In Chinese [144] Chan WX, Yang SW, Wang J, et al. Clinical characteristics and survival of children with hypertrophic cardiomyopathy in China: a multicentre retrospective cohort study. eClinicalMedicine, 2022; 49, 101466. doi: 10.1016/j.eclinm.2022.101466 [145] Wang JZ, Wang YL, Zou YB, et al. Malignant effects of multiple rare variants in sarcomere genes on the prognosis of patients with hypertrophic cardiomyopathy. Eur J Heart Fail, 2014; 16, 950−7. doi: 10.1002/ejhf.144 [146] Wu GX, Liu LW, Zhou ZY, et al. East Asian-specific common variant in TNNI3 predisposes to hypertrophic cardiomyopathy. Circulation, 2020; 142, 2086−9. doi: 10.1161/CIRCULATIONAHA.120.050384 [147] Bao JR, Wang JZ, Yao Y, et al. Correlation of ventricular arrhythmias with genotype in arrhythmogenic right ventricular cardiomyopathy. Circ Cardiovasc Genet, 2013; 6, 552−6. doi: 10.1161/CIRCGENETICS.113.000122 [148] Chen L, Rao M, Chen X, et al. A founder homozygous DSG2 variant in East Asia results in ARVC with full penetrance and heart failure phenotype. Int J Cardiol, 2019; 274, 263−70. doi: 10.1016/j.ijcard.2018.06.105 [149] Rao M, Guo GR, Li MM, et al. The homozygous variant c. 245G >A/p. G82D in PNPLA2 is associated with arrhythmogenic cardiomyopathy phenotypic manifestations. Clin Genet, 2019; 96, 532−40. doi: 10.1111/cge.13642 [150] Wang WM, Wang JZ, Yao K, et al. Metabolic characterization of hypertrophic cardiomyopathy in human heart. Nat Cardiovasc Res, 2022; 1, 445−61. doi: 10.1038/s44161-022-00057-1 [151] Gu DF, Huang GY, He J, et al. Investigation of prevalence and distributing feature of chronic heart failure in Chinese adult population. Chin J Cardiol, 2003; 31, 3−6. (In Chinese [152] Hao G, Wang X, Chen Z, et al. Prevalence of heart failure and left ventricular dysfunction in China: the China hypertension survey, 2012-2015. Eur J Heart Fail, 2019; 21, 1329−37. doi: 10.1002/ejhf.1629 [153] Zhang YH, Zhang J, Butler J, et al. Contemporary epidemiology, management, and outcomes of patients hospitalized for heart failure in China: results from the China heart failure (China-HF) registry. J Card Fail, 2017; 23, 868−75. doi: 10.1016/j.cardfail.2017.09.014 [154] Working Group on Heart Failure, National Center for Cardiovascular Quality Improvement. 2020 Clinical performance and quality measures for heart failure in China. Chin Circ J, 2021; 36, 221−38. (In Chinese [155] Li Y, Sun XL, Qiu H, et al. Long-term outcomes and independent predictors of mortality in patients presenting to emergency departments with acute heart failure in Beijing: a multicenter cohort study with a 5-year follow-up. Chin Med J (Engl), 2021; 134, 1803−11. doi: 10.1097/CM9.0000000000001617 [156] Quan RL, Zhang GC, Yu ZX, et al. Characteristics, goal-oriented treatments and survival of pulmonary arterial hypertension in China: insights from a national multicentre prospective registry. Respirology, 2022; 27, 517−28. doi: 10.1111/resp.14247 [157] Li M, Wang Q, Zhao J, et al. Chinese SLE treatment and research group (CSTAR) registry: II. Prevalence and risk factors of pulmonary arterial hypertension in Chinese patients with systemic lupus erythematosus. Lupus, 2014; 23, 1085−91. doi: 10.1177/0961203314527366 [158] Jing ZC, Xu XQ, Han ZY, et al. Registry and survival study in Chinese patients with idiopathic and familial pulmonary arterial hypertension. Chest, 2007; 132, 373−9. doi: 10.1378/chest.06-2913 [159] Zhang R, Dai LZ, Xie WP, et al. Survival of Chinese patients with pulmonary arterial hypertension in the modern treatment era. Chest, 2011; 140, 301−9. doi: 10.1378/chest.10-2327 [160] Jiang X, Zhu YJ, Zhou YP, et al. Clinical features and survival in Takayasu's arteritis-associated pulmonary hypertension: a nationwide study. Eur Heart J, 2021; 42, 4298−305. doi: 10.1093/eurheartj/ehab599 [161] Zhou YP, Wei YP, Yang YJ, et al. Percutaneous pulmonary angioplasty for patients with Takayasu arteritis and pulmonary hypertension. J Am Coll Cardiol, 2022; 79, 1477−88. [162] Huang D, Chan PH, She HL, et al. Secular trends and etiologies of venous thromboembolism in Chinese from 2004 to 2016. Thromb Res, 2018; 166, 80−5. doi: 10.1016/j.thromres.2018.04.021 [163] Zhang Z, Lei JP, Shao X, et al. Trends in hospitalization and in-hospital mortality from VTE, 2007 to 2016, in China. Chest, 2019; 155, 342−53. doi: 10.1016/j.chest.2018.10.040 [164] Zhai ZG, Wang DY, Lei JP, et al. Trends in risk stratification, in-hospital management and mortality of patients with acute pulmonary embolism: an analysis from the China pUlmonary thromboembolism REgistry study (CURES). Eur Respir J, 2021; 58, 2002963. doi: 10.1183/13993003.02963-2020 [165] Zhai ZG, Kan QC, Li WM, et al. VTE risk profiles and prophylaxis in medical and surgical inpatients: the identification of Chinese hospitalized patients' risk profile for venous thromboembolism (DissolVE-2)-a cross-sectional study. Chest, 2019; 155, 114−22. doi: 10.1016/j.chest.2018.09.020 [166] Tang X, Lu K, Liu XF, et al. Incidence and survival of aortic dissection in urban China: results from the national insurance claims for epidemiological research (NICER) study. Lancet Reg Health West Pac, 2021; 17, 100280. doi: 10.1016/j.lanwpc.2021.100280 [167] Hagan PG, Nienaber CA, Isselbacher EM, et al. The international registry of acute aortic dissection (IRAD): new insights into an old disease. JAMA, 2000; 283, 897−903. doi: 10.1001/jama.283.7.897 [168] Wang WG, Duan WX, Xue Y, et al. Clinical features of acute aortic dissection from the registry of aortic dissection in China. J Thorac Cardiovasc Surg, 2014; 148, 2995−3000. doi: 10.1016/j.jtcvs.2014.07.068 [169] Duan WX, Wang WG, Xia L, et al. Clinical profiles and outcomes of acute type A aortic dissection and intramural hematoma in the current era: lessons from the first registry of aortic dissection in China. Chin Med J (Engl), 2021; 134, 927−34. doi: 10.1097/CM9.0000000000001459 [170] Chen JM, Gao Y, Jiang YX, et al. Low ambient temperature and temperature drop between neighbouring days and acute aortic dissection: a case-crossover study. Eur Heart J, 2022; 43, 228−35. doi: 10.1093/eurheartj/ehab803 [171] Li K, Zhang KW, Li TX, et al. Primary results of abdominal aortic aneurysm screening in the at-risk residents in middle China. BMC Cardiovasc Disord, 2018; 18, 60. doi: 10.1186/s12872-018-0793-5 [172] Jiang B, Li XT, Zhang DM, et al. Preliminary results of ultrasound screening program for abdominal aortic aneurysm in Liaoning Province, Northeast China. Chin J Vasc Surg, 2019; 4, 20−4. (In Chinese [173] Wang ZW, Wang X, Hao G, et al. A national study of the prevalence and risk factors associated with peripheral arterial disease from China: the China hypertension survey, 2012-2015. Int J Cardiol, 2019; 275, 165−70. doi: 10.1016/j.ijcard.2018.10.047 [174] Zhang XM, Ran XW, Xu ZR, et al. Epidemiological characteristics of lower extremity arterial disease in Chinese diabetes patients at high risk: a prospective, multicenter, cross-sectional study. J Diabetes Complications, 2018; 32, 150−6. doi: 10.1016/j.jdiacomp.2017.10.003 [175] Wang XJ. Epidemiological characteristics of carotid atherosclerosis and its association with cardiovascular disease in Chinese aged 40 years or older. Huazhong University of Science and Technology. 2018. (In Chinese [176] Wang YQ, Li LJ, Li Y, et al. The impact of dietary diversity, lifestyle, and blood lipids on carotid atherosclerosis: a cross-sectional study. Nutrients, 2022; 14, 815. doi: 10.3390/nu14040815 [177] Zhang L, Zhao JY, Fan Y, et al. Association among visceral adipose index, lipid accumulation product and carotid atherosclerosis in the population at high risk of stroke. Chin J Arterioscler, 2021; 29, 240−6. (In Chinese [178] Report on Stroke Prevention and Treatment in China Writing Group. Brief report on stroke prevention and treatment in China, 2020. Chin J Cerebrovasc Dis, 2022; 19, 136−44. (In Chinese [179] Sheng CS, Liu M, Zeng WF, et al. Four-limb blood pressure as predictors of mortality in elderly Chinese. Hypertension, 2013; 61, 1155−60. doi: 10.1161/HYPERTENSIONAHA.111.00969 [180] Che WQ, Jiang XJ, Dong H, et al. Etiology and anatomic characteristics of subclavian artery stenosis: analysis of data from 1793 patients hospitalized in Fuwai hospital between 1999 and 2017. Chin Circ J, 2018; 33, 1197−202. (In Chinese [181] Xu CS, Liu WG, Ye W. Meta-analysis of mesenteric arterial embolism or mesenteric arterial thrombosis. Chin J Gastrointest Surg, 2007; 10, 524−7. (In Chinese [182] Sun DL, Zhang ZY, Zhang YS, et al. A collection of misdiagnosis of ischemic enteropathy of the past decade in China. Clin Misdiagn Misther, 2009; 22, 68−70. (In Chinese [183] Xiong HL, Peng M, Jiang XJ, et al. Time trends regarding the etiology of renal artery stenosis: 18 years' experience from the China center for cardiovascular disease. J Clin Hypertens (Greenwich), 2018; 20, 1302−9. doi: 10.1111/jch.13356 [184] Liu D, Ma ZQ, Yang JG, et al. Prevalence and prognosis significance of cardiovascular disease in cancer patients: a population-based study. Aging (Albany NY), 2019; 11, 7948−60. [185] Zhang ZX, Pack Q, Squires RW, et al. Availability and characteristics of cardiac rehabilitation programmes in China. Heart Asia, 2016; 8, 9−12. doi: 10.1136/heartasia-2016-010758 [186] Li JN, Li LSW. Development of rehabilitation in China. Phys Med Rehabil Clin N Am, 2019; 30, 769−73. doi: 10.1016/j.pmr.2019.07.010 [187] Zhang N, Zhang YMF, Liu JY, et al. National rehabilitation medicine professional medical services and quality safety report, 2019. Chin J Phys Med Rehabil, 2020; 42, 1146−52. (In Chinese [188] Liu LL, Lu YQ, Bi QQ, et al. Effects of different intervention time points of early rehabilitation on patients with acute ischemic stroke: a single-center, randomized control study. Biomed Res Int, 2021; 2021, 1940549. [189] Wang FD, Zhang S, Zhou FH, et al. Early physical rehabilitation therapy between 24 and 48 h following acute ischemic stroke onset: a randomized controlled trial. Disabil Rehabil, 2022; 44, 3967−72. doi: 10.1080/09638288.2021.1897168 [190] Yu JJ, Zhou F, Zhang Y. Comparision of early interventional rehabilitation training with delayed training on motor function recovery in patients with cerebral haemorrhage. J Pak Med Assoc, 2020; 70, 71−7. [191] National Center for Cardiovascular Disease. Annual report on cardiovascular health and diseases in China 2022. Peking Union Medical College Press. 2023. (In Chinese -

 点击查看大图
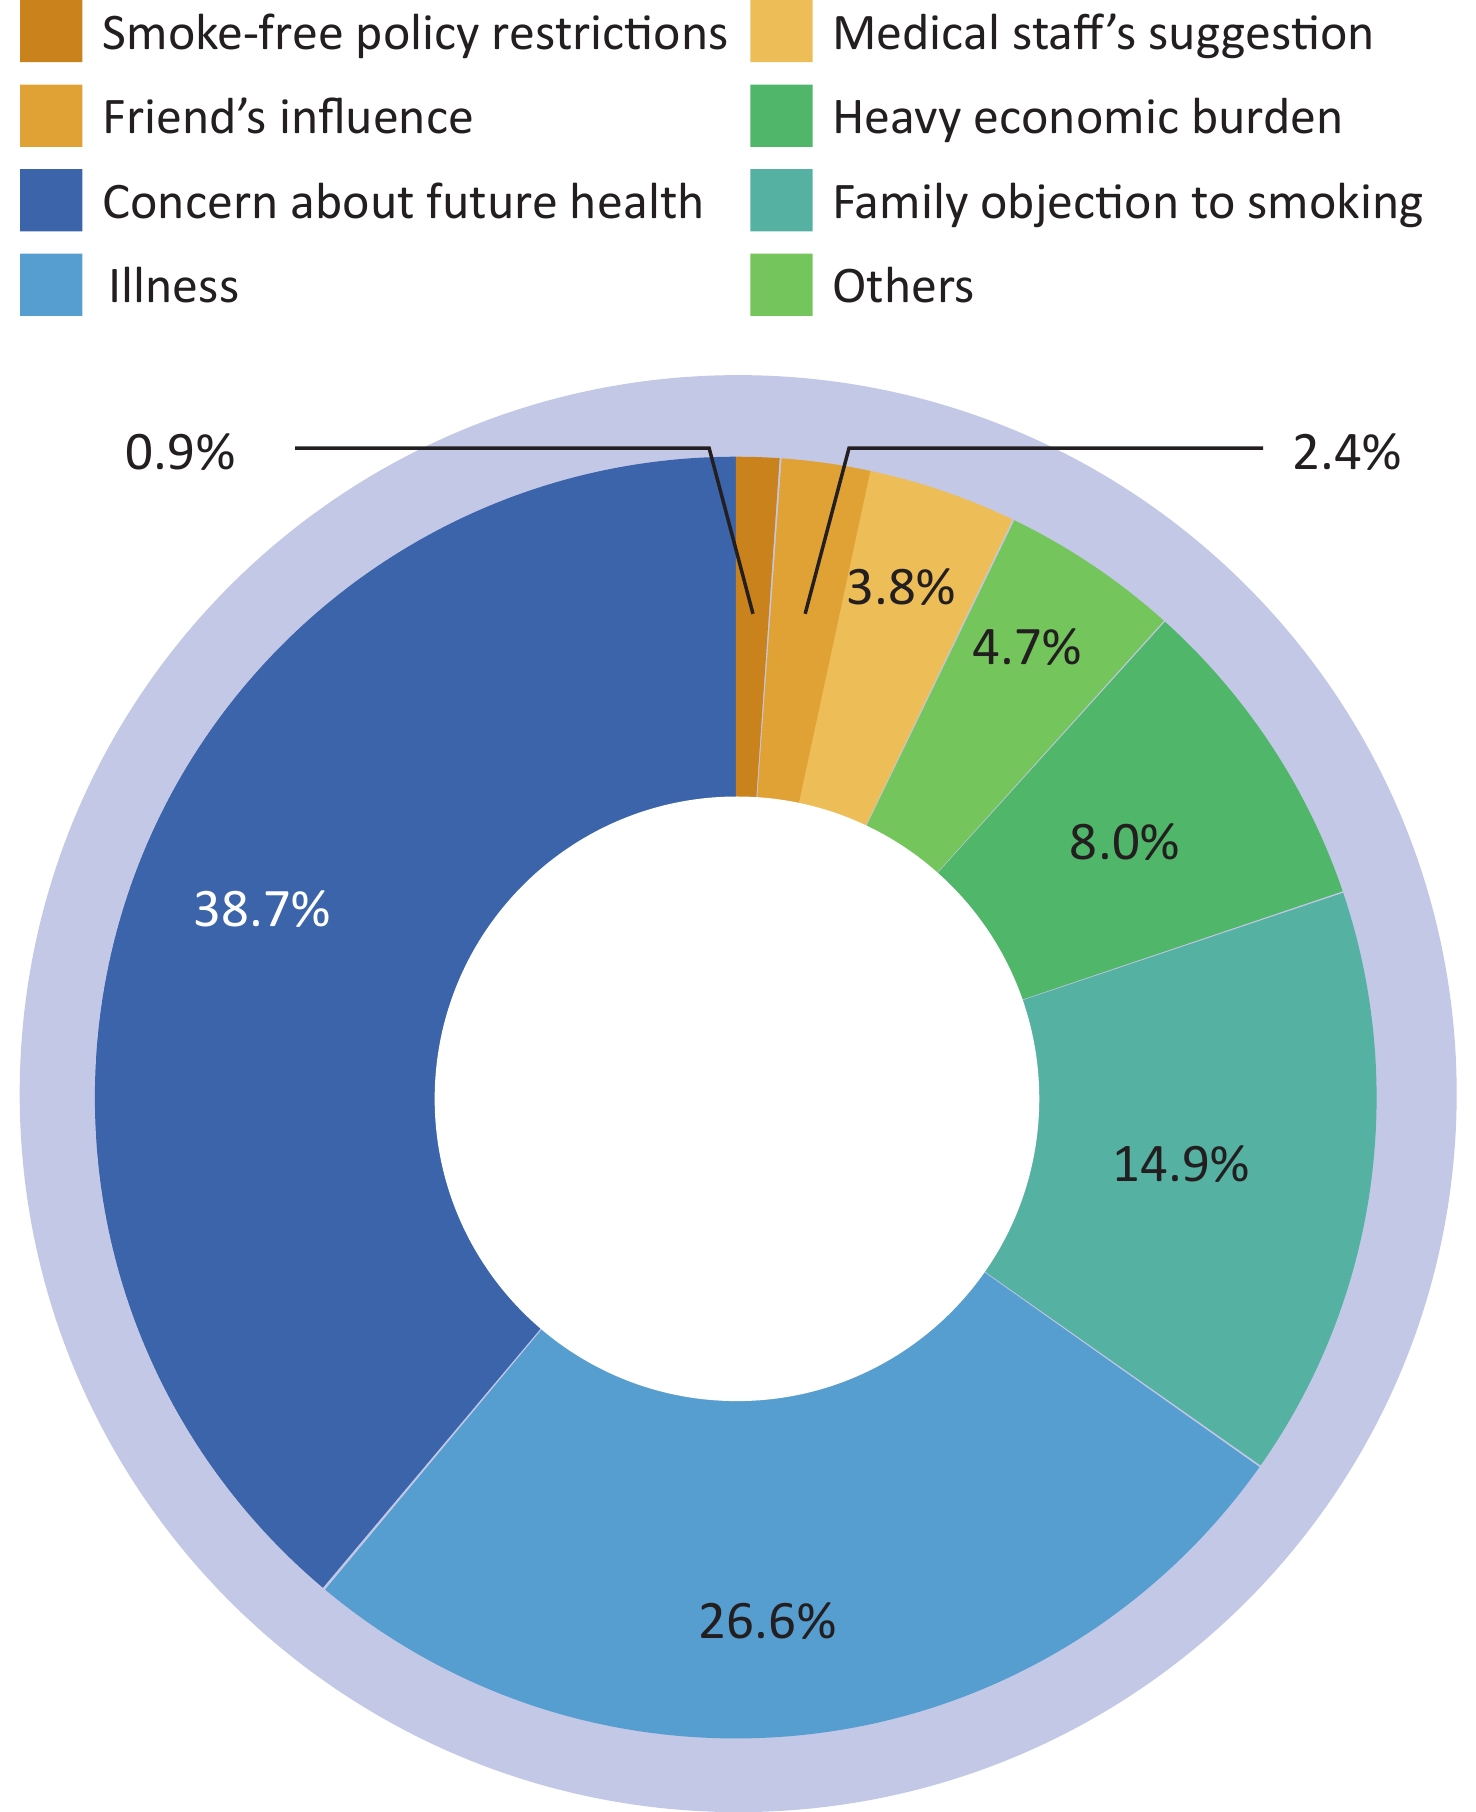
计量
- 文章访问数: 2784
- HTML全文浏览量: 1353
- PDF下载量: 372
- 被引次数: 0

 Quick Links