

 下载:
下载:

-
Di-(2-ethylhexyl) phthalate (DEHP) has been widely used in plasticizers in the manufacture of polyvinyl chloride (PVC)-based products, including food packaging, flooring and wall coverings, and children’s toys[1, 2]. However, DEHP is not stable and causes food, water, soil, and ambient air pollution[3, 4]. Additionally, people inevitably come into contact with this chemical through inhalation, skin contact, and, increasingly, ingestion[5]. The impact of DEHP on human health has therefore attracted great attention from investigators around the world.
In recent years, DEHP has been shown to be an environmental endocrine disruptor, or endocrine disrupting chemical (EDC), that can cause a variety of adverse effects on the human body. In animal studies, DEHP is obviously toxic towards endocrine function, including the function of sex and thyroid hormones, reproductive function, neurodevelopment, immune system function, and hepatocyte health and is a known carcinogen[6-8]. DEHP is not only widely present in the environment, but can also accumulate in the body. A previous study detected the DEHP metabolite mono (2-ethylhexyl) phthalate (MEHP) in urine samples from individuals of all ages[9]. Reducing the toxic effects of DEHP has therefore become a focus of environmental health research.
Soybean isoflavones (SIFs) are secondary metabolites formed during soybean growth and are found in large quantities in soybeans and soy products. They exhibit a variety of biological activities and act as functional ingredients in soybeans. Additionally, SIFs are structurally similar to estrogen and therefore bind to estrogen receptors and exhibit weak estrogenic activity. Recently, SIFs have received lots of attention due to their potential health benefits and their possible roles in the prevention of certain endocrine disorders, including osteoporosis, cardiovascular diseases, and cancer, and their dramatic improvement of aging-related parameters, Alzheimer’s disease symptoms, and potential neuroprotective effect on human cortical neurons[10-12]. It has been shown that the biological functions of SIFs may be related to its antioxidant and phytoestrogen activities[13, 14]. As a selective estrogen receptor modulator (SERM), SIFs could be potential therapeutic agents for the treatment of metabolic disorders and the prevention of obesity and diabetes[15]. Additionally, SIFs have recently been associated with low sperm counts in Asian and American adults[16] and have been shown to exhibit beneficial effects on pituitary-ovarian function in middle-aged female rats[17]. Moreover, in vitro studies have revealed that SIFs can decrease oleic acid-induced lipid accumulation via anti-inflammatory, antioxidant, and hypolipidemic actions[18]. A recent study showed that isoflavone therapies reduces adiposity and improve glucose and lipid metabolism[19]. However, these studies have focused on the protective effects of SIF towards certain diseases and tissue damage and on organellar levels rather than biological levels the body. A systemic approach is therefore necessary to determine if SIF prevents DEHP-induced toxicity.
Metabolomics can quantitatively and dynamically detect all metabolites in all biological samples, and has become an emerging science due to its specific analytical methods[20]. Metabonomics can produce a large amounts of metabolic data that can give surprisingly detailed insights into changes in metabolic processes in whole organisms[21]. Through metabonomics-based approaches, biochemical changes in easily accessible biological fluids, such as blood or urine, are measured and used as biomarkers of toxicity-related pathogenesis. In addition, these biomarkers can be linked to known biochemical pathways, and new biochemical processes can be suggested or biochemical processes involving toxic compounds can be identified. Moreover, some biomarkers may be indirect reflections of biochemical processes and their impact can only be understood from the perspective of the whole system, offering the opportunity to identify metabolic pathways and networks altered by different biological effects. In previous studies, the combined toxicity of phthalates and polychlorinated biphenyls (PCBs) was evaluated using metabonomics, demonstrating that metabonomics methods may be useful for studying the toxicity of environmental endocrine disruptors (EEDs)[22]. Recently, the use of metabonomics has been rapidly expanding and has become a useful tool because of its considerable potential for many applications[23].
Humans can be exposed to DEHP through ingestion, inhalation, and skin contact throughout their lives, which in turn affects endocrine, reproductive, and developmental processes[5]. The toxicity of DEHP is influenced by several factors, such as the nature of the DEHP sample, exposure levels, and exposure times. SIF is a part of a typical diet and binds to estrogen receptors and can acts as either an estrogen receptor agonists or antagonists[24], and may be metabolized through the same pathway as DEHP. We speculate that dietary SIF may interfere with DEHP toxicity at the metabolic level. Previous studies have performed metabolomics-related examinations of soy isoflavones and DEHP[25, 26]. However, little is known regarding the metabolic changes underlying the protective effects of SIFs against DEHP toxicity. In this study, we aimed to study the metabolic changes induced by exposure to DEHP in rats and use metabolomics to study the metabolic level effects underlying the protective effects of SIF towards DEHP toxicity in the body.
-
The reagents used in this study were DEHP (Tokyo Chemical Industry Co., Tokyo, Japan), SIF (93% pure, Xian Rongsheng Science and Technology, Co. Ltd., Xian, China), HPLC grade formic acid (Beijing Reagent Company, Beijing, China), HPLC grade methanol and acetonitrile (Dikma Science and Technology, Co. Ltd., Canada), leucine enkephalin (Sigma-Aldrich, St. Louis, MO, USA), and filtered distilled water (Millipore, Billerica, USA). The detection kits were aspartate aminotransferase (AST), alanine aminotransferase (ALT), creatinine (CRE), blood urea nitrogen (BUN), serum total cholesterol (TC), triglyceride (TG), high-density lipoprotein (HDL), and blood glucose (GLU) (Nanjing Jiancheng Bio-technology and Science Inc., Nanjing, China).
-
Thirty-two healthy female Wistar rats aged 4−6 weeks and weighing 60−80 g from Vital River Laboratory Animal Technology Co. Ltd (Beijing, China). They were studied in accordance with guidelines from the Institute of Zoology Animal and Medical Ethics Committee of Harbin Medical University, in line with current Chinese legislation. Rats were individually housed in stainless steel, wire-mesh cages with a controlled temperature range of 20 to 24 ℃, humidity of 50%−60% and a 12 h light/dark cycle. Rats were given free access to AIN-93 M diet and drinking water.
After adaptation for 7 d, rats were randomly assigned into 4 groups (n = 8/group): the control group (H), the SIF-treated group [A, oral SIF dose of 86 mg/(kg·day), according to our previous study], the DEHP-treated group [B, oral DEHP dose of 68 mg/(kg·day) at roughly twice the no-observed-adverse-effect levels (NOAEL)[27]], the and SIF plus DEHP-treated group (D). Animal age and treatment duration were based on the recommendations of EDSTAC (https://www.epa.gov/endocrine-disruption/endocrine-disruptor-screening-and-testing-advisory-committee-edstac-final). SIF was added to AIN-93M rodent food and DEHP was given daily by gavage and both continued to be administered for 30 d between 08:00 am and 10:00 am. Drinking water was given throughout the study. The clinical parameters of rats were recorded twice daily. Rats were weighed at the end of each week and the daily diet consumption recorded during the study (Supplementary Table S1, available in www.besjournal.com).
Table S1. Effects of SI and DEHP on the fundamental variables during the experiment
Group Daily food intakes (g/d) Food utilization rate (%) Liver/weight
(g/100 g)Kidney/weight (g/100 g) Palace fat/weight (g/100 g) Perirenal fat/weight (g/100 g) H 16.28 ± 1.03 26.2 ± 4.3 2.83 ± 0.38 0.77 ± 0.08 0.85 ± 0.38 1.01 ± 0.46 A 15.29 ± 0.76 25.9 ± 2.1 2.72 ± 0.18a 0.73 ± 0.04 0.49 ± 0.15 0.48 ± 0.15 B 16.34 ± 0.68 25.9 ± 5.5 3.54 ± 0.61b 0.83 ± 0.06 0.97 ± 0.39 0.94 ± 0.42 D 15.09 ± 1.69 23.9 ± 4.0 2.94 ± 0.22b 0.78 ± 0.07b 0.62 ± 0.37 0.64 ± 0.56 Note. Values are mean ± SD; Group H [0 mg/(kg·day)]; Group A [86 mg/(kg·day)]; Group B [68 mg/(kg·day)]; Group D [86 mg/(kg·day) + 68 mg/(kg·day)]. aSignificantly different from group H at P < 0.05. bSignificantly different from group B at P < 0.05. DEHP, di-(2-ethylhexyl) phthalate; SIF, soy isoflavones; SD, standard deviation; ANOVA, analysis of variance. -
After 30 d, rats were sacrificed under sodium pentobarbital anesthesia. Before the rats were sacrificed, blood samples were obtained from the abdominal aorta, and the blood was centrifuged at 3,000 rpm for 15 min to obtain serum, which was immediately stored at −80 ℃. Serum samples were analyzed using an Autolab-PM4000 automated biochemical analyzer (AMS Co., Rome, Italy) to detect AST, ALT, BUN, CRE, TC, TG, HDL, and GLU. Adipose tissue samples obtained from each rat were frozen in liquid nitrogen and stored at −80 ℃ until use. Analysis of serum and fat samples was performed by HPLC. The liver, kidney, pararenal fat, and perirenal fat of rats were extracted and weighed to calculate organ coefficients.
For metabonomics analysis, urine samples were collected on ice packs for 24 h from rat metabolic cages for 30 d. Urine samples were collected by centrifugation (10,000 rpm, 10 min) and stored at −80 ℃ until analysis. Prior to analysis, thawed urine samples were diluted with distilled water at a ratio of 1:3 (vol/vol) and vortexed for UPLC/MS analysis.
-
Chromatographic separation was performed using a Waters ACQUITY UPLC BEH-C18 Reversed-phase column (50 mm 4.6 mm i.d., 1.7 mm) (Waters Corporation, Milford, MA, USA). Analytes were eluted by a gradient method, which was performed using ten column volumes with 0.1% formic acid in water (mobile phase A) and 0.1% formic acid in acetonitrile (mobile phase B). The gradient was performed using an initial mobile phase B at 0%–2% for 0.5 min, 2%–20% B for 4.5 min, 20%–35% B for 2 min, 35%–70% B for 1 min, 70%–98% B for 2 min, 98% B for 2 min, 98%–2% for B 2 min, and finally 2% B for 10 min and the flow rate was 0.35 mL/min. Two µL aliquots of each sample were injected into a column maintained at 35 ℃. A wash cycle was performed on the autosampler to eliminate the carryover before each analysis and the eluent was introduced to the MS system in split mode.
-
UPLC/Q-TOF-MS (Waters Corporation, Milford, MA, USA) analysis was performed according to our previously published method[28] with a source temperature of 100 ℃, a cone gas flow of 50 L/h, a desolvation gas temperature of 300 ℃, a desolvation gas flow of 650 L/h, a capillary voltage of 3.0 kV in the positive ion mode, and a capillary voltage of 2.8 kV in the negative ion mode with a cone voltage of 35 V. A lock mass of leucine enkephalin for accurate mass acquisition was analyzed by a lock spray interface, and a flow rate of 10 µL/min [(M+H) = 556.2771] used for positive ion modes. A centroid mode was used from m/z 50 to 1,000 and a lock spray frequency of 0.40 s with averaging over ten scans (for corrections) were used to collect MS data. Order effects in statistical analysis were avoided using a randomized crossover design. MS/MS spectra of potential biomarkers were evaluated for reproducibility using partial least squares discriminant analysis (PLS-DA) and representative pooled quality control (QC) samples.
-
Peak finding, peak alignment, and for reporting the mass, retention time, and intensity of the peaks in each sample were calculated according to our previously published method[28]. UPLC/Q-TOF-MS data were processed using the MarkerLynx Application Manager 4.1 SCN 714 (Waters Corporation, Milford, MA, USA). Multivariate statistical analysis via principal components analysis (PCA) was performed using EZinfo 2.0 software. The ions with the most inter-sample variation were identified as biomarkers according to the Variable Importance in the Projection (VIP) idea and their exact masses. VIP values > 1.5 in the model were combined with the conditional differential calculation method of ANOVA to identify potential biomarkers. To reveal the net treatment effects on subjects to determine which ions have the greatest effect on sample variance, powerful multi-variate analysis via PCA and PLS-DA were performed by EZinfo software.
To analyze relative intensities of the isotopic peaks of the high-resolution MS spectra, a formula for identifying potential biomarkers was first identified based on accurate mass measurements (mass error < 30 PPM). Second, the Mass Fragment TM Application Manager (MassLynx v4.1, Waters Corp., USA) was used to analyze MS/MS fragment ions using a chemical intelligence peak matching algorithm. Standard samples with known and accurate masses were examined and MS spectra of the unknowns matched with the MS spectra of these standards obtained from various databases, including the Human Metabolome Database (HMDB, http://www.hmdb.ca), METLIN (http://metlin.scripps.edu/), and MassBank (http://www.massbank.jp/). This allowed for identification of potential biomarkers. Finally, all biomarkers identified by MS were verified by authentic chemical standards analyzed using MS/MS and retention time (RT).
The relevant pathways for identified biomarkers were determined using databases like HMDB (http://www.hmdb.ca) and the Kyoto Gene and Genomic Encyclopedia (KEGG, http://www.genome.jp/kegg/). In addition, other pathways involving identified biomarkers were identified using references.
-
The following parameters were established for multivariate statistical analysis using EZinfo software: noise elimination level 10.00, Mass window 0.02 Da, RT tolerance 0.01 min, and RT window 0.2 min. The high and low mass ranges were 1,000 Da and 50 Da, respectively, and the initial and final retention times were 0.5 min and 16 min, respectively. The identified and aligned low molecular weight metabolites correspond to chromatographic peaks in base peak intensity (BPI) chromatograms. The resulting 3D matrix containing specified peak indices (RT-m/z pairs), the sample name, and normalized ion strength of each peak area was exported to EZINFO 2.0 to visualize the score map and use PLS-DA to get the maximum VIP value. Pareto-scaling was used to avoid chemical noise prior to multivariate statistical analysis.
One-way ANOVA followed by LSD or Dunnett T3 was used for statistical analysis via SPSS (version 17.0; Beijing Stats Data Mining Co. Ltd, Beijing, China). Data are presented as mean ± standard deviation (SD) and a two-tailed P value < 0.05 was considered significant.
-
The daily food intake of group A and group B were not significantly different from group H after 30 d (P > 0.05) (Supplementary Table S1). The concentration of DEHP in serum and fat of group A decreased, but was not significantly different compared to group H (P > 0.05). The levels of DEHP in serum and fat of group B and D were significantly higher than those of group H (P < 0.05, Table 1). However, the levels of DEHP in serum and fat of group D were significantly lower compared to group B (P < 0.05), indicating that SIF can reduce DEHP levels in rat serum and fat.
Table 1. The influence of SIF on DEHP levels of in rat fat and serum (means ± SD, μg/g)
Groups DEHP in fat DEHP in serum H 0.16 ± 0.07 0.21 ± 0.12 A 0.14 ± 0.08 0.13 ± 0.11 B 1.09 ± 0.31a 1.13 ± 0.64a D 0.83 ± 0.28ab 0.87 ± 0.31ab Note. aP < 0.05 compared to group H. bP < 0.05 compared to group B. DEHP, di-(2-ethylhexyl) phthalate; SIF, soy isoflavones; SD, standard deviation. -
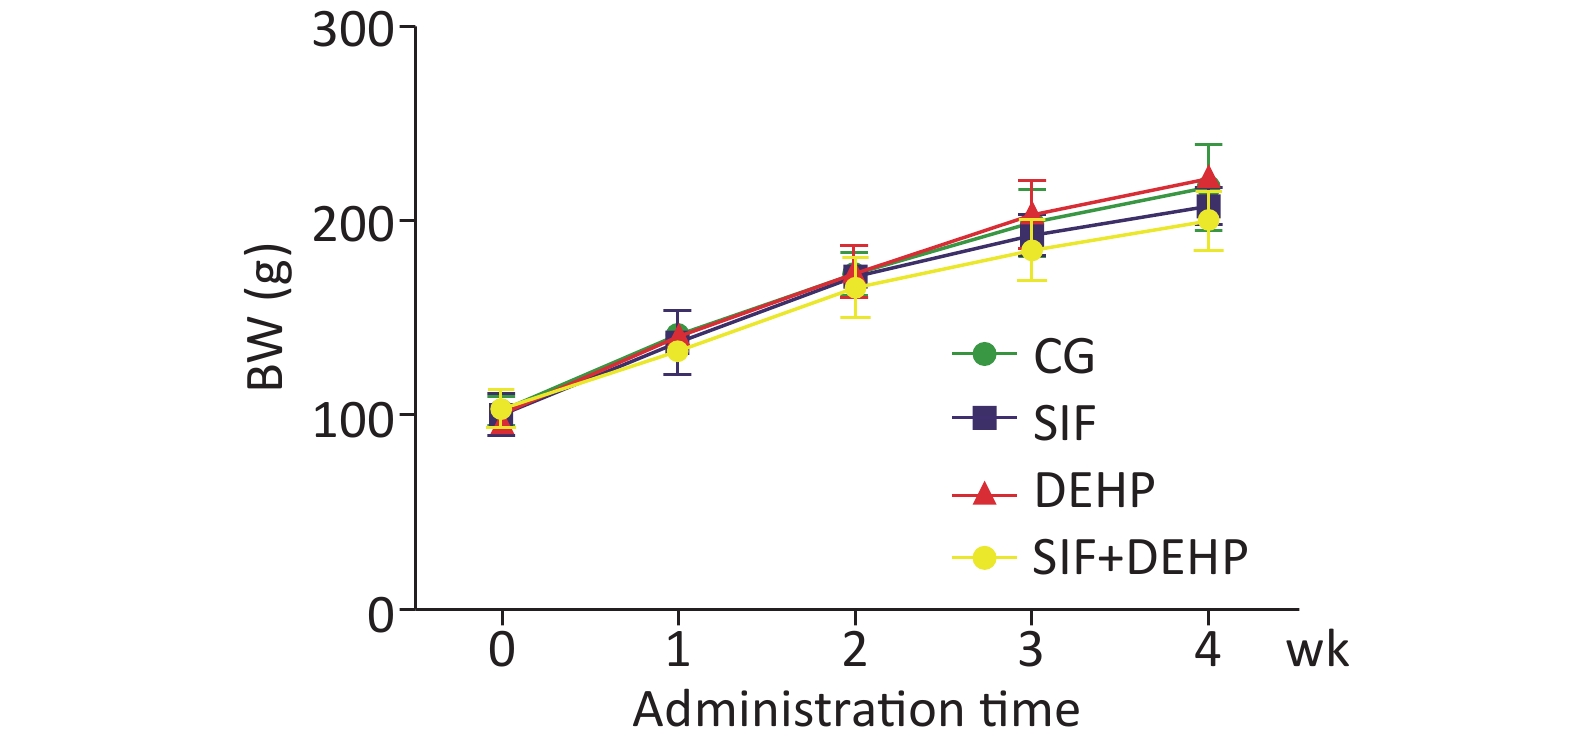
The body weight (BW) of all rats in all groups were recorded. Figure 1 showed that the BW slowly increased in the first 2 weeks, then noticeably increased in the last 2 weeks. However, there was no significant difference in BW changes between the experimental groups and the time-matched control groups at each time point (P > 0.05).
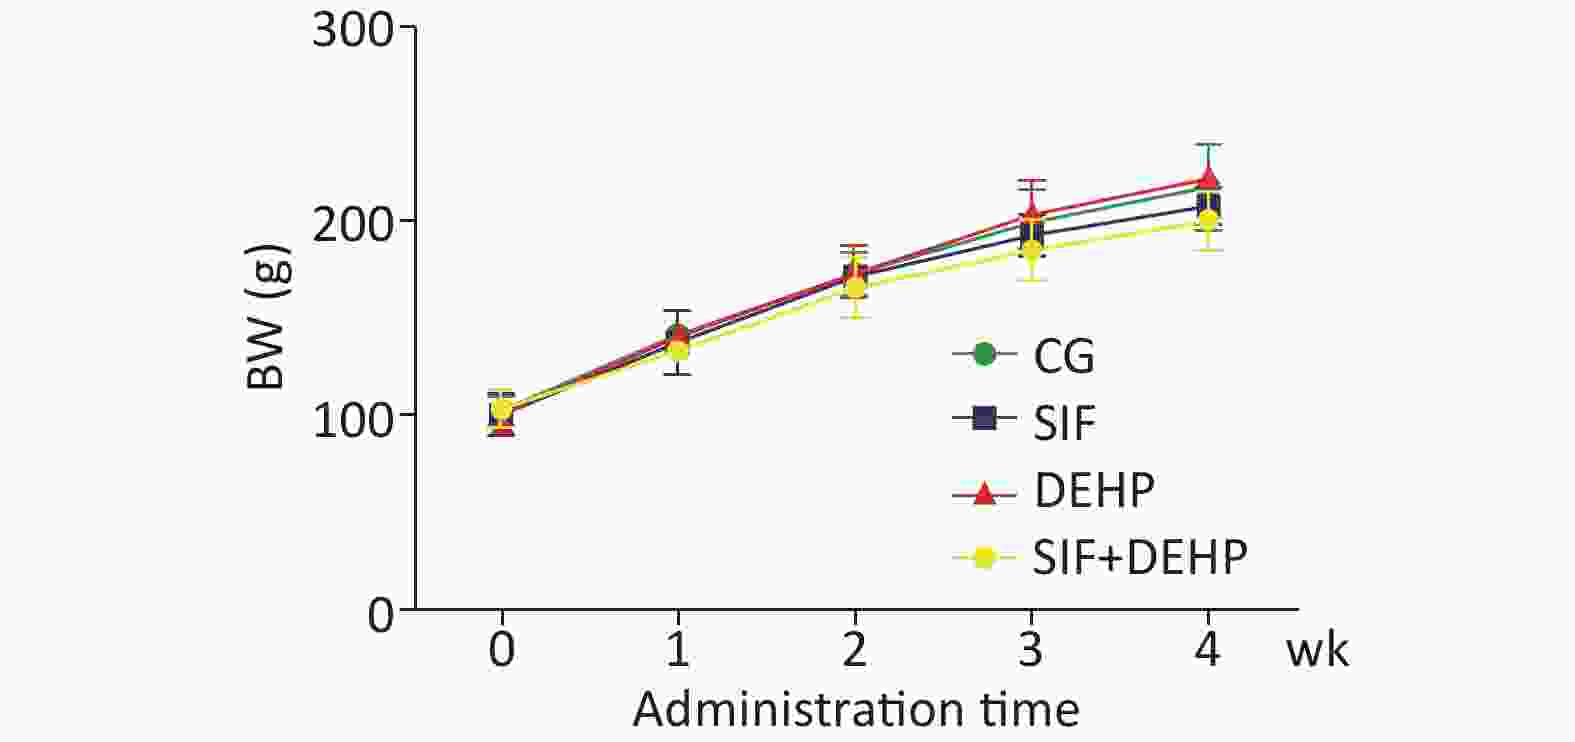
Figure 1. Rat body weight (BW) at each time point. Each data point represents mean ± standard deviation (SD). CG, control group; SIF, group A; DEHP, group B; SIF+DEHP, group D. DEHP. di-(2-ethylhexyl) phthalate; SIF, soy isoflavones. wk, week.
-
Clinical parameters were measured in order to evaluate the toxic effects of DEHP (Table 2). Serum levels of ALT, AST, BUN, CRE, TC, TG, HDL, and GLU were significantly higher in group B than group H at 4 weeks post- treatment (P < 0.05), respectively. However, these parameters were significantly lower in group D compared to group B 4 weeks post-treatment (P < 0.05).
Table 2. Effects of SIF and DEHP on liver enzyme activities, kidney function, fatty acids levels,and energy metabolism (means ± SD, n = 8)
Groups ALT (U/L) AST (U/L) BUN (mmol/L) CRE (µmol/L) TC (mmol/L) TG (mmol/L) HDL (mmol/L) GLU (mmol/L) H 108.53 ± 7.31 35.89 ± 3.67 4.73 ± 1.02 35.15 ± 7.31 4.89 ± 1.46 1.89 ± 0.16 1.45 ± 0.26 3.89 ± 0.86 A 110.32 ± 15.28b 37.28 ± 8.15b 4.32 ± 1.18b 40.32 ± 12.46 5.32 ± 2.08 2.52 ± 0.87 1.54 ± 0.68 4.02 ± 0.69b B 140.32 ± 10.18a 55.79 ± 4.62a 7.51 ± 0.56a 60.72 ± 8.58a 6.89 ± 0.36a 3.24 ± 0.48a 2.51 ± 0.31a 7.89 ±0.33a D 125.67 ± 6.42ab 45.38 ± 3.54ab 5.24 ± 0.39ab 45.42 ± 5.96ab 3.89 ± 0.96b 2.71 ± 0.27ab 1.89 ± 0.86ab 5.89 ± 0.56ab Note. aP < 0.05 compared to group H. bP < 0.05 compared to group B. DEHP, di-(2-ethylhexyl) phthalate; ALT, alanine aminotransferase; AST, aspartic transaminase; BUN, urea nitrogen; CRE, Creatinine; TC, Serum total cholesterol; TG, Triglyceride; HDL, High-density lipoprotein; GLU, Blood glucose. -
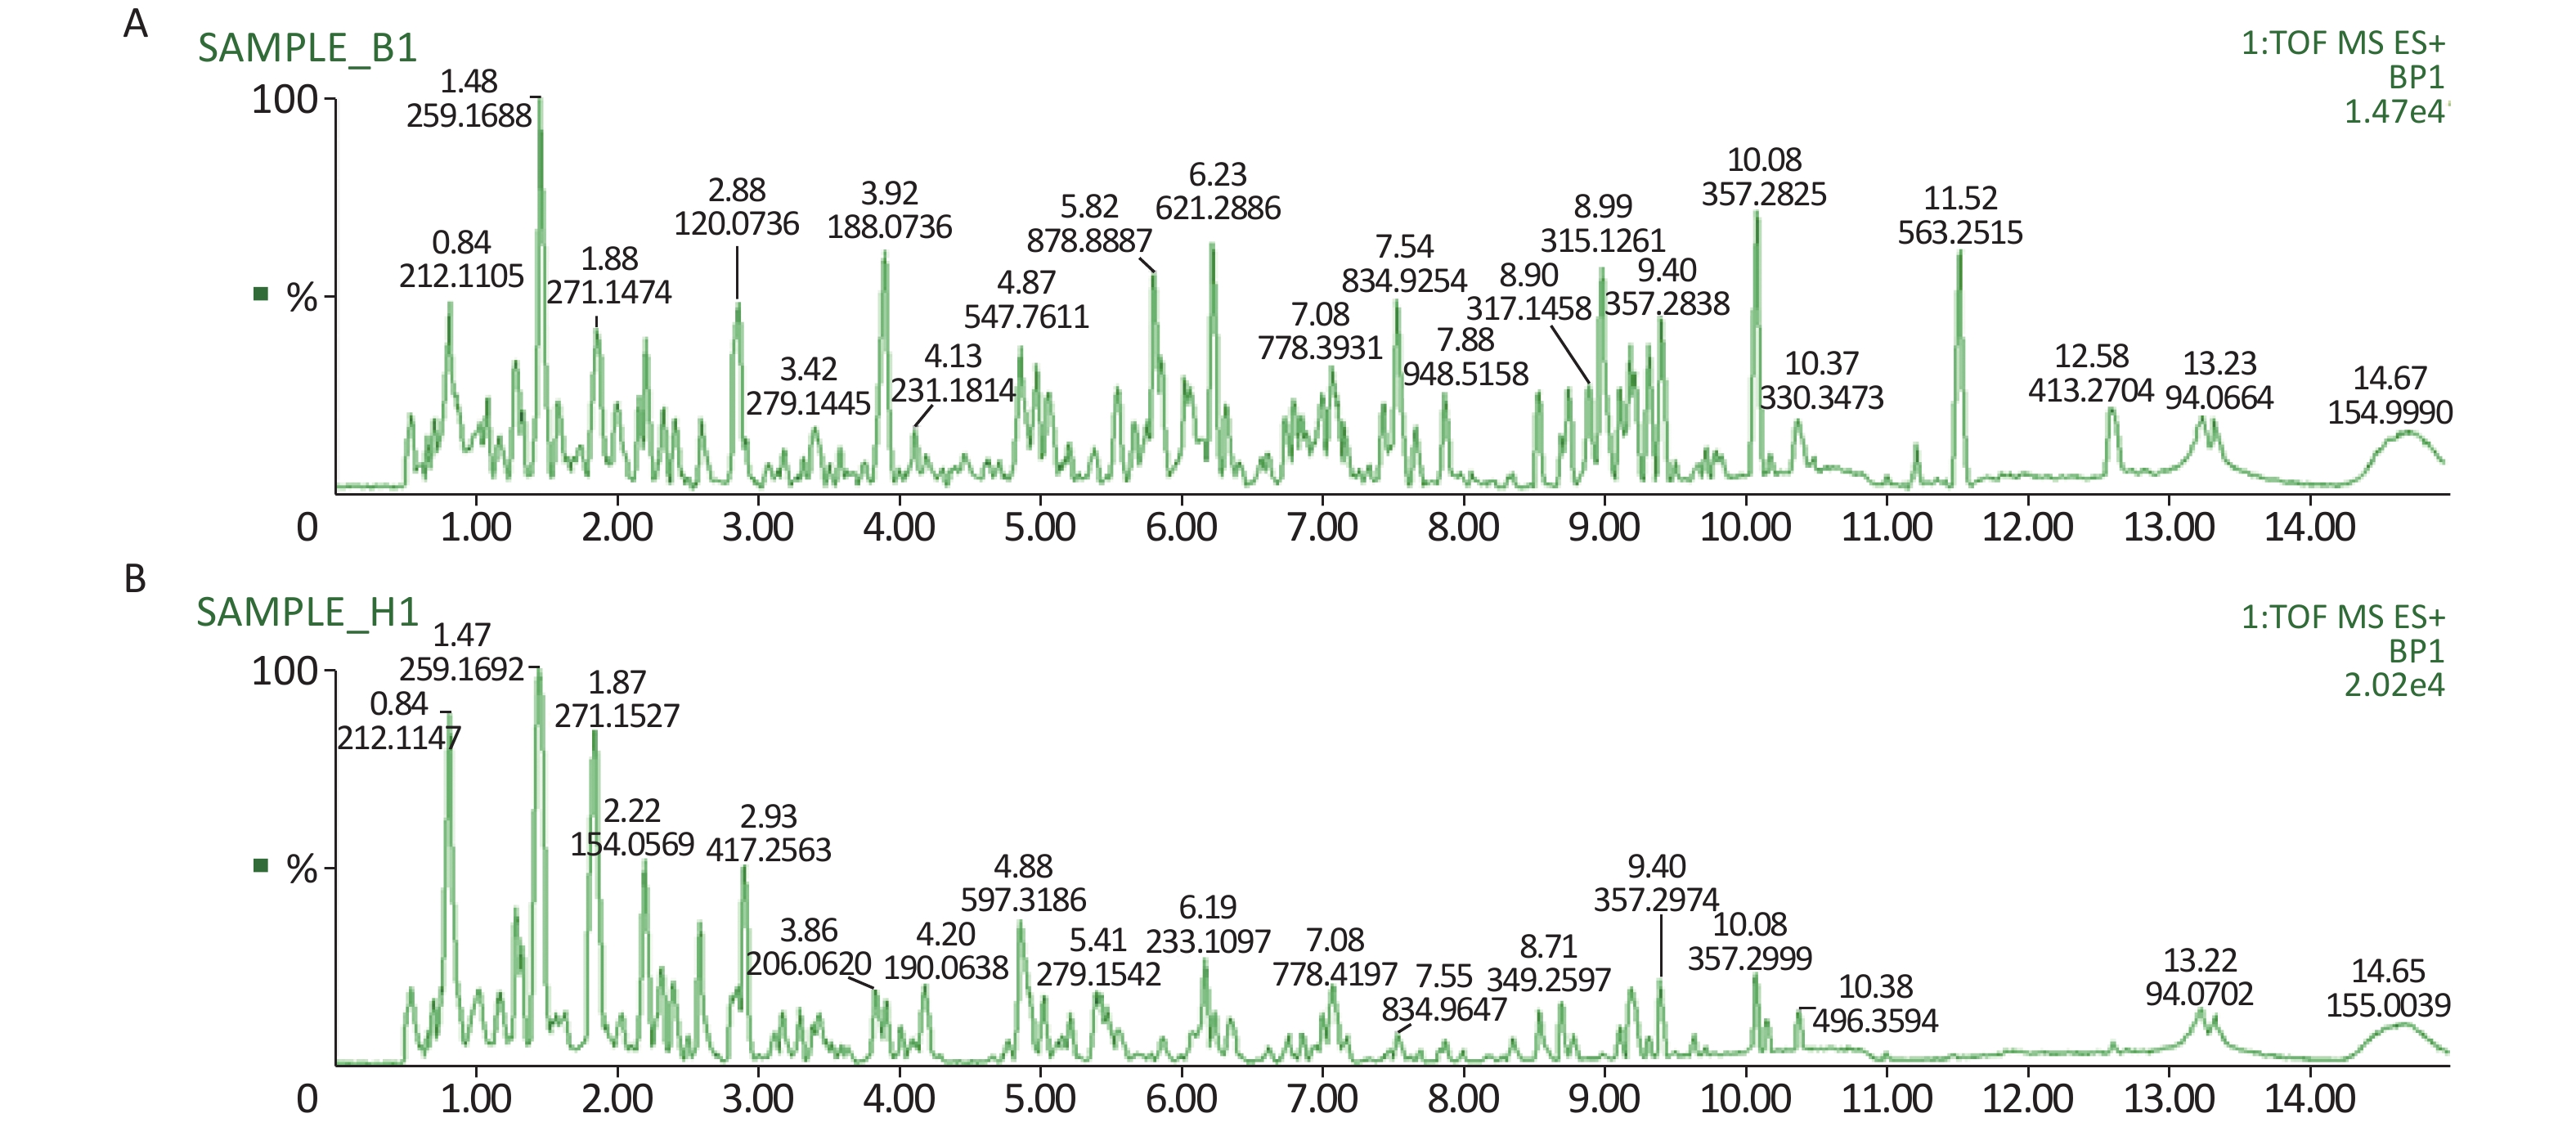
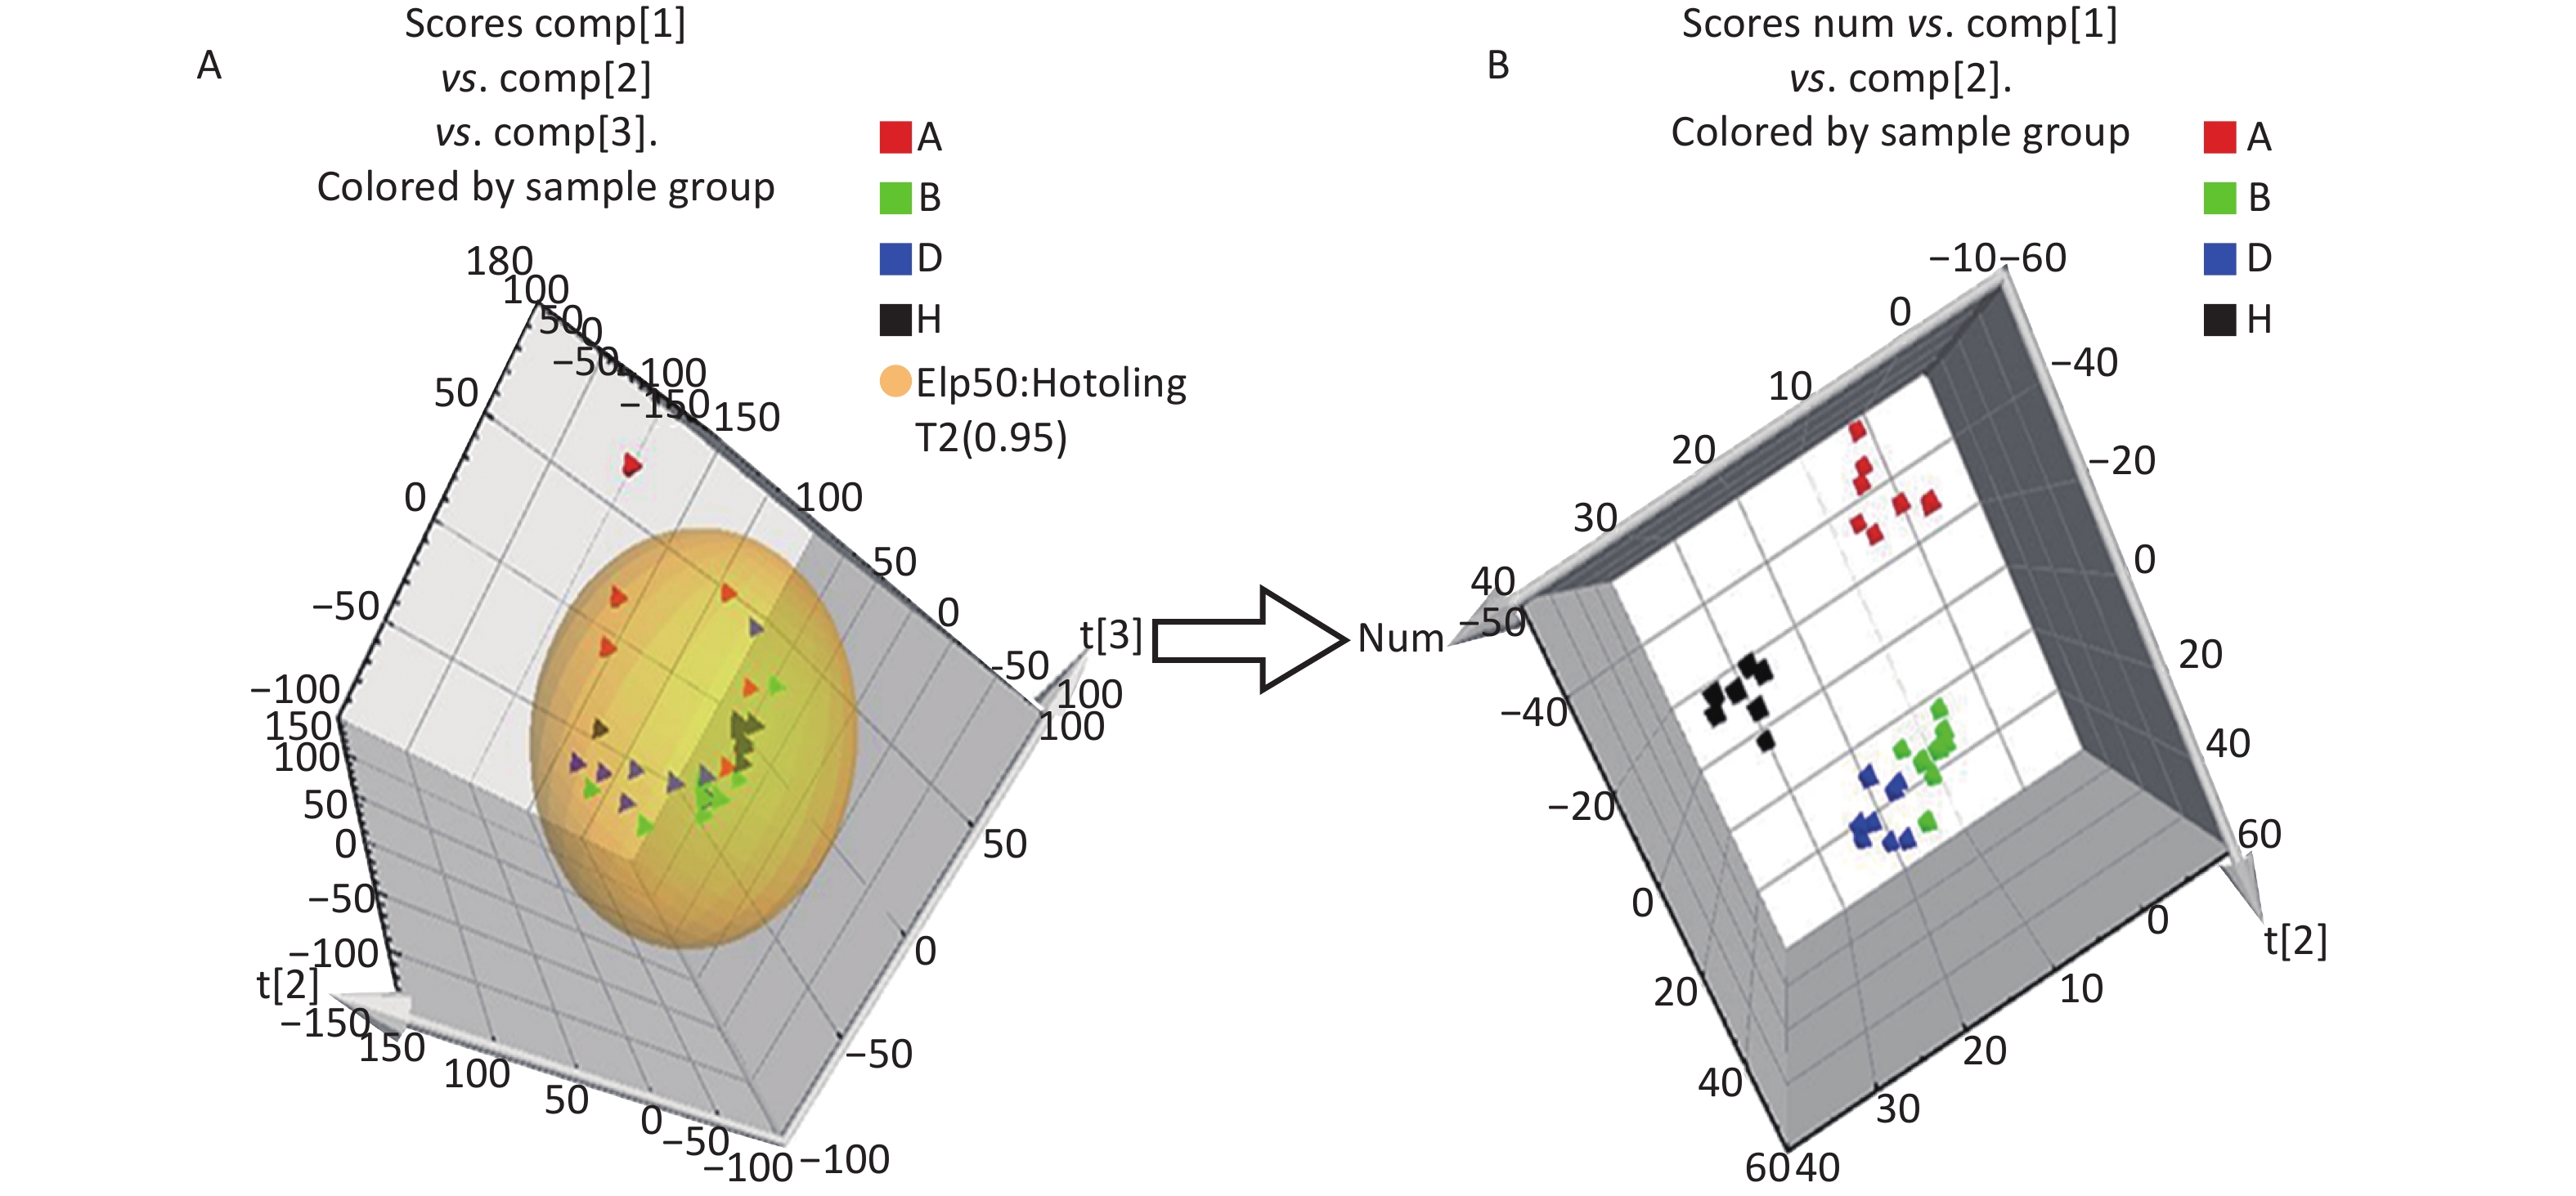
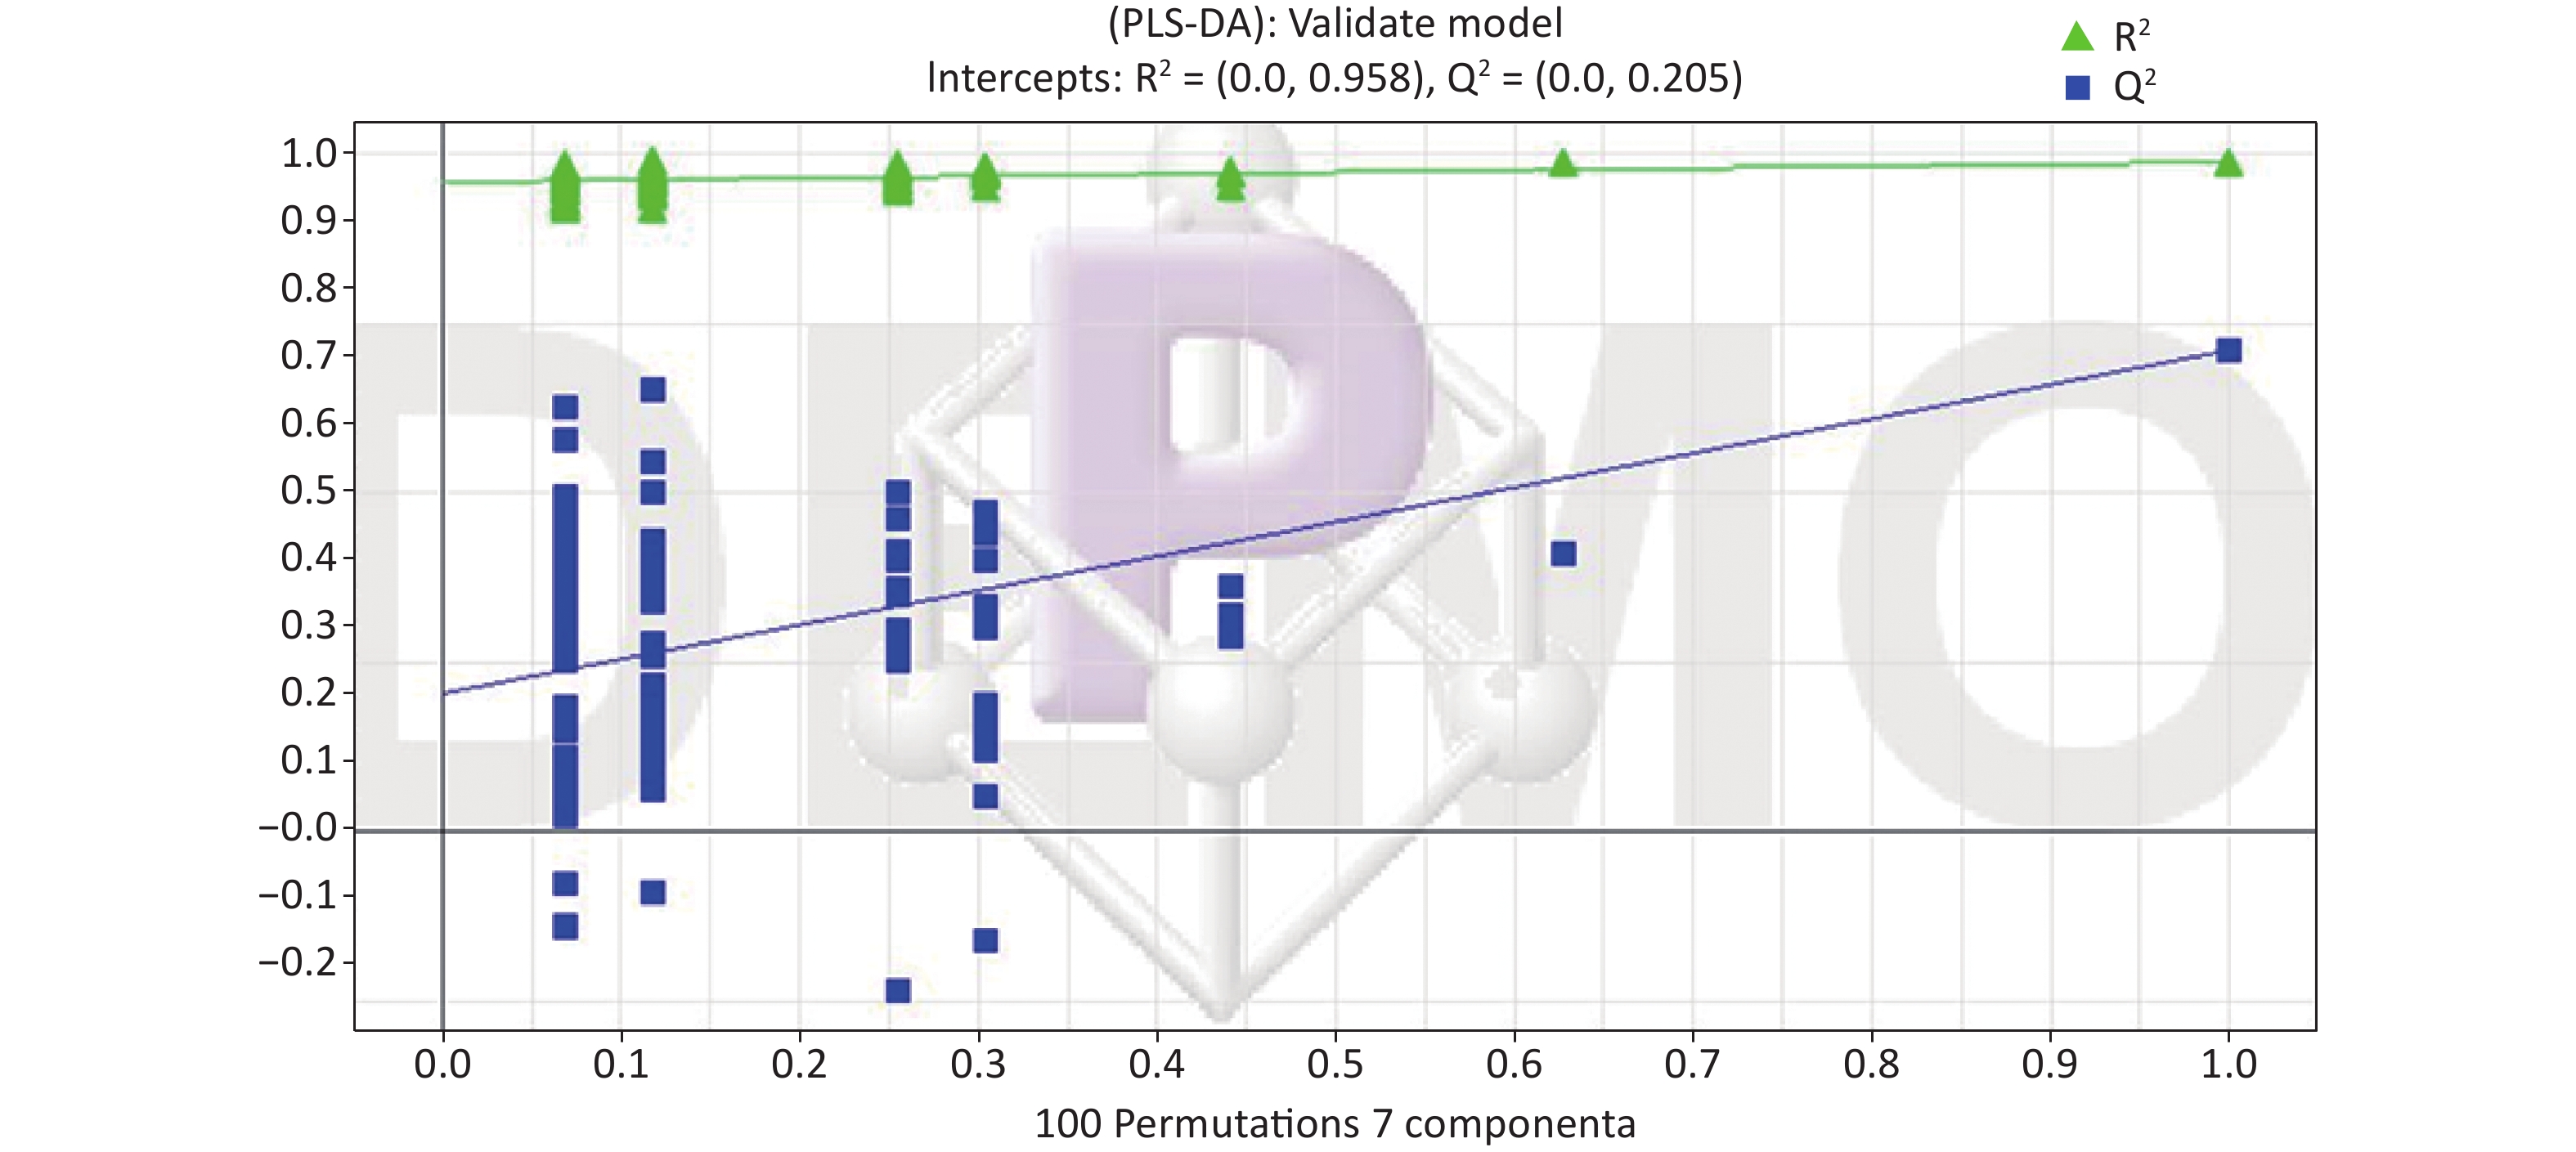
All metabolic profiling of urine was performed in both positive ionization modes to identify as many compounds as possible (Figure 2). There were certain significant metabolic changes between the control and treatment groups as observed visually by UPLC-MS in two different positive ionization modes. Additionally, four unsupervised PCA and supervised PLS-DA models were constructed to elucidate more subtle metabolic changes and characterize their metabolite feature. PCA was performed (scores plot in Figure 3A), to identify metabolite changes of the positive-ion mode ESI data. The data plots of treatment groups showed limit overlap with the data plot of the control group. PLS-DA analysis analyzes measured variables and identifies correlations between measured data with properties of interest. Using the obtained PLS-DA score map as a positive control (for the first seven components, R2Y = 0.958 and Q2 = 0.205, Figure 3B), the three treatment groups and the control group formed four independent clusters in the PLS-DA map of data from 4 weeks post-treatment. In order to evaluate the potential errors of the current PLS-DA model, one hundred permutation tests for PLS-DA were applied. All R2Y and Q2 values on the left were lower than the original points on the right (Figure 4), suggesting that exposure results in changes in the urine metabolite composition of these rats.
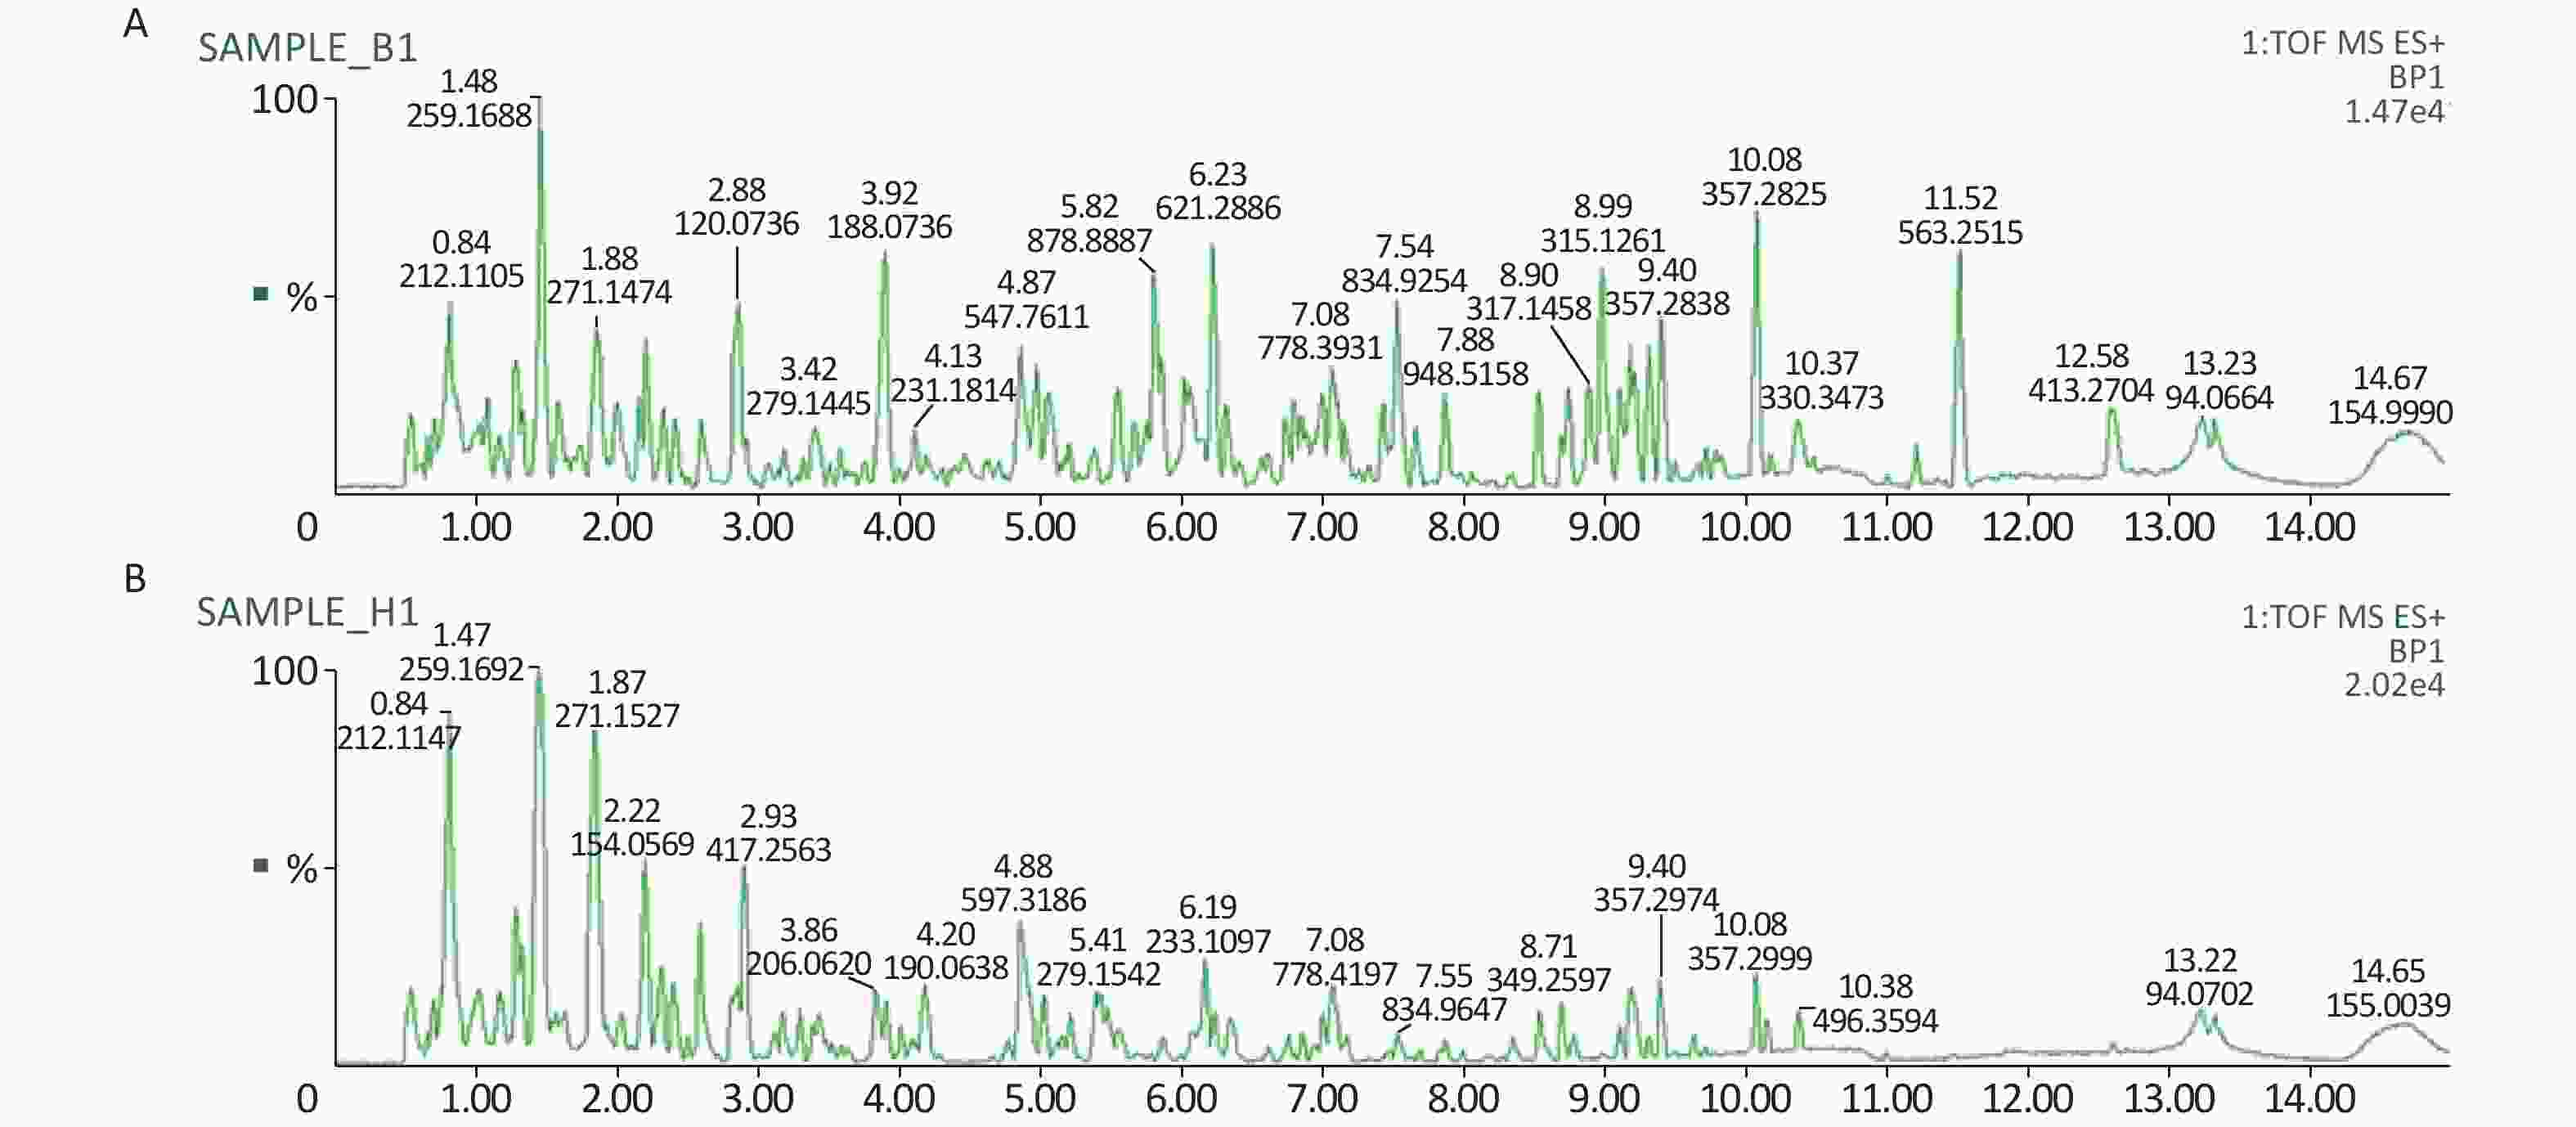
Figure 2. A representative BPI chromatograms of urine in a positive mode in the control (A) and treatment group (B) at week 4 using UPLC/ESI-Q-TOF/MS. BPI, base peak intensity
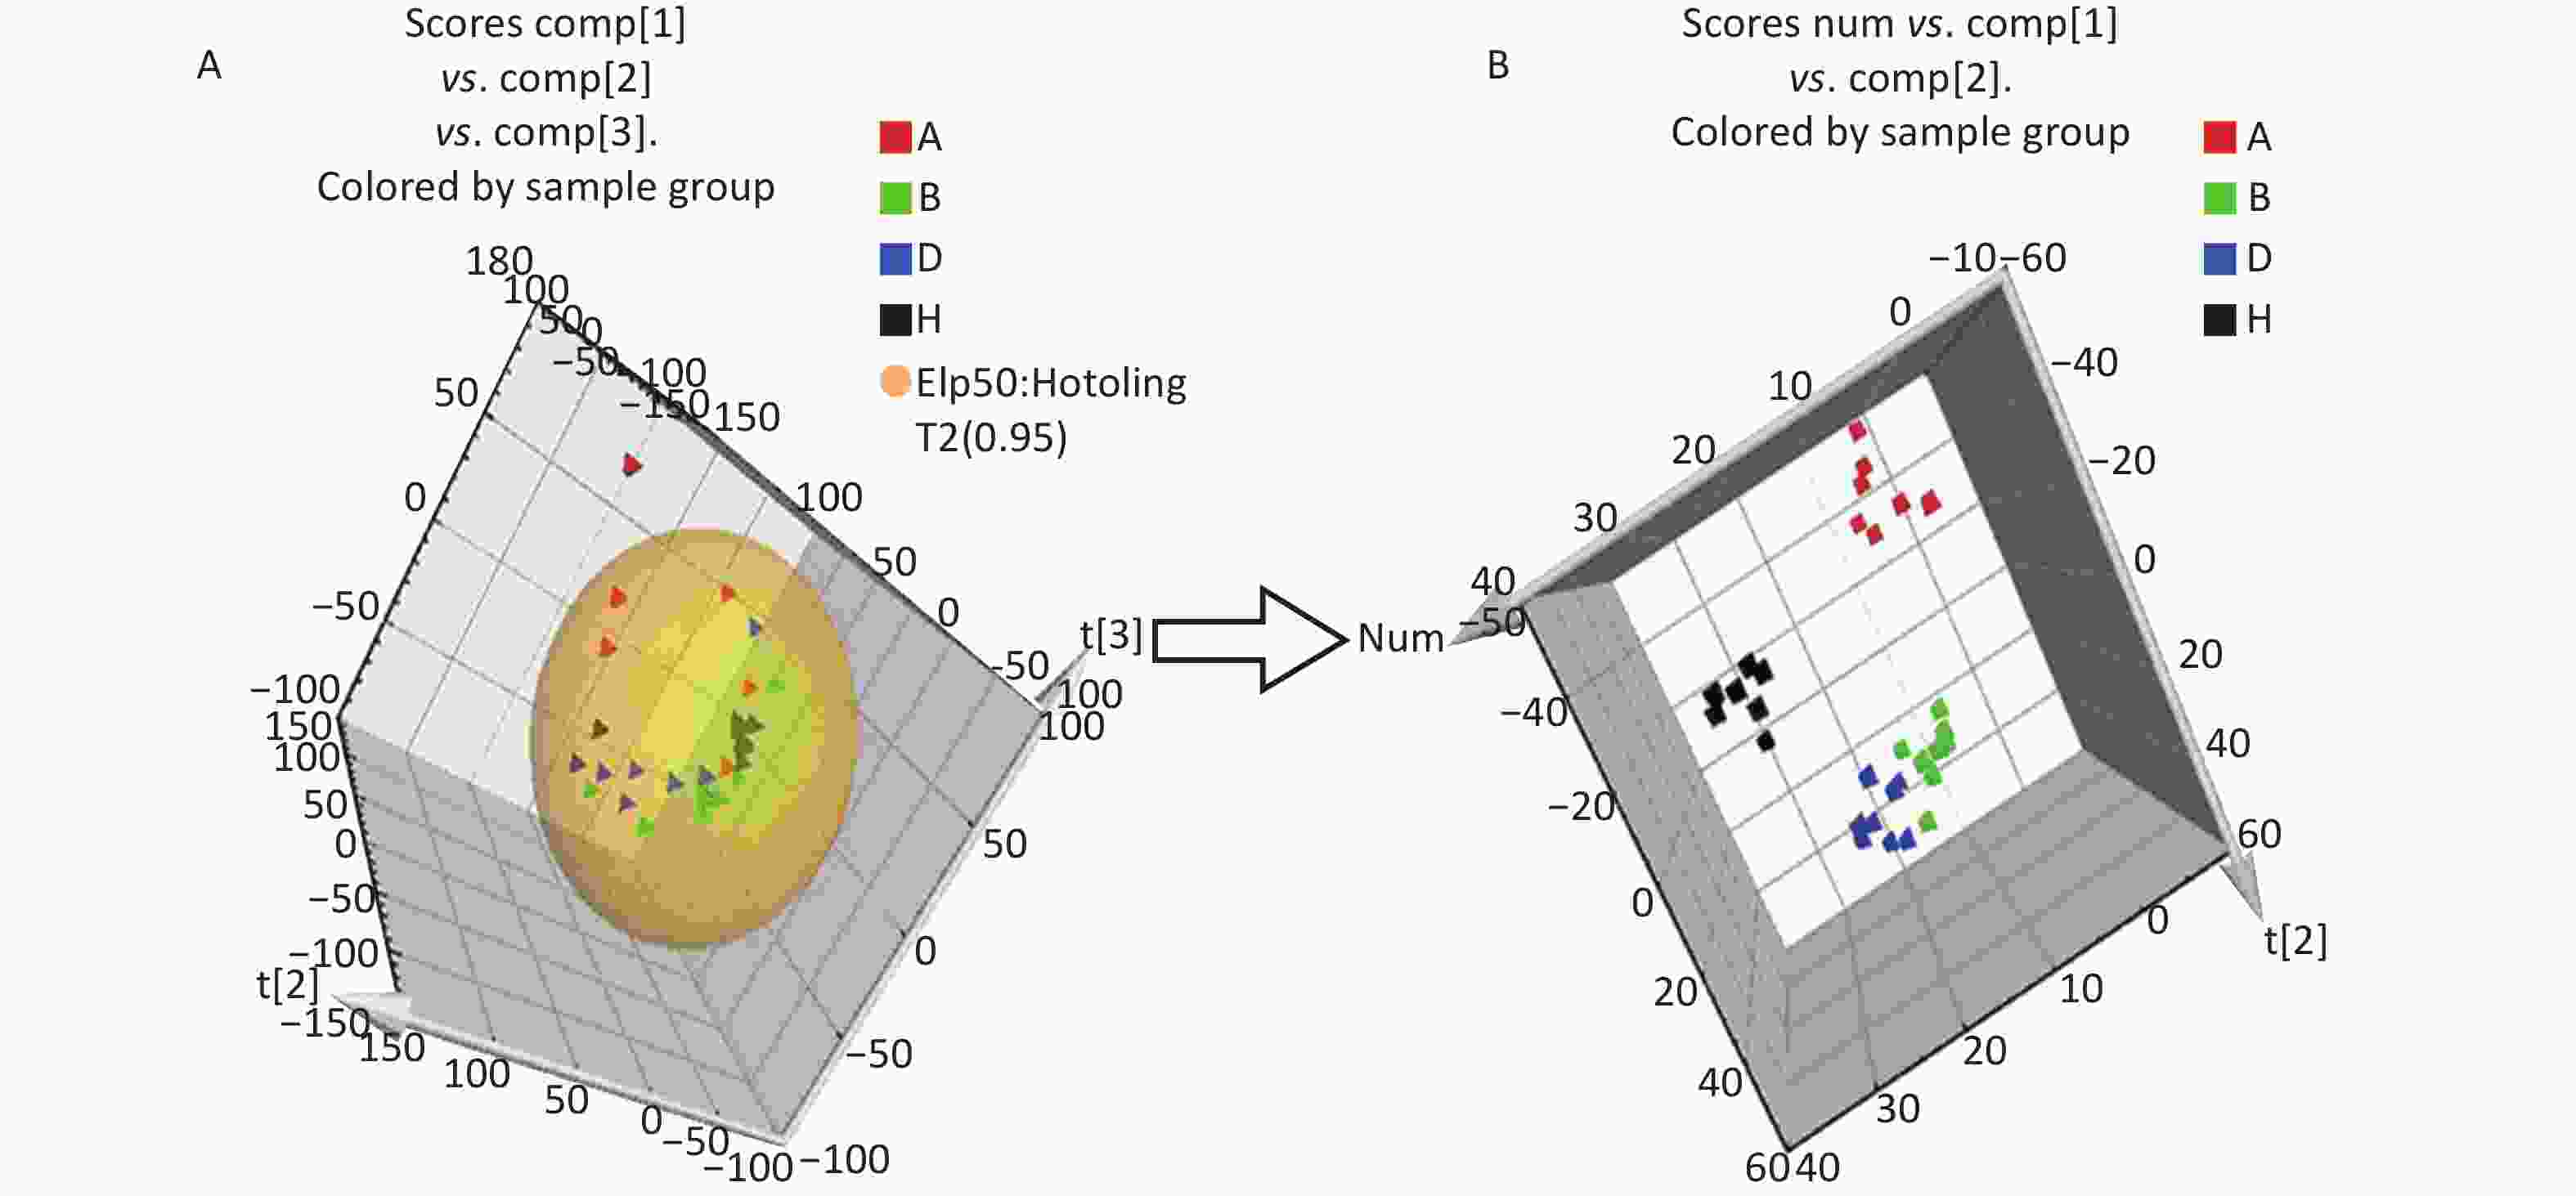
Figure 3. The PCA and PLS-DA 3D score plots of data from control and treatment groups derived from UPLC/ESI-Q-TOF/MS analysis of urine in positive (A, B) ESI mode. Group A: red triangle or square; Group B: green triangle or square; Group D: blue triangle or square; Group H (control group): black triangle or square. ESI, electrospray ionization; MS, mass spectrometry; PCA, principal component analysis; UPLC/ESI-Q-TOF/MS, ultra-performance liquid chromatography coupled with electrospray ionization quadrupole time-of-flight mass spectrometry; PLS-DA, partial least squares-discriminant analysis.
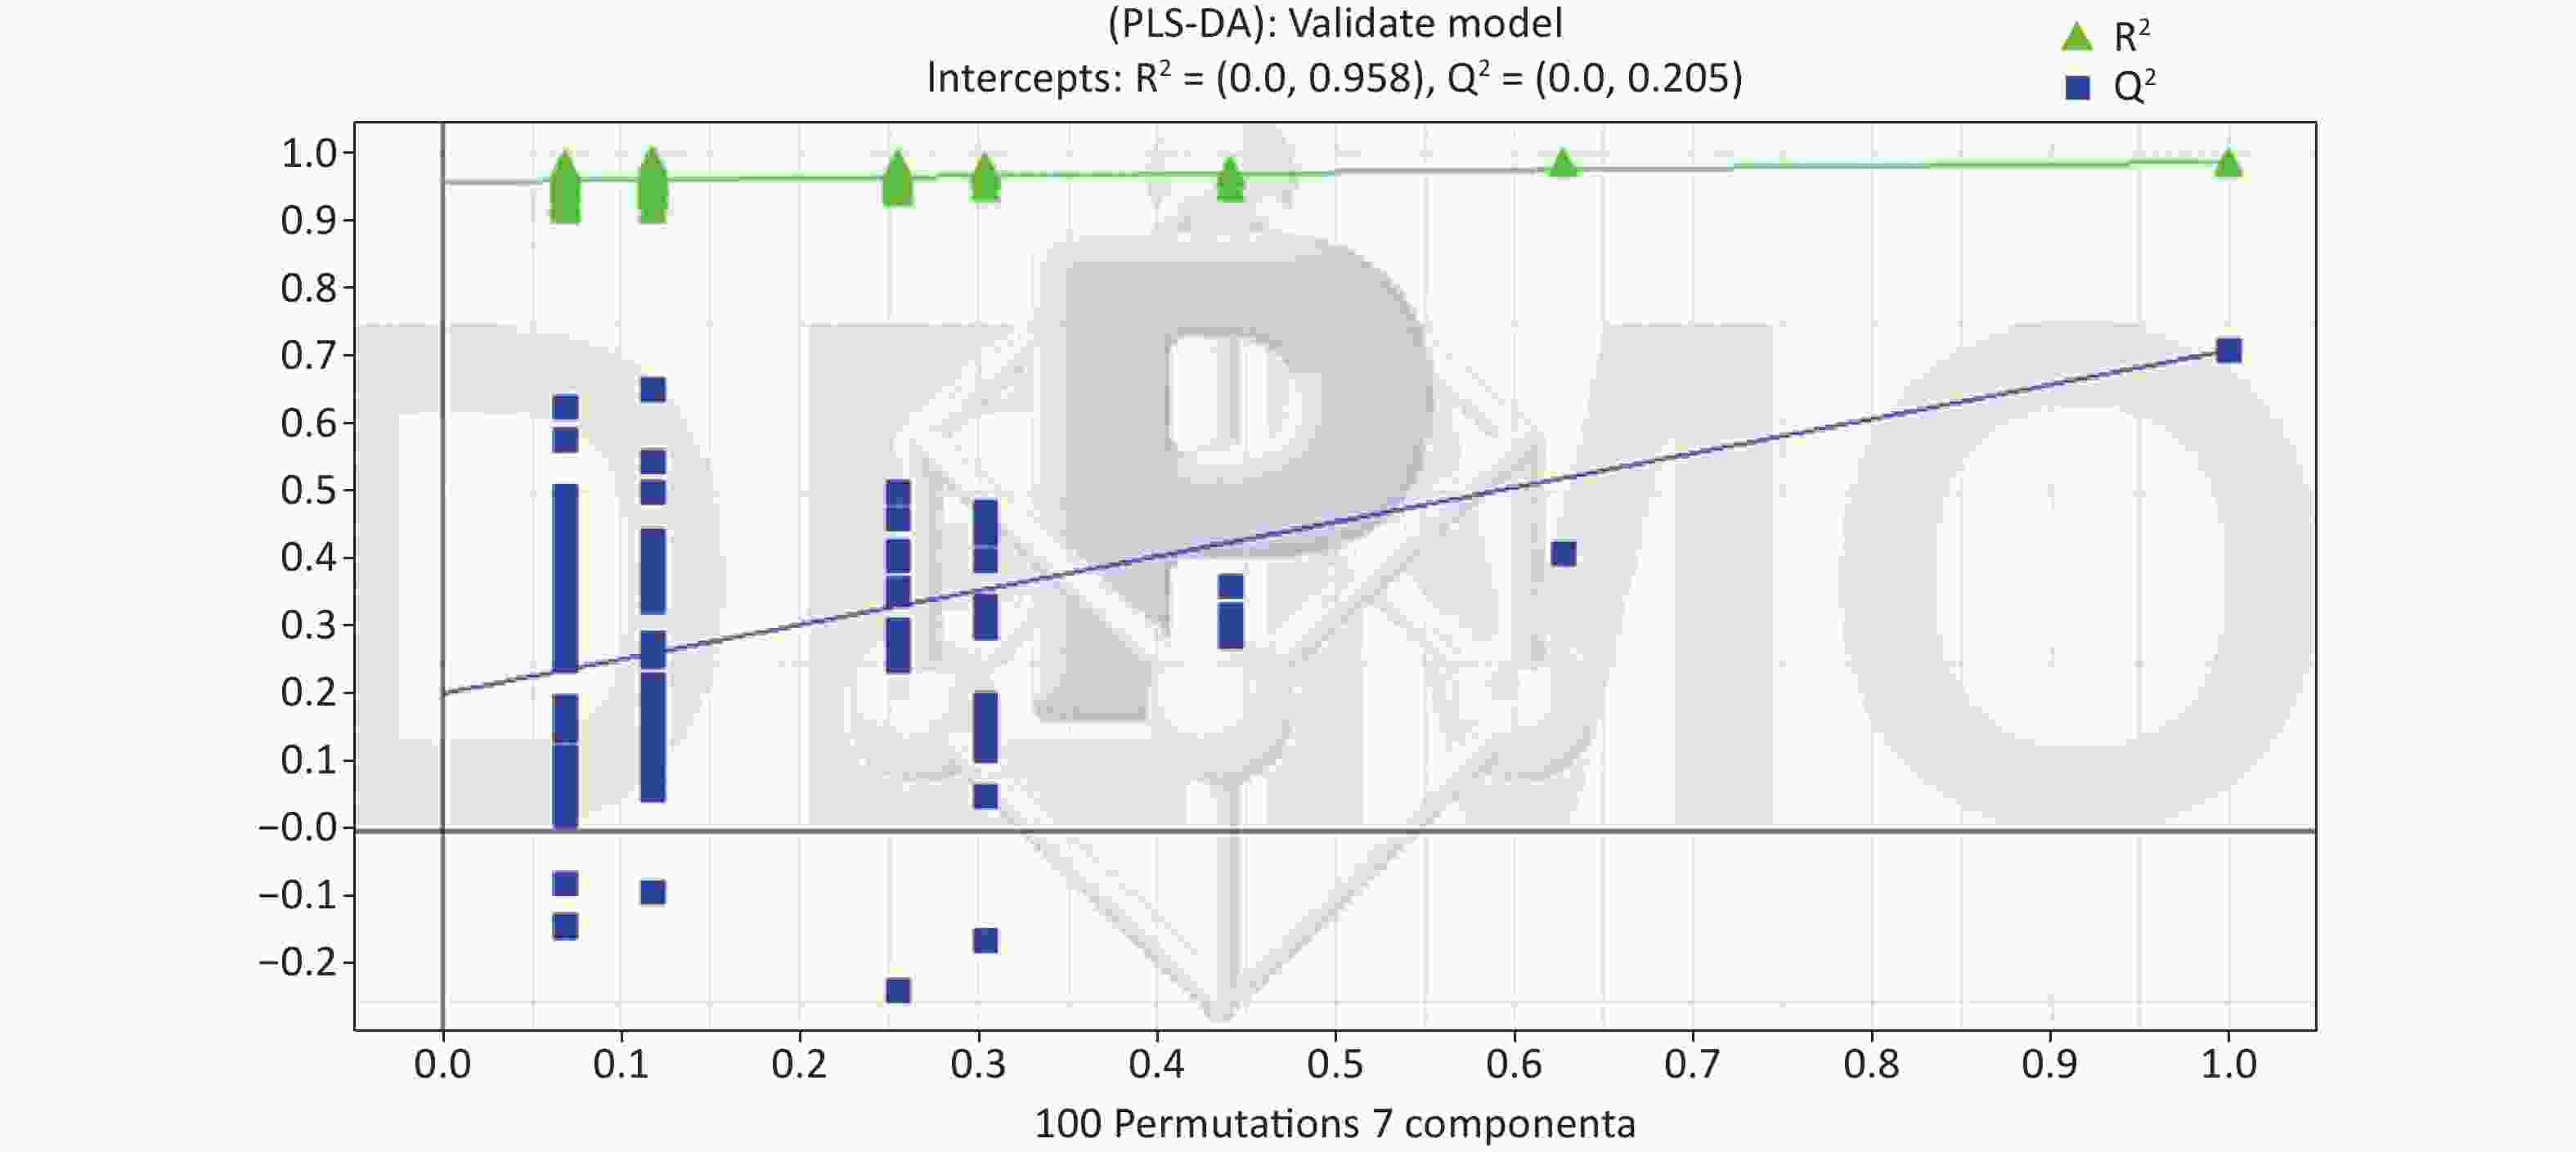
Figure 4. Permutation test result of the PLS-DA model in the ESI+. At the 30 days in the ESI+, R2 (0.0, 0.958), Q2 (0.0, 0.205). ESI, electrospray ionization; ESI+, positive (ES+) ESI mode.
-
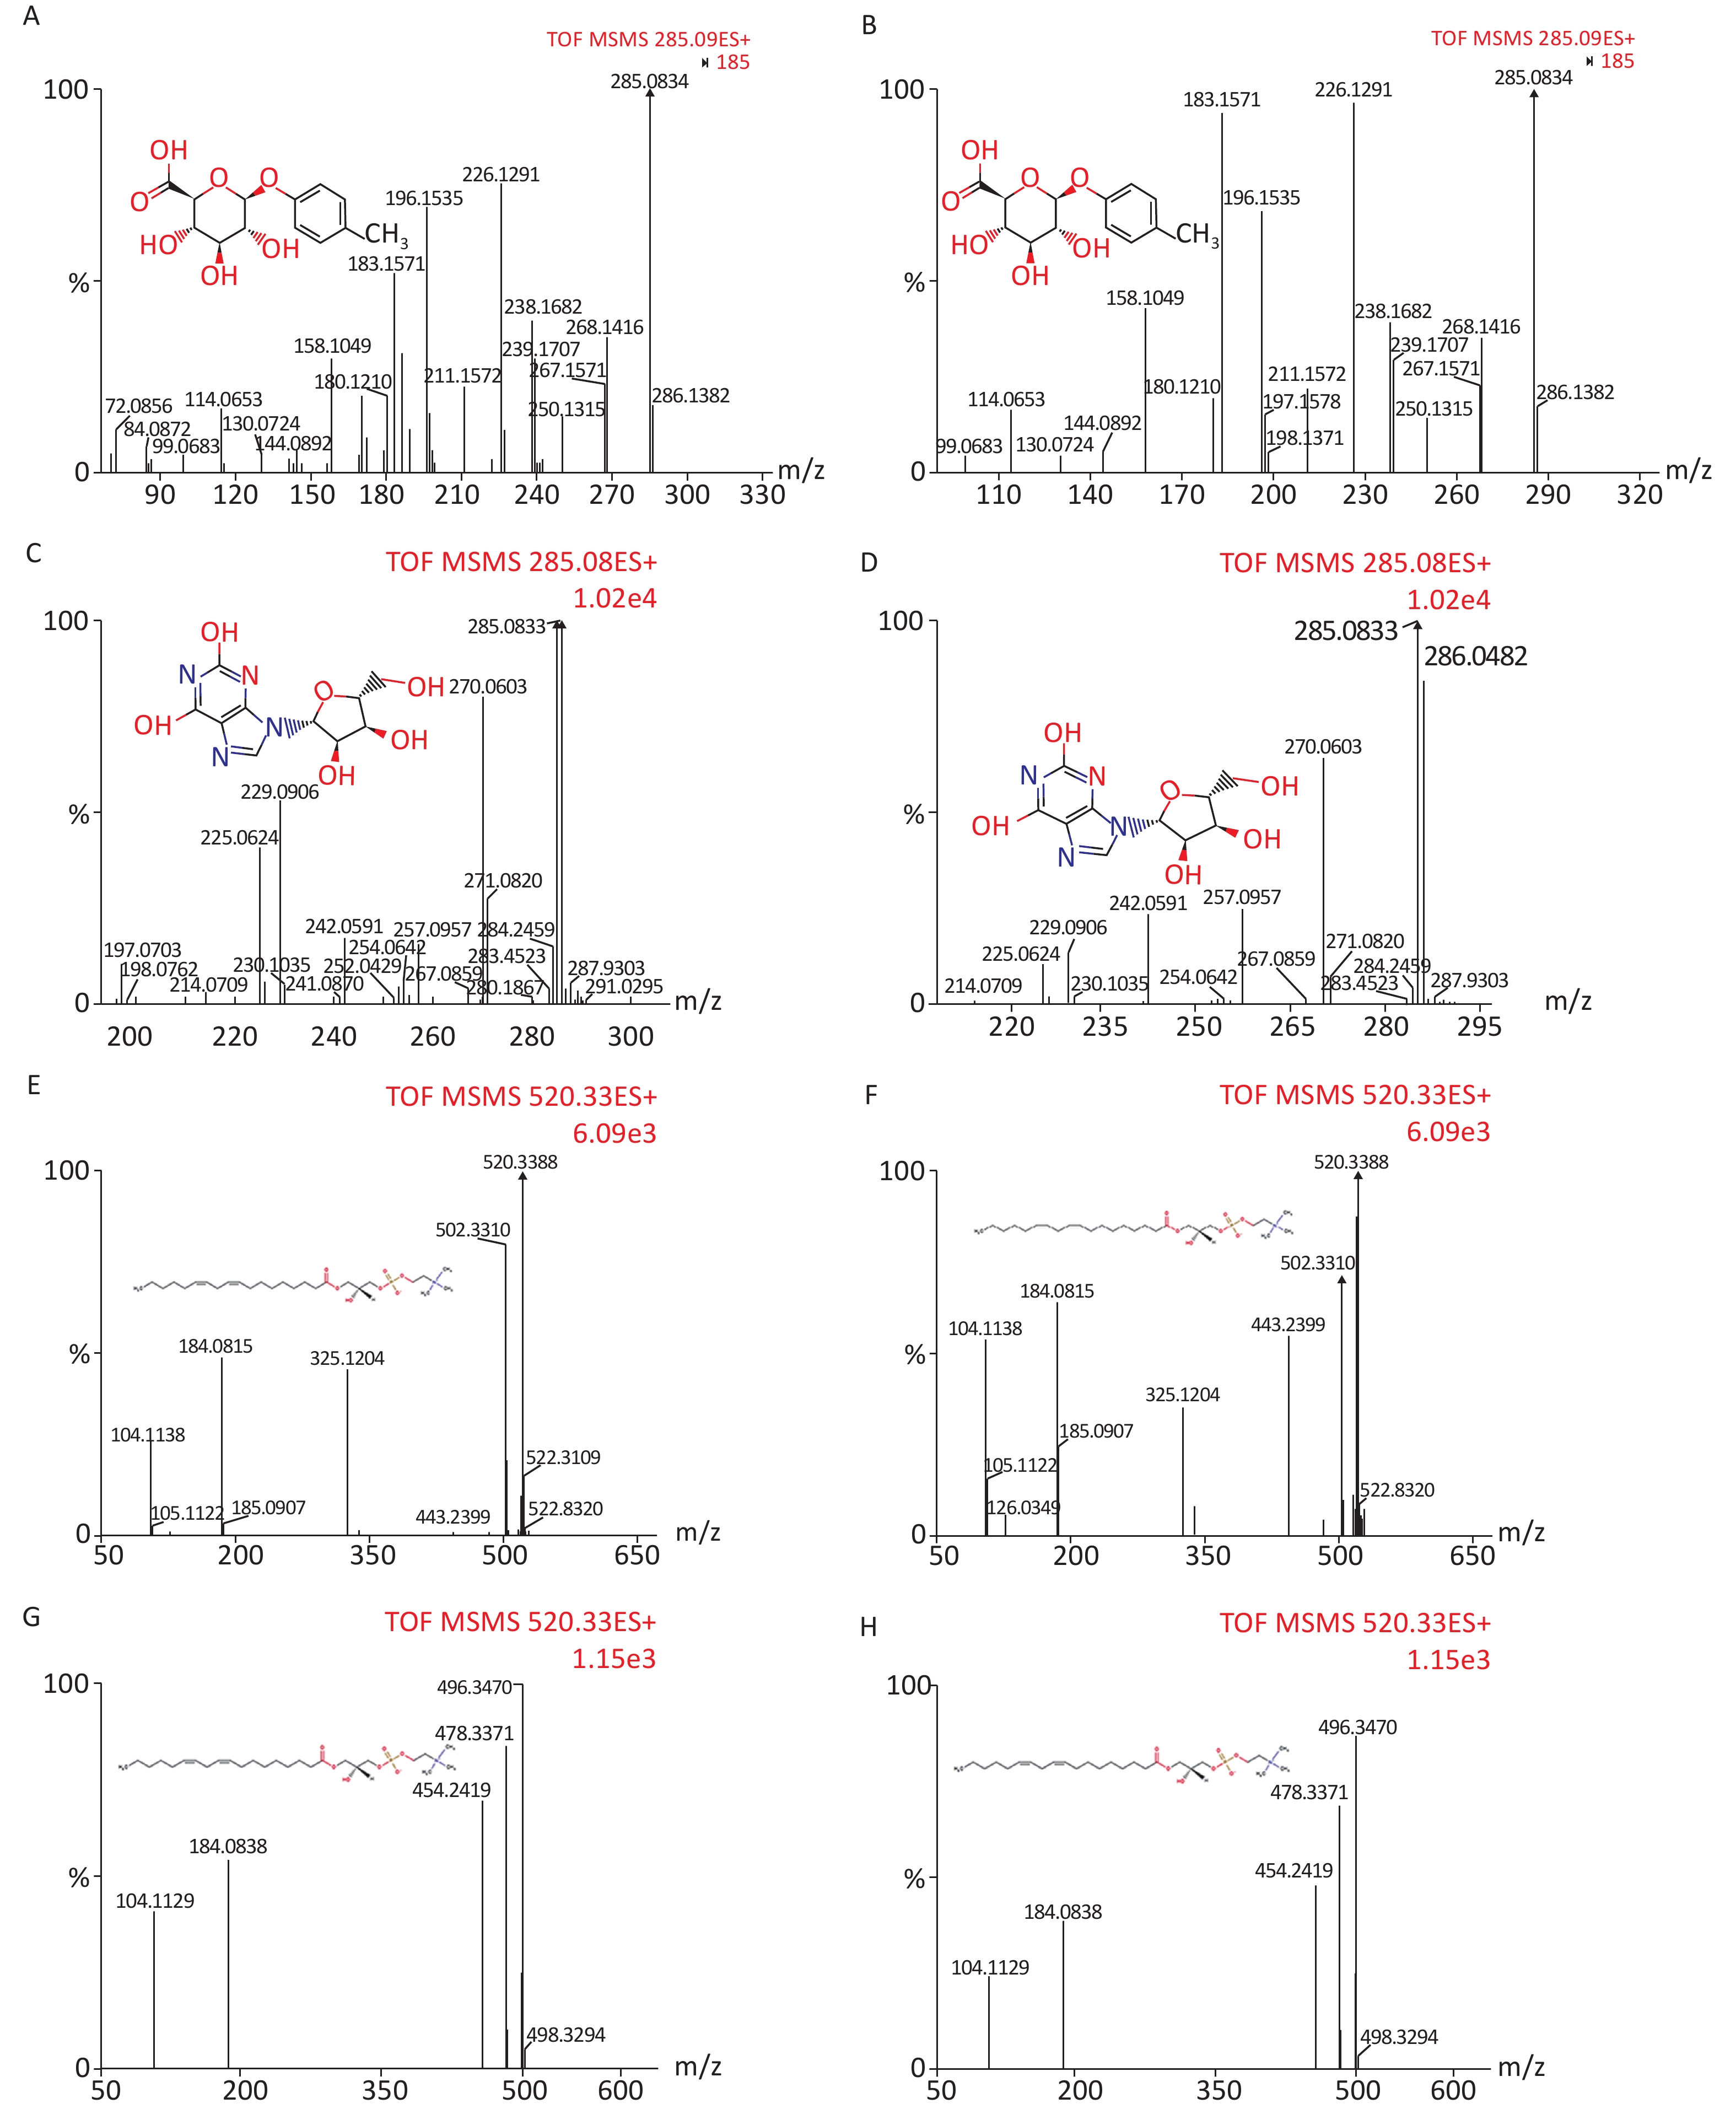
We identified eight potential biomarkers based on VIP parameters of loading plots and ANOVA. The elemental composition of each biomarker was determined by comparing their retention times and MS/MS fragmentation patterns using Q-TOF MS/MS and by searching HMDB. All biomarkers were identified using MassFragment software (Supplementary Figure S1, available in www.besjournal.com) by accurate mass, isotope distribution, and mass spectrometry patterns. Table 3 shows m/z, retention time, postulated identity, and elemental composition of biomarkers. Their chemical structure and mass fragment information were identified based on collision energies (eV) during this experiment (Supplementary Figure S1), and the intensity values of these rat urine metabolites at 4 weeks post-treatment are shown in Table 4. Compared to the control group, treated groups showed significant decreases in the intensity of peaks corresponding to p-cresol glucuronide, methyl hippuric acid, N1-methyl-2-pyridone-5-carboxamide, or lysoPC [18:2 (9Z, 12Z)], but not lysoPC (16:0). In contrast, treated groups showed higher levels of xanthosine and undecanedioic acid compared to control groups positive 30 d post-treatment (P < 0.05).
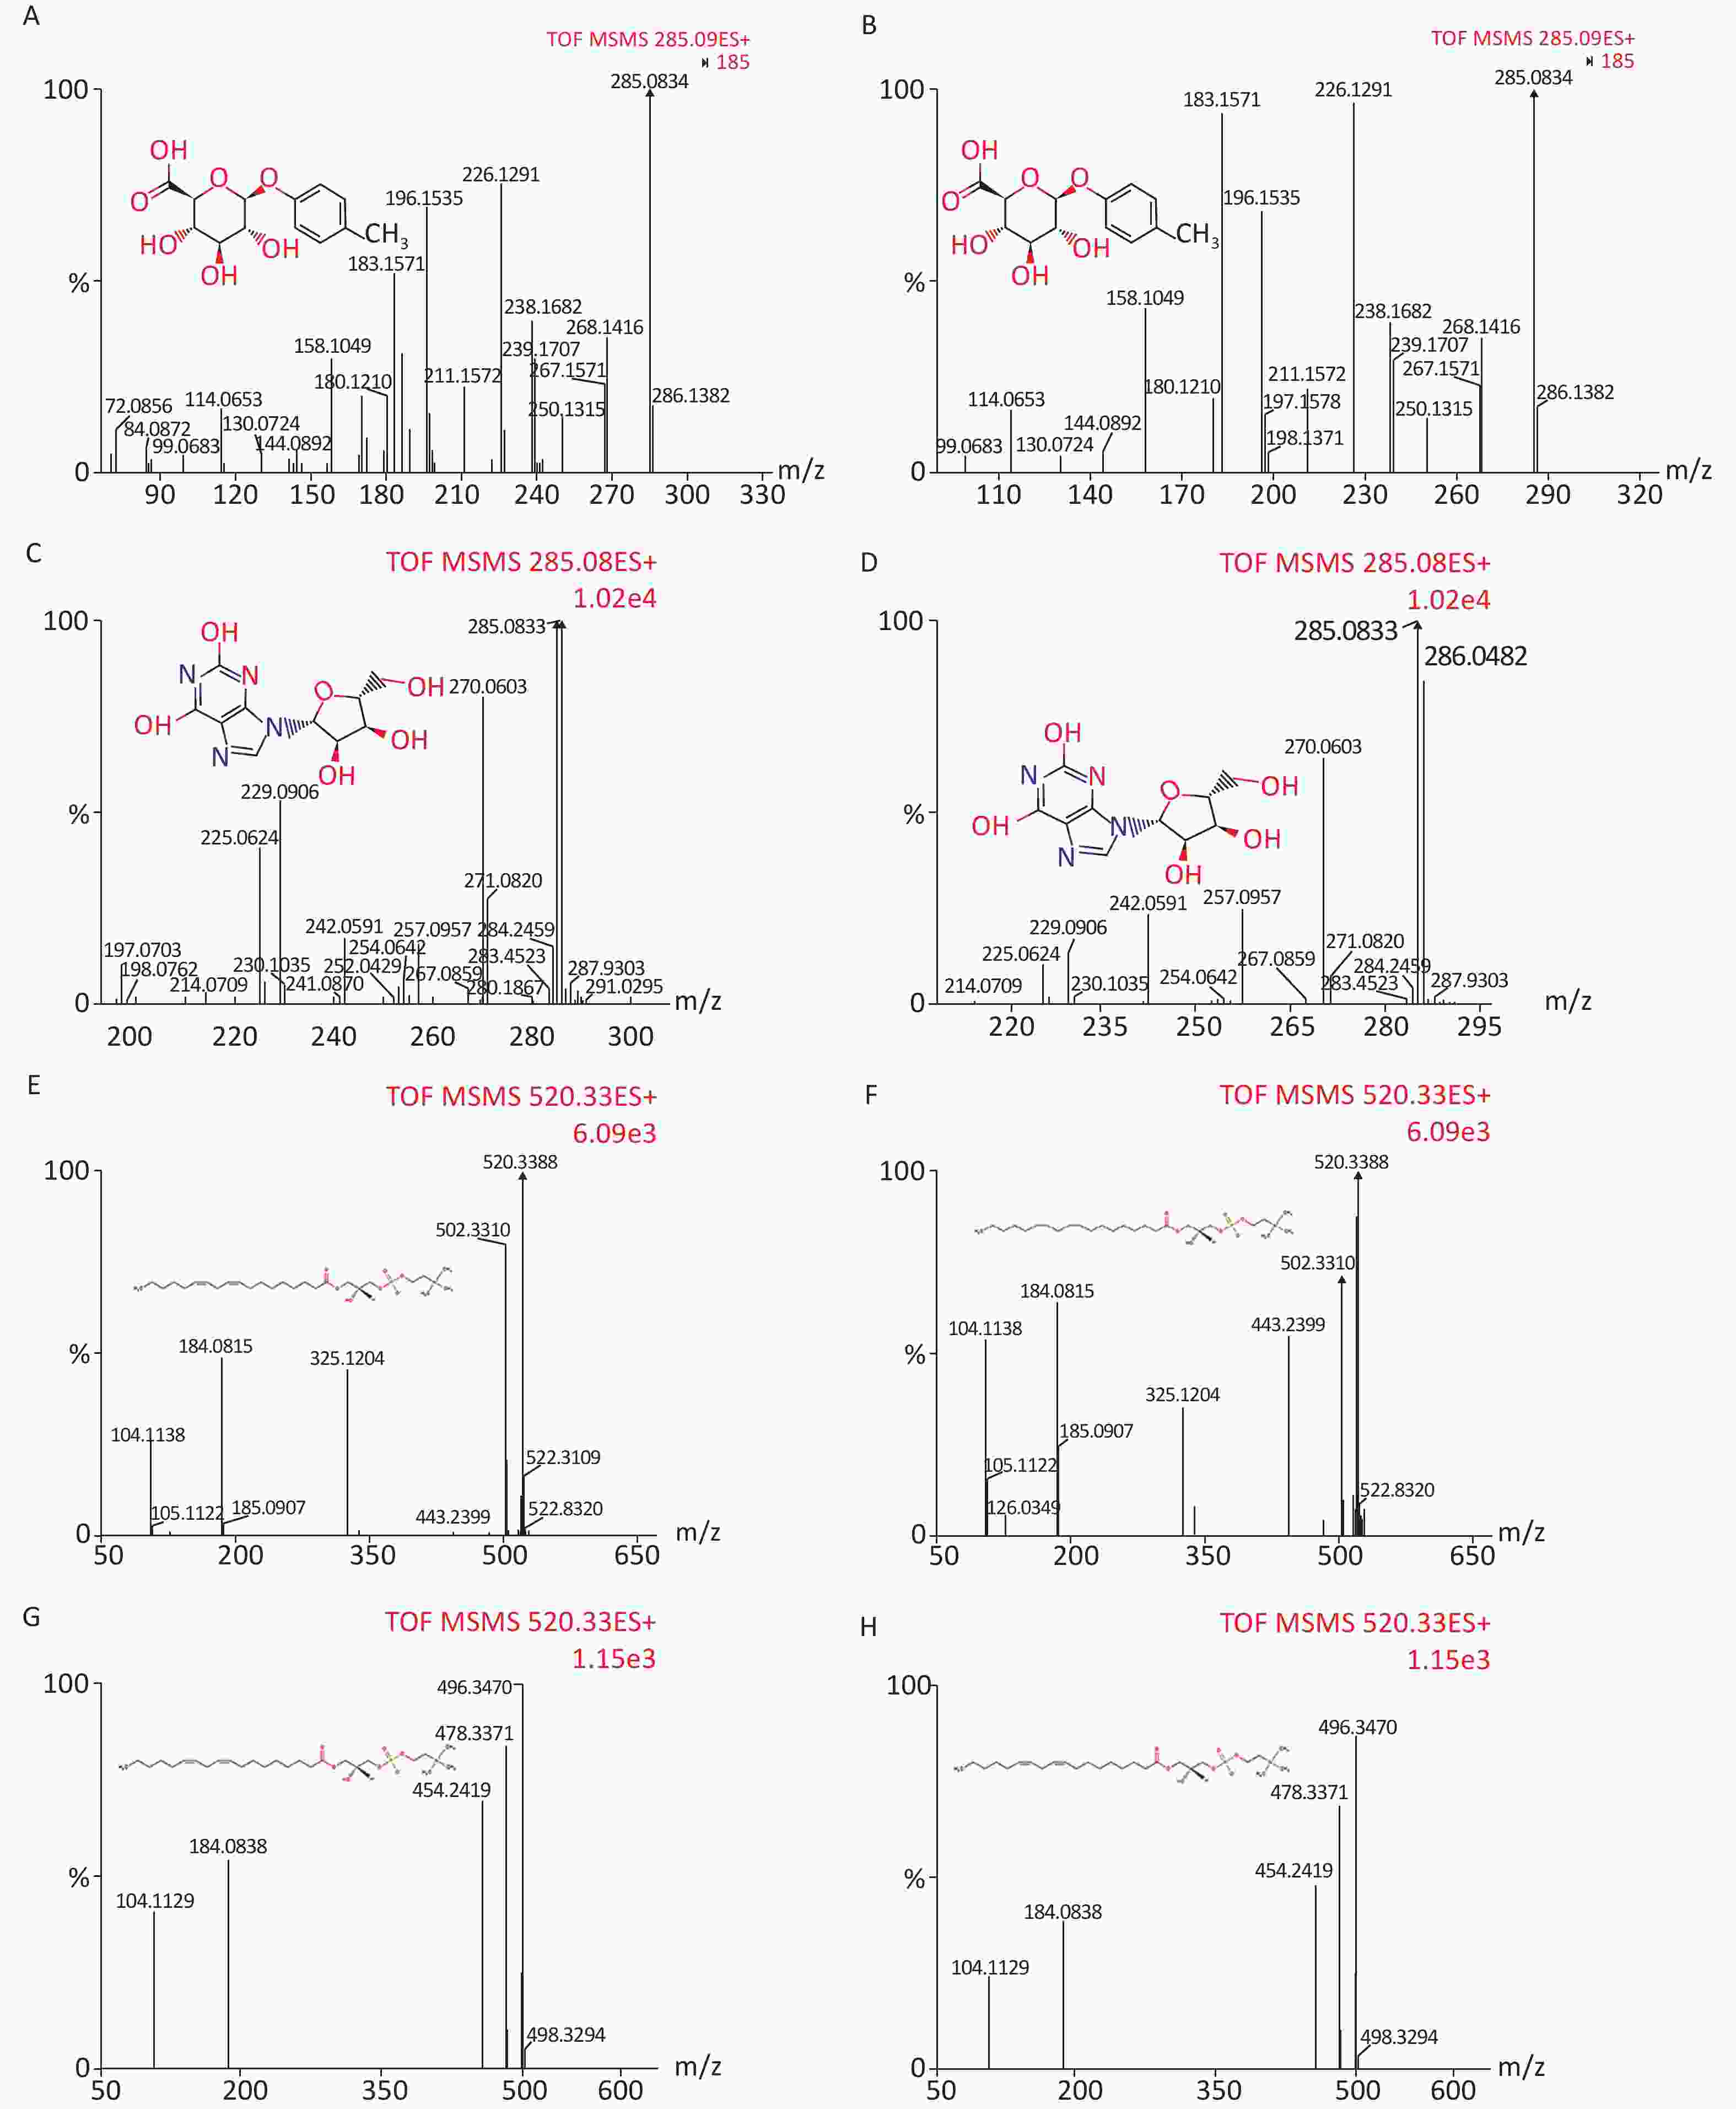
Figure S1. Chemical structure and mass fragment information of potential urine metabolites identified in this experiment with different collision energy (ev). In positive ion mode: (A) p-Cresol glucuronide (15 ev); (B) the mass spectra of p-Cresol glucuronide from the authentic standard (20 ev); (C) Xanthosine (18 ev); (D) the mass spectra of Xanthosine from the authentic standard (15 ev); (E) LysoPC [18:2 (9Z, 12Z)] (18 ev); (F) the mass spectra of LysoPC [18:2 (9Z, 12Z)] from the authentic standard (20 ev); (G) LysoPC (16:0) (18 ev); (H) the mass spectra of LysoPC (16:0) from the authentic standard (15 ev).
Table 3. Potential biomarkers identified by UPLC/Q-TOF-MS in cation mode
Retention
time (min)Measured m/z
ion (Da)Calculated m/z
ion (Da)Mass error (PPM) Elemental
compositionPostulated
identityScan mode VIP 5.87 285.0896 285.0974 27 C13H16O7 p-Cresol glucuronidea + 1.4670 7.99 285.0833 285.0835 0 C10H12N4O6 Xanthosinea + 7.8901 5.47 194.0827 194.0817 5 C10H11NO3 Methylhippuric acidb + 4.0240 10.38 496.3418 496.3403 3 C24H50NO7P LysoPC (16:0)a + 5.4966 6.57 217.1473 217.1440 15 C11H20O4 Undecanedioic acidb + 1.3758 2.26 153.0699 153.0664 22 C7H8N2O2 N1-Methyl-2-pyridone-5-carboxamideb + 2.6001 10.15 520.3411 520.3403 1 C26H50NO7P LysoPC [18:2 (9Z, 12Z)]a + 4.0616 9.15 189.1245 189.1239 3 C8H16N2O3 N6-Acetyl-L-lysineb + 4.8213 Note. aPresents ions that were identified by comparison to the standards. bBiomarkers identified by the Human Metabolome Database (HMDB) and confirmed using exact mass data and MS fragmentation. DEHP, di-(2-ethylhexyl) phthalate; UPLC/Q-TOF-MS, ultra-performance liquid chromatography coupled with quadrupole time-of-flight tandem mass spectrometry; cPA, cyclic phosphatidic acid; VIP, variable importance in projection. Table 4. Biomarkers detected in rat urine using positive ESI mode (mean ± SD, n = 8)
Groups Xanthosine p-Cresol glucuronide Undecanedioic acid N1-Methyl-2-pyridone-5-carboxamide LysoPC (16:0) LysoPC
[18:2 (9Z, 12Z)]Methylhippuric acid N6-Acetyl-L-lysine H 0.18 ± 0.15 0.17 ± 0.06 0.27 ± 0.34 18.68 ± 3.43 22.31 ± 5.51 13.04 ± 2.30 21.06 ± 3.46 0.14 ± 0.08 A 31.54 ± 10.84ac 0.79 ± 0.28a 1.62 ± 0.39bc 12.95 ± 4.42a 4.54 ± 7.19a 0.90 ± 1.49ac 7.58 ± 2.95bc 4.32 ± 2.63ac B 0.36 ± 0.14a 0.05 ± 0.11a 0.79 ± 0.13a 10.32 ± 1.15a 21.05 ± 2.64 8.17 ± 2.26a 13.21 ± 2.10a 0.26 ± 0.08 D 19.10 ± 6.56bd 2.29 ± 1.78ac 0.44 ± 0.08c 13.46 ± 1.79ac 13.92 ± 5.46c 1.23 ± 1.52ac 18.29 ± 1.91c 2.18 ± 1.40c Note. aP < 0.05 compared to group H. bP < 0.01 compared to group H. cP < 0.05 compared to group B. dP < 0.01 compared to group B. ESI: electrospray ionization. -
In this study, we developed a rat model of dietary DEHP toxicity. Urinary metabonomics of rats exposed to dietary DEHP and SIF treatments were characterized using UPLC/Q-TOF-MS. Eight principal urinary metabolites were identified as contributors to the clusters. Our previous studies of changes in urinary metabolomics indicate that dietary DEHP affects energy-related metabolism, liver and renal function, fatty acid metabolism, amino acid metabolism, and antioxidant system in rats[28]. SIF was used in this study to examine its potential protective effects against DEHP toxicity. Previous studies on DEHP exposure and SIF have mainly focused on humans[6, 28-31] and these studies have not been able to elucidate the specific protective mechanisms of SIF against DEHP toxicity. The use of UPLC/Q-TOF-MS and multivariate analysis are thus beneficial for urinary metabonomics research.
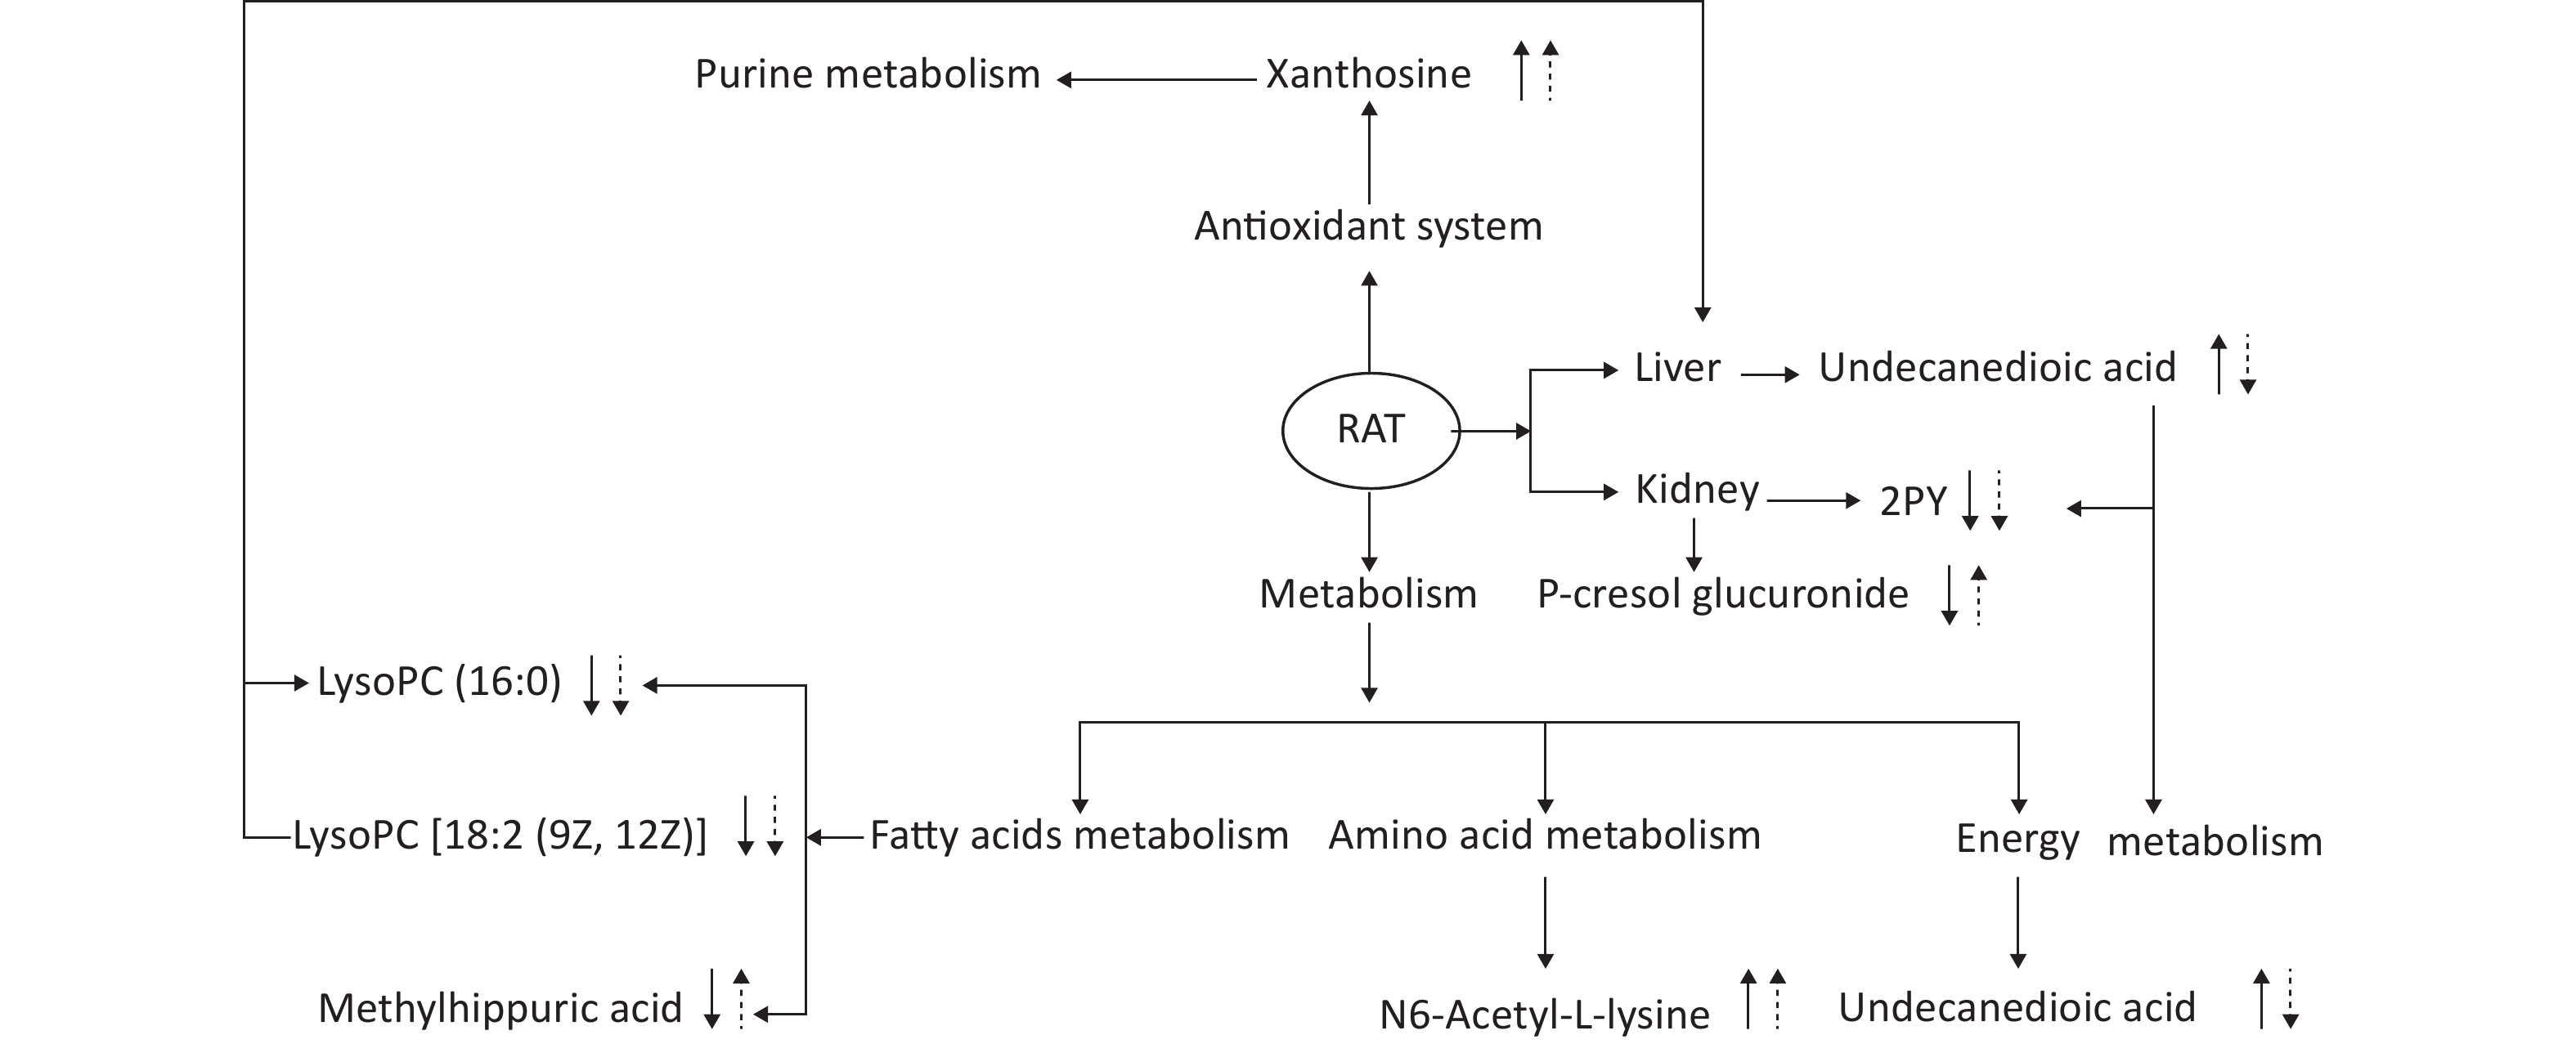
This experiment based on the PCA and PLS-DA models obtained from UPLC/Q-TOF-MS/MS metabolic analysis shows similar separation between exposed groups and the control, indicating optimal characterization of the treated urinary metabolite profile. Systemic rat metabolic changes were triggered by DEHP exposure. Our results also indicate that metabonomics is a sufficiently sensitive method for detecting the protective effects of SIF on DEHP toxicity. Figure 5 shows that SIF reduces DEHP toxicity. The biological relationships between the potential biomarkers linked to DEHP-induced toxic effects and the mechanism by which SIF inhibits such toxicity are illustrated by five metabolic pathways based on databases (HMDB and KEGG) and the MetaboAnalyst 3.0 website.

Figure 5. The altered pathways and toxic effects in response to DEHP and/or SIF treatment. Upwards and downwards arrows represent increases or decreases, respectively, in metabolite levels in the DEHP-exposed group compared to the control group; upwards dashed arrow or downwards dashed arrows represent the significant increases or decreases in metabolite levels in the SIF plus DEHP-treated group compared to the DEHP-treated group. DEHP, di-(2-ethylhexyl) phthalate; SIF, soy isoflavones
The first pathway identified involves fatty acids metabolism. One identified compound is ethyl hippuric acid, which is an acyl glycine whose detection in body fluids can be used to identify conditions associated with mitochondrial fatty acid beta-oxidation. Acylglycines are produced by the action of glycine N-acyltransferase (EC 2.3.1.13), which catalyzes the reaction of acyl-CoA with glycine producing CoA and N-acylglycine[30]. In the present study, methyl hippuric acid levels significantly decreased in group B (P < 0.05), indicating that fatty acid metabolism was disturbed by DEHP. Methyl hippuric acid is correlated with organic solvent exposure levels of workers and is used as a biomarker in occupational exposure studies to monitor these industrial solvents[31].
The markers of fat metabolism (TC, TG, and HDL) were all significantly increased in group B compared with the control group at 4 weeks post-treatment, suggesting that DEHP exposure may lead to lipid metabolism disorders (Table 2). LysoPC [18:2 (9Z, 12Z)] and lysoPC (16:0) are lysophospholipids (LyPs). Lysophosphatidylcholines can have different combinations of fatty acids with different lengths and attachments at C-1 position. In particular, LysoPC [18:2 (9Z, 12Z)] and lysoPC (16:0) both have a chain of linoleic acid at the C-1 position. Significant amounts of plasma lysophosphatidylcholine are formed by lecithin:cholesterol acyltransferase (LCAT) enzymes secreted from the liver. This enzyme catalyzes the transfer of the fatty acids at position sn-2 of phosphatidylcholine to free cholesterol in plasma, creating cholesterol esters and lysophosphatidylcholine. Lysophospholipids act on lysophospholipid receptors and play roles in lipid signaling. LysoPC [18:2 (9Z, 12Z)] and lysoPC (16:0) belong to the branched-chain fatty acid family and are secreted from the liver mainly through the ω-oxidation pathway and play roles in lipid signaling. Changes in intensities of methyl hippuric acid, lysoPC [18:2 (9Z, 12Z)], and lysoPC (16:0) in group B thus imply that DEHP can interrupt fatty acid metabolism as well as mitochondria function. However, levels of these metabolites in group D were significantly different from those in group B, indicating that SIF can improve defects in fatty acid metabolism caused by DEHP. This result can be explained by the fact that genistein ameliorates fat accumulation through AMPK activation[32], as well as lower hepatic expression of fatty acid synthase and sterol regulatory element-binding protein-1 but higher expression of PPAR alpha, which has a prolonged effect on hepatic lipid metabolism[29]. The markers of fat metabolism (TC, TG, and HDL) were all markedly decreased in group D compared to group B at 4 weeks post-treatment (Table 2), also suggesting that DEHP-induced lipid metabolism disorders were alleviated by SIF. Additionally, alterations in the relative weights of perirenal fat and palace fat (Supplementary Table S1) support these results.
Around 14% of adults (OECD data from 2012) and 20% of children 5–17 years old in Germany are overweight or obese (OECD data from 2010). Obesity is a major risk factor for cardiovascular diseases and diabetes mellitus type II. Many studies have shown a link between environmental pollution or industrial chemicals and so-called civilized diseases[33]. Exposure to DEHP leads to increased lipolytic activity and reduced transport of fatty acids into fat cells[34].
The second pathway is involved in energy metabolism. Undecanedioic acid is a dicarboxylic acid that is usually rarely detected in serum because it can be rapidly oxidized in peroxisomes then transferred to mitochondria for further degradation[35, 36]. Levels of this metabolite markedly decreased in group B, indicating peroxisomal dysfunction and reduced β-oxidation. This result indicates the effect of DEHP on β-oxidation of fatty acids, consistent with previous studies[37]. The accumulation of serum dicarboxylic acids can further damage hepatocytes and mitochondria[38], therefore the change in undecanedioic acid levels in group B indicate that DEHP can disrupt mitochondria and liver function. The effect of DEHP on mitochondria is complex. DEHP can inhibit mitochondrial β-oxidation in rodent hepatocytes and thus diminish mitochondrial respiration at the level of cytochrome reductase through activating the nuclear receptor peroxisome proliferator-activated receptor α-independent mechanism[39].
Levels of undecanedioic acid in group D were significantly different from those in group B (P < 0.05), indicating that SIF can ameliorate DEHP-induced energy metabolism disorders and liver damage. This result can be explained by the fact that the short-term intake of SIF reduces liver steatosis by reducing serum ALT and AST levels[40]. In addition, levels of ALT and AST, which serve as markers of liver function, were all largely decreased in group D compared with group B at 4 weeks post-treatment (Table 2), suggesting that SIF can alleviate DEHP-induced liver dysfunction. Compared with group B, the relative liver weight change in group D is lower, further supporting the above results (Supplementary Table S1).
The third pathway is involved in antioxidant system. Xanthosine is a nucleoside derived from xanthine and ribose. Some modified, especially methylated, nucleosides derived from RNA degradation are excreted at abnormal levels in the urine of patients with malignant tumors and have been proposed for use as tumor markers. In this study, the intensity of xanthosine significantly increased in group B compared to the control group (P < 0.05), indicating that purine metabolism is altered by DEHP. However, the intensity of this metabolite significantly increased in group D compared with group B (P < 0.05), which be explained by the fact that SIF can inhibit oxidative stress caused by DEHP. The protective effect of SIF on oxidative stress in LLC-PK1 cells[41] was further confirmed by this study.
The fourth pathway is involved in amino acid metabolism. N6-acetyl-l-lysine is an acetylated amino acid, and the acetylation of specific lysine residues in the N-terminal domains of core histones is a biochemical marker of active genes[42]. In this study, the levels of N6-acetyl-l-lysine were higher in group B compared to the control group, indicating that amino acid metabolism disorders were induced by DEHP. DEHP significantly alters insulin signaling molecules, glucose transporter 4 translocation-associated proteins, and insulin-regulated aminopeptidases, which may contribute to insulin resistance, type 2 diabetes, and obesity[43]. However, the intensity of N6-acetyl-l-lysine is significantly increased in group D and may suggest that SIF can improve amino acid metabolism that is disturbed by DEHP.
The last pathway involves renal function of N-methyl-2-pyridone-5-carboxamide (2PY), a coenzyme that transmits electrons during many metabolic reactions in cells. Nicotinamide adenine dinucleotide (NAD) plays an irreplaceable role in glycolysis, the tricarboxylic acid cycle, and the respiratory chain. Metabolic intermediates attach hydrogens to NAD to form NADH. NADH is then able to help synthesize ATP with this hydrogen in the respiratory chain through chemical infiltration coupling. Therefore, 2PY is closely with energy metabolism through affecting mitochondrial oxidative pathways, as confirmed in a previous study[44]. In addition, increased serum 2PY concentrations are observed in chronic renal failure (CRF) patients and accompanied by the deterioration of kidney function and resulting toxic effects, including the significant inhibition of PARP-1[45], suggests that 2PY is a biomarker of kidney function. This study shows that 2PY levels of group B are significantly lower than those of the control group (P < 0.01), indicating that DEHP can induce physical metabolic disorders and renal insufficiency. The increased serum levels of BUN and CRE in group B also indicate kidney dysfunction (Table 2). Additionally, the intensity of 2PY is significantly lower in group D compared with group B (P < 0.05), which may indicate that SIF can improve energy metabolism and alleviate renal failure caused by DEHP. In addition, some studies have confirmed that changes in N-α-acetylarginine and 2PY are closely related to fat metabolism and energy metabolism, and are closely related to biomarkers of renal function[46].
P-cresol glucuronide (PCG) is produced primarily as an end product of tyrosine metabolism by anaerobic enterobacteria. Sulfation and glucuronidation of tyrosine produce p-cresol sulfate, an important metabolite, and p-cresol glucuronide during bacterial passage through the colonic mucosa and liver. P-cresyl glucuronide metabolized from p-cresol is produced in the intestine from tyrosine by intestinal bacteria[47]. Higher levels of urinary p-cresol glucuronide may therefore be indicators of changes in microbiota homeostasis during inflammation[26]. In patients with chronic kidney disease (CKD)-associated uremia, the conjugation of p-cresol produces p-toluenesulfonic acid (PCS) as the main metabolite and PCG[48]. In this study, PCG levels in group D were higher compared with group B (P < 0.05), which may indicate a protective effect for SIF against kidney failure by decreasing serum creatinine, serum phosphorus, CRP, and proteinuria in pre-dialysis patients[49]. In addition, at 4 weeks post-treatment, renal dysfunction indicators (TC, TG, and HDL) in group D were significantly lower than those in group B (Table 2), indicating that SIF can alleviate renal dysfunction induced by DEHP. Furthermore, increases in relative renal weight change in group D was lower compared to group B, further confirming the above results (Supplementary Table S1).
To our knowledge, this study is the first urine-metabonomics-based systems approach to explore the effects of SIF on DEHP-induced toxicity. A low dose of SIF exerts partial protective effects towards DEHP-induced, including its effects on the metabolism of fatty acids, energy, and amino acid, the antioxidant defense system, and kidney function. This study has two limitations, however, as there is no biological mechanism that explains the mechanism of the interaction between SIF and DEHP and that gender differences were not addressed. Further research based on serum metabolomics and other omics techniques are necessary to address these issue.
-
Guarantor of integrity of the entire study: DONG Xin Wen; Study concepts: NA Xiao Lin and DONG Xin Wen; Study design: NA Xiao Lin and DONG Xin Wen; Definition of intellectual content: WU Wei Dong and YAO San Qiao; Literature research: ZHANG Yun Bo and DONG Xin Wen; Clinical studies: WU Hao Yu; Experimental studies: DONG Xin Wen and WU Hao Yu; Data acquisition: DONG Xin Wen and WABG Cheng; Data analysis: WU Hao Yu and ZHANG Yun Bo; Statistical analysis: DONG Xin Wen and WANG Cheng; Manuscript preparation: DONG Xin Wen; Manuscript editing: DONG Xin Wen and WU Wei Dong; Manuscript review: NA Xiao Lin and WU Wei Dong. All authors read and approved the final version of the manuscript.
-
The authors declare no competing financial interest.
doi: 10.3967/bes2020.012
Urine Metabonomic Analysis of Interventions Effect of Soy Isoflavones on Rats Exposed to Di-(2-ethylhexyl) Phthalate
-
Abstract:
Objective Di-(2-ethylhexyl) phthalate (DEHP) is a ubiquitous environmental contaminant. As an endocrine disruptor, it seriously threatens human health and ecological environmental safety. This study examines the impact of intervention with soybean isoflavones (SIF) on DEHP-induced toxicity using a metabonomics approach. Methods Rats were randomly divided into control (H), SIF-treated (A, 86 mg/kg body weight), DEHP-treated (B, 68 mg/kg), and SIF plus DEHP-treated (D) groups. Rats were given SIF and DEHP daily through diet and gavage, respectively. After 30 d of treatment, rat urine was tested using UPLC/MS with multivariate analysis. Metabolic changes were also evaluated using biochemical assays. Results Metabolomics analyses revealed that p-cresol glucuronide, methyl hippuric acid, N1-methyl-2-pyridone-5-carboxamide, lysophosphatidycholine [18:2 (9Z, 12Z)] {lysoPC [18:2 (9Z, 12Z)]}, lysoPC (16:0), xanthosine, undecanedioic acid, and N6-acetyl-l-lysine were present at significantly different levels in control and treatment groups. Conclusion SIF supplementation partially protects rats from DEHP-induced metabolic abnormalities by regulating fatty acid metabolism, antioxidant defense system, amino acid metabolism, and is also involved in the protection of mitochondria. -
Key words:
- Di-(2-ethylhexyl) phthalate /
- Soy isoflavones /
- Metabonomics /
- UPLC-QTOF-MS/MS /
- Urine
-
Figure 1. Rat body weight (BW) at each time point. Each data point represents mean ± standard deviation (SD). CG, control group; SIF, group A; DEHP, group B; SIF+DEHP, group D. DEHP. di-(2-ethylhexyl) phthalate; SIF, soy isoflavones. wk, week.
Figure 2. A representative BPI chromatograms of urine in a positive mode in the control (A) and treatment group (B) at week 4 using UPLC/ESI-Q-TOF/MS. BPI, base peak intensity
Figure 3. The PCA and PLS-DA 3D score plots of data from control and treatment groups derived from UPLC/ESI-Q-TOF/MS analysis of urine in positive (A, B) ESI mode. Group A: red triangle or square; Group B: green triangle or square; Group D: blue triangle or square; Group H (control group): black triangle or square. ESI, electrospray ionization; MS, mass spectrometry; PCA, principal component analysis; UPLC/ESI-Q-TOF/MS, ultra-performance liquid chromatography coupled with electrospray ionization quadrupole time-of-flight mass spectrometry; PLS-DA, partial least squares-discriminant analysis.
Figure 4. Permutation test result of the PLS-DA model in the ESI+. At the 30 days in the ESI+, R2 (0.0, 0.958), Q2 (0.0, 0.205). ESI, electrospray ionization; ESI+, positive (ES+) ESI mode.
S1. Chemical structure and mass fragment information of potential urine metabolites identified in this experiment with different collision energy (ev). In positive ion mode: (A) p-Cresol glucuronide (15 ev); (B) the mass spectra of p-Cresol glucuronide from the authentic standard (20 ev); (C) Xanthosine (18 ev); (D) the mass spectra of Xanthosine from the authentic standard (15 ev); (E) LysoPC [18:2 (9Z, 12Z)] (18 ev); (F) the mass spectra of LysoPC [18:2 (9Z, 12Z)] from the authentic standard (20 ev); (G) LysoPC (16:0) (18 ev); (H) the mass spectra of LysoPC (16:0) from the authentic standard (15 ev).
Figure 5. The altered pathways and toxic effects in response to DEHP and/or SIF treatment. Upwards and downwards arrows represent increases or decreases, respectively, in metabolite levels in the DEHP-exposed group compared to the control group; upwards dashed arrow or downwards dashed arrows represent the significant increases or decreases in metabolite levels in the SIF plus DEHP-treated group compared to the DEHP-treated group. DEHP, di-(2-ethylhexyl) phthalate; SIF, soy isoflavones
S1. Effects of SI and DEHP on the fundamental variables during the experiment
Group Daily food intakes (g/d) Food utilization rate (%) Liver/weight
(g/100 g)Kidney/weight (g/100 g) Palace fat/weight (g/100 g) Perirenal fat/weight (g/100 g) H 16.28 ± 1.03 26.2 ± 4.3 2.83 ± 0.38 0.77 ± 0.08 0.85 ± 0.38 1.01 ± 0.46 A 15.29 ± 0.76 25.9 ± 2.1 2.72 ± 0.18a 0.73 ± 0.04 0.49 ± 0.15 0.48 ± 0.15 B 16.34 ± 0.68 25.9 ± 5.5 3.54 ± 0.61b 0.83 ± 0.06 0.97 ± 0.39 0.94 ± 0.42 D 15.09 ± 1.69 23.9 ± 4.0 2.94 ± 0.22b 0.78 ± 0.07b 0.62 ± 0.37 0.64 ± 0.56 Note. Values are mean ± SD; Group H [0 mg/(kg·day)]; Group A [86 mg/(kg·day)]; Group B [68 mg/(kg·day)]; Group D [86 mg/(kg·day) + 68 mg/(kg·day)]. aSignificantly different from group H at P < 0.05. bSignificantly different from group B at P < 0.05. DEHP, di-(2-ethylhexyl) phthalate; SIF, soy isoflavones; SD, standard deviation; ANOVA, analysis of variance.  下载: 导出CSV
Table 1. The influence of SIF on DEHP levels of in rat fat and serum (means ± SD, μg/g)
Groups DEHP in fat DEHP in serum H 0.16 ± 0.07 0.21 ± 0.12 A 0.14 ± 0.08 0.13 ± 0.11 B 1.09 ± 0.31a 1.13 ± 0.64a D 0.83 ± 0.28ab 0.87 ± 0.31ab Note. aP < 0.05 compared to group H. bP < 0.05 compared to group B. DEHP, di-(2-ethylhexyl) phthalate; SIF, soy isoflavones; SD, standard deviation.
下载: 导出CSV
Table 2. Effects of SIF and DEHP on liver enzyme activities, kidney function, fatty acids levels,and energy metabolism (means ± SD, n = 8)
Groups ALT (U/L) AST (U/L) BUN (mmol/L) CRE (µmol/L) TC (mmol/L) TG (mmol/L) HDL (mmol/L) GLU (mmol/L) H 108.53 ± 7.31 35.89 ± 3.67 4.73 ± 1.02 35.15 ± 7.31 4.89 ± 1.46 1.89 ± 0.16 1.45 ± 0.26 3.89 ± 0.86 A 110.32 ± 15.28b 37.28 ± 8.15b 4.32 ± 1.18b 40.32 ± 12.46 5.32 ± 2.08 2.52 ± 0.87 1.54 ± 0.68 4.02 ± 0.69b B 140.32 ± 10.18a 55.79 ± 4.62a 7.51 ± 0.56a 60.72 ± 8.58a 6.89 ± 0.36a 3.24 ± 0.48a 2.51 ± 0.31a 7.89 ±0.33a D 125.67 ± 6.42ab 45.38 ± 3.54ab 5.24 ± 0.39ab 45.42 ± 5.96ab 3.89 ± 0.96b 2.71 ± 0.27ab 1.89 ± 0.86ab 5.89 ± 0.56ab Note. aP < 0.05 compared to group H. bP < 0.05 compared to group B. DEHP, di-(2-ethylhexyl) phthalate; ALT, alanine aminotransferase; AST, aspartic transaminase; BUN, urea nitrogen; CRE, Creatinine; TC, Serum total cholesterol; TG, Triglyceride; HDL, High-density lipoprotein; GLU, Blood glucose.
下载: 导出CSV
Table 3. Potential biomarkers identified by UPLC/Q-TOF-MS in cation mode
Retention
time (min)Measured m/z
ion (Da)Calculated m/z
ion (Da)Mass error (PPM) Elemental
compositionPostulated
identityScan mode VIP 5.87 285.0896 285.0974 27 C13H16O7 p-Cresol glucuronidea + 1.4670 7.99 285.0833 285.0835 0 C10H12N4O6 Xanthosinea + 7.8901 5.47 194.0827 194.0817 5 C10H11NO3 Methylhippuric acidb + 4.0240 10.38 496.3418 496.3403 3 C24H50NO7P LysoPC (16:0)a + 5.4966 6.57 217.1473 217.1440 15 C11H20O4 Undecanedioic acidb + 1.3758 2.26 153.0699 153.0664 22 C7H8N2O2 N1-Methyl-2-pyridone-5-carboxamideb + 2.6001 10.15 520.3411 520.3403 1 C26H50NO7P LysoPC [18:2 (9Z, 12Z)]a + 4.0616 9.15 189.1245 189.1239 3 C8H16N2O3 N6-Acetyl-L-lysineb + 4.8213 Note. aPresents ions that were identified by comparison to the standards. bBiomarkers identified by the Human Metabolome Database (HMDB) and confirmed using exact mass data and MS fragmentation. DEHP, di-(2-ethylhexyl) phthalate; UPLC/Q-TOF-MS, ultra-performance liquid chromatography coupled with quadrupole time-of-flight tandem mass spectrometry; cPA, cyclic phosphatidic acid; VIP, variable importance in projection.
下载: 导出CSV
Table 4. Biomarkers detected in rat urine using positive ESI mode (mean ± SD, n = 8)
Groups Xanthosine p-Cresol glucuronide Undecanedioic acid N1-Methyl-2-pyridone-5-carboxamide LysoPC (16:0) LysoPC
[18:2 (9Z, 12Z)]Methylhippuric acid N6-Acetyl-L-lysine H 0.18 ± 0.15 0.17 ± 0.06 0.27 ± 0.34 18.68 ± 3.43 22.31 ± 5.51 13.04 ± 2.30 21.06 ± 3.46 0.14 ± 0.08 A 31.54 ± 10.84ac 0.79 ± 0.28a 1.62 ± 0.39bc 12.95 ± 4.42a 4.54 ± 7.19a 0.90 ± 1.49ac 7.58 ± 2.95bc 4.32 ± 2.63ac B 0.36 ± 0.14a 0.05 ± 0.11a 0.79 ± 0.13a 10.32 ± 1.15a 21.05 ± 2.64 8.17 ± 2.26a 13.21 ± 2.10a 0.26 ± 0.08 D 19.10 ± 6.56bd 2.29 ± 1.78ac 0.44 ± 0.08c 13.46 ± 1.79ac 13.92 ± 5.46c 1.23 ± 1.52ac 18.29 ± 1.91c 2.18 ± 1.40c Note. aP < 0.05 compared to group H. bP < 0.01 compared to group H. cP < 0.05 compared to group B. dP < 0.01 compared to group B. ESI: electrospray ionization.
下载: 导出CSV
-
[1] Kato K, Silva MJ, Reidy JA, et al. Mono(2-ethyl-5-hydroxyhexyl) phthalate and mono-(2-ethyl-5-oxohexyl) phthalate as biomarkers for human exposure assessment to di-(2-ethylhexyl) phthalate. Environ Health Perspect, 2004; 112, 327−30. doi: 10.1289/ehp.6663 [2] Koch HM, Rossbach B, Drexler H, et al. Internal exposure of the general population to DEHP and other phthalates--determination of secondary and primary phthalate monoester metabolites in urine. Environ Res, 2003; 93, 177−85. doi: 10.1016/S0013-9351(03)00083-5 [3] Fay M, Donohue JM, De Rosa C. ATSDR evaluation of health effects of chemicals. VI. Di(2-ethylhexyl)phthalate. Agency for Toxic Substances and Disease Registry. Toxicol Ind Healt, 1999; 15, 651−746. doi: 10.1177/074823379901500801 [4] Petersen JH, Breindahl T. Plasticizers in total diet samples, baby food and infant formulae. Food Addit Contam, 2000; 17, 133−41. doi: 10.1080/026520300283487 [5] Fromme H, Gruber L, Schlummer M, et al. Intake of phthalates and di(2-ethylhexyl)adipate: results of the Integrated Exposure Assessment Survey based on duplicate diet samples and biomonitoring data. Environ Int, 2007; 33, 1012−20. doi: 10.1016/j.envint.2007.05.006 [6] Halden RU. Plastics and health risks. Annu Rev Public Health, 2010; 31, 179−94. doi: 10.1146/annurev.publhealth.012809.103714 [7] Hinton RH, Mitchell FE, Mann A, et al. Effects of phthalic acid esters on the liver and thyroid. Environ Health Perspect, 1986; 70, 195−210. doi: 10.1289/ehp.8670195 [8] Hsu PC, Kuo YT, Leon Guo Y, et al. The adverse effects of low-dose exposure to Di(2-ethylhexyl) phthalate during adolescence on sperm function in adult rats. Environ Toxicol, 2016; 31, 706−12. doi: 10.1002/tox.22083 [9] Silva MJ, Barr DB, Reidy JA, et al. Urinary levels of seven phthalate metabolites in the U.S. population from the National Health and Nutrition Examination Survey (NHANES) 1999-2000. Environ Health Perspect, 2004; 112, 331−8. doi: 10.1289/ehp.6723 [10] Watanabe S, Uesugi S, Kikuchi Y. Isoflavones for prevention of cancer, cardiovascular diseases, gynecological problems and possible immune potentiation. Biomed Pharmacother, 2002; 56, 302−12. doi: 10.1016/S0753-3322(02)00182-8 [11] Hsieh HM, Wu WM, Hu ML. Soy isoflavones attenuate oxidative stress and improve parameters related to aging and Alzheimer's disease in C57BL/6J mice treated with D-galactose. Food Chem Toxicol, 2009; 47, 625−32. doi: 10.1016/j.fct.2008.12.026 [12] Rimbach G, Boesch-Saadatmandi C, Frank J, et al. Dietary isoflavones in the prevention of cardiovascular disease--a molecular perspective. Food Chem Toxicol, 2008; 46, 1308−19. doi: 10.1016/j.fct.2007.06.029 [13] Malencic D, Maksimovic Z, Popovic M, et al. Polyphenol contents and antioxidant activity of soybean seed extracts. Bioresour Technol, 2008; 99, 6688−91. doi: 10.1016/j.biortech.2007.11.040 [14] Occhiuto F, Zangla G, Samperi S, et al. The phytoestrogenic isoflavones from Trifolium pratense L. (Red clover) protects human cortical neurons from glutamate toxicity. Phytomedicine, 2008; 15, 676−82. doi: 10.1016/j.phymed.2008.04.007 [15] Cederroth CR, Nef S. Soy, phytoestrogens and metabolism: A review. Mol Cell Endocrinol, 2009; 304, 30−42. doi: 10.1016/j.mce.2009.02.027 [16] Mumford SL, Kim S, Chen Z, et al. Urinary Phytoestrogens Are Associated with Subtle Indicators of Semen Quality among Male Partners of Couples Desiring Pregnancy. J Nutr, 2015; 145, 2535−41. doi: 10.3945/jn.115.214973 [17] Medigovic IM, Zivanovic JB, Ajdzanovic VZ, et al. Effects of soy phytoestrogens on pituitary-ovarian function in middle-aged female rats. Endocrine, 2015; 50, 764−76. doi: 10.1007/s12020-015-0691-x [18] Luo T, Snyder SM, Zhao B, et al. Gene Expression Patterns Are Altered in Athymic Mice and Metabolic Syndrome Factors Are Reduced in C57BL/6J Mice Fed High-Fat Diets Supplemented with Soy Isoflavones. J Agric Food Chem, 2016; 64, 7492−501. doi: 10.1021/acs.jafc.6b03401 [19] Silva P, Ribeiro TA, Tofolo LP, et al. Treatment with soy isoflavones during early adulthood improves metabolism in early postnatally overfed rats. Nutr Neurosci, 2018; 21, 25−32. doi: 10.1080/1028415X.2016.1213007 [20] Lenz EM, Wilson ID. Analytical strategies in metabonomics. J Proteome Res, 2007; 6, 443−58. doi: 10.1021/pr0605217 [21] Nicholson JK, Lindon JC, Holmes E. 'Metabonomics': understanding the metabolic responses of living systems to pathophysiological stimuli via multivariate statistical analysis of biological NMR spectroscopic data. Xenobiotica, 1999; 29, 1181−9. doi: 10.1080/004982599238047 [22] Zhang J, Yan L, Tian M, et al. The metabonomics of combined dietary exposure to phthalates and polychlorinated biphenyls in mice. J Pharm Biomed Anal, 2012; 66, 287−97. doi: 10.1016/j.jpba.2012.03.045 [23] Want EJ, Wilson ID, Gika H, et al. Global metabolic profiling procedures for urine using UPLC-MS. Nat Protoc, 2010; 5, 1005−18. doi: 10.1038/nprot.2010.50 [24] Tepavcevic V, Atanackovic M, Miladinovic J, et al. Isoflavone composition, total polyphenolic content, and antioxidant activity in soybeans of different origin. J Med Food, 2010; 13, 657−64. doi: 10.1089/jmf.2009.0050 [25] Engel N, Lisec J, Piechulla B, et al. Metabolic profiling reveals sphingosine-1-phosphate kinase 2 and lyase as key targets of (phyto-) estrogen action in the breast cancer cell line MCF-7 and not in MCF-12A. PLoS One, 2012; 7, e47833. doi: 10.1371/journal.pone.0047833 [26] Zhang X, Choi FF, Zhou Y, et al. Metabolite profiling of plasma and urine from rats with TNBS-induced acute colitis using UPLC-ESI-QTOF-MS-based metabonomics--a pilot study. FEBS J, 2012; 279, 2322−38. doi: 10.1111/j.1742-4658.2012.08612.x [27] Carpenter CP, Weil CS, Smyth HF, et al. Chronic oral toxicity of di-(2-ethylhexyl) phthalate of rats, guinea pigs, and dogs. AMA Arch Ind Hyg Occup Med, 1953; 8, 219−26. [28] Dong X, Zhang Y, Dong J, et al. Urinary metabolomic profiling in rats exposed to dietary di(2-ethylhexyl) phthalate (DEHP) using ultra-performance liquid chromatography quadrupole time-of-flight tandem mass spectrometry (UPLC/Q-TOF-MS). Environ Sci Pollut Res Int, 2017; 24, 16659−72. doi: 10.1007/s11356-017-9091-5 [29] Huang C, Qiao X, Dong B. Neonatal exposure to genistein ameliorates high-fat diet-induced non-alcoholic steatohepatitis in rats. Br J Nutr, 2011; 106, 105−13. doi: 10.1017/S0007114510005799 [30] Sakai T. Studies on the evaluation of exposure to industrial chemicals. Sangyo Eiseigaku Zasshi, 1996; 38, 119−37. [31] Manini P, Andreoli R, Niessen W. Liquid chromatography-mass spectrometry in occupational toxicology: a novel approach to the study of biotransformation of industrial chemicals. J Chromatogr A, 2004; 1058, 21−37. doi: 10.1016/S0021-9673(04)01312-3 [32] Zhong H, Liu H, Jiang Z. Genistein Ameliorates Fat Accumulation Through AMPK Activation in Fatty Acid-Induced BRL Cells. J Food Sci, 2017; 82, 2719−25. doi: 10.1111/1750-3841.13856 [33] Schug TT, Janesick A, Blumberg B, et al. Endocrine disrupting chemicals and disease susceptibility. J Steroid Biochem Mol Biol, 2011; 127, 204−15. doi: 10.1016/j.jsbmb.2011.08.007 [34] Schaedlich K, Gebauer S, Hunger L, et al. DEHP deregulates adipokine levels and impairs fatty acid storage in human SGBS-adipocytes. Sci Rep, 2018; 8, 3447. doi: 10.1038/s41598-018-21800-4 [35] Jin Z, Bian F, Tomcik K, et al. Compartmentation of Metabolism of the C12-, C9-, and C5-n-dicarboxylates in Rat Liver, Investigated by Mass Isotopomer Analysis: ANAPLEROSIS FROM DODECANEDIOATE. J Biol Chem, 2015; 290, 18671−7. doi: 10.1074/jbc.M115.651737 [36] Salinari S, Bertuzzi A, Gandolfi A, et al. Dodecanedioic acid overcomes metabolic inflexibility in type 2 diabetic subjects. Am J Physiol Endocrinol Metab, 2006; 291, E1051−8. doi: 10.1152/ajpendo.00631.2005 [37] Wang SY, Wang Y, Jin XW, et al. A urinary metabolomics study of rats after the exposure to acrylamide by ultra performance liquid chromatography coupled with quadrupole time-of-flight tandem mass spectrometry. Mol Biosyst, 2015; 11, 1146−55. doi: 10.1039/C4MB00682H [38] Mortensen PB. Formation and degradation of dicarboxylic acids in relation to alterations in fatty acid oxidation in rats. Biochim Biophys Acta, 1992; 1124, 71−9. doi: 10.1016/0005-2760(92)90128-I [39] Rusyn I, Peters JM, Cunningham ML. Modes of action and species-specific effects of di-(2-ethylhexyl)phthalate in the liver. Crit Rev Toxicol, 2006; 36, 459−79. doi: 10.1080/10408440600779065 [40] Hakkak R, Gauss CH, Bell A, et al. Short-Term Soy Protein Isolate Feeding Prevents Liver Steatosis and Reduces Serum ALT and AST Levels in Obese Female Zucker Rats. Biomedicines, 2018; 6, 55. doi: 10.3390/biomedicines6020055 [41] Lee JH, Hwang CE, Cho EJ, et al. Improvement of nutritional components and in vitro antioxidative properties of soy-powder yogurts using Lactobacillus plantarum. J Food Drug Anal, 2018; 26, 1054−65. doi: 10.1016/j.jfda.2017.12.003 [42] Crane-Robinson C, Hebbes TR, Clayton AL, et al. Chromosomal mapping of core histone acetylation by immunoselection. Methods, 1997; 12, 48−56. doi: 10.1006/meth.1997.0446 [43] Viswanathan MP, Mullainadhan V, Chinnaiyan M, et al. Effects of DEHP and its metabolite MEHP on insulin signalling and proteins involved in GLUT4 translocation in cultured L6 myotubes. Toxicology, 2017; 386, 60−71. doi: 10.1016/j.tox.2017.05.005 [44] Boulange CL, Claus SP, Chou CJ, et al. Early metabolic adaptation in C57BL/6 mice resistant to high fat diet induced weight gain involves an activation of mitochondrial oxidative pathways. J Proteome Res, 2013; 12, 1956−68. doi: 10.1021/pr400051s [45] Rutkowski B, Slominska E, Szolkiewicz M, et al. N-methyl-2-pyridone-5-carboxamide: a novel uremic toxin? Kidney Int Suppl, 2003; 63, 19−21. [46] Pelantova H, Buganova M, Holubova M, et al. Urinary metabolomic profiling in mice with diet-induced obesity and type 2 diabetes mellitus after treatment with metformin, vildagliptin and their combination. Mol Cell Endocrinol, 2016; 431, 88−100. doi: 10.1016/j.mce.2016.05.003 [47] Lesaffer G, De Smet R, Belpaire FM, et al. Urinary excretion of the uraemic toxin p-cresol in the rat: contribution of glucuronidation to its metabolization. Nephrol Dial Transplant, 2003; 18, 1299−306. doi: 10.1093/ndt/gfg107 [48] Liabeuf S, Glorieux G, Lenglet A, et al. Does p-cresylglucuronide have the same impact on mortality as other protein-bound uremic toxins? PLoS One, 2013; 8, e67168. doi: 10.1371/journal.pone.0067168 [49] Jing Z, Wei-Jie Y. Effects of soy protein containing isoflavones in patients with chronic kidney disease: A systematic review and meta-analysis. Clin Nutr, 2016; 35, 117−24. doi: 10.1016/j.clnu.2015.03.012 -

 点击查看大图
计量
- 文章访问数: 1573
- HTML全文浏览量: 475
- PDF下载量: 125
- 被引次数: 0

 Quick Links