

 下载:
下载:

-
Neisseria meningitidis (N. meningitidis), which is a commensal inhabitant of the human respiratory tract, is the most important cause of meningitis and septicemia worldwide. N. meningitidis usually colonizes the human upper respiratory tract, but in some circumstances, N. meningitidis can traverse the nasopharyngeal mucosa, disseminate throughout the bloodstream, and then cross the blood-brain barrier via its adhesion and invasion properties[1,2]. Based on the characteristics of its capsular polysaccharides, N. meningitidis is divided into twelve serogroups, of which six serogroups (A, B, C, X, Y, and W) are responsible for most invasive meningococcal diseases (IMDs). The capsule is the most important virulence determinant and enhances the survival of N. meningitidis in the intracellular environment of host cells and bloodstream via various mechanisms. For example, the capsule imparts anti-opsonophagocytic and anti-bactericidal properties to the meningococci. N. meningitidis capsules also have an inhibitory effect on the classical complement pathway and provide resistance against complement-mediated killing and degradation in host cells. In addition, the capsule endows the meningococci with antimicrobial peptide resistance by preventing peptides from coming into contact with the bacterial membranes[3,4].
Capsular switching in N. meningitidis is relatively common and is associated with the emergence and persistence of IMDs[5]. Capsule switching is driven by N. meningitidis DNA uptake and allelic gene exchange at the capsular polysaccharide biosynthesis locus between strains throughout all growth phases. The sequence types (STs) of N. meningitidis are considered part of the same clonal complex if they share at least four alleles of the seven multilocus sequence typing loci with the designated central genotype. Also, the occurrence of capsule switching is presumed when the ST and serogroup of a strain are not commonly associated[6].
Although introducing capsule-based vaccines had been highly successful and has significantly reduced meningococcal infections globally[7-9], the high prevalence of capsular switching had become a burden to public health. This is because capsule switching results in random changes in the structure of N. meningitidis capsule polysaccharides and affects the effectiveness of meningococcal polysaccharide-protein conjugate vaccines.
The incidence of IMDs caused by serogroup A isolates has declined since the introduction and development of capsule-based vaccines in the 1980s in China. Instead, N. meningitidis of serogroups B and C have been the dominant pathogenic strains in recent years, and ST-7 serogroups B and C strains resulting from capsular switching have been identified in China. Moreover, a unique ST-7 serogroup X isolate was reported in Zhejiang Province, China, in 2017. This isolate is considered the result of capsular switching in serogroup A N. meningitidis[6,10]. These isolates can be used as a model to investigate the effect of capsule switching on the pathogenicity of ST-7 N. meningitidis in China.
Accordingly, in the present study, four ST-7 isolates (belonging to serogroups A, B, C, and X) were used to conduct an in-depth investigation of the roles of the different serogroup capsules in the pathogenicity of N. meningitidis.
-
Four ST-7 N. meningitidis isolates were cultured on Columbia agar containing 5% sheep blood (BAP) (Thermo Fisher Oxoid, Beijing, China) and incubated at 37 °C in 5% CO2 for 24 h. Information related to the ST-7 isolates used in this study is provided in Table 1 and the Supplementary Table S1 (available in www.besjournal.com). All experiments were performed in a safety cabinet.
Table 1. N. meningitidis isolates used in the present study
Isolate No. Serogroup Isolate source Year of isolation Sequence type Clonal complex 510612 A Patient 2006 7 5 441212 B Patient 2012 7 5 630601 C Patient 2006 7 5 331401 X Patient 2014 7 5 Table S1. Detail information of strains used in this study
Bacteria No. Serogroup Isolates source Specimen type Year of isolated Isolate district Sequence type Clonal complex PorA FetA NadA_ variant NHBA_ peptide FHbp 510612 A Patient Throat swab 2006 Sichuan 7 5 P1.20,9 F3-1 NadA-2/3 126 1.5 441212 B Patient CSF 2012 Guangdong 7 5 P1.20,9 F3-1 NadA-2/3 126 1.5 630601 C Patient CSF 2006 Qinghai 7 5 P1.20,9 F3-1 NadA-2/3 126 1.5 331401 X Patient CSF 2014 Zhejiang 7 5 P1.20,9 F3-1 NadA-2/3 126 1.5 -
A549 cells (#TCHu-150) were purchased from the Cell Bank of the Chinese Academy of Science (Shanghai, China). A549 cells were cultured in Dulbecco’s modified Eagle medium (DMEM) (Gibco by Invitrogen, Carlsbad, CA, USA) supplemented with 10% fetal bovine serum (#FS201-02; Transgene Biotech, Beijing, China) and 1% penicillin-streptomycin solution (final concentration: penicillin, 100 units/mL; streptomycin, 100 μg/mL) (#10378016; Thermo Fisher Scientific, Shanghai, China). The cells were maintained in a humid atmosphere with 5% CO2 at 37 °C.
-
A549 cells were seeded in 12-well cell culture plates at a density of 1 × 10⁵ cells/well. The day before infection, the cells were starved by culturing them in DMEM without supplements. On the next day, a suspension of the overnight bacterial culture in DMEM was adjusted to an optical density of 0.200 at 600 nm. After 1 × 10⁵ times dilution, 100 μL of the bacterial suspension was streaked on BAP and incubated at 37 °C in 5% CO2 for 24 h to calculate the initial number of bacteria infecting the host cells. Then, 1 mL of the bacterial suspension was added into each of the eleven wells and further incubated at 37 °C with 5% CO2. One well containing non-infected cells was used in each experiment as a control (CTR).
After 4 h of infection, unbound bacteria were removed by three rounds of washing with sterile phosphate-buffered saline (PBS). In each well, A549 cells with adherent bacteria were lysed with 1 mL of sterile double-distilled water (DDW) and scratched off the well bottom with a cell scraper. After 1 × 10³ times dilution, 100 μL of the cell suspension was streaked on BAP and incubated at 37 °C in 5% CO2 for 24 h. Adhesion of N. meningitidis to the host cells was determined by counting the number of colony-forming units (CFUs). The adhesion rate was calculated as the number of adherent bacteria divided by the initial number of bacteria.
For the invasion experiment, after 4 h of infection, the cells were further incubated for two h after the addition of 100 μg/mL gentamicin in PBS to each well (L1312; Solarbio Life Sciences, Shanghai, China) to kill any remaining extracellular bacteria. The bacterial killing was confirmed by streaking 100 μL of the supernatants on BAP and incubation at 37 °C in 5% CO2 for 24 h. Cells were washed with sterile PBS to eliminate the remaining gentamicin, and then they were lysed with sterile DDW and removed with a cell scraper, as described earlier. After 1 × 10² times dilution, 100 μL of the cell suspension was streaked on BAP and incubated at 37 °C in 5% CO2 for 24 h. The number of intracellular cc4821 isolates was determined based on the number of CFUs. The invasion rate was calculated as the number of invasive bacteria divided by the number of adherent bacteria.
-
An essential factor that determines pathogenicity is the inflammatory state of the host after N. meningitidis infection[11,12]. Therefore, after four h of infection, A549 cells were further cultured for 12, 24, 36, and 48 h, and the pro-inflammatory cytokine levels were detected by enzyme-linked immunosorbent assay (ELISA). The interleukin-6 (IL-6) level was detected with the human IL-6 ELISA set (#555220; BD Bioscience, San Diego, USA); the interleukin-8 (IL-8) level, with the human IL-8 ELISA Kit II (#550999; BD Bioscience, San Diego, USA); and the interleukin-1β (IL-1β) level, with the human IL-1β ELISA Set II (#557953; BD Bioscience, San Diego, USA). The tumor necrosis factor-α (TNF-α) level was detected with the human TNF ELISA Kit II (#550610; BD Bioscience, San Diego, USA), and the release of interferon (IFN) was detected with the human IFN ELISA set (#555142; BD Bioscience, San Diego, USA). The cytokines mentioned above were assayed according to the manufacturer’s instructions. The cytokine levels for non-infected A549 cells were considered as the CTR values.
-
A549 cells were transferred into 96-well plates after 4 h of infection. The cells were allowed to grow for 24 and 48 h. At each of the indicated time points, the number of non-viable cells was assessed by Trypan blue staining (C0040; Solarbio Life Sciences, China). The cells were collected and centrifuged at 1,000–2,000 rpm for 1 min, and the supernatant was discarded. Following this, a single-cell suspension was prepared from the pellet and diluted appropriately. The cell suspension was mixed with 0.4% Trypan blue solution at a ratio of 9:1 (final concentration: 0.04%) and stained for 3 min. A small amount of the stained cell suspension was taken for cell counting with the blood cell counting plate. The percentage of non-viable cells was calculated by dividing the number of non-viable cells by the total number of cells. The number of non-viable non-infected cells was considered as the CTR.
-
After 4 h of infection, A549 cells were further cultured for 24 h and 48 h before apoptosis analysis with the FITC Annexin V Apoptosis Detection Kit I according to the manufacturer’s protocol (#556547; BD Biosciences, United States). The cells were collected and washed twice with cold PBS, and they were then resuspended in 1× binding buffer at a concentration of 1 × 10⁵ cells/mL. Following this, 100 µL of the solution (1 × 10⁵ cells) was transferred to a 5-mL culture tube, and 5 µL of FITC Annexin V and 5 µL PI were added to the solution. The cells were gently vortexed and incubated for 15 min at room temperature (25 °C) in the dark. Next, 400 µL of 1× binding buffer was added to each tube and flow cytometric (FCM) analysis was performed within 1 h. Cells that stained positive for FITC Annexin V and negative for PI were considered to be undergoing apoptosis. Cells that stained positive for both FITC Annexin V and PI were considered to be in the end stage of apoptosis, undergoing necrosis, or already non-viable. Cells that were negative for both FITC Annexin V and PI were considered alive and not undergoing measurable apoptosis. Cells that were not infected with bacteria were used as CTRs.
-
All analyses were conducted using SPSS version 20.0 (IBM, SPSS, Chicago, IL, USA) and GraphPad Prism 5 (GraphPad, CA, USA). Differences between means were analyzed by a two-way ANOVA. A two-sided P value of < 0.05 was considered to indicate statistical significance.
-
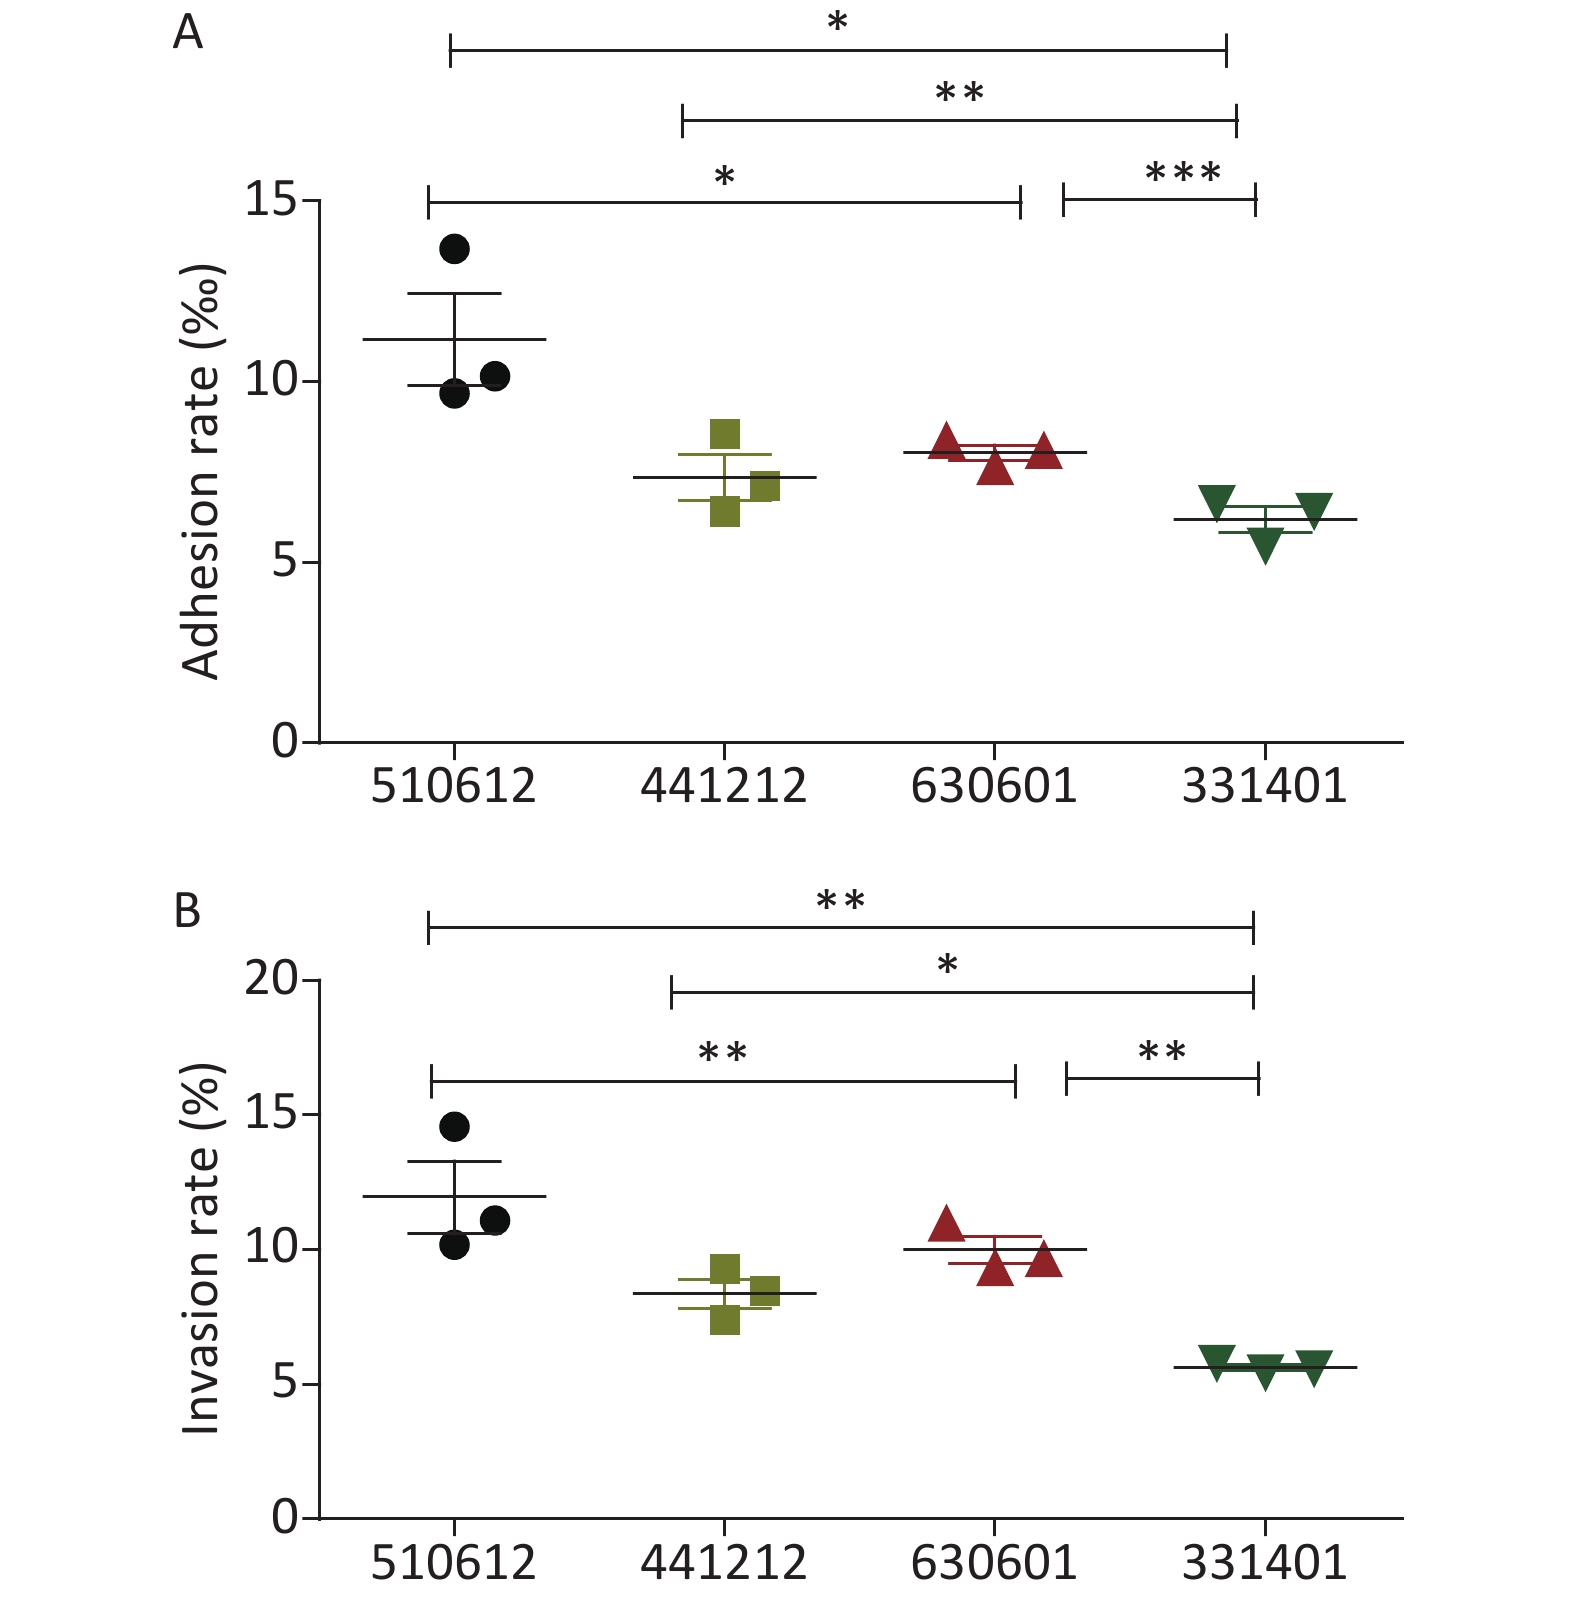
The detailed results for the adhesion and invasion rates of the four N. meningitidis isolates are presented in Table 2 and Figure 1. Serogroup A isolate 510612 had a significantly higher adhesion rate than the other serogroup ST-7 isolates (P < 0.05 vs. the other three isolates). Serogroup X isolate 331401 had the lowest adhesion capability (P < 0.05 vs. serogroup A isolate 510612, P < 0.01 vs. serogroup B isolate 441212, P < 0.001 vs. serogroup C isolate 630601) (Figure 1A). Serogroup A isolate 510612 also had the highest invasion rate (P < 0.01 vs. the other two isolates). In addition, Serogroup X isolate 331401 also had the weakest invasion capability (P < 0.01 vs. serogroup A isolate 510612 and serogroup C isolate 630601, P < 0.05 vs. serogroup B isolate 441212) (Figure 1B, Table 2).
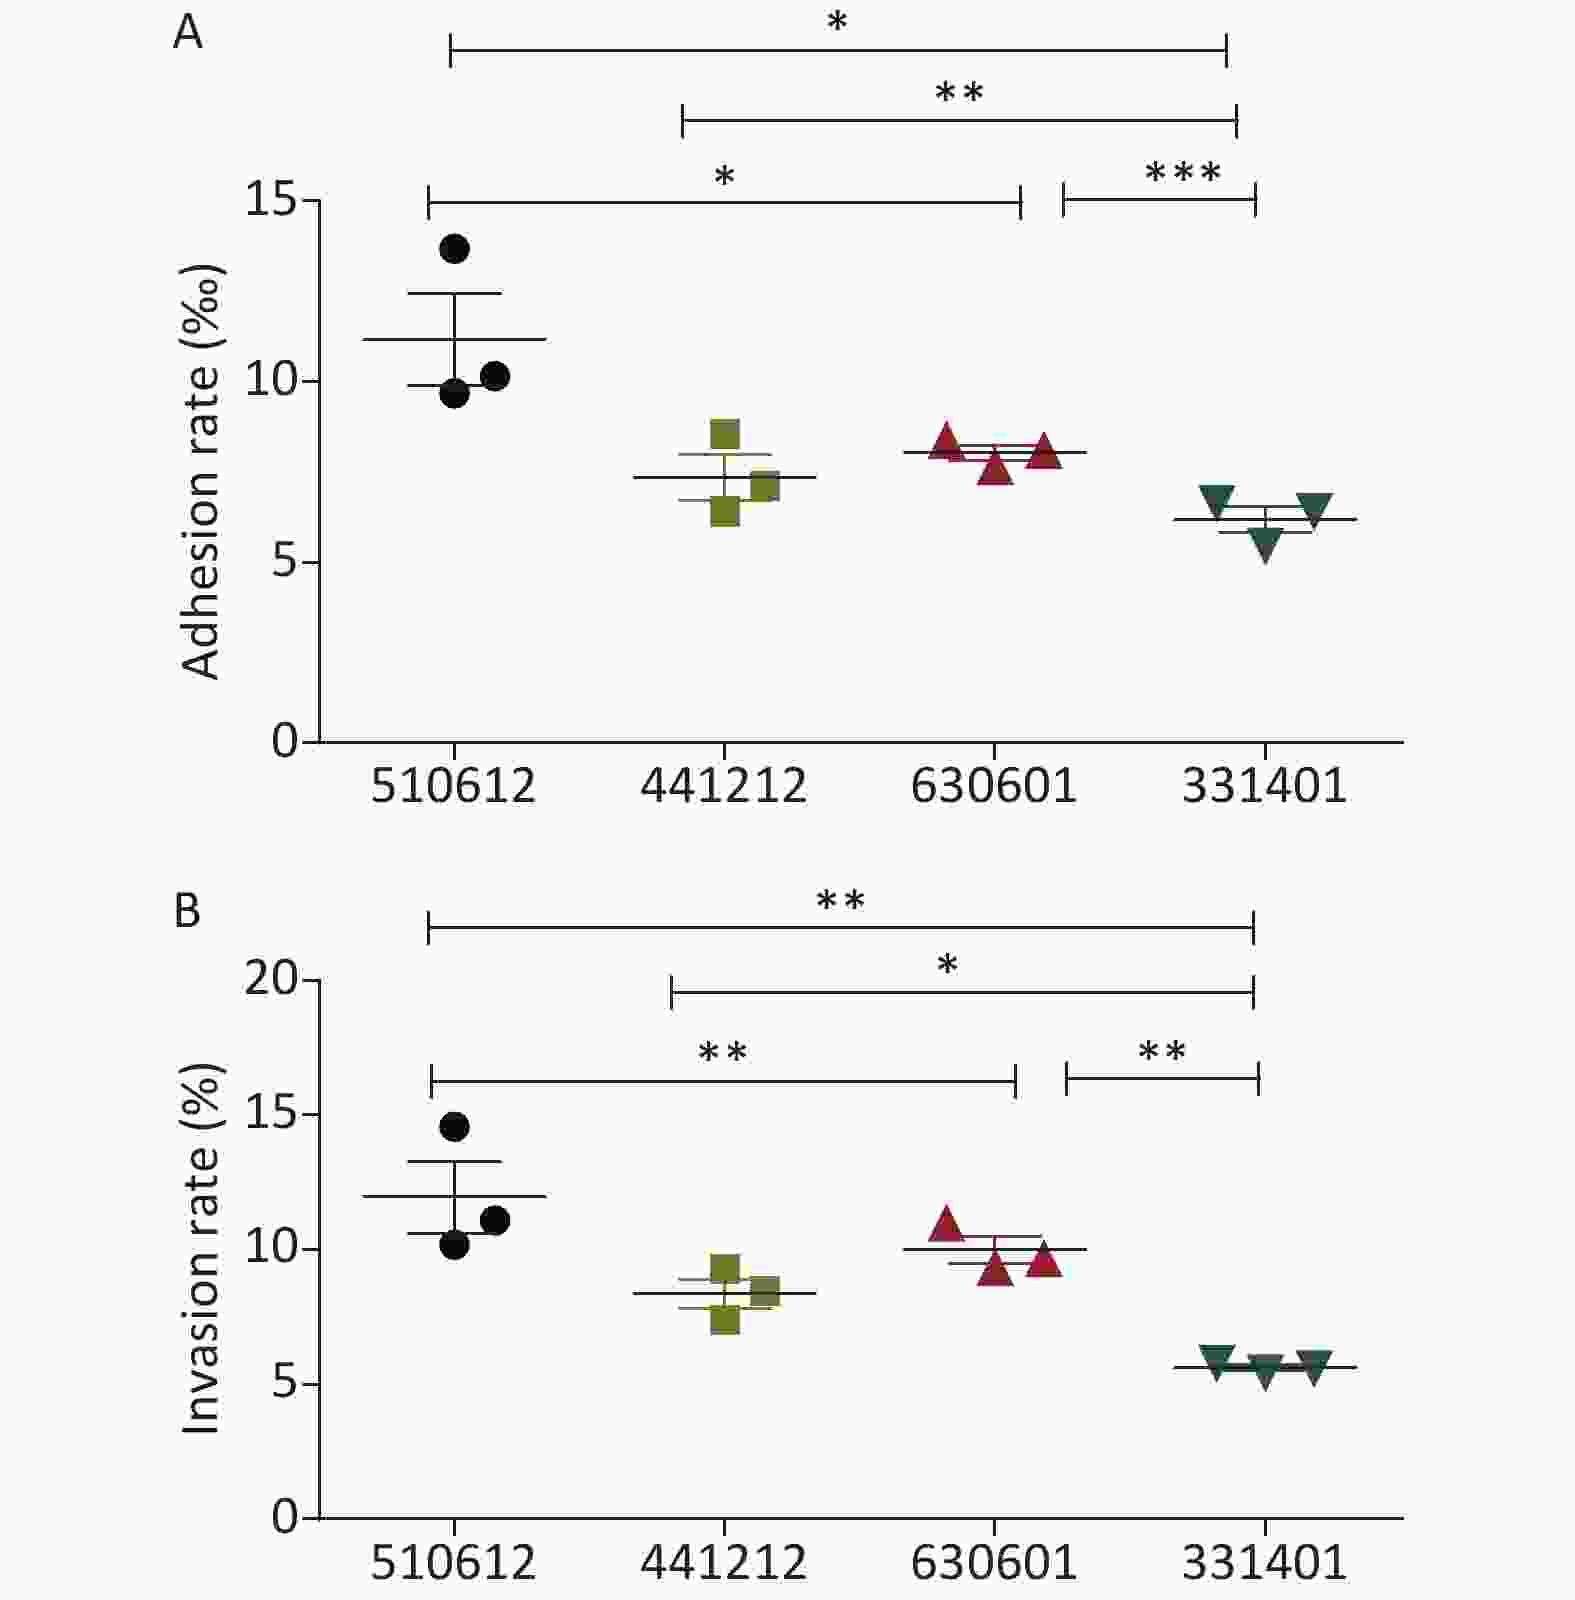
Figure 1. Adhesion and invasion rates of the four N. meningitidis ST-7 isolates examined in this study. The adhesion rate was calculated as the percentage of the number of adherent bacteria divided by the number of total bacteria (A), and the invasive rate was calculated as the percentage of the number of intracellular bacteria divided by the number of total associated bacteria (B). *P < 0.05, **P < 0.01, ***P < 0.001 vs. the indicated groups.
Table 2. Adhesion and invasion rates of the ST-7 isolates in A549 cells (Mean ± SD)
Isolate No. Adhesion rate (‰) Invasion rate (%) 510612 11.17 ± 2.18 11.95 ± 2.32 441212 7.35 ± 1.10 8.36 ± 0.95 630601 8.04 ± 0.36 9.99 ± 0.87 331401 6.18 ± 0.62 5.62 ± 0.18 -
A549 cells were infected with the isolates as described in the previous section, and the release of cytokines (IL-6, IL-1β, IFN, IL-8, and TNF-α) was examined for each serogroup ST-7 isolate. Cytokine analysis was performed using ELISA at 12, 24, 36, and 48 h after infection. Challenge with the four N. meningitidis isolates induced time-dependent secretion of IL-6, IL-1β, and IFN. Cytokine release by uninfected cells was analyzed to determine the CTR values.
The ELISA data shown in Table 3 illustrate that in accordance with the adhesion and invasion rates, serogroup A isolate 510612 had the strongest ability to promote the release of IL-6 in host cells (P < 0.05) and serogroup X isolate 331401 triggered significantly less IL-6 release than the other ST-7 isolates did (P < 0.05).
Table 3. IL-6 release in response to the challenge with ST-7 isolates (pg/mL) (Mean ± SD)
Isolate No. Infection time 12 h 24 h 36 h 48 h CTR 3.93 ± 0.14 4.11 ± 0.05 4.40 ± 0.06 4.77 ± 0.10 510612 19.83 ± 0.60 42.42 ± 0.59b 61.06 ± 4.05b 67.05 ± 1.69b 441212 19.37 ± 0.07 38.77 ± 2.69a 58.55 ± 1.06b 62.65 ± 0.77a 630601 20.15 ± 1.24 44.14 ± 0.58b 59.61 ± 0.97b 64.89 ± 0.71b 331401 20.69 ± 0.42 38.12 ± 1.52a 53.25 ± 1.10a 60.99 ± 1.47a Note. aP < 0.05 compared with serogroup A isolate 510612, bP < 0.05 compared with serogroup X isolate 331401. The findings for IL-1β release were similar to those for IL-6 release. As shown in Table 4, infection with serogroup A isolate 510612 resulted in the highest levels of IL-1β release (P < 0.05), while infection with serogroup X isolate 331401 resulted in the lowest levels of IL-1β secretion in host cells (P < 0.05).
Table 4. IL-1β release in response to the challenge with ST-7 isolates (pg/mL) (Mean ± SD)
Isolate No. Infection time 12 h 24 h 36 h 48 h CTR 1.59 ± 0.04 1.63 ± 0.03 1.61 ± 0.07 1.75 ± 0.03 510612 1.66 ± 0.14 2.45 ± 0.06b 2.72 ± 0.06b 4.50 ± 0.12b 441212 1.51 ± 0.04 2.17 ± 0.11ab 2.68 ± 0.06b 4.27 ± 0.11ab 630601 1.48 ± 0.09 2.21 ± 0.15ab 2.54 ± 0.06b 4.26 ± 0.05ab 331401 1.50 ± 0.07 1.90 ± 0.05a 2.20 ± 0.20a 3.45 ± 0.04a Note. aP < 0.05 compared with serogroup A isolate 510612, bP < 0.05 compared with serogroup X isolate 331401. The variations in IFN release also showed similar patterns to IL-6 and IL-1β release: that is, serogroup A isolate 510612 exhibited the strongest capability to induce the release of IFN (P < 0.05), while serogroup X isolate 331401 exhibited the weakest capability for IFN secretion (P < 0.05) (Table 5).
Table 5. IFN release in response to the challenge with ST-7 isolates (pg/mL) (Mean ± SD)
Isolate No. Infection time 12 h 24 h 36 h 48 h CTR 1.17 ± 0.09 1.42 ± 0.05 1.44 ± 0.02 1.55 ± 0.03 510612 1.48 ± 0.01bc 1.98 ± 0.04bc 2.74 ± 0.02bc 2.96 ± 0.06bc 441212 1.23 ± 0.01a 1.56 ± 0.02ac 1.97 ± 0.02abc 2.32 ± 0.01abc 630601 1.30 ± 0.07a 1.66 ± 0.05a 2.22 ± 0.08ac 2.55 ± 0.16ac 331401 1.28 ± 0.03a 1.70 ± 0.05a 1.83 ± 0.05ab 2.07 ± 0.02ab Note. aP < 0.05 compared with serogroup A isolate 510612, bP < 0.05 compared with serogroup C isolate 630601, cP < 0.05 compared with serogroup X isolate 331401. No significant difference in TNF-α and IL-8 release was found between the four ST-7 N. meningitidis isolates (Tables 6 & 7).
Table 6. TNF-α release in response to the challenge with ST-7 isolates (pg/mL) (Mean ± SD)
Isolate No. Infection time 12 h 24 h 36 h 48 h CTR 0.24 ± 0.02 0.23 ± 0.01 0.25 ± 0.02 0.29 ± 0.02 510612 0.26 ± 0.02 0.32 ± 0.01 0.25 ± 0.02 0.29 ± 0.03 441212 0.23 ± 0.01 0.25 ± 0.02 0.25 ± 0.03 0.30 ± 0.03 630601 0.23 ± 0.02 0.25 ± 0.02 0.26 ± 0.01 0.29 ± 0.02 Table 7. IL-8 release in response to the challenge with ST-7 isolates (pg/mL) (Mean ± SD)
Isolate No. Infection time 12 h 24 h 36 h 48 h CTR 0.91 ± 0.04 0.93 ± 0.04 0.92 ± 0.07 1.08 ± 0.05 510612 1.11 ± 0.08 0.93 ± 0.05 1.09 ± 0.06 0.92 ± 0.09 441212 0.93 ± 0.03 0.96 ± 0.04 1.07 ± 0.02 1.02 ± 0.04 630601 1.08 ± 0.05 1.05 ± 0.03 1.04 ± 0.03 1.01 ± 0.11 331401 0.97 ± 0.12 1.02 ± 0.06 1.05 ± 0.03 0.99 ± 0.02 -
The effect of infection with the different serogroups on host cells was further clarified with an analysis of cell death performed by Trypan blue staining and apoptosis analysis performed with FCM. As reported for the other experiments, non-infected cells were used as CTR.
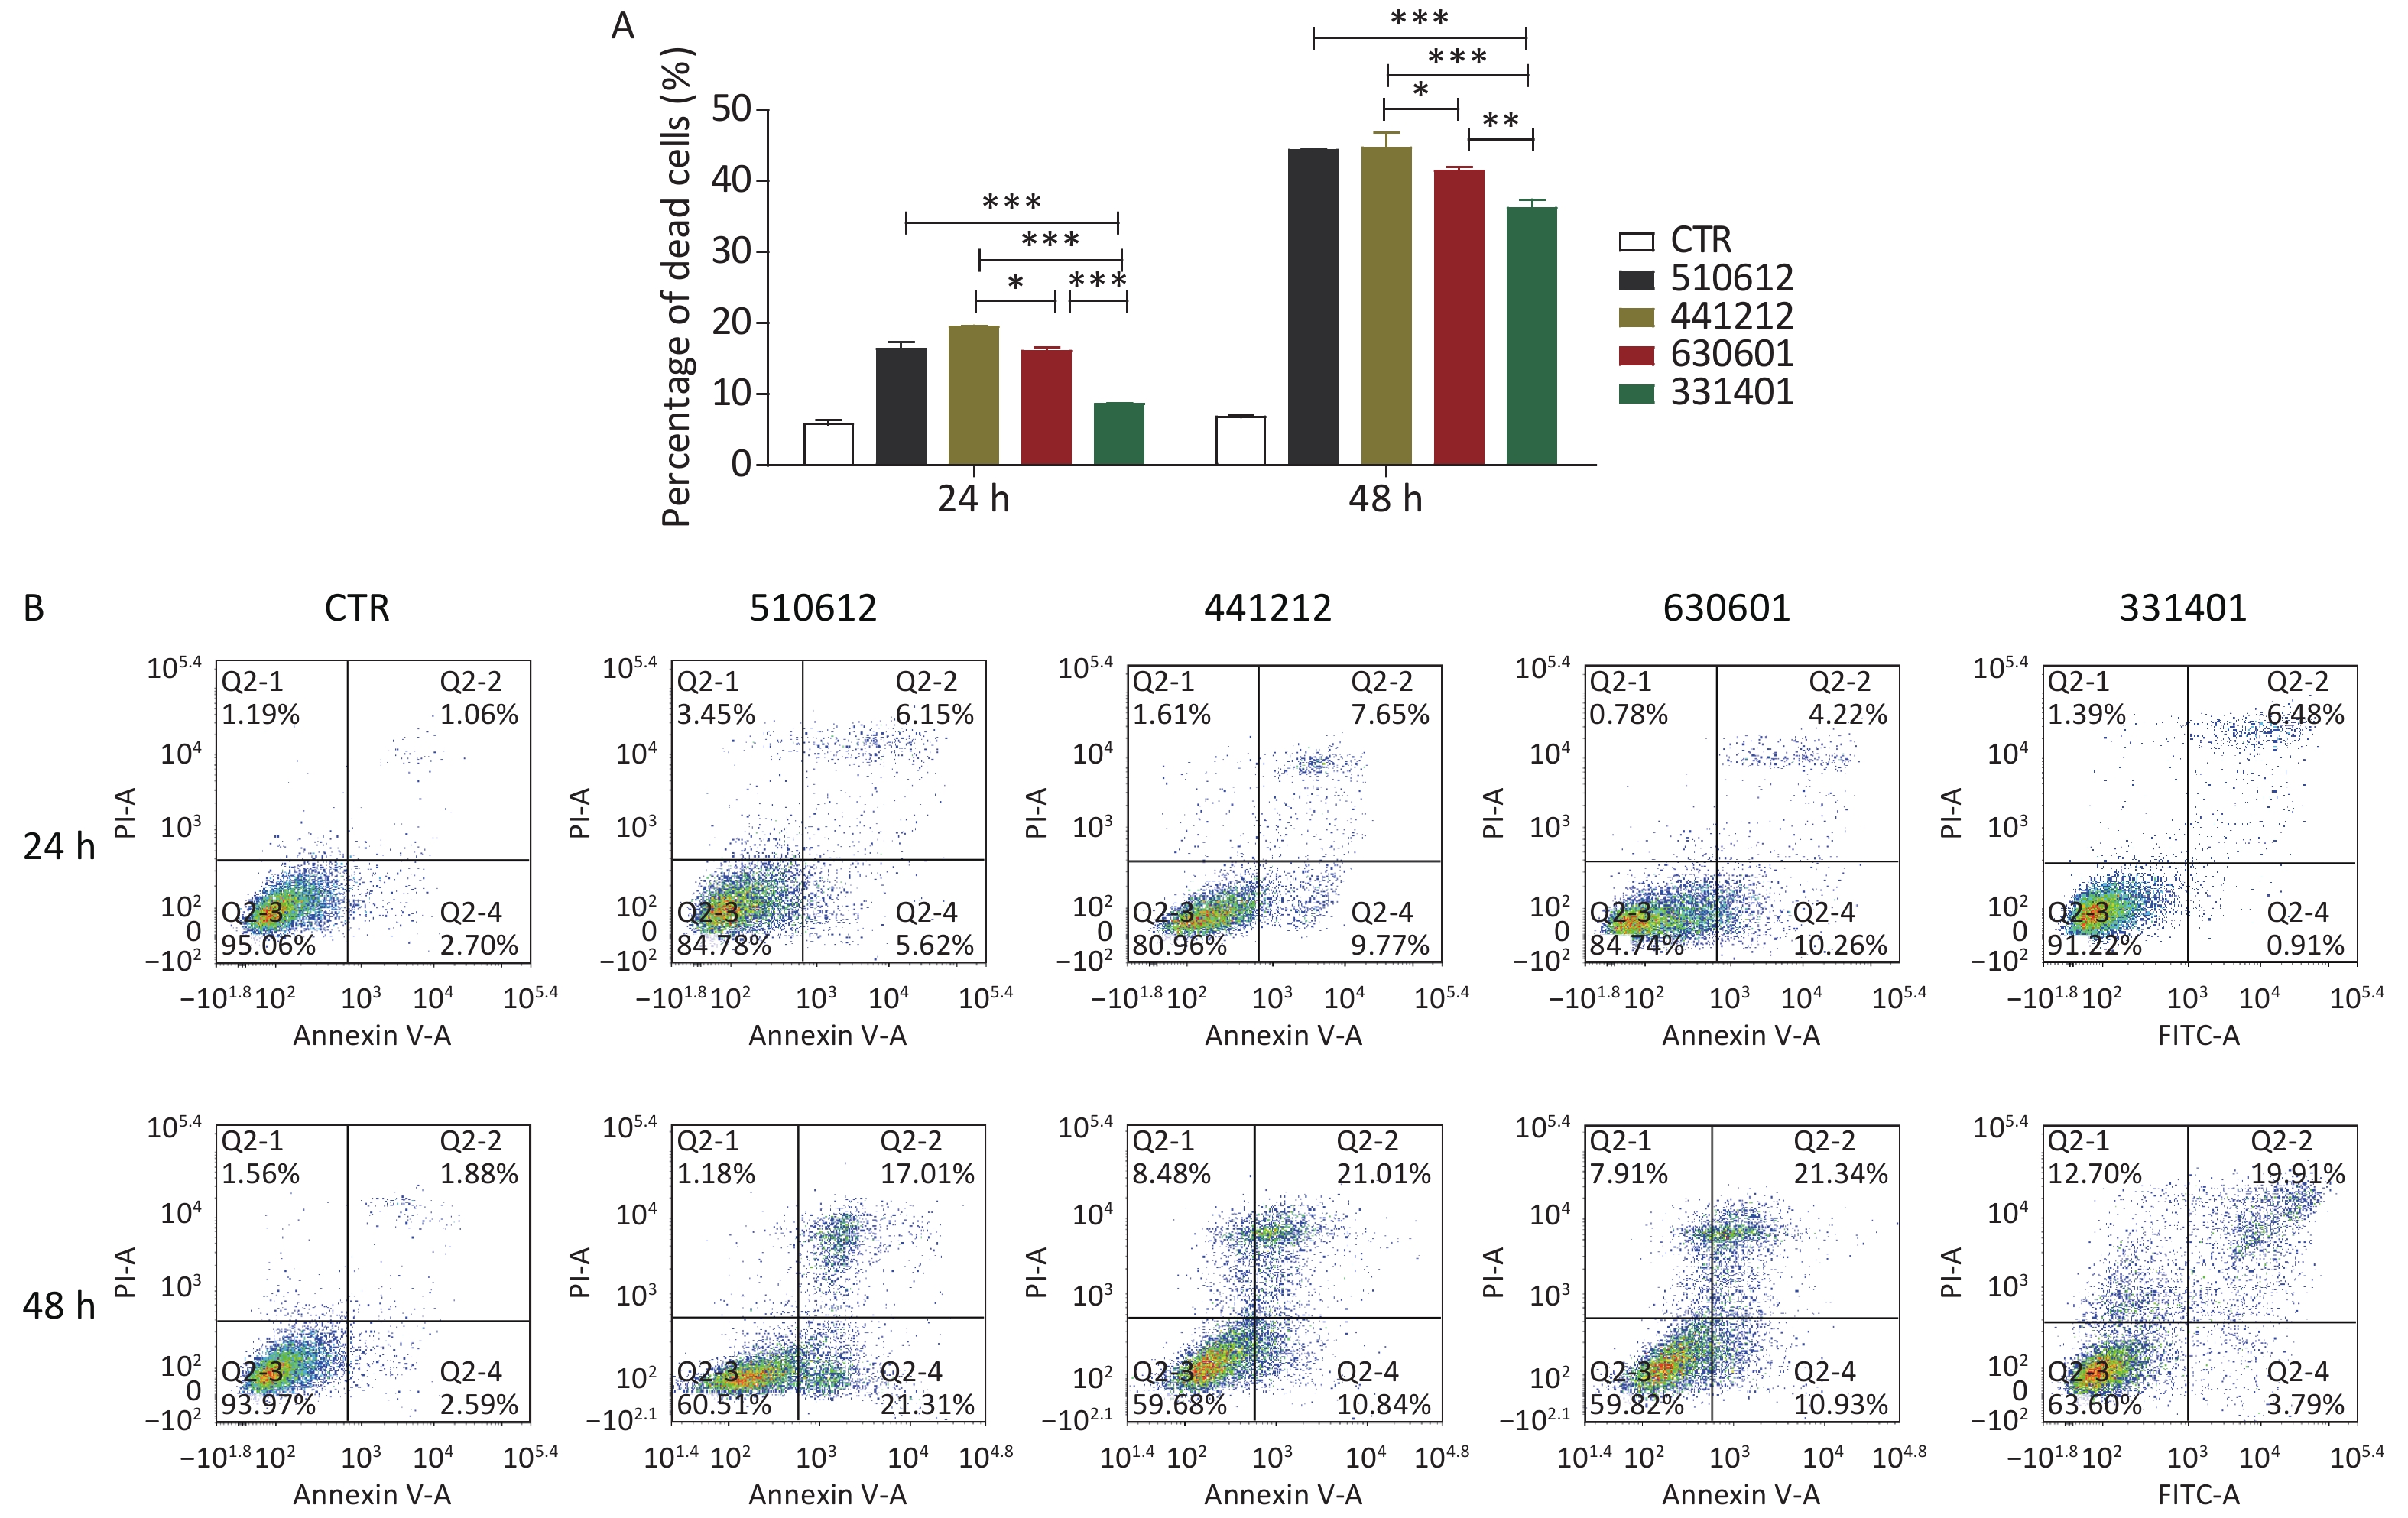
As shown in Figure 2A and Table 8, the ST-7 isolates induced significant cell death from 24 h to 48 h after infection, as compared with the cell death rate from 0 h to 24 h after infection. Further, at 24 h and 48 h after infection, the serogroup X isolate 331401 was associated with the lowest cell death rate among the ST-7 isolates (P < 0.001 vs. the other isolates at both time points; P < 0.01 vs. the serogroup C isolate 630601 at 48 h). This finding is in accordance with data for adhesion and invasion rates and cytokine release. However, unlike the findings for IFN release, the host cell death rate was higher in response to the challenge with the serogroup B isolate 441212 than with the serogroup C isolate 630601 (P < 0.05) (Figure 2A & Table 8).
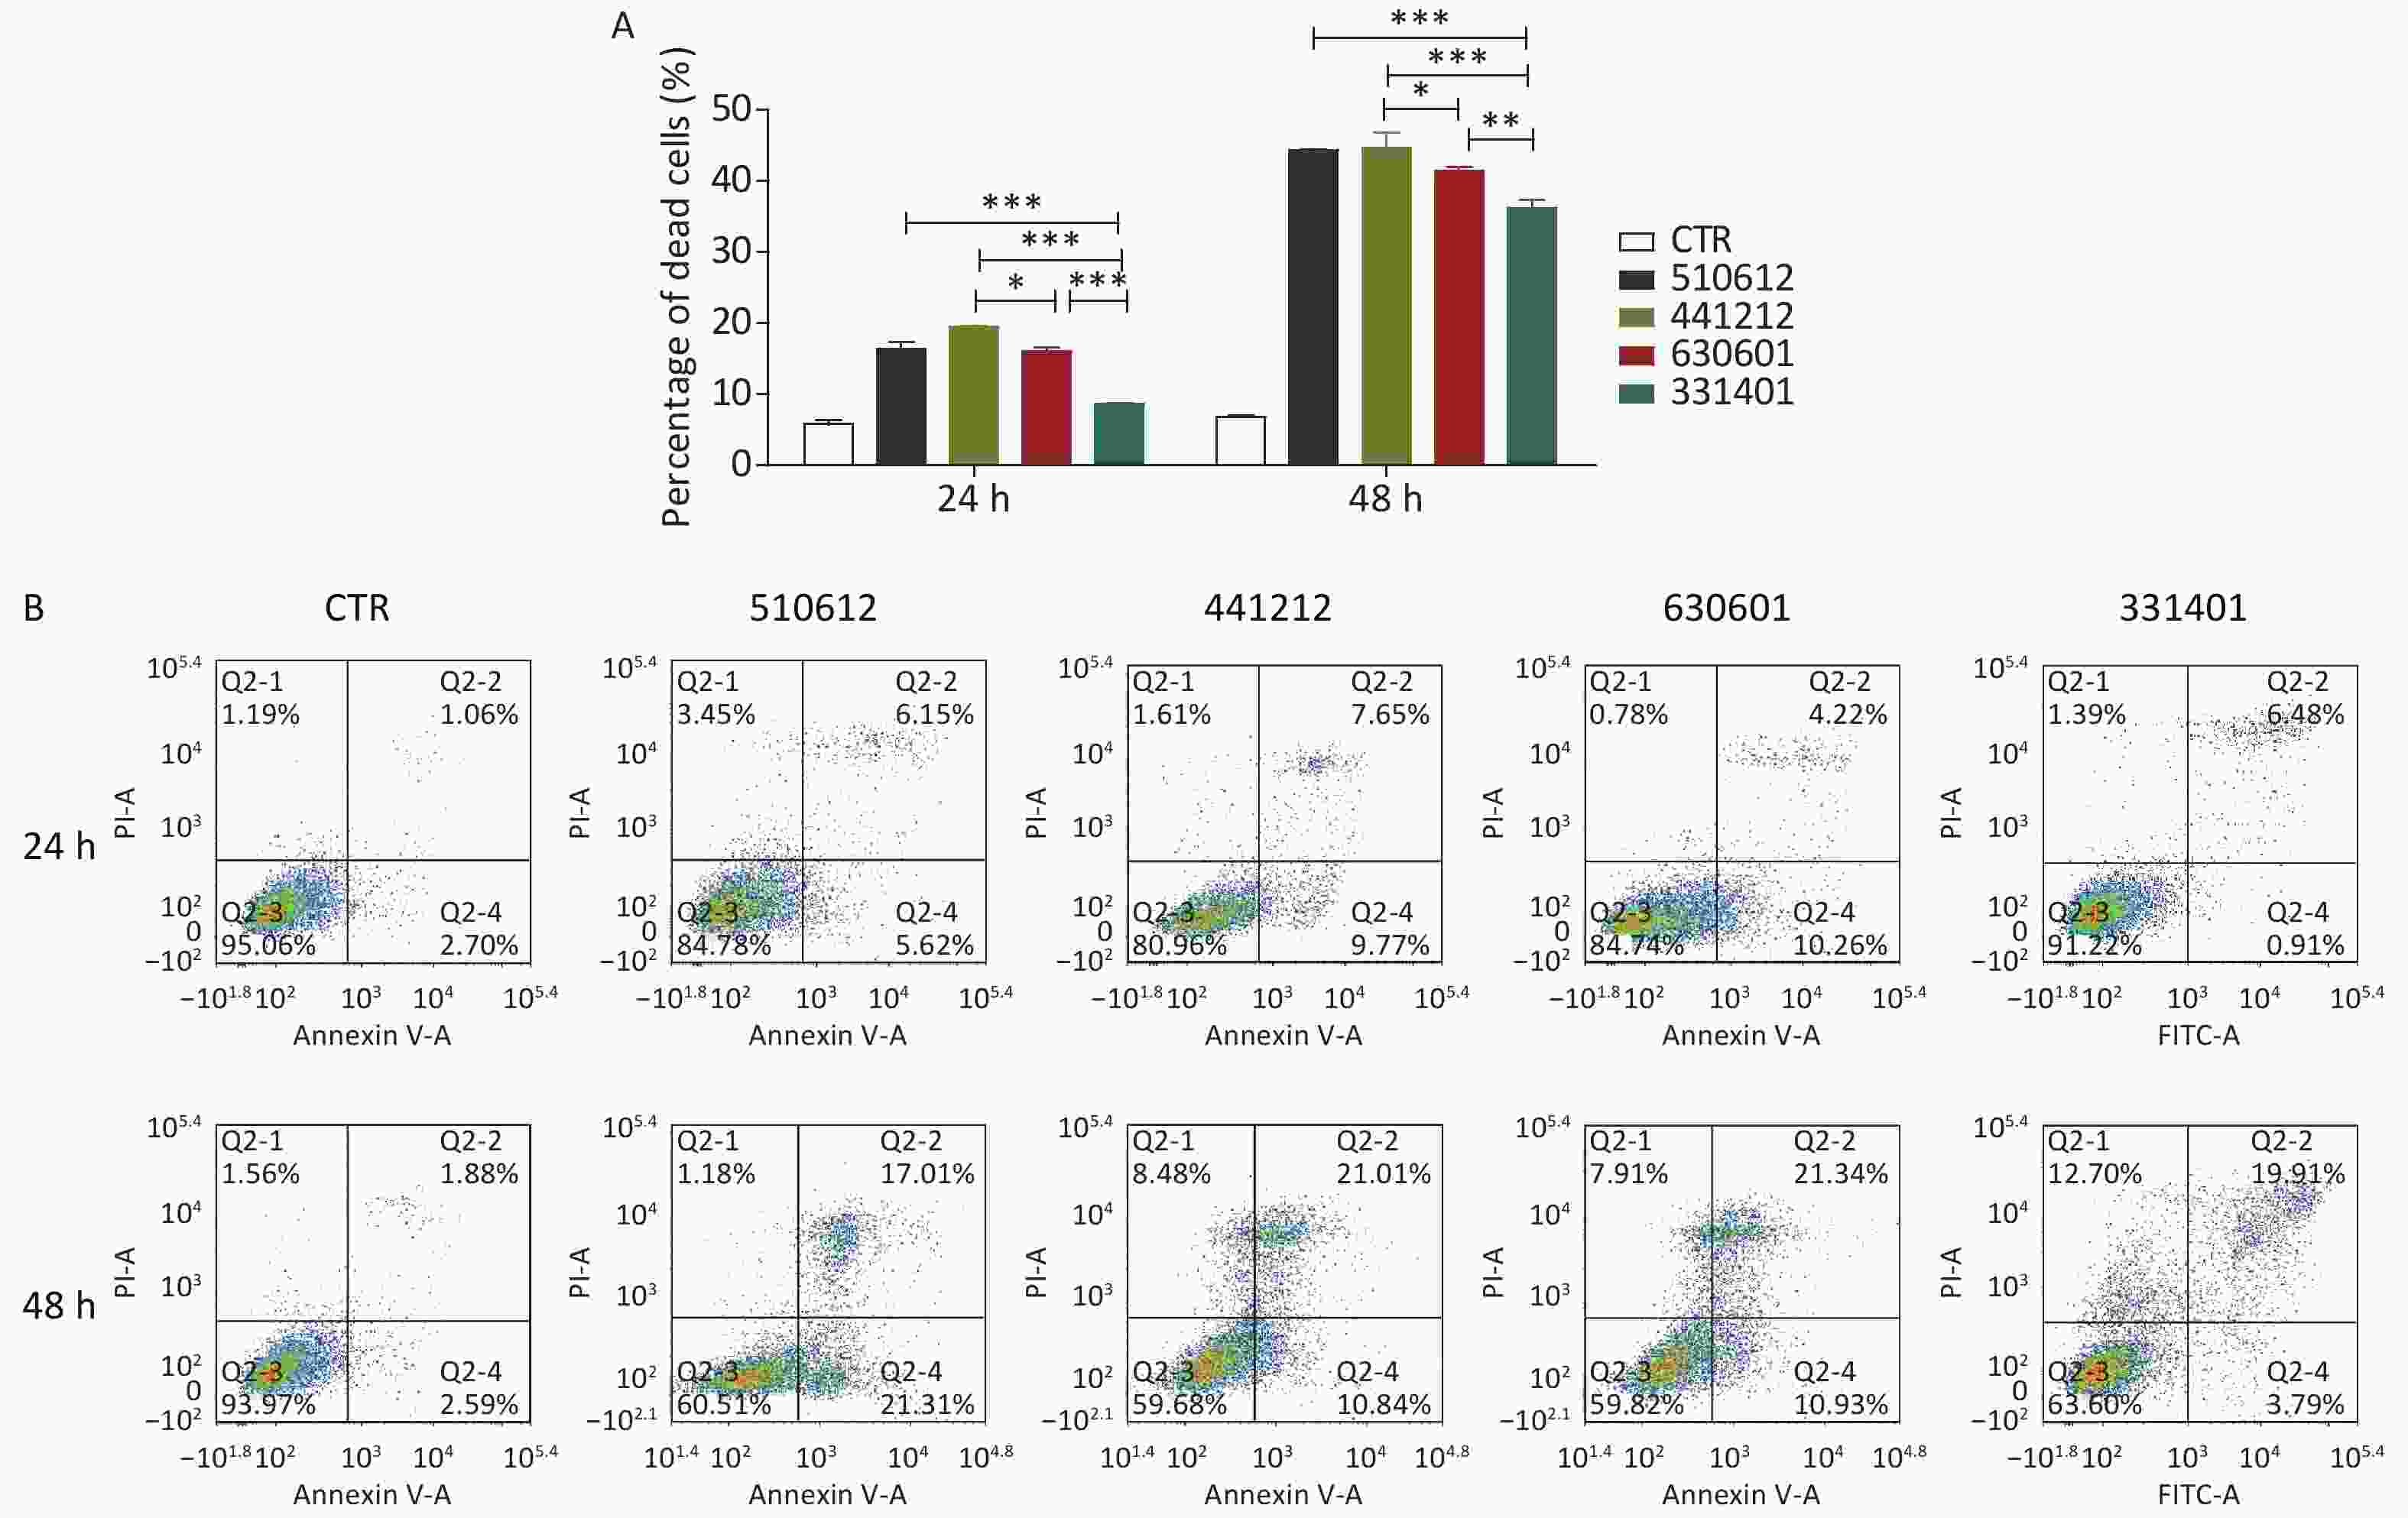
Figure 2. Cell death and apoptosis induced by the examined N. meningitidis isolates. (A) A549 cells were infected with four ST-7 isolates belonging to four serogroups (A, B, C, and X) or left as uninfected controls (CTR). Non-viable cells were stained with Trypan blue. Cell death induced by different serogroup ST-7 isolates at different time points was calculated and compared. (B) A549 cells infected with the same four ST-7 isolates were analyzed for apoptosis using FITC Annexin V by FCM. Q2-1 represents non-viable non-apoptotic cells (NVN); Q2-2, non-viable apoptotic cells (NVA); Q2-3, viable non-apoptotic cells (VN); Q2-4, viable apoptotic cells (VA). The apoptosis rate was calculated as the percentage of the number of Q2-2 cells plus the number of Q2-4 cells. *P < 0.05, **P < 0.01, ***P < 0.001 as compared with the indicated groups.
Table 8. Cell death in response to the challenge with ST-7 isolates (%) (Mean ± SD)
Isolate No. Infection time 24 h 48 h CTR 5.82 ± 0.95 6.86 ± 0.25 510612 16.33 ± 1.77 44.41 ± 0.16 441212 19.46 ± 0.35 44.75 ± 3.59 630601 16.10 ± 0.78 41.44 ± 0.85 331401 8.62 ± 0.19 36.22 ± 2.06 The results of Trypan blue straining were verified by host cell apoptosis analysis with FCM. As shown in Table 9 and Figure 2B, the host cell apoptosis rate was higher from 24 h to 48 h after infection than from 0 h to 24 h. Among the ST-7 isolates, the serogroup A isolate 510612 had the most powerful apoptotic effect, and the serogroup X isolate 331401 had the weakest apoptotic effect. This is also in agreement with the other findings.
Table 9. Apoptosis rate in response to the challenge with ST-7 isolates (%)
Isolate No. Infection time Percentage of cells Q2-1 Q2-2 Q2-3 Q2-4 CTR 24 h 1.19 1.06 95.06 2.70 48 h 1.56 1.88 93.97 2.59 510612 24 h 3.45 6.15 84.78 5.62 48 h 1.18 17.01 60.51 21.31 441212 24 h 1.61 7.65 80.96 9.77 48 h 8.48 21.01 59.68 10.84 630601 24 h 0.78 4.22 84.74 10.26 48 h 7.91 21.34 59.82 10.93 331401 24 h 1.39 6.48 91.22 0.91 48 h 12.70 19.91 63.60 3.79 Note. Q2-1, non-viable non-apoptotic cells (NVN); Q2-2, non-viable apoptotic cells (NVA); Q2-3, viable non-apoptotic cells (VN); Q2-4, viable apoptotic cells (VA). The percentage of apoptosis was calculated by dividing the number of cells in Q2-2 by the number of cells in Q2-4. The in vitro data confirm that the pathogenicity of the four serogroups belonging to the same ST differ, with serogroup X having the lowest pathogenicity. Therefore, capsule structure affects the interaction and adaptation between N. meningitidis and host cells. The overall effects of capsule structure on N. meningitidis pathogenicity are presented in Table 10.
Table 10. Overall effects of capsule structure on N. meningitidis pathogenicity of the four serogroups
Isolate No. Serogroup Sequence type Adhesion Invasion Cytokine release (48 h) Apoptosis (48 h) IL-6 IL-1β IFN 510612 A 7 ++++ ++++ ++++ ++++ ++++ ++++ 441212 B 7 ++/+++ ++/+++ ++ +++/++ ++ ++/+++ 630601 C 7 +++/++ +++/++ +++/++ ++/+++ +++ +++/++ 331401 X 7 + + + + + + -
The present study examined how structural changes in the capsule of N. meningitidis influence and modulate the pathogenicity and adaptation of N. meningitidis to host cells. Four serogroups of N. meningitidis (A, B, C, and X) belonging to ST-7 were examined, and our research implies that although the ST-7 isolates all belong to the hyperinvasive clonal complex 5, the pathogenicity of the various serogroups differed. The serogroup A isolates showed the highest pathogenicity, and the serogroup C isolates showed the second-highest pathogenicity. At the other end of the spectrum, the serogroup X isolates demonstrated the weakest pathogenicity. Further, the findings for host cell apoptosis induced by the isolates indicate that the switching of serogroup A to serogroup X improved the adaptation of N. meningitidis to hosts. However, in-depth characterization and gene analysis of the structures of the A, B, C, and X serogroup capsules are needed to understand better the molecular basis for the pathogenicity of this bacterium.
Attachment to and invasion into host cells are the first events in N. meningitidis survival and pathogenicity[13]. Nasopharyngeal colonization, endothelial cell invasion, and penetration of the blood-brain barrier by meningococci are facilitated by structures such as the pili, outer membrane proteins, and lipo-oligosaccharides[1,11,14,15]. The findings indicated that the capsule significantly affects the attachment and invasion ability of the four serogroups, with serogroup X showing significantly lower attachment and invasion ability than the other four serogroups. The phagocytosis of N. meningitidis by host cells leads to efficient killing of the bacteria. Only a low proportion of intracellular serogroup X bacteria were observed in our research (as indicated by the invasion rates). Therefore, the serogroup X ST-7 capsules may have had the most potent inhibitory effect on bacterial cell phagocytosis.
The severity of IMDs is directly correlated with the production of pro-inflammatory cytokines such as IL-6, IL-8, IL-1β, IFN, and TNF-α. In addition to inducing local inflammation, cytokines also promote adhesion by upregulating the expression of adhesion-associated molecules[16-20]. To explore the effect of different serogroup capsules on cytokine release, we examined cytokine release from host cells after a challenge with isolates of the four ST-7 serogroups A, B, C, and X. The pro-inflammatory cytokine levels differed across the isolates, with the serogroup X isolate resulting in the lowest levels of cytokine release. Thus, the capsules of the different serogroups had varying effects on cytokine release. In addition, the potency of the inflammatory response induced by the serogroup X isolate 331401 was in agreement with its weak adhesion and invasive properties. Thus, the findings also confirm the role of cytokines in adhesion and invasion.
The unique ST-7 serogroup X isolate 331401 we studied here might be a variant of serogroup A ST-7 isolates produced by capsular switching, as genetic analysis showed that it was not closely correlated with other serogroup X strains[6,10]. The emergence of this unique ST-7 serogroup X isolate is considered as a potential threat to public health because there are no vaccines available against it[6,10]. As mentioned before, our results indicated that the capsular switching from serogroup A to X reduced the adhesion and invasion capabilities of N. meningitidis, and reduced pro-inflammatory cytokine release and host cell apoptosis. Thus, capsular switching may have enhanced the adaptation of N. meningitidis and further boosted the possibility of the spread of N. meningitidis infection. This further confirms that capsular switching to serogroup X is a great threat to public health. However, it should be noted that there was only a small difference in the pathogenicity of serogroups B and C ST-7 isolates. Thus, the pathogenicity of N. meningitidis may not only be determined by the nature of the capsule (serogroup) but by the genotype of the isolate too.
N. meningitidis is divided into hyperinvasive and hypoinvasive lineages according to the genotypes and STs in the current general evaluation systems, and cc5 is one of the hyperinvasive lineages[21]. The research suggests that there are considerable differences in the pathogenicity of different serogroups belonging to the same ST category. Further, as all four isolates belonged to the hyperinvasive ST-7 lineage, the findings indicate that hypoinvasive isolates may also be found in hyperinvasive lineages. Thus, the current genetic classification methods for N. meningitidis might have limitations in epidemic surveillance. Further, the current data also highlight that it might be challenging to develop a general evaluation criterion and monitoring standards for N. meningitidis epidemics. Therefore, future studies should focus on the combination of genomics and functional analysis.
-
GUO Peng Bo conducted the study, wrote, and revised the manuscript, and ZHU Bing Qing conceived the idea. XU Li, GAO Wan Ying, and GAO Yuan carried out the bacterial culture experiments. LIANG Hao and ZHANG Mao Jun analyzed the data, and SHAO Zhu Jun supervised the study.
-
The authors declare no conflicts of interest.
doi: 10.3967/bes2020.015
Comparison of the Pathogenicity of Neisseria meningitidis Isolates of Hyperinvasive Sequence Type 7 Belonging to Serogroups A, B, C, and X
-
Abstract:
Objective To compare the pathogenicity of isolates of sequence type 7 (ST-7) Neisseria meningitidis (N. meningitidis) belonging to four different serogroups (A, B, C, and X). Methods Four ST-7 N. meningitidis isolates serogrouped as A, B, C, and X and characterized by different capsule structures, were examined for their adhesion and invasion properties, and their ability to induce cytokine release and apoptosis in the host cell (the A549 cell line). Results Among the four ST-7 N. meningitidis isolates, the serogroup A isolate possessed the strongest adhesion and invasion ability. This isolate also induced the release of the highest levels of the pro-inflammatory mediators interleukin-6, interleukin-1β, and interferon, and the highest apoptosis rate in the host cells. However, there was no significant difference in interleukin-8 and tumor necrosis factor-α secretion between the four isolates. Based on the findings, the serogroup X N. meningitidis isolate had the weakest pathogenicity, whereas there was almost no difference in the pathogenicity of the isolates from serogroups B and C. Conclusions The differences in the capsular structure of the four isolates of ST-7 N. meningitidis affected their pathogenic capacities. The findings also imply that the hyperinvasive ST-7 N. meningitidis lineage may include hypoinvasive isolates. -
Key words:
- ST-7 N. meningitidis /
- Capsule /
- Pathogenicity /
- Adaptation
-
Figure 1. Adhesion and invasion rates of the four N. meningitidis ST-7 isolates examined in this study. The adhesion rate was calculated as the percentage of the number of adherent bacteria divided by the number of total bacteria (A), and the invasive rate was calculated as the percentage of the number of intracellular bacteria divided by the number of total associated bacteria (B). *P < 0.05, **P < 0.01, ***P < 0.001 vs. the indicated groups.
Figure 2. Cell death and apoptosis induced by the examined N. meningitidis isolates. (A) A549 cells were infected with four ST-7 isolates belonging to four serogroups (A, B, C, and X) or left as uninfected controls (CTR). Non-viable cells were stained with Trypan blue. Cell death induced by different serogroup ST-7 isolates at different time points was calculated and compared. (B) A549 cells infected with the same four ST-7 isolates were analyzed for apoptosis using FITC Annexin V by FCM. Q2-1 represents non-viable non-apoptotic cells (NVN); Q2-2, non-viable apoptotic cells (NVA); Q2-3, viable non-apoptotic cells (VN); Q2-4, viable apoptotic cells (VA). The apoptosis rate was calculated as the percentage of the number of Q2-2 cells plus the number of Q2-4 cells. *P < 0.05, **P < 0.01, ***P < 0.001 as compared with the indicated groups.
Table 1. N. meningitidis isolates used in the present study
Isolate No. Serogroup Isolate source Year of isolation Sequence type Clonal complex 510612 A Patient 2006 7 5 441212 B Patient 2012 7 5 630601 C Patient 2006 7 5 331401 X Patient 2014 7 5  下载: 导出CSV
S1. Detail information of strains used in this study
Bacteria No. Serogroup Isolates source Specimen type Year of isolated Isolate district Sequence type Clonal complex PorA FetA NadA_ variant NHBA_ peptide FHbp 510612 A Patient Throat swab 2006 Sichuan 7 5 P1.20,9 F3-1 NadA-2/3 126 1.5 441212 B Patient CSF 2012 Guangdong 7 5 P1.20,9 F3-1 NadA-2/3 126 1.5 630601 C Patient CSF 2006 Qinghai 7 5 P1.20,9 F3-1 NadA-2/3 126 1.5 331401 X Patient CSF 2014 Zhejiang 7 5 P1.20,9 F3-1 NadA-2/3 126 1.5
下载: 导出CSV
Table 2. Adhesion and invasion rates of the ST-7 isolates in A549 cells (Mean ± SD)
Isolate No. Adhesion rate (‰) Invasion rate (%) 510612 11.17 ± 2.18 11.95 ± 2.32 441212 7.35 ± 1.10 8.36 ± 0.95 630601 8.04 ± 0.36 9.99 ± 0.87 331401 6.18 ± 0.62 5.62 ± 0.18
下载: 导出CSV
Table 3. IL-6 release in response to the challenge with ST-7 isolates (pg/mL) (Mean ± SD)
Isolate No. Infection time 12 h 24 h 36 h 48 h CTR 3.93 ± 0.14 4.11 ± 0.05 4.40 ± 0.06 4.77 ± 0.10 510612 19.83 ± 0.60 42.42 ± 0.59b 61.06 ± 4.05b 67.05 ± 1.69b 441212 19.37 ± 0.07 38.77 ± 2.69a 58.55 ± 1.06b 62.65 ± 0.77a 630601 20.15 ± 1.24 44.14 ± 0.58b 59.61 ± 0.97b 64.89 ± 0.71b 331401 20.69 ± 0.42 38.12 ± 1.52a 53.25 ± 1.10a 60.99 ± 1.47a Note. aP < 0.05 compared with serogroup A isolate 510612, bP < 0.05 compared with serogroup X isolate 331401.
下载: 导出CSV
Table 4. IL-1β release in response to the challenge with ST-7 isolates (pg/mL) (Mean ± SD)
Isolate No. Infection time 12 h 24 h 36 h 48 h CTR 1.59 ± 0.04 1.63 ± 0.03 1.61 ± 0.07 1.75 ± 0.03 510612 1.66 ± 0.14 2.45 ± 0.06b 2.72 ± 0.06b 4.50 ± 0.12b 441212 1.51 ± 0.04 2.17 ± 0.11ab 2.68 ± 0.06b 4.27 ± 0.11ab 630601 1.48 ± 0.09 2.21 ± 0.15ab 2.54 ± 0.06b 4.26 ± 0.05ab 331401 1.50 ± 0.07 1.90 ± 0.05a 2.20 ± 0.20a 3.45 ± 0.04a Note. aP < 0.05 compared with serogroup A isolate 510612, bP < 0.05 compared with serogroup X isolate 331401.
下载: 导出CSV
Table 5. IFN release in response to the challenge with ST-7 isolates (pg/mL) (Mean ± SD)
Isolate No. Infection time 12 h 24 h 36 h 48 h CTR 1.17 ± 0.09 1.42 ± 0.05 1.44 ± 0.02 1.55 ± 0.03 510612 1.48 ± 0.01bc 1.98 ± 0.04bc 2.74 ± 0.02bc 2.96 ± 0.06bc 441212 1.23 ± 0.01a 1.56 ± 0.02ac 1.97 ± 0.02abc 2.32 ± 0.01abc 630601 1.30 ± 0.07a 1.66 ± 0.05a 2.22 ± 0.08ac 2.55 ± 0.16ac 331401 1.28 ± 0.03a 1.70 ± 0.05a 1.83 ± 0.05ab 2.07 ± 0.02ab Note. aP < 0.05 compared with serogroup A isolate 510612, bP < 0.05 compared with serogroup C isolate 630601, cP < 0.05 compared with serogroup X isolate 331401.
下载: 导出CSV
Table 6. TNF-α release in response to the challenge with ST-7 isolates (pg/mL) (Mean ± SD)
Isolate No. Infection time 12 h 24 h 36 h 48 h CTR 0.24 ± 0.02 0.23 ± 0.01 0.25 ± 0.02 0.29 ± 0.02 510612 0.26 ± 0.02 0.32 ± 0.01 0.25 ± 0.02 0.29 ± 0.03 441212 0.23 ± 0.01 0.25 ± 0.02 0.25 ± 0.03 0.30 ± 0.03 630601 0.23 ± 0.02 0.25 ± 0.02 0.26 ± 0.01 0.29 ± 0.02
下载: 导出CSV
Table 7. IL-8 release in response to the challenge with ST-7 isolates (pg/mL) (Mean ± SD)
Isolate No. Infection time 12 h 24 h 36 h 48 h CTR 0.91 ± 0.04 0.93 ± 0.04 0.92 ± 0.07 1.08 ± 0.05 510612 1.11 ± 0.08 0.93 ± 0.05 1.09 ± 0.06 0.92 ± 0.09 441212 0.93 ± 0.03 0.96 ± 0.04 1.07 ± 0.02 1.02 ± 0.04 630601 1.08 ± 0.05 1.05 ± 0.03 1.04 ± 0.03 1.01 ± 0.11 331401 0.97 ± 0.12 1.02 ± 0.06 1.05 ± 0.03 0.99 ± 0.02
下载: 导出CSV
Table 8. Cell death in response to the challenge with ST-7 isolates (%) (Mean ± SD)
Isolate No. Infection time 24 h 48 h CTR 5.82 ± 0.95 6.86 ± 0.25 510612 16.33 ± 1.77 44.41 ± 0.16 441212 19.46 ± 0.35 44.75 ± 3.59 630601 16.10 ± 0.78 41.44 ± 0.85 331401 8.62 ± 0.19 36.22 ± 2.06
下载: 导出CSV
Table 9. Apoptosis rate in response to the challenge with ST-7 isolates (%)
Isolate No. Infection time Percentage of cells Q2-1 Q2-2 Q2-3 Q2-4 CTR 24 h 1.19 1.06 95.06 2.70 48 h 1.56 1.88 93.97 2.59 510612 24 h 3.45 6.15 84.78 5.62 48 h 1.18 17.01 60.51 21.31 441212 24 h 1.61 7.65 80.96 9.77 48 h 8.48 21.01 59.68 10.84 630601 24 h 0.78 4.22 84.74 10.26 48 h 7.91 21.34 59.82 10.93 331401 24 h 1.39 6.48 91.22 0.91 48 h 12.70 19.91 63.60 3.79 Note. Q2-1, non-viable non-apoptotic cells (NVN); Q2-2, non-viable apoptotic cells (NVA); Q2-3, viable non-apoptotic cells (VN); Q2-4, viable apoptotic cells (VA). The percentage of apoptosis was calculated by dividing the number of cells in Q2-2 by the number of cells in Q2-4.
下载: 导出CSV
Table 10. Overall effects of capsule structure on N. meningitidis pathogenicity of the four serogroups
Isolate No. Serogroup Sequence type Adhesion Invasion Cytokine release (48 h) Apoptosis (48 h) IL-6 IL-1β IFN 510612 A 7 ++++ ++++ ++++ ++++ ++++ ++++ 441212 B 7 ++/+++ ++/+++ ++ +++/++ ++ ++/+++ 630601 C 7 +++/++ +++/++ +++/++ ++/+++ +++ +++/++ 331401 X 7 + + + + + +
下载: 导出CSV
-
[1] Slanina H, Hebling S, Hauck CR, et al. Cell invasion by Neisseria meningitidis requires a functional interplay between the focal adhesion kinase, src and cortactin. PLoS One, 2012; 7, e39613. doi: 10.1371/journal.pone.0039613 [2] Engman J, Negrea A, Sigurlásdóttir S, et al. Neisseria meningitidis polynucleotide phosphorylase affects aggregation, adhesion and virulence. Infect Immun, 2016; 84, IAI.01463−01415. [3] Mustapha MM, Marsh JW, Krauland MG, et al. Genomic investigation reveals highly conserved, mosaic, recombination events associated with capsular switching among invasive Neisseria meningitidis serogroup W sequence type (ST)-11 strains. Genome Biol Evol, 2016; 8, 2065−75. doi: 10.1093/gbe/evw122 [4] Tzeng YL, Thomas J, Stephens DS. Regulation of capsule in Neisseria meningitidis. Crit Rev Microbiol, 2016; 42, 759. [5] Tulenko MM, Krauland NG, Rebelo MC, et al. Capsular switching in invasive Neisseria meningitidis, Brazil1. Emerg Infect Dis, 2012; 18, 1336−8. [6] Ji X, Yao PP, Zhang LY, et al. Capsule switching of Neisseria meningitidis sequence type 7 serogroup A to serogroup X. J Infect, 2017; 75, 521. doi: 10.1016/j.jinf.2017.09.003 [7] Harrison LH, Shutt KA, Schmink SE, et al. Population structure and capsular switching of invasive Neisseria meningitidis isolates in the pre-meningococcal conjugate vaccine era—United States, 2000-2005. J Infect Dis, 2010; 201, 1208−24. doi: 10.1086/651505 [8] Lancellotti M, Guiyoule A, Ruckly C, et al. Conserved virulence of C to B capsule switched Neisseria meningitidis clinical isolates belonging to ET-37/ST-11 clonal complex. Microbes & Infection, 2006; 8, 191−6. [9] Zhu B, Shi F, Zhang A, et al. Prevalence and genetic characteristics of 4CMenB and rLP2086 vaccine candidates among Neisseria meningitidis serogroup B strains, China. Vaccine, 2018; 36. [10] Pan J, Yao P, Zhang H, et al. The case of a new sequence type 7 serogroup X Neisseria meningitidis infection in China: may capsular switching change serogroup profile? Int J Infect Dis, 2014; 29, 62−4. doi: 10.1016/j.ijid.2014.07.022 [11] Schubert-Unkmeir A. Molecular mechanisms involved in the interaction of Neisseria meningitidis with cells of the human blood-cerebrospinal fluid barrier. Pathogens & Disease, 2017; 75, 1-10. [12] Tommassen J, Arenas J. Biological functions of the secretome of Neisseria meningitidis. Frontiers in Cellular & Infection Microbiology, 2017; 7, 256. [13] Stefania V, Paul H. Neisseria meningitidis serogroup A vaccines: an overview. Expert Review of Vaccines, 2003; 2, 571. doi: 10.1586/14760584.2.4.571 [14] Bille E, Meyer J, Jamet A, et al. A virulence-associated filamentous bacteriophage of Neisseria meningitidis increases host-cell colonisation. PLoS Pathog, 2017; 13, e1006495. doi: 10.1371/journal.ppat.1006495 [15] Bonazzi D, Schiavo VL, Machata S, et al. Intermittent pili-mediated forces fluidize Neisseria meningitidis aggregates promoting vascular colonization. Cell, 2018; S009286741830463X. [16] Gopinathan U, Redalen KR, TrãŞeid AM, et al. Large-scale reduction of tyrosine kinase activities in human monocytes stimulated in vitro with Neisseria meningitidis. PLoS One, 2018; 13, e0181912. doi: 10.1371/journal.pone.0181912 [17] John CM, Phillips NJ, Stein DC, et al. Innate immune response to lipooligosaccharide: pivotal regulator of the pathobiology of invasive Neisseria meningitidis infections. Pathogens & Disease, 2017; 75, 1-14. [18] Dick J, Hebling S, Becam J, et al. Comparison of the inflammatory response of brain microvascular and peripheral endothelial cells following infection with Neisseria meningitidis. Pathogens & Disease, 2017; 75, 1-11. [19] Gopinathan U, Øvstebø R, Brusletto BS, et al. Transcriptomic data from two primary cell models stimulating human monocytes suggest inhibition of oxidative phosphorylation and mitochondrial function by N. meningitidis which is partially up-regulated by IL-10. BMC Immunol, 2017; 18, 46. doi: 10.1186/s12865-017-0229-5 [20] Han JX, Ng GZ, Cecchini P, et al. Heat shock protein complex vaccines induce antibodies against Neisseria meningitidis via a MyD88-independent mechanism. Vaccine, 2016; 34, 1704−11. doi: 10.1016/j.vaccine.2016.02.001 [21] Shao Z, Li W, Ren J, et al. Identification of a new Neisseria meningitidis serogroup C clone from Anhui province, China. Lancet, 2006; 367, 419−23. doi: 10.1016/S0140-6736(06)68141-5 -

 点击查看大图
计量
- 文章访问数: 1446
- HTML全文浏览量: 467
- PDF下载量: 89
- 被引次数: 0

 Quick Links