

 下载:
下载:


-
Incomplete combustion of bituminous coal will produce a large number of coke oven emissions (COEs). Polycyclic aromatic hydrocarbons (PAHs) account for the largest proportion of these COEs. PAHs enter the human body mainly through the respiratory tract, digestive tract, and skin[1], becoming hydroxyl PAHs (OH-PAHs) following their metabolism by the human body and are ultimately excreted mainly in urine. OH-PAHs in urine can effectively reflect the internal exposure to PAHs and is an important biomarker[2].
Many epidemiological studies have shown that occupational exposure to PAHs increases the risk of lung cancer, skin cancer, and cancers related to various chronic and cardiovascular diseases[3]. Studies have shown that the hemoglobin content, white blood cell count, and lymphocyte count of coking workers are all higher than those of non-coking workers[4]. The content of PAH metabolites in vivo has a certain correlation with damage seen in peripheral blood images and lymphocyte DNA[5]. However, studies on the health hazards of PAHs mainly focuses on the occupational population, while the effect on residents in the polluted areas around the coking plant are rarely reported. Compared with the occupational population, the residents living in the polluted area around the coking plant have long-term exposure to PAHs at a low concentration.
Therefore, in this study, 369 people from a village 1–2 km away from a coking plant in northern China were selected as subjects for the non-occupational population in PAHs polluted areas, including 193 adults and 176 children. OH-PAH metabolite, routine blood examination, and immunoglobulin were determined to study the correlation between them and explore the health hazards of long-term exposure to PAHs in a non-occupational population.
For the present analysis, we selected all participants who underwent routine tests of the blood, and for immunoglobulin and OH-PAHs as the study population. We further excluded participants with a body mass index (BMI) ≤ 18.4, who were locally resident < 5 years, had coking work experience, or had a major disease such as lung cancer, lymphatic cancer, or leukemia, among others. In addition, participants were excluded if they had recently taken anticoagulants, thrombolytics, aspirin, or other drugs that affect routine blood examination and immunoglobulin outcomes.
A pre-tested questionnaire regarding demographic characteristics, including age (18–44, 45–60, and over 60), sex, level of education (≤ primary school and ≥ middle school), years locally resident (≤ 30 years, and > 30 years), BMI (18.5–23.9, 24.0–27.9, and ≥ 28.0), coking work experience, and use of tobacco and alcohol, barbecue foods, or hair perm or dye, were administered in person by trained interviewers. Participants were categorized into three groups of cigarette smoking (non-smoker, former smoker, and current smoker). Participants who had smoked continuously for six months or more were defined as current smokers. Participants who had stopped smoking for six months or more were defined as former smokers. Alcohol consumption was classified into two groups (non-drinker and drinker). Participants who had drunk alcohol consistently for more than one year were defined as drinkers. Use of barbecue food was classified into two groups (never and usually). Since most of the participants under the age of 18 were school-age children with an average age of 10.4 years, this group was analyzed separately from the adults in this study and only five demographic factors (age, sex, height, weight, and years locally resident) were recorded.
All participants had given written informed consent and guardians provided consent on behalf of minors. All biological samples, including morning urine (35 mL) and blood (5 mL) donated by participants, were numbered and analyzed without knowing its source.
Hemaray 86 automatic hematological analyzer (Rayto Co., Shen Zhen, China) was used for routine blood tests, all of which were conducted on the day of sampling. Immunoglobulin and urinary creatinine were detected using a BS-400 Chemistry Analyzer (Mindray Co., Shen Zhen, China). All above tests were completed within 2 days of sample retrieval.
The morning urine samples were obtained and frozen at -20 °C until further processing. A total of seven OH-PAHs from urine were detected in this study, including 1-hydroxynaphthalene (1-NAP), 2-hydroxynaphthalene (2-NAP), 1-hydroxyphenanthren (1-PHE), 2-hydroxyphenanthren (2-PHE), 2-hydroxyfluorene (2-FLU), 9-hydroxyfluorene (9-FLU), and 1-hydroxypyrene (1-PYR). Briefly, we hydrolyzed urine samples with β-glucuronidase/sulfatase (Roche Diagnostics Ltd.) and purified them with C18 cartridges (surface area: 525 m2/g per Cartridge, average particle size: 52.1 μm, Supelco Ltd., Pennsylvania, USA). Finally, we obtained a 400 μL extract by condensing with dry N2 purge. The extract was analyzed using Waters-2695 high performance liquid chromatography (HPLC, Waters Ltd., USA) equipped with a fluorescence detector to detect. The linearity (expressed as the R value), mean relative standard deviation (RSD), and mean recovery rate were 0.9992%–1.0000%, 0.70%–8.36%, and 81.92%–123.50%, respectively.
Statistical analyses were performed using SPSS 22.0 (SPSS Inc., Chicago, IL, USA) and SAS 9.4 (SAS Institute, Inc., Cary, NC) survey procedures. Descriptive statistics such as the Wald chi-squared test, two-sided Student’s t-tests Mann-Whitney U test, and Kruskal-Wallis H test were performed where appropriate. The urinary PAH metabolite levels corrected based on creatine levels are represented in violin diagrams. Moreover, the association of urinary PAH metabolites with routine blood and immunoglobulin measures were estimated using multiple linear regression analysis. Because the percentage of samples with detectable levels were nearly 100% for all selected seven PAH metabolites, participants were categorized into tertiles based on the creatinine-corrected values of each OH-PAH. High exposure was defined as the third tertile of PAHs; low exposure was defined as all others (i.e., tertiles 1, 2). P-values were statistically significant at 0.05.
In the summer of 2018, we conducted both epidemiological investigations and environmental indicator monitoring. The total average concentration of PAHs in the ambient air samples monitored at the factory boundary was 732 ng/m3, and the total average concentration of PAHs in the ambient air samples monitored at the village boundary was 220 ng/m3. The meteorological data of wind direction and frequency in the survey area over the past 30 years are shown in Supplementary Table S1 (available in www.besjournal.com). The village where the investigated people lived is located downwind based on the dominant wind direction (north wind) of the coking plant all year round and is 1–2 km away from the factory.
Table S1. Adult: Spearman correlation results among the indicators or characteristics
Gender Age Height Weight BMI Local residence years Education degree Self-reported smoking Alcohol consumption Barbecue food Perm or dye hair 1-NAP 2-NAP 1-PHE 2-PHE 2-FLU 9-FLU 1-PYR Gender 1 −0.195 −0.541 −0.305 0.011 −0.430 0.005 −0.624 −0.380 0.016 0.327 0.100 0.107 0.095 0.022 0.043 0.048 0.168 Age 1 −0.052 −0.017 −0.009 0.697 −0.353 0.224 −0.061 −0.265 −0.191 0.008 0.024 0.145 0.078 0.058 −0.029 0.322 Height 1 0.454 −0.109 0.088 0.086 0.332 0.268 0.129 −0.064 −0.074 −0.072 −0.019 0.031 −0.008 −0.034 −0.115 Weight 1 0.809 0.110 0.028 0.152 0.259 0.066 −0.073 −0.169 −0.163 −0.098 −0.013 −0.064 −0.057 −0.132 BMI 1 0.076 0.003 −0.046 0.090 0.012 −0.037 −0.143 −0.126 −0.105 −0.045 −0.076 −0.033 −0.080 Local residence years 1 −0.226 0.339 0.025 −0.183 −0.208 0.003 0.015 0.101 0.089 0.018 −0.074 0.180 Education degree 1 −0.072 0.084 0.229 0.117 −0.041 0.099 −0.018 0.059 0.018 0.072 −0.158 Self-reported smoking 1 0.318 −0.028 −0.126 −0.056 0.094 −0.049 −0.020 0.010 −0.002 0.027 Alcohol consumption 1 0.045 0.012 −0.128 −0.075 −0.087 −0.043 −0.075 0.012 −0.089 Barbecue food 1 0.035 −0.065 0.001 −0.086 −0.111 −0.069 0.084 −0.203 Perm or dye hair 1 0 0.028 0.089 0.055 0.018 0.015 0.003 1-NAP 1 0.557 0.651 0.560 0.654 0.453 0.507 2-NAP 1 0.607 0.543 0.654 0.470 0.536 1-PHE 1 0.849 0.885 0.462 0.616 2-PHE 1 0.849 0.424 0.511 2-FLU 1 0.442 0.554 9-FLU 1 0.191 1-PYR 1 As shown in Table 1, in adults, the majority of the population was over 60 years of age (54.92%) and most of them resided locally for more than 30 years (82.90%). Among them, there were fewer people who ate barbecue food (9.84%) and drank alcohol (16.06%). However, there was no significant difference in educational level or BMI between male and female subjects. The correlation coefficient between years locally resident and age was relatively high (adults: r = 0.697, children, r = 0.935) (Supplementary Tables S1–S2, available in www.besjournal.com), indicating that most subjects in this study are permanent local residents. Children, in particular, were overwhelmingly born and raised locally. There was no significant difference in age or years locally resident between male and female subjects.
Table 1. Basic characteristics of participants
Variablea Male Female Total χ2/Z/t* P Adult Age (years) 18–44 4 (7.27) 30 (21.74) 34 (17.62) 7.295 0.007 45–59 11 (20.00) 42 (30.43) 53 (27.46) ≥ 60 40 (72.73) 66 (47.83) 106 (54.92) Local residence years ≤ 30 2 (3.64) 31 (22.46) 33 (17.10) 35.508 < 0.001 > 30 53 (96.36) 107 (77.54) 160 (82.90) Education degree ≤ Primary school 25 (45.45) 62 (44.93) 87 (45.08) 0.004 0.947 ≥ Middle school 30 (54.55) 76 (55.07) 106 (54.92) Hight (cm) 166.99 ± 8.35 156.66 ± 6.24 159.6 ± 8.32 8.296 < 0.001 Weight (Kg) 71.61 ± 12.07 62.97 ± 10.67 65.43 ± 11.72 4.891 < 0.001 BMI (kg/m2) 18.5–23.9 16 (29.09) 52 (37.68) 68 (35.23) 0.022 0.882 24.0–27.9 28 (50.91) 46 (33.33) 74 (38.34) ≥ 28.0 11 (20.00) 40 (28.99) 51 (26.42) Self-reported smoking Non-smoker 18 (32.73) 128 (92.75) 146 (75.65) 74.686 < 0.001 Former smoker 16 (29.09) 4 (2.90) 20 (10.36) Current smoker 21 (38.18) 6 (4.35) 27 (13.99) Alcohol consumption No 34 (61.82) 128 (92.75) 162 (83.94) 27.77 < 0.001 Yes 21 (38.18) 10 (7.25) 31 (16.06) Barbecue food No 50 (90.91) 124 (89.86) 174 (90.16) 0.049 0.825 Yes 5 (9.09) 14 (10.14) 19 (9.84) Child Age (years) 10.14 ± 2.28 10.61 ± 2.21 10.4 ± 2.25 −1.380 0.169 Local residence years 10.18 ± 2.31 10.69 ± 2.58 10.46 ± 2.47 −1.378 0.170 BMI 16.53 ± 3.82 16.31 ± 3.41 16.41 ± 3.59 0.402 0.688 Height (cm) 135.03 ± 13.58 139.32 ± 13.91 137.39 ± 13.89 −2.06 0.041 Weight (kg) 30.67 ± 10.16 32.27 ± 10.18 31.55 ± 10.17 −1.043 0.299 Note. a: N (Percent, %) or Mean ± SD. BMI: body mass index. Adult: Male (n = 55), Female (n = 138), Total (n = 193). Child: Male (n = 79), Female (n = 97), Total (n = 176). *t for Child. Table S2. Child: Spearman correlation results among the indicators or characteristics
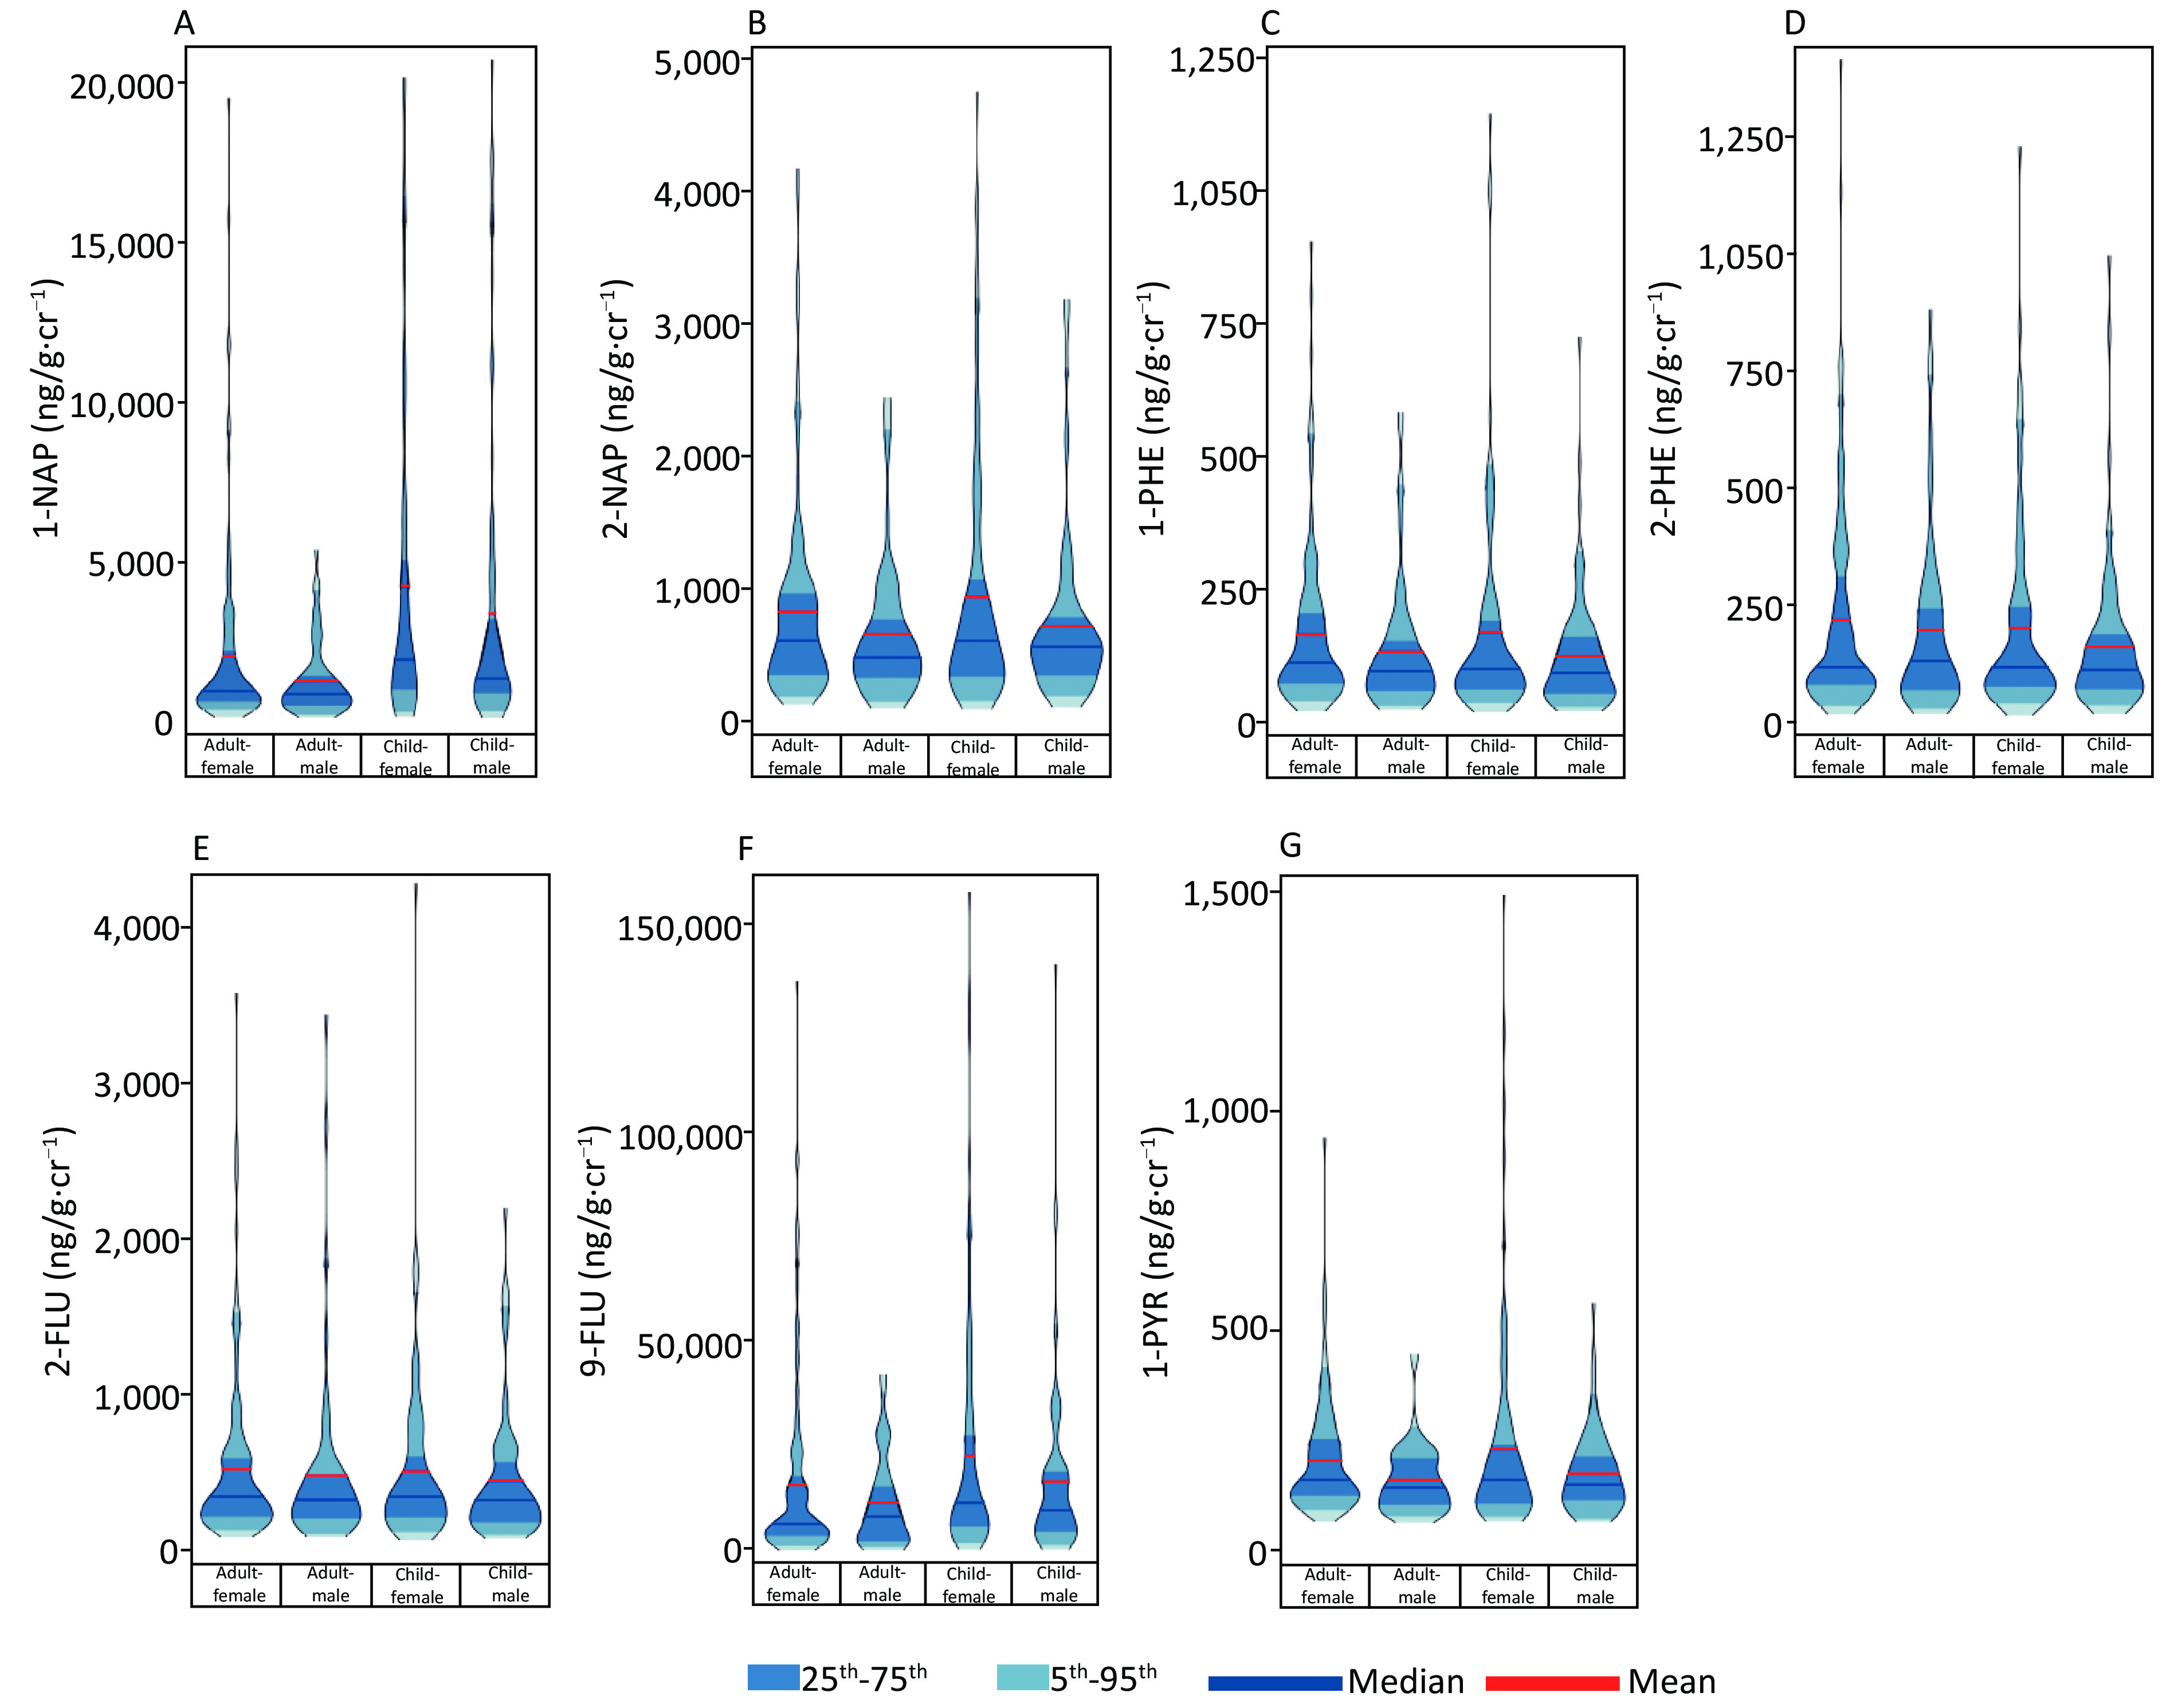
Gender Age Height Weight BMI Local residence years 1-NAP 2-NAP 1-PHE 2-PHE 2-FLU 9-FLU 1-PYR Gender 1 0.111 0.154 0.084 −0.044 0.096 0.111 0.065 0.076 0.055 0.061 0.088 0.060 Age 1 0.795 0.623 0.198 0.935 0.108 −0.089 −0.166 −0.164 −0.155 0.024 −0.208 Height 1 0.795 0.280 0.760 0.055 −0.082 −0.094 −0.079 −0.055 0.023 −0.162 Weight 1 0.775 0.610 0.054 −0.067 −0.044 0.014 −0.010 0.037 −0.112 BMI 1 0.201 −0.007 −0.028 0.033 0.118 0.076 −0.001 −0.018 Local residence years 1 0.157 −0.061 −0.127 −0.128 −0.116 0.070 −0.203 1-NAP 1 0.393 0.285 0.302 0.298 0.514 0.258 2-NAP 1 0.695 0.641 0.684 0.578 0.654 1-PHE 1 0.855 0.860 0.571 0.738 2-PHE 1 0.812 0.535 0.671 2-FLU 1 0.521 0.627 9-FLU 1 0.338 1-PYR 1 The distribution of creatinine-corrected OH-PAHs concentration is presented in Figure 1. As shown in Supplementary Table S3 (available in www.besjournal.com), the metabolic level of 1-PYR in adult females was higher than that in males (P = 0.028), while there was no sex difference in the content of the seven OH-PAHs metabolites in children (all P > 0.05). The levels of 1-NAP and 9-FLU in children were higher than those in adults (all P < 0.01). In terms of the composition ratio of PAHs, it was mainly 9-FLU (adults: 78.81%, children: 66.34%), followed by 1-NAP (adults: 10.50%, children: 27.36%). Spearman correlation analysis showed a correlation between PAH metabolites (Supplementary Tables S1–S2).
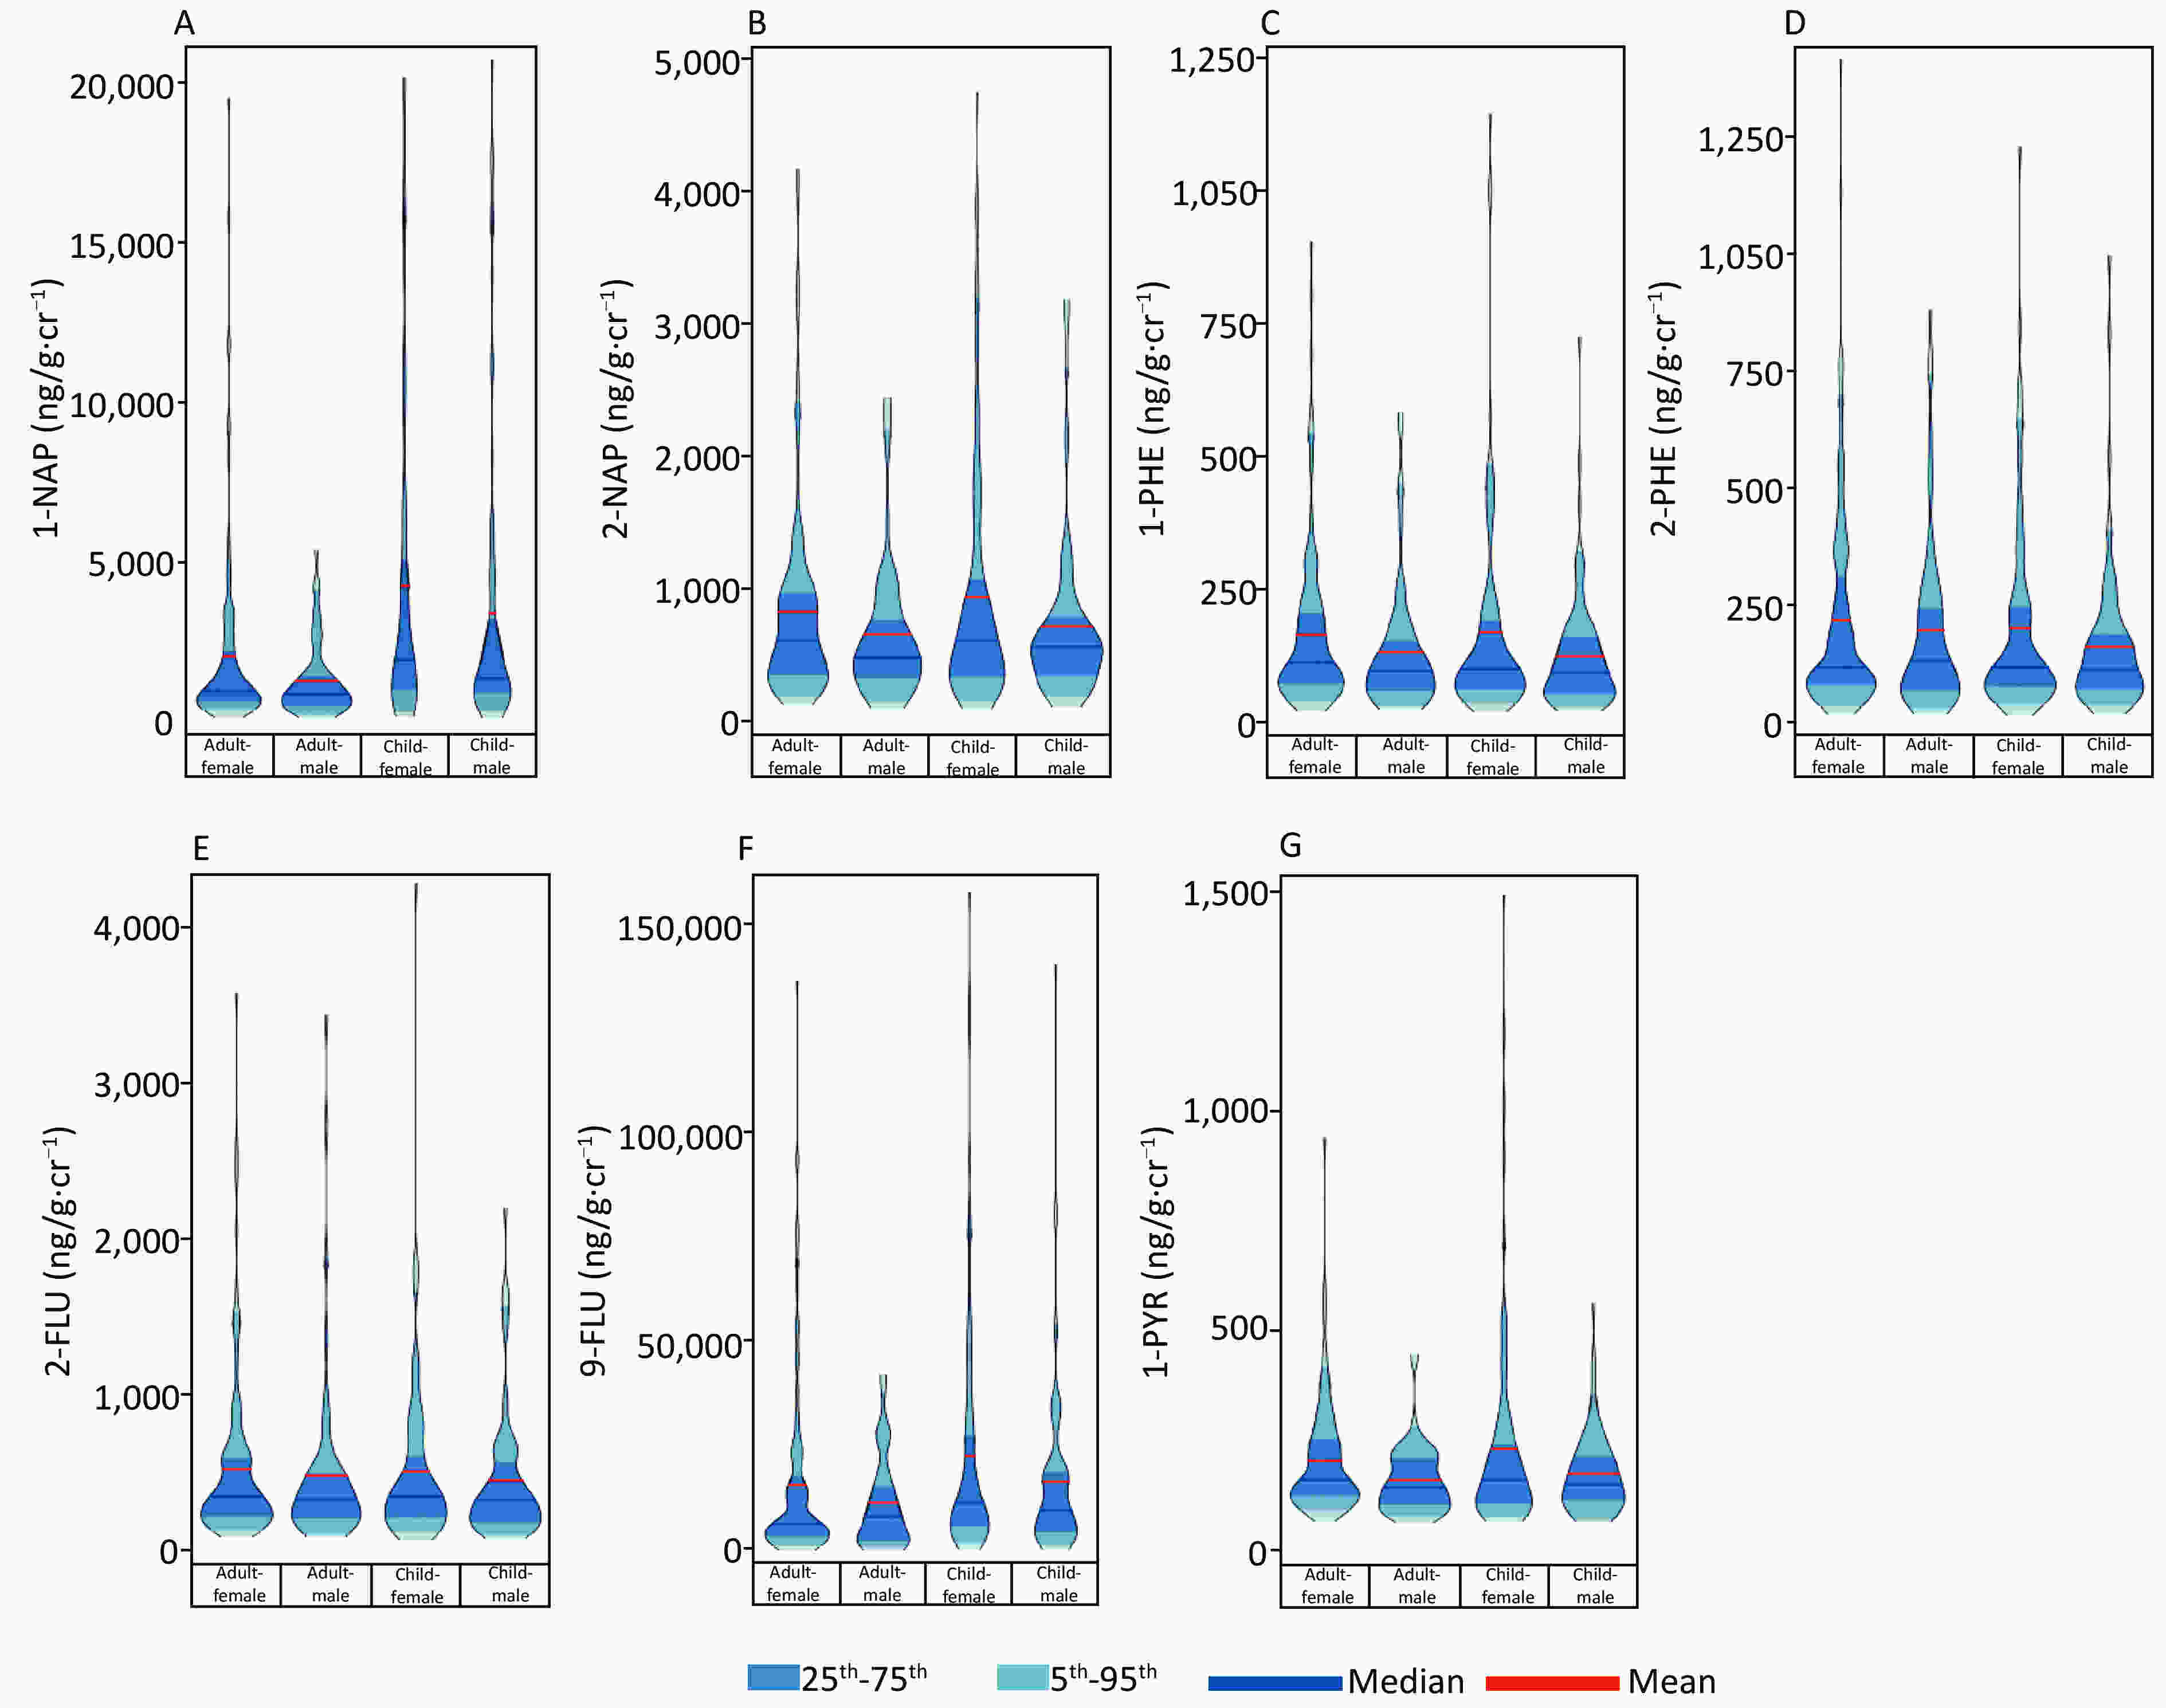
Figure 1. A violin plot showed the distribution of OH-PAHs levels. (A) 1-NAP, (B) 2-NAP, (C) 1-PHE, (D) 2-PHE, (E) 2-FLU, (F) 9-FLU, (G) 1-PYR.
Table S3. Wind direction and frequency in the survey area over the past 30 years
January February March April May June July August September October November December Annual N:9 E:9 N:9 N:8 SW:8 SW:7 N:7 N:8 N:7 N:7 N:10 N:10 N:8 C:29 C:21 C:20 C:24 C:28 C:26 C:32 C:36 C:39 C:38 C:33 C:32 C:30 Note. N: north wind, E: east wind, SW: southwester, C: center no wind. Figure 2 shows the results of routine blood and immunoglobulin examinations. The results of the routine blood examination were divided into three groups: leukocyte group, erythrocyte group, and thrombocyte group. Plateletcrit (PCT, %) and platelet count (PLT, 109/L) were higher in adult females than in adult males (all P < 0.05). Among children, girls had a higher mean corpuscular volume (MCV, fL) than boys (P < 0.05). Eleven of the remaining results were higher in men than in women (all P < 0.05; Figure 2). In addition, there was no sex difference in immunoglobulin results for either adults or children.
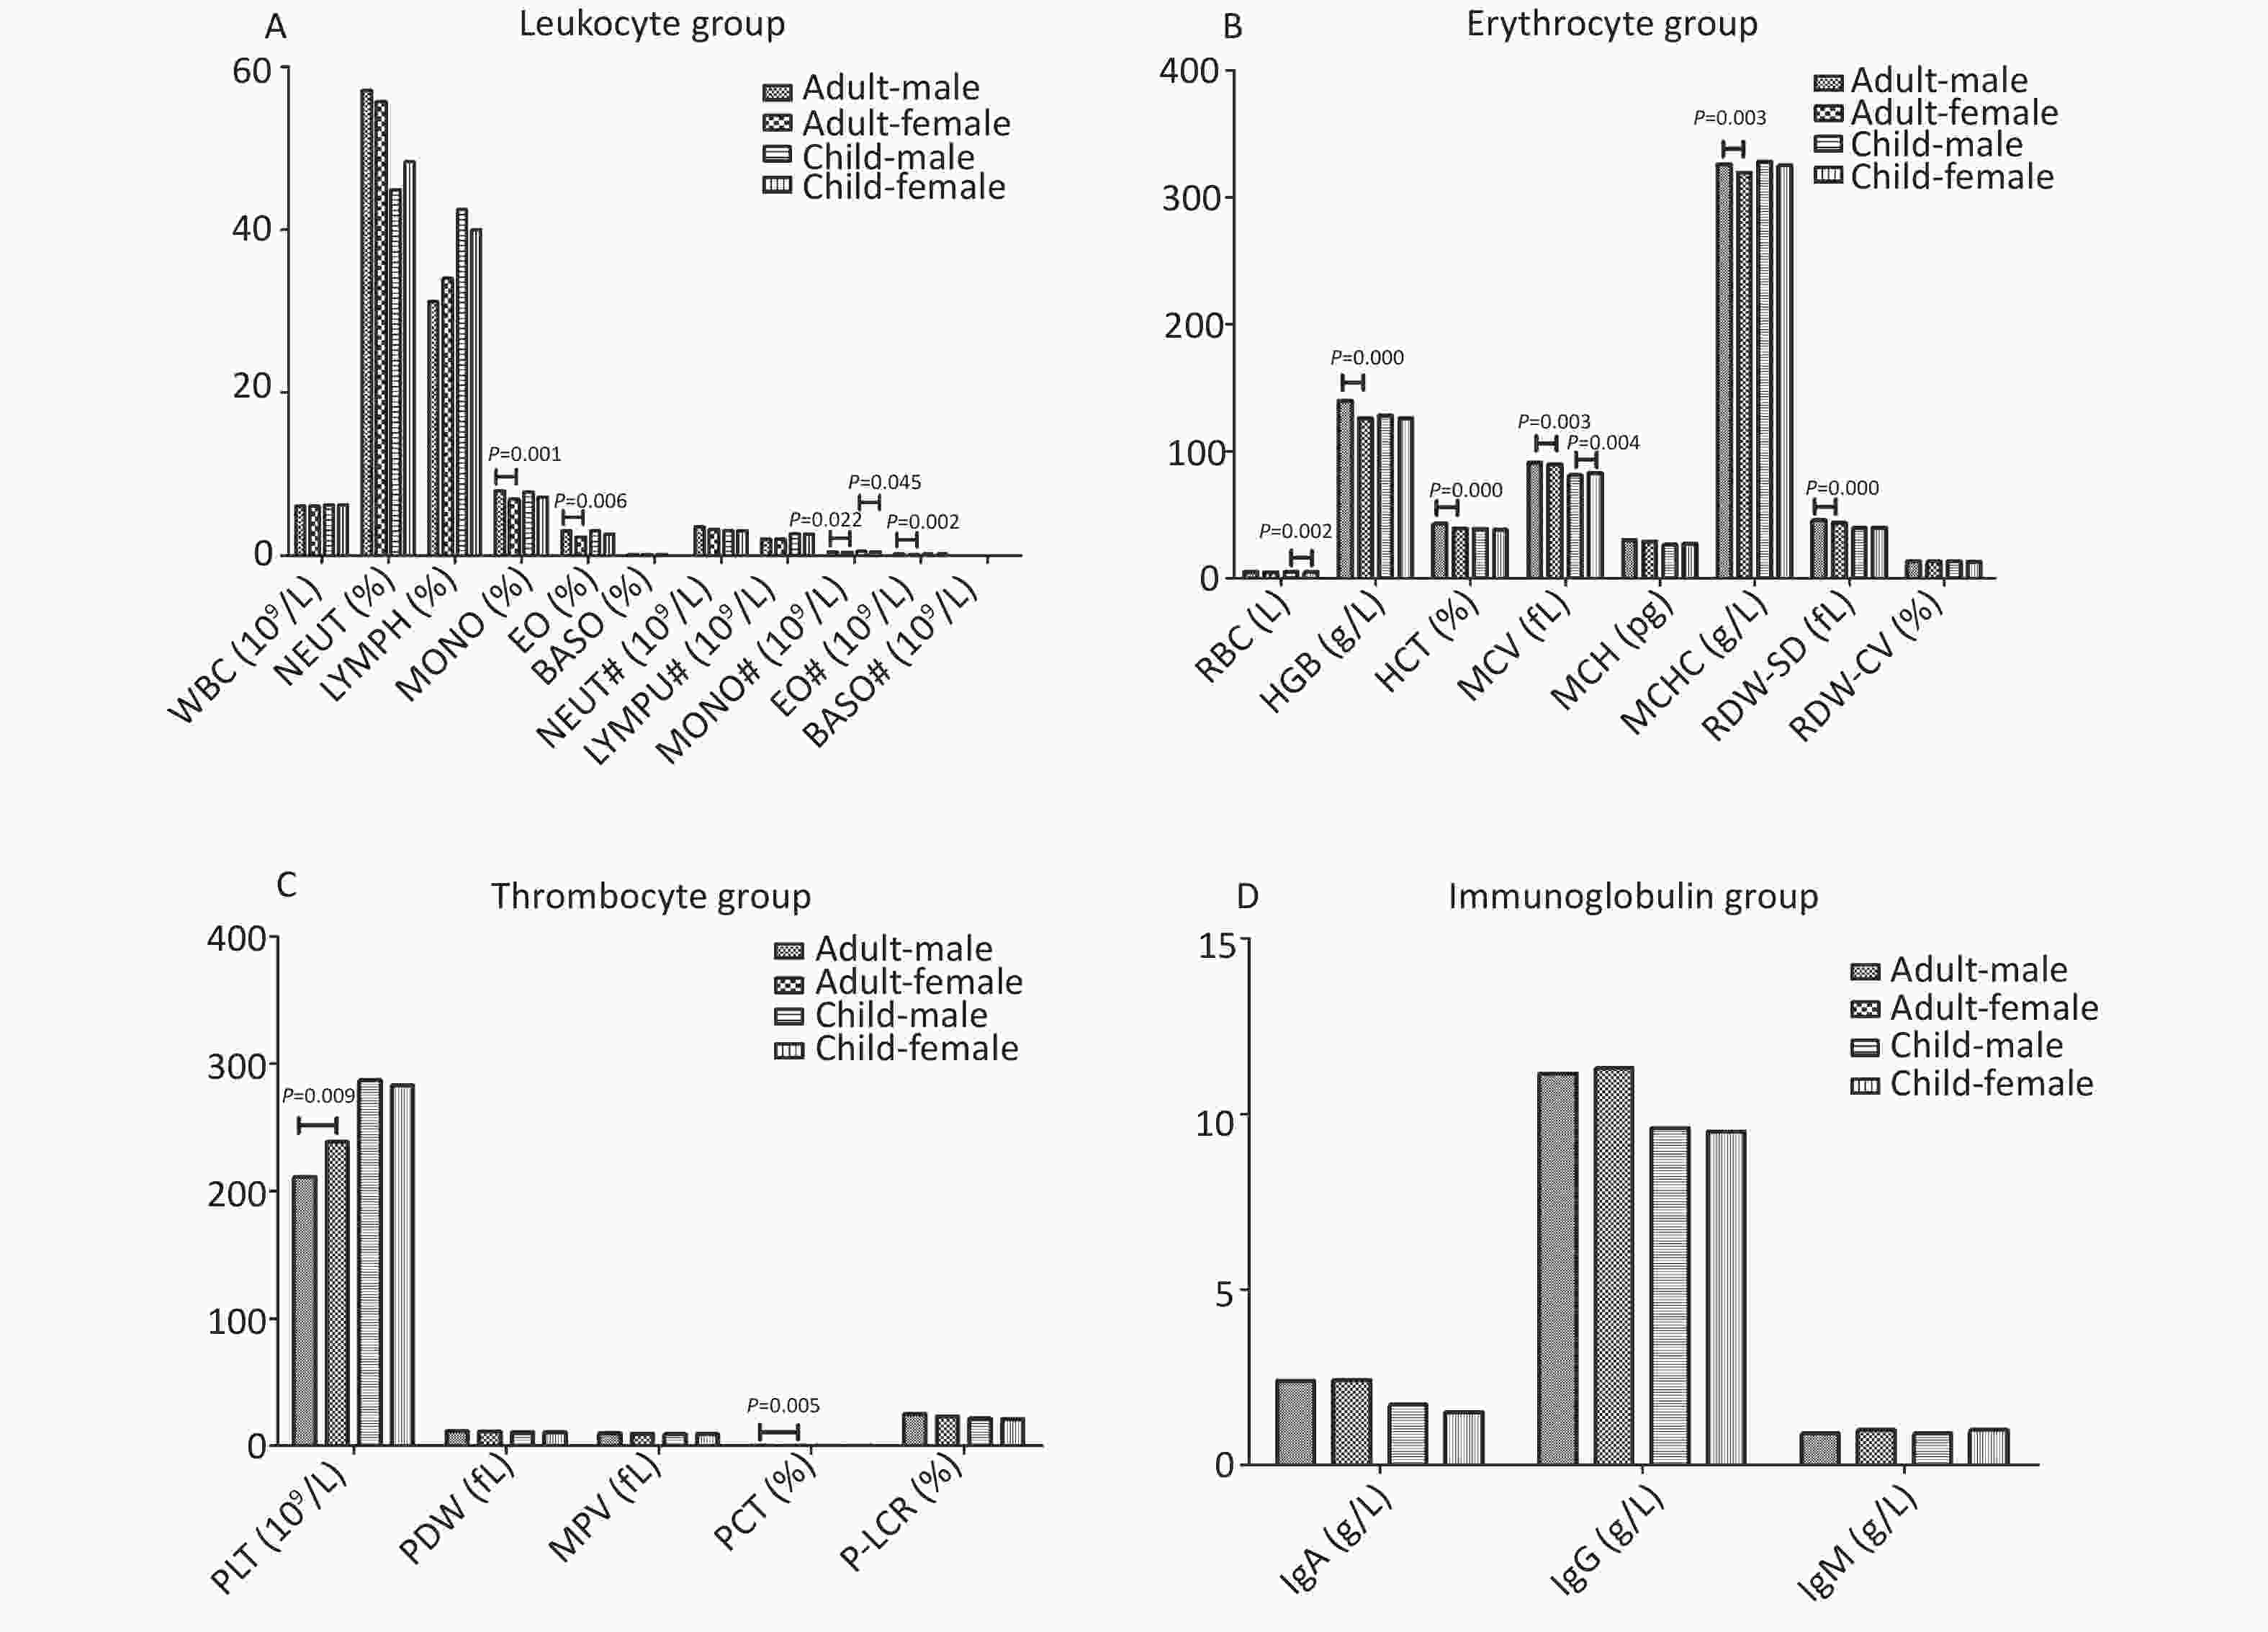
Figure 2. The results of blood routine and immunoglobulin*. (A) Leukocyte group, (B) Erythrocyte group, (C) Thrombocyte group, (D) Immunoglobulin group. The results of each group were expressed in median, and Mann-Whitney U text was used for comparison between the two groups. Immunoglobulin group contains IgA, IgG, IgM. *: Leukocyte group contains the white blood cell (WBC, 109/L), neutrophil (NEUT, %), lymphocyte (LYMPH, %), monocyte (MONO, %), eosinophil (EO, %), basophil (BASO, %), absolute neutrophil (NEUT#, 109/L), absolute lymphocyte (LYMPU#, 109/L), absolute monocyte (MONO#, 109/L), absolute eosinophil (EO#, 10^9/L), absolute basophil (BASO#, 109/L). Erythrocyte group contains red blood cell (RBC, L), hemoglobin (HGB, g/L), hematocrit (HCT, %), mean corpuscular volume (MCV, fL), mean corpuscular hemoglobin (MCH, pg), mean corpuscular hemoglobin concentration (MCHC, g/L), red blood cell distribution width (RDW-SD, fL), coefficient of variation of red blood cell distribution width (RDW-CV, %). Thrombocyte group contains platelet count (PLT, 109/L), platelet distribution width (PDW, fL), mean platelet volume (MPV, fL), plateletcrit (PCT, %), large platelet ratio (P-LCR, %).
In Table 2, PAHs metabolites can be seen to mainly affect the leukocyte group. Among them, 5 are negatively correlated and 2 are positively correlated. Regarding the type of PAHs, naphthalene and pyrene primarily influenced routine blood examination results. In addition, phenanthrene positively correlated with IgA and naphthalene negatively correlated with IgG.
Table 2. Correlation of urinary PAH with adult blood routine and immunoglobulin indexes by linear regression analysis (high exposure vs. low exposure)a
Groups Index Adult OH-PAHs β and 95% CI of unadjusted model β and 95% CI of adjusted modelb Leukocyte group WBC (109/L) 2-NAP 0.154 (−1.142 to −0.02)* −0.201 (−1.478 to −0.024)* NEUT (%) 1-PYR −0.175 (−5.947 to −0.468)* −0.217 (−7.722 to −0.455)* NEUT (%) ∑OH-PAHs 0.155 (0.264 to 5.466)* 0.156 (0.240 to 5.511)* LYMPH (%) 1-PYR 0.192 (0.759 to 5.991)* 0.204 (0.278 to 7.065)* LYMPH (%) ∑OH-PAHs −0.146 (−5.059 to −0.082)* −0.151 (−5.152 to −0.178)* BASO (%) 2-FLU −0.231 (−0.248 to −0.061)** −0.339 (−0.381 to −0.074)** NEUT# (109/L) 2-NAP −0.171 (−0.899 to −0.064)* −0.226 (−1.189 to −0.095)* BASO# (109/L) 2-NAP −0.117 (−0.051 to 0.006) −0.220 (−0.06 to −0.005)* BASO# (109/L) 1-PYR 0.044 (−0.016 to 0.028) 0.194 (0.001 to 0.057)* Immunoglobulin group IgA (g/L) 1-PHE 0.144 (−0.001 to 0.826) 0.340 (0.259 to 1.66)** IgG (g/L) 2-NAP −0.108 (−1.544 to 0.249) −0.224 (−2.543 to −0.179)* Note. a: High exposure was defined as the third tertile of PAHs; low exposure was defined as all others (tertiles 1, 2). b: Adjusted for age, gender, weight, height, smoking, alcohol consumption and PAHs (which means we controlled the other PAHs when assessing the associations between a PAH metabolite and dependent variables). *P < 0.05. **P < 0.01. PAH, polycyclic aromatic hydrocarbons; WBC, white blood cell; NEUT,neutrophil; LYMPH, lymphocyte; BASO, absolute basophil. In Table 3, a total of 26 indicators were shown to have statistically significant correlations. Among them, 21 indicators were negatively correlated and five indicators were positively correlated. According to the type of PAH, the correlation between naphthalene and routine blood results was significant, followed by pyrene and fluorene. In addition, naphthalene was positive correlated with three kinds of immunoglobulin.
Table 3. Correlation of urinary PAH with child blood routine and immunoglobulin indexes by linear regression analysis (high exposure vs. low exposure)a
Groups Index Child OH-PAHs β and 95% CI of unadjusted model β and 95% CI of adjusted modelc Leukocyte group NEUT (%) 1-NAP −0.163 (−7.85 to −0.253)* −0.181 (−8.747 to −0.248)** LYMPH (%) 1-NAP −0.141 (−6.585 to 0.260) −0.178 (−7.701 to −0.204)** MONO (%) 1-NAP −0.189 (−1.573 to −0.170)* −0.315 (−2.193 to −0.716)* MONO (%) 9-FLU 0.142 (−0.027 to 1.334) 0.172 (0.027 to 1.543)** EO (%) 1-NAP −0.226 (−1.46 to −0.291)** −0.224 (−1.527 to −0.215)* BASO (%) 1-NAP −0.239 (−0.284 to −0.065)** −0.192 (−0.259 to −0.022)** BASO (%) 1-PYR 0.145 (−0.003 to 0.212) 0.204 (0.018 to 0.28)** MONO# (109/L) 1-NAP −0.146 (−0.104 to 0.003) −0.242 (−0.14 to −0.028)* MONO# (109/L) 2-NAP 0.232 (0.03 to 0.132)** 0.191 (0.004 to 0.127)** MONO# (109/L) 9-FLU 0.171 (0.008 to 0.111)* 0.190 (0.008 to 0.122)** EO# (109/L) 1-NAP −0.173 (−0.114 to −0.007)* −0.166 (−0.115 to 0.00)** BASO# (109/L) 1-NAP −0.23 (−0.039 to −0.008)** −0.206 (−0.037 to −0.005)** BASO# (109/L) 2-PHE −0.022 (−0.017 to 0.013) −0.231 (−0.045 to −0.001)** BASO# (109/L) 1-PYR 0.198 (0.005 to 0.035)** 0.258 (0.008 to 0.045)* Erythrocyte group RBC (L) 1-NAP −0.211 (−0.667 to −0.110)** −0.256 (−0.783 to −0.162)* HGB (g/L) 1-NAP −0.173 (−16.354 to −1.046)* −0.247 (−20.964 to −3.876)* HCT (%) 1-NAP −0.222 (−5.497 to −1.050)** −0.282 (−6.654 to −1.671)* MCV (FL) 1-NAP −0.245 (−12.323 to −2.958)** −0.301 (−14.642 to −4.154)* MCHC (g/L) 1-NAP −0.200 (−3.624 to −0.498)* −0.268 (−4.521 to −1.017)* MCHC (g/L) 1-NAP −0.200 (−42.902 to −5.916)* −0.256 (−51.854 to −10.648)* RDW-SD (%) 1-NAP −0.262 (−6.588 to −1.807)** −0.305 (−7.524 to −2.243)* RDW-CV 1−NAP −0.218 (−1.786 to −0.326)** −0.261 (−2.072 to −0.455)* Thrombocyte group PDW (fL) 1-NAP −0.240 (−2.047 to −0.473)** −0.269 (−2.300 to −0.513)* MPV (fL) 1-NAP −0.252 (−1.569 to −0.401)** −0.289 (−1.784 to −0.464)* PCT (%) 1-NAP −0.130 (−0.053 to 0.004) −0.18 (−0.066 to −0.002)** P-LCR (%) 1-NAP −0.182 (−5.159 to −0.456)* −0.204 (−5.76 to −0.491)** Immunoglobulin group IgA (g/L) 1-NAP 0.227 (0.165 to 0.818)** 0.277 (0.261 to 0.940)* IgA (g/L) 1-PYR −0.293 (−0.975 to −0.334)** −0.248 (−0.914 to −0.164)* IgG (g/L) 1-NAP 0.337 (1.053 to 2.657)** 0.330 (0.932 to 2.701)* IgG (g/L) ∑OH-PAHs 0.165 (0.096 to 1.178)* 0.159 (0.062 to 1.685)* IgM (g/L) 1-NAP 0.154 (0.004 to 0.819)* 0.198 (0.066 to 0.990)* Note. a: High exposure was defined as the third tertile of PAHs; low exposure was defined as all others (tertiles 1, 2). c: Adjusted for age, gender, weight, height and PAHs (which means we controlled the other PAHs when assessing the associations between a PAH metabolite and dependent variables). *P < 0.05. **P < 0.01. PAH, polycyclic aromatic hydrocarbons. Immunoglobulin group contains IgA, IgG, IgM. *: Leukocyte group contains the white blood cell (WBC, 109/L), neutrophil (NEUT, %), lymphocyte (LYMPH, %), monocyte (MONO, %), eosinophil (EO, %), basophil (BASO, %), absolute neutrophil (NEUT#, 109/L), absolute lymphocyte (LYMPU#, 109/L), absolute monocyte (MONO#, 109/L), absolute eosinophil (EO#, 109/L), absolute basophil (BASO#, 109/L). Erythrocyte group contains red blood cell (RBC, L), hemoglobin (HGB, g/L), hematocrit (HCT, %), mean corpuscular volume (MCV, fL), mean corpuscular hemoglobin (MCH, pg), mean corpuscular hemoglobin concentration (MCHC, g/L), red blood cell distribution width (RDW-SD, fL), coefficient of variation of red blood cell distribution width (RDW-CV, %). Thrombocyte group contains platelet count (PLT, 109/L), platelet distribution width (PDW, fL), mean platelet volume (MPV, fL), plateletcrit (PCT, %), large platelet ratio (P-LCR, %). H, polycyclic aromatic hydrocarbons; WBC, white blood cell; NEUT, neutrophil; LYMPH, lymphocyte; BASO, absolute basophil. A study on non-occupational PAH contact showed that geometric concentrations of 2-NAP and 1-NAP in the urine were much higher than the rest of the eight OH-PAHs examined, followed by 2-FLU[6]. In the OH-PAHs metabolites detected in the urine in this study, the first four positions with geometric concentration ranging from high to low were 9-FLU, 1-NAP, 2-NAP, and 2-FLU, respectively. In this study, 9-FLU had a higher composition ratio, which is consistent with the study of a Chinese scholar[7], but higher than the results reported by Onyemauwa. The reason may be that the detection method used in this study was high-performance liquid chromatography (HPLC); high-pressure liquid chromatography, its combination use, and other detection methods have also been used in some studies. The reagent used is also different, which may lead to inconsistent detection results.
Studies have found that women have higher creatine-adjusted levels of OH-PAH metabolites than men[8]. We found the same results, but the sex difference was not found in children. Meanwhile, the 1-NAP and 9-FLU content in children was higher than that in adults (all P < 0.01). This may be due to the fact that children are still in the growth and development period, and their body functions are not yet mature, and they are less resistant to harmful substances. Moreover, children spend more time outdoors, which leads to constant exposure to polluted soil and air. Therefore, compared with adults, children are particularly vulnerable to environmental hazards[9].
It has also been hypothesized to have an effect on the cardiovascular system. Numerous animal experiments have shown that BaP can induce atherosclerosis[10]. Early epidemiological studies have shown a significant increase in cardiovascular mortality among workers who work in highly polluted environments[11].
As we all know, any abnormal changes in body parts are conveyed by the blood. Therefore, checking the quantity and quality of various cell components in the blood can help judge pathological changes in various tissues and organs in the body[12]. Early detection of changes in human immune function through immunological examination, and timely and targeted measures to prevent the disease are crucial[13]. Among the 369 subjects included in this study, abnormal rates of some routine blood indicators were slightly higher (Supplementary Table S4 available in www.besjournal.com).
Table S4. The overall abnormal rate of blood routine indexes and immunoglobulin indexes
Indexes Normal range Abnormal a Adult Child Total WBC (109/L) 4–10 20 (10.36) 7 (3.98) 27 (7.32) NEUT (%) 45–77 19 (9.84) 36 (20.45) 55 (14.91) LYMPH (%) 20–40 48 (24.87) 47 (26.70) 71 (19.24) MONO (%) 3–8 42 (21.76) 52 (29.55) 94 (25.47) EO (%) 0.5–5.0 21 (10.88) 16 (9.09) 37 (10.03) BASO (%) 0–1 1 (0.52) 1 (0.57) 2 (0.54) NEUT# (109/L) 2.0–7.7 11 (5.70) 8 (4.55) 19 (5.15) LYMPU# (109/L) 0.8–4.0 4 (2.07) 2 (1.14) 6 (1.63) MONO# (109/L) 0.12–0.80 7 (3.63) 4 (2.27) 11 (2.98) EO# (109/L) 0.05–0.50 20 (10.36) 9 (5.11) 29 (7.86) BASO# (109/L) 0–0.1 9 (4.66) 5 (2.84) 14 (3.79) RBC (L) Male: 4.0–5.5 Female: 3.5–5.0 15 (7.58) 13 (7.39) 28 (7.59) HGB (g/L) Male: 120–160 Female: 110–150 20 (10.1) 7 (3.98) 27 (7.32) HCT (%) Male: 40–50 Female: 35–45 26 (13.13) 7 (3.98) 33 (8.94) MCV (FL) 80–100 12 (6.22) 20 (11.36) 32 (8.67) MCH (pg) 26–34 15 (7.77) 49 (27.84) 64 (17.34) MCHC (g/L) 310–354 26 (13.47) 15 (8.52) 41 (11.11) RDW-SD (%) 37–50 14 (7.25) 32 (18.18) 46 (12.47) RDW-CV 11–16 7 (3.63) 0 (0.00) 7 (1.90) PLT (109/L) 125–350 15 (7.77) 30 (17.05) 45 (12.20) PDW (fL) 9–17 9 (4.66) 6 (3.41) 15 (4.07) MPV (fL) 9–13 25 (12.95) 35 (19.89) 60 (16.26) PCT (%) 0.17–0.35 26 (13.47) 17 (9.66) 43 (11.65) P-LCR (%) 13–43 6 (3.11) 5 (2.84) 11 (2.98) IgA (g/L) 0.70–5.0 12 (6.22) 14 (7.95) 26 (7.05) IgG (g/L) 6.05–16.6 6 (3.11) 19 (10.8) 25 (6.78) IgM (g/L) 0.77–2.12 12 (6.22) 4 (2.27) 16 (4.34) Note. a: N (Percent, %). Xu et al.[14] studied the relationship between cardiovascular disease and PAHs in a non-occupational population in the United States and found that the metabolites of phenanthrene and fluorene were closely related to cardiovascular diseases. In this study, fluorene accounted for a higher proportion of all PAHs. In addition, the results of this study also found that in adults, PAHs were more closely related to the leukocyte group. However, in the study of the occupational population, the negative correlation between PAHs and hemoglobin content and red blood cell count has mainly been shown [5, 15]. As we know, red blood cells are mainly responsible for the transportation of oxygen in the body, while white blood cells are part of the body’s defense system. The exposure dose of PAHs in the occupational population is much higher than that in the non-occupational population, while the non-occupational population in the polluted area has characteristics of long-term low-dose exposure, which may affect the human body's defense functions more easily.
In conclusion, long-term exposure to low doses of PAHs in the environment can cause changes in some routine blood indicators, especially in a leukocyte group. Children are more sensitive to PAH pollutants. Although considering the limitations of our results, further studies are needed to determine the causal relationship between long-term low-dose PAH exposure and adverse effects on health.
The authors state that they have no conflicts of interest.
doi: 10.3967/bes2020.040
Effect of PAHs on Routine Blood and Immunoglobulin Indices of Residents Living in Areas Polluted by Coking
-
-
Figure 1. A violin plot showed the distribution of OH-PAHs levels. (A) 1-NAP, (B) 2-NAP, (C) 1-PHE, (D) 2-PHE, (E) 2-FLU, (F) 9-FLU, (G) 1-PYR.
Figure 2. The results of blood routine and immunoglobulin*. (A) Leukocyte group, (B) Erythrocyte group, (C) Thrombocyte group, (D) Immunoglobulin group. The results of each group were expressed in median, and Mann-Whitney U text was used for comparison between the two groups. Immunoglobulin group contains IgA, IgG, IgM. *: Leukocyte group contains the white blood cell (WBC, 109/L), neutrophil (NEUT, %), lymphocyte (LYMPH, %), monocyte (MONO, %), eosinophil (EO, %), basophil (BASO, %), absolute neutrophil (NEUT#, 109/L), absolute lymphocyte (LYMPU#, 109/L), absolute monocyte (MONO#, 109/L), absolute eosinophil (EO#, 10^9/L), absolute basophil (BASO#, 109/L). Erythrocyte group contains red blood cell (RBC, L), hemoglobin (HGB, g/L), hematocrit (HCT, %), mean corpuscular volume (MCV, fL), mean corpuscular hemoglobin (MCH, pg), mean corpuscular hemoglobin concentration (MCHC, g/L), red blood cell distribution width (RDW-SD, fL), coefficient of variation of red blood cell distribution width (RDW-CV, %). Thrombocyte group contains platelet count (PLT, 109/L), platelet distribution width (PDW, fL), mean platelet volume (MPV, fL), plateletcrit (PCT, %), large platelet ratio (P-LCR, %).
S1. Adult: Spearman correlation results among the indicators or characteristics
Gender Age Height Weight BMI Local residence years Education degree Self-reported smoking Alcohol consumption Barbecue food Perm or dye hair 1-NAP 2-NAP 1-PHE 2-PHE 2-FLU 9-FLU 1-PYR Gender 1 −0.195 −0.541 −0.305 0.011 −0.430 0.005 −0.624 −0.380 0.016 0.327 0.100 0.107 0.095 0.022 0.043 0.048 0.168 Age 1 −0.052 −0.017 −0.009 0.697 −0.353 0.224 −0.061 −0.265 −0.191 0.008 0.024 0.145 0.078 0.058 −0.029 0.322 Height 1 0.454 −0.109 0.088 0.086 0.332 0.268 0.129 −0.064 −0.074 −0.072 −0.019 0.031 −0.008 −0.034 −0.115 Weight 1 0.809 0.110 0.028 0.152 0.259 0.066 −0.073 −0.169 −0.163 −0.098 −0.013 −0.064 −0.057 −0.132 BMI 1 0.076 0.003 −0.046 0.090 0.012 −0.037 −0.143 −0.126 −0.105 −0.045 −0.076 −0.033 −0.080 Local residence years 1 −0.226 0.339 0.025 −0.183 −0.208 0.003 0.015 0.101 0.089 0.018 −0.074 0.180 Education degree 1 −0.072 0.084 0.229 0.117 −0.041 0.099 −0.018 0.059 0.018 0.072 −0.158 Self-reported smoking 1 0.318 −0.028 −0.126 −0.056 0.094 −0.049 −0.020 0.010 −0.002 0.027 Alcohol consumption 1 0.045 0.012 −0.128 −0.075 −0.087 −0.043 −0.075 0.012 −0.089 Barbecue food 1 0.035 −0.065 0.001 −0.086 −0.111 −0.069 0.084 −0.203 Perm or dye hair 1 0 0.028 0.089 0.055 0.018 0.015 0.003 1-NAP 1 0.557 0.651 0.560 0.654 0.453 0.507 2-NAP 1 0.607 0.543 0.654 0.470 0.536 1-PHE 1 0.849 0.885 0.462 0.616 2-PHE 1 0.849 0.424 0.511 2-FLU 1 0.442 0.554 9-FLU 1 0.191 1-PYR 1  下载: 导出CSV
Table 1. Basic characteristics of participants
Variablea Male Female Total χ2/Z/t* P Adult Age (years) 18–44 4 (7.27) 30 (21.74) 34 (17.62) 7.295 0.007 45–59 11 (20.00) 42 (30.43) 53 (27.46) ≥ 60 40 (72.73) 66 (47.83) 106 (54.92) Local residence years ≤ 30 2 (3.64) 31 (22.46) 33 (17.10) 35.508 < 0.001 > 30 53 (96.36) 107 (77.54) 160 (82.90) Education degree ≤ Primary school 25 (45.45) 62 (44.93) 87 (45.08) 0.004 0.947 ≥ Middle school 30 (54.55) 76 (55.07) 106 (54.92) Hight (cm) 166.99 ± 8.35 156.66 ± 6.24 159.6 ± 8.32 8.296 < 0.001 Weight (Kg) 71.61 ± 12.07 62.97 ± 10.67 65.43 ± 11.72 4.891 < 0.001 BMI (kg/m2) 18.5–23.9 16 (29.09) 52 (37.68) 68 (35.23) 0.022 0.882 24.0–27.9 28 (50.91) 46 (33.33) 74 (38.34) ≥ 28.0 11 (20.00) 40 (28.99) 51 (26.42) Self-reported smoking Non-smoker 18 (32.73) 128 (92.75) 146 (75.65) 74.686 < 0.001 Former smoker 16 (29.09) 4 (2.90) 20 (10.36) Current smoker 21 (38.18) 6 (4.35) 27 (13.99) Alcohol consumption No 34 (61.82) 128 (92.75) 162 (83.94) 27.77 < 0.001 Yes 21 (38.18) 10 (7.25) 31 (16.06) Barbecue food No 50 (90.91) 124 (89.86) 174 (90.16) 0.049 0.825 Yes 5 (9.09) 14 (10.14) 19 (9.84) Child Age (years) 10.14 ± 2.28 10.61 ± 2.21 10.4 ± 2.25 −1.380 0.169 Local residence years 10.18 ± 2.31 10.69 ± 2.58 10.46 ± 2.47 −1.378 0.170 BMI 16.53 ± 3.82 16.31 ± 3.41 16.41 ± 3.59 0.402 0.688 Height (cm) 135.03 ± 13.58 139.32 ± 13.91 137.39 ± 13.89 −2.06 0.041 Weight (kg) 30.67 ± 10.16 32.27 ± 10.18 31.55 ± 10.17 −1.043 0.299 Note. a: N (Percent, %) or Mean ± SD. BMI: body mass index. Adult: Male (n = 55), Female (n = 138), Total (n = 193). Child: Male (n = 79), Female (n = 97), Total (n = 176). *t for Child.
下载: 导出CSV
S2. Child: Spearman correlation results among the indicators or characteristics
Gender Age Height Weight BMI Local residence years 1-NAP 2-NAP 1-PHE 2-PHE 2-FLU 9-FLU 1-PYR Gender 1 0.111 0.154 0.084 −0.044 0.096 0.111 0.065 0.076 0.055 0.061 0.088 0.060 Age 1 0.795 0.623 0.198 0.935 0.108 −0.089 −0.166 −0.164 −0.155 0.024 −0.208 Height 1 0.795 0.280 0.760 0.055 −0.082 −0.094 −0.079 −0.055 0.023 −0.162 Weight 1 0.775 0.610 0.054 −0.067 −0.044 0.014 −0.010 0.037 −0.112 BMI 1 0.201 −0.007 −0.028 0.033 0.118 0.076 −0.001 −0.018 Local residence years 1 0.157 −0.061 −0.127 −0.128 −0.116 0.070 −0.203 1-NAP 1 0.393 0.285 0.302 0.298 0.514 0.258 2-NAP 1 0.695 0.641 0.684 0.578 0.654 1-PHE 1 0.855 0.860 0.571 0.738 2-PHE 1 0.812 0.535 0.671 2-FLU 1 0.521 0.627 9-FLU 1 0.338 1-PYR 1
下载: 导出CSV
S3. Wind direction and frequency in the survey area over the past 30 years
January February March April May June July August September October November December Annual N:9 E:9 N:9 N:8 SW:8 SW:7 N:7 N:8 N:7 N:7 N:10 N:10 N:8 C:29 C:21 C:20 C:24 C:28 C:26 C:32 C:36 C:39 C:38 C:33 C:32 C:30 Note. N: north wind, E: east wind, SW: southwester, C: center no wind.
下载: 导出CSV
Table 2. Correlation of urinary PAH with adult blood routine and immunoglobulin indexes by linear regression analysis (high exposure vs. low exposure)a
Groups Index Adult OH-PAHs β and 95% CI of unadjusted model β and 95% CI of adjusted modelb Leukocyte group WBC (109/L) 2-NAP 0.154 (−1.142 to −0.02)* −0.201 (−1.478 to −0.024)* NEUT (%) 1-PYR −0.175 (−5.947 to −0.468)* −0.217 (−7.722 to −0.455)* NEUT (%) ∑OH-PAHs 0.155 (0.264 to 5.466)* 0.156 (0.240 to 5.511)* LYMPH (%) 1-PYR 0.192 (0.759 to 5.991)* 0.204 (0.278 to 7.065)* LYMPH (%) ∑OH-PAHs −0.146 (−5.059 to −0.082)* −0.151 (−5.152 to −0.178)* BASO (%) 2-FLU −0.231 (−0.248 to −0.061)** −0.339 (−0.381 to −0.074)** NEUT# (109/L) 2-NAP −0.171 (−0.899 to −0.064)* −0.226 (−1.189 to −0.095)* BASO# (109/L) 2-NAP −0.117 (−0.051 to 0.006) −0.220 (−0.06 to −0.005)* BASO# (109/L) 1-PYR 0.044 (−0.016 to 0.028) 0.194 (0.001 to 0.057)* Immunoglobulin group IgA (g/L) 1-PHE 0.144 (−0.001 to 0.826) 0.340 (0.259 to 1.66)** IgG (g/L) 2-NAP −0.108 (−1.544 to 0.249) −0.224 (−2.543 to −0.179)* Note. a: High exposure was defined as the third tertile of PAHs; low exposure was defined as all others (tertiles 1, 2). b: Adjusted for age, gender, weight, height, smoking, alcohol consumption and PAHs (which means we controlled the other PAHs when assessing the associations between a PAH metabolite and dependent variables). *P < 0.05. **P < 0.01. PAH, polycyclic aromatic hydrocarbons; WBC, white blood cell; NEUT,neutrophil; LYMPH, lymphocyte; BASO, absolute basophil.
下载: 导出CSV
Table 3. Correlation of urinary PAH with child blood routine and immunoglobulin indexes by linear regression analysis (high exposure vs. low exposure)a
Groups Index Child OH-PAHs β and 95% CI of unadjusted model β and 95% CI of adjusted modelc Leukocyte group NEUT (%) 1-NAP −0.163 (−7.85 to −0.253)* −0.181 (−8.747 to −0.248)** LYMPH (%) 1-NAP −0.141 (−6.585 to 0.260) −0.178 (−7.701 to −0.204)** MONO (%) 1-NAP −0.189 (−1.573 to −0.170)* −0.315 (−2.193 to −0.716)* MONO (%) 9-FLU 0.142 (−0.027 to 1.334) 0.172 (0.027 to 1.543)** EO (%) 1-NAP −0.226 (−1.46 to −0.291)** −0.224 (−1.527 to −0.215)* BASO (%) 1-NAP −0.239 (−0.284 to −0.065)** −0.192 (−0.259 to −0.022)** BASO (%) 1-PYR 0.145 (−0.003 to 0.212) 0.204 (0.018 to 0.28)** MONO# (109/L) 1-NAP −0.146 (−0.104 to 0.003) −0.242 (−0.14 to −0.028)* MONO# (109/L) 2-NAP 0.232 (0.03 to 0.132)** 0.191 (0.004 to 0.127)** MONO# (109/L) 9-FLU 0.171 (0.008 to 0.111)* 0.190 (0.008 to 0.122)** EO# (109/L) 1-NAP −0.173 (−0.114 to −0.007)* −0.166 (−0.115 to 0.00)** BASO# (109/L) 1-NAP −0.23 (−0.039 to −0.008)** −0.206 (−0.037 to −0.005)** BASO# (109/L) 2-PHE −0.022 (−0.017 to 0.013) −0.231 (−0.045 to −0.001)** BASO# (109/L) 1-PYR 0.198 (0.005 to 0.035)** 0.258 (0.008 to 0.045)* Erythrocyte group RBC (L) 1-NAP −0.211 (−0.667 to −0.110)** −0.256 (−0.783 to −0.162)* HGB (g/L) 1-NAP −0.173 (−16.354 to −1.046)* −0.247 (−20.964 to −3.876)* HCT (%) 1-NAP −0.222 (−5.497 to −1.050)** −0.282 (−6.654 to −1.671)* MCV (FL) 1-NAP −0.245 (−12.323 to −2.958)** −0.301 (−14.642 to −4.154)* MCHC (g/L) 1-NAP −0.200 (−3.624 to −0.498)* −0.268 (−4.521 to −1.017)* MCHC (g/L) 1-NAP −0.200 (−42.902 to −5.916)* −0.256 (−51.854 to −10.648)* RDW-SD (%) 1-NAP −0.262 (−6.588 to −1.807)** −0.305 (−7.524 to −2.243)* RDW-CV 1−NAP −0.218 (−1.786 to −0.326)** −0.261 (−2.072 to −0.455)* Thrombocyte group PDW (fL) 1-NAP −0.240 (−2.047 to −0.473)** −0.269 (−2.300 to −0.513)* MPV (fL) 1-NAP −0.252 (−1.569 to −0.401)** −0.289 (−1.784 to −0.464)* PCT (%) 1-NAP −0.130 (−0.053 to 0.004) −0.18 (−0.066 to −0.002)** P-LCR (%) 1-NAP −0.182 (−5.159 to −0.456)* −0.204 (−5.76 to −0.491)** Immunoglobulin group IgA (g/L) 1-NAP 0.227 (0.165 to 0.818)** 0.277 (0.261 to 0.940)* IgA (g/L) 1-PYR −0.293 (−0.975 to −0.334)** −0.248 (−0.914 to −0.164)* IgG (g/L) 1-NAP 0.337 (1.053 to 2.657)** 0.330 (0.932 to 2.701)* IgG (g/L) ∑OH-PAHs 0.165 (0.096 to 1.178)* 0.159 (0.062 to 1.685)* IgM (g/L) 1-NAP 0.154 (0.004 to 0.819)* 0.198 (0.066 to 0.990)* Note. a: High exposure was defined as the third tertile of PAHs; low exposure was defined as all others (tertiles 1, 2). c: Adjusted for age, gender, weight, height and PAHs (which means we controlled the other PAHs when assessing the associations between a PAH metabolite and dependent variables). *P < 0.05. **P < 0.01. PAH, polycyclic aromatic hydrocarbons. Immunoglobulin group contains IgA, IgG, IgM. *: Leukocyte group contains the white blood cell (WBC, 109/L), neutrophil (NEUT, %), lymphocyte (LYMPH, %), monocyte (MONO, %), eosinophil (EO, %), basophil (BASO, %), absolute neutrophil (NEUT#, 109/L), absolute lymphocyte (LYMPU#, 109/L), absolute monocyte (MONO#, 109/L), absolute eosinophil (EO#, 109/L), absolute basophil (BASO#, 109/L). Erythrocyte group contains red blood cell (RBC, L), hemoglobin (HGB, g/L), hematocrit (HCT, %), mean corpuscular volume (MCV, fL), mean corpuscular hemoglobin (MCH, pg), mean corpuscular hemoglobin concentration (MCHC, g/L), red blood cell distribution width (RDW-SD, fL), coefficient of variation of red blood cell distribution width (RDW-CV, %). Thrombocyte group contains platelet count (PLT, 109/L), platelet distribution width (PDW, fL), mean platelet volume (MPV, fL), plateletcrit (PCT, %), large platelet ratio (P-LCR, %). H, polycyclic aromatic hydrocarbons; WBC, white blood cell; NEUT, neutrophil; LYMPH, lymphocyte; BASO, absolute basophil.
下载: 导出CSV
S4. The overall abnormal rate of blood routine indexes and immunoglobulin indexes
Indexes Normal range Abnormal a Adult Child Total WBC (109/L) 4–10 20 (10.36) 7 (3.98) 27 (7.32) NEUT (%) 45–77 19 (9.84) 36 (20.45) 55 (14.91) LYMPH (%) 20–40 48 (24.87) 47 (26.70) 71 (19.24) MONO (%) 3–8 42 (21.76) 52 (29.55) 94 (25.47) EO (%) 0.5–5.0 21 (10.88) 16 (9.09) 37 (10.03) BASO (%) 0–1 1 (0.52) 1 (0.57) 2 (0.54) NEUT# (109/L) 2.0–7.7 11 (5.70) 8 (4.55) 19 (5.15) LYMPU# (109/L) 0.8–4.0 4 (2.07) 2 (1.14) 6 (1.63) MONO# (109/L) 0.12–0.80 7 (3.63) 4 (2.27) 11 (2.98) EO# (109/L) 0.05–0.50 20 (10.36) 9 (5.11) 29 (7.86) BASO# (109/L) 0–0.1 9 (4.66) 5 (2.84) 14 (3.79) RBC (L) Male: 4.0–5.5 Female: 3.5–5.0 15 (7.58) 13 (7.39) 28 (7.59) HGB (g/L) Male: 120–160 Female: 110–150 20 (10.1) 7 (3.98) 27 (7.32) HCT (%) Male: 40–50 Female: 35–45 26 (13.13) 7 (3.98) 33 (8.94) MCV (FL) 80–100 12 (6.22) 20 (11.36) 32 (8.67) MCH (pg) 26–34 15 (7.77) 49 (27.84) 64 (17.34) MCHC (g/L) 310–354 26 (13.47) 15 (8.52) 41 (11.11) RDW-SD (%) 37–50 14 (7.25) 32 (18.18) 46 (12.47) RDW-CV 11–16 7 (3.63) 0 (0.00) 7 (1.90) PLT (109/L) 125–350 15 (7.77) 30 (17.05) 45 (12.20) PDW (fL) 9–17 9 (4.66) 6 (3.41) 15 (4.07) MPV (fL) 9–13 25 (12.95) 35 (19.89) 60 (16.26) PCT (%) 0.17–0.35 26 (13.47) 17 (9.66) 43 (11.65) P-LCR (%) 13–43 6 (3.11) 5 (2.84) 11 (2.98) IgA (g/L) 0.70–5.0 12 (6.22) 14 (7.95) 26 (7.05) IgG (g/L) 6.05–16.6 6 (3.11) 19 (10.8) 25 (6.78) IgM (g/L) 0.77–2.12 12 (6.22) 4 (2.27) 16 (4.34) Note. a: N (Percent, %).
下载: 导出CSV
-
[1] Van Rooij JG, Bodelier-Bade MM, Jongeneelen FG. Estimation of individual dermal and respiratory uptake of polycyclic aromatic hydrocarbons in 12 coke oven workers. Br J Ind Med, 1993; 50, 623−32. [2] Qin XL, Zhang LW, Chen X, et al. Progress on analytical methods for hydroxyl metabolites of polycyclic aromatic hydrocarbons in urine. Chin J Industrial Med, 2010; 23, 429−33. (In Chinese) [3] Armstrong BG, Gibbs G. Exposure-response relationship between lung cancer and polycyclic aromatic hydrocarbons (PAHs). Occup Environ Med, 2009; 66, 740−6. doi: 10.1136/oem.2008.043711 [4] Lei LX. Investigation and study on peripheral blood image of different kinds of workers in coking plant. Shanxi Medical Journal, 2005; 34, 652−4. (In Chinese) [5] Li X, Zheng DX, Gao C, et al. Exposure to polycyclic aromatic hydrocarbons and benzene affects peripheral blood and lymphocyte DNA in coke oven workers. Chin Occup Med, 2015; 42, 607−14. [6] Onyemauwa F, Rappaport SM, Sobus JR, et al. Using liquid chromatography-tandem mass spectrometry to quantify monohydroxylated metabolites of polycyclic aromatic hydrocarbons in urine. J Chromatogr B Analyt Technol Biomed Life Sci, 2009; 877, 1117−25. doi: 10.1016/j.jchromb.2009.02.067 [7] Bao ZJ. Factors affecting urinary polycyclic aromatic hydrocarbons metabolites in an urban adult population in Wuhan. Huazhong University of Science and Technology: China, Wuhan. 2013. [8] Chen B, Hu Y, Jin T, et al. Higher urinary 1-hydroxypyrene concentration is associated with cooking practice in a Chinese population. Toxicol Lett, 2007; 171, 119−25. doi: 10.1016/j.toxlet.2007.05.002 [9] Leith Sly J, DO Carpenter. Special vulnerability of children to environmental exposures. Rev Environ Health, 2012; 27, 151−7. [10] Curfs DM, Lutgens E, Gijbels MJ, et al. Chronic exposure to the carcinogenic compound benzo. Am J Pathol, 2004; 164, 101−8. doi: 10.1016/S0002-9440(10)63101-X [11] Forbes LJ, Patel MD, Rudnicka AR, et al. Chronic exposure to outdoor air pollution and diagnosed cardiovascular disease: meta-analysis of three large cross-sectional surveys. Environ Health, 2009; 8, 1−9. doi: 10.1186/1476-069X-8-1 [12] Hu YQ, Zhao HF. Principle hematology. China,Shanghai: Shanghai Jiao Tong University Press. 2012. [13] Mujika I, Padilla S, Pyne D, et al. Physiological changes associated with the pre-event taper in athletes. Sports Med, 2004; 34, 891−927. doi: 10.2165/00007256-200434130-00003 [14] Xu X, Hu H, Kearney GD, et al. Studying the effects of polycyclic aromatic hydrocarbons on peripheral arterial disease in the United States. Sci Total Environ, 2013; 461-462, 341−7. doi: 10.1016/j.scitotenv.2013.04.089 [15] Yardley-Jones A, Anderson D, Parke DV. The toxicity of beneze and its metabolism and molecular pathology in human risk assessment. Br J Ind Med, 1991; 48, 437−44. -

 点击查看大图
计量
- 文章访问数: 1060
- HTML全文浏览量: 323
- PDF下载量: 47
- 被引次数: 0

 Quick Links