

 下载:
下载:


-
According to the Global Burden of Diseases 2019 study, stroke has been a leading cause of disability-adjusted life-years (DALYs) lost among the elderly worldwide [1]. Approximately 80% of strokes are ischemic strokes (IS), constituting a major burden on the public health system [2]. In the past 30 years, the crude mortality rate of stroke in China has been rising rapidly, and the age-standardized incidence rate of IS increased by 34.7% [3]. IS is a multifactorial and complex syndrome triggered by a cerebral embolism resulting from the interaction of environmental and genetic factors [4].
N-glycosylation is a ubiquitous and complexly regulated posttranslational protein modification, with N-glycans covalently linked to asparagine residues in target proteins [5, 6]. N-glycosylation participates in many key biological processes, ranging from protein folding, molecular trafficking and clearance, and cell adhesion to immune regulation [7-9]. Immunoglobulin G (IgG) is one of the most suitable candidates for glycomic research due to its unique structure with conserved N-glycosylation in the Fc domain of IgG [10]. Alterations of N-glycosylation in the Fc domain can affect the structure and function of IgG, which may regulate inflammation and trigger several inflammatory diseases [6, 11, 12]. In addition, N-glycosylation is remarkably stable in healthy individuals and can be modified under specific pathophysiological conditions [13, 14].
Several studies have reported that IgG N-glycan profiles are associated with IS [15] and its risk factors, such as obesity [16, 17], hypertension [18, 19], type 2 diabetes [20], dyslipidemia [21], and inflammation-related diseases [14, 22, 23]. We recently reported proinflammatory alterations in IgG N-glycan profiles, including decreased sialylation and galactosylation, and increased levels of bisecting N-acetylglucosamine (GlcNAc) are linked to IS. They might be involved in the molecular mechanism of inflammation. However, most previous studies on N-glycans were case-control studies, and thus, the observed altered IgG N-glycosylation may be a consequence rather than a cause of IS. There is no prospective study linking IgG N-glycan profiles to IS.
In this study, we hypothesized that IgG N-glycan profiles are prospectively associated with IS and may serve as potential candidate biomarkers for incident IS. We examined the associations of IgG N-glycan profiles and IS using a nested case-control study in a prospective cohort. Previous studies have suggested sex-specific differences in IgG N-glycan traits [24, 25], and sex hormones can modulate human IgG N-glycosylation [26]. Given the sex-specific differences in IgG N-glycosylation, we analyzed its stratification in men and women.
-
We conducted a nested case-control study in the China suboptimal health cohort study (COACS), an ongoing longitudinal study starting in 2013 [27]. A detailed description of the COACS cohort has been published elsewhere [27]. In total, 4,313 participants from Tangshan city in northern China completed baseline questionnaires and physical examinations and provided peripheral venous blood samples. IS is a sudden onset focal neurological deficit caused by damage to an area in the central nervous system resulting from decreased or completely blocked blood flow. IS was diagnosed according to the International Classification of Disease (ICD-10) based on clinical symptoms, physical examinations, and evidence from brain X-ray computed tomography (CT) or magnetic resonance imaging (MRI) [28]. By the end of December 13, 2018, we identified 99 new incident IS cases in follow-up investigations. Controls were randomly selected from participants who were free of IS before or at the index date using risk-set sampling and were matched by age and sex with cases. Thus, the present study included 99 incident IS cases and 99 controls.
All voluntary participants provided written informed consent before participating in this study. The study was approved by the Ethics Committee of Capital Medical University, China, and abided by the principles of the Declaration of Helsinki.
-
After overnight fasting, venipuncture collected blood samples (5 mL) in the morning. Then, whole blood was centrifuged at 3,000 rpm for 10 min, and plasma was separated to detect IgG N-glycan profiles. Blood samples were stored at 4 °C and processed within 8 h. The separated plasma samples were stored at –80 °C until laboratory measurements.
During the baseline survey, trained interviewers collected information about the demographics (age, sex, ethnicity, and levels of education) and clinical history of all participants. Specialized nurses performed physical examinations to obtain information on height, weight, waist and hip circumference, and blood pressure. Blood lipids [total cholesterol (TC), total triglyceride (TG), high-density lipoprotein (HDL), low-density lipoprotein (LDL)], and glucose [fasting blood glucose (FBG) concentrations] were measured immediately at a certified laboratory. Body mass index (BMI) was calculated by dividing weight in kilograms by height in meters squared. Obesity was defined as BMI > 28.0 kg/m[29]. Hypertension was defined as mean systolic blood pressure (SBP) ≥ 140 mmHg or mean diastolic blood pressure (DBP) ≥ 90 mmHg [30]. The participants were classified as having dyslipidemia with TC ≥ 6.2 mmol/L, TGs ≥ 2.3 mmol/L, HDL < 1.0 mmol/L, and LDL ≥ 4.1 mmol/L, according to the Guidelines for the Prevention and Treatment of Dyslipidemia of adults in China [31]. The participants were diagnosed with T2D by physicians according to the 1999 WHO Criteria (FBG ≥ 7.0 mmol/L) [32].
-
IgG N-glycan traits were separated into 24 glycan peaks (GP1–GP24) by Ultra-Performance Liquid Chromatography (UPLC, Water, USA) in our laboratory, according to standard operating procedures described in our previous publications [16, 21, 33, 34]. First, 50 μL of plasma was diluted 10× with binding buffer (1× phosphate-buffered saline, pH = 7.4) and applied to washed and equilibrated 96-well protein G plates (Water, USA), followed by the immediate washing of protein G plates. Then, 0.1 mol/L formic acid (Sigma Aldrich, USA) and 1 mol/L ammonium bicarbonate (BBI Life Science, China) were used to elute and neutralize IgG, respectively. Samples of IgG were denatured with sodium dodecyl sulfate (SDS, Sigma Aldrich, USA) at 65 °C for 10 minutes. IgG N-glycans were then released with N-glycosidase F (Roche, Germany) and incubated overnight at 37 °C. Next, IgG N-glycans were labeled with mixtures of 2-aminobenzamide (Sigma Aldrich, USA), dimethylsulfoxide (Sigma Aldrich, USA), glacial acetic acid (Merck, Germany), and 2-picoline borane (Sigma Aldrich, USA) to make them visible by UPLC. Finally, 24 GPs were separated from IgG N-glycans by hydrophilic interaction chromatography-UPLC on a Waters BEH Glycan chromatography column. The glycan structures corresponding to each glycan peak are described in Supplementary Table S1 (available in www.besjournal.com) [35, 36]. Each batch (96-well plates) included standard samples and blanks for quality control.
Table S1. Description of structures for UPLC results of IgG glycan peaks
Glycan peak Structures of
glycan peakGraphic peak
compositionGlycan peak Structures of
glycan peakGraphic peak
compositionGP1 FA1 
GP13 A2BG2 
GP2 A2 
GP14 FA2G2 
GP3 A2B 
GP15 FA2BG2 
GP4 FA2 
GP16 FA2G1S1 
GP5 M5 
GP17 A2G2S1 
GP6 FA2B 
GP18 FA2G2S1 
GP7 A2G1 
GP19 FA2BG2S1 
GP8 FA2[6]G1 
GP20 FA2FG2S1 
GP9 FA2[3]G1 
GP21 A2G2S2 
GP10 FA2[6]BG1 
GP22 A2BG2S2 
GP11 FA2[3]BG1 
GP23 FA2G2S2 
GP12 A2G2 
GP24 FA2BG2S2 
Note. UPLC, ultra-performance liquid chromatography; IgG, immunoglobulin G; GP, glycan peaks; F, represents a fucose attached to core N-acetylglucosamine; M, represents mannoses attached to core N-acetylglucosamine; A, represents N-acetylglucosamine attached to core triple mannose; B, represents bisected N-acetylglucosamine linked to core triple mannose; G, represents galactose; [3]G1 and [6]G1 represent galactose attached to α1–3 and α1–6 mannose respectively; S represents N-acetylneuraminic acid attached to galactose; blue square represents N-acetylglucosamine; red triangle represents fucose; green circle represents mannose; yellow circle represents galactose; purple square represents N-acetylneuraminic acid. All chromatograms were divided similarly into 24 peaks, and the number of glycans in each peak was expressed as a percentage of the total integrated area. In addition, 54 derived glycan traits (DGs) were calculated from 24 directly measured glycan peaks to describe the relative abundances of galactosylation, sialylation, GlcNAc, and core fucosylation [37]. Detailed information on the derived glycan traits is presented in Supplementary Table S2 (available in www.besjournal.com). Normalization of UPLC data was performed as described previously [35].
Table S2. Description of structures and calculation formula of derived glycan traits
Derived glycan traits Structures of derived glycan traits Calculation formula FGS / (FG + FGS) Sialylation of fucosylated galactosylated structures without bisecting GlcNAc SUM (GP16 + GP18 + GP23) / SUM (GP16 + GP18 + GP23 + GP8 + GP9 + GP14) × 100 FBGS / (FBG + FBGS) Sialylation of fucosylated galactosylated structures with bisecting GlcNAc SUM (GP19 + GP24) / SUM (GP19 + GP24 + GP10 + GP11 + GP15) × 100 FGS / (F + FG + FGS) Sialylation of all fucosylated structures without bisecting GlcNAc SUM (GP16 + GP18 + GP23) / SUM (GP16 + GP18 + GP23 + GP4 + GP8 + GP9 + GP14) × 100 FBGS / (FB + FBG + FBGS) Sialylation of all fucosylated structures with bisecting GlcNAc SUM (GP19 + GP24) / SUM (GP19 + GP24 + GP6 + GP10 + GP11 + GP15) × 100 FG1S1 / (FG1 + FG1S1) Monosialylation of fucosylated monogalactosylated structures GP16 / SUM (GP16 + GP8 + GP9) × 100 FG2S1 / (FG2 + FG2S1 + FG2S2) Monosialylation of fucosylated digalactosylated structures GP18 / SUM (GP18 + GP14 + GP23) × 100 FG2S2 / (FG2 + FG2S1 + FG2S2) Disialylation of fucosylated digalactosylated structures GP23 / SUM (GP23 + GP14 + GP18) × 100 FBG2S1 / (FBG2 + FBG2S1 + FBG2S2) Monosialylation of fucosylated digalactosylated structures with bisecting GlcNAc GP19 / SUM (GP19 + GP15 + GP24) × 100 FBG2S2 / (FBG2 + FBG2S1 + FBG2S2) Disialylation of fucosylated digalactosylated structures with bisecting GlcNAc GP24 / SUM (GP24 + GP15 + GP19) × 100 FtotalS1 / FtotalS2 Ratio of all fucosylated monosialylated and disialylated structures SUM (GP16 + GP18 + GP19) / SUM (GP23 + GP24) FS1 / FS2 Ratio of fucosylated (without bisecting GlcNAc) monosialylated and disialylated structures SUM (GP16 + GP18) / GP23 FBS1 / FBS2 Ratio of fucosylated (with bisecting GlcNAc) monosialylated and disialylated structures GP19 / GP24 FBStotal / FStotal Ratio of all fucosylated sialylated structures with and without bisecting GlcNAc SUM (GP19 + GP24) / SUM (GP16 + GP18 + GP23) FBS1 / FS1 Fucosylated monosialylated structures with and without bisecting GlcNAc GP19 / SUM (GP16 + GP18) FBS1 / (FS1 + FBS1) Bisecting GlcNAc in all fucosylated monosialylated structures GP19 / SUM (GP16 + GP18 + GP19) FBS2 / FS2 Ratio of fucosylated disialylated structures with and without bisecting GlcNAc GP24 / GP23 FBS2 / (FS2 + FBS2) Bisecting GlcNAc in all fucosylated disialylated structures GP24 / SUM (GP23 + GP24) GP1n GP1 in total neutral glycan fraction GP1 / GPn × 100 GP2n GP2 in total neutral glycan fraction GP2 / GPn × 100 GP4n GP4 in total neutral glycan fraction GP4 / GPn × 100 GP5n GP5 in total neutral glycan fraction GP5 / GPn × 100 GP6n GP6 in total neutral glycan fraction GP6 / GPn × 100 GP7n GP7 in total neutral glycan fraction GP7 / GPn × 100 GP8n GP8 in total neutral glycan fraction GP8 / GPn × 100 GP9n GP9 in total neutral glycan fraction GP9 / GPn × 100 GP10n GP10 in total neutral glycan fraction GP10 / GPn × 100 GP11n GP11 in total neutral glycan fraction GP11 / GPn × 100 GP12n GP12 in total neutral glycan fraction GP12 / GPn × 100 GP13n GP13 in total neutral glycan fraction GP13 / GPn × 100 GP14n GP14 in total neutral glycan fraction GP14 / GPn × 100 GP15n GP15 in total neutral glycan fraction GP15 / GPn × 100 G0n G0 in total neutral glycan fraction SUM (GP1n: GP4n + GP6n) G1n G1 in total neutral glycan fraction SUM (GP7n: GP11n) G2n G2 in total neutral glycan fraction SUM (GP12n: GP15n) Fn total All fucosylated structures in total neutral glycan fraction SUM (GP1n + GP4n + GP6n + GP8n + GP9n + GP10n + GP11n + GP14n + GP15n) FG0n total / G0n Fucosylation in agalactosylated structures SUM (GP1n + GP4n + GP6n) / G0n × 100 FG1n total / G1n Fucosylation in monogalactosylated structures SUM (GP8n + GP9n + GP10n + GP11n) / G1n × 100 FG2n total / G2n Fucosylation in digalactosylated structures SUM (GP14n + GP15) / G2n × 100 Fn Fucosylation (without bisecting GlcNAc) in total neutral glycan fraction SUM (GP1n + GP4n + GP8n + GP9n + GP14n) FG0n / G0n Fucosylation (without bisecting GlcNAc) in agalactosylated structures SUM (GP1n + GP4n) / G0n × 100 FG1n / G1n Fucosylation (without bisecting GlcNAc) in monogalactosylated structures SUM (GP8n + GP9n) / G1n × 100 FG2n / G2n Fucosylation (without bisecting GlcNAc) in digalactosylated structures GP14n / G2n × 100 FBn Fucosylation (with bisecting GlcNAc) structures in total neutral glycan fraction SUM (GP6n + GP10n + GP11n + GP15n) FBG0n / G0n Fucosylation (with bisecting GlcNAc) of agalactosylated structures GP6n/ G0n × 100 FBG1n / G1n Fucosylation (with bisecting GlcNAc) of monogalactosylated structures SUM (GP10n + GP11n) / G1n × 100 FBG2n / G2n Fucosylation (with bisecting GlcNAc) of digalactosylated structures GP15n / G2n × 100 FBn / Fn Ratio of fucosylated structures with and without bisecting GlcNAc FBn / Fn × 100 FBn / Fn total Bisecting GlcNAc in all fucosylated structures in total neutral glycan fraction FBn / Fn total × 100 Fn / (Bn + FBn) Ratio of fucosylated non–bisecting GlcNAc structures and all structures with bisecting GlcNAc Fn / (GP13n + FBn) Bn / (Fn + FBn) Ratio of structures with bisecting GlcNAc and all fucosylated structures (with and without bisecting GlcNAc) GP13n / (Fn + FBn) × 1,000 FBG2n / FG2n Ratio of fucosylated digalactosylated structures with and without bisecting GlcNAc GP15n / GP14n FBG2n / (FG2n + FBG2n) Bisecting GlcNAc in all fucosylated digalactosylated structures in total neutral glycan fraction GP15n / (GP14n + GP15n) × 100 FG2n / (BG2n + FBG2n) Fucosylated digalactosylated without bisecting GlcNAc structures in all digalactosylated structures GP14n / (GP13n + GP15n) BG2n / (FG2n + FBG2n) Digalactosylated structures with bisecting GlcNAc in all fucosylated digalactosylated structures (with and without bisecting GlcNAc) GP13n / (GP14n + GP15n) × 1,000 Note. F, a fucose attached to core N-acetylglucosamine; B, bisected N-acetylglucosamine linked to core triple mannose; G, galactose; S, N-acetylneuraminic acid attached to galactose; n, neutral glycans. -
Baseline characteristics are presented as the median (25th–75th percentile) for continuous variables, whereas categorical variables are expressed as n (%). The differences in continuous variables among IS and controls were compared by a t-test or Mann-Whitney U test, and categorical variables were tested by a chi-square test or Fisher’s exact test. Multiple logistic regression analyses were performed to identify the associations of 24 directly measured glycan peaks and 54 derived glycan traits with IS after adjusting for confounding factors, such as obesity, age, waist and hip circumference, diabetes, hypertension, and dyslipidemia. For multiple corrections, the false discovery rate (FDR) was controlled using the Benjamini–Hochberg procedure (q) [38]. The potential internal associations among IgG N-glycan traits could induce multicollinearity. Therefore, ridge, stepwise, and the least absolute shrinkage and selection operator (LASSO) based on logistic regression were performed to reduce the dimension of the feature set [39, 40]. Fivefold cross-validation was used to evaluate the performance of the discriminant models. The false discrimination rates were used to compare the methods of dimension reduction. All analyses were performed with R (version 4.0.2, The R Foundation for Statistical Computing, Vienna, Austria) and SPSS Statistics (version 25.0, Chicago, IL, USA).
-
In total, 99 patients with incident IS and 99 matched controls were included in the nested case-control study. The baseline demographic and biochemical characteristics between IS patients and controls stratified by sex are shown in Table 1. Among male IS patients, waistline, BMI, SBP, DBP, TG, LDL, and TC were significantly higher than in the control group. In contrast, SBP and DBP were significantly higher than those in the control group among female IS patients.
Table 1. Baseline characteristics of study subjects
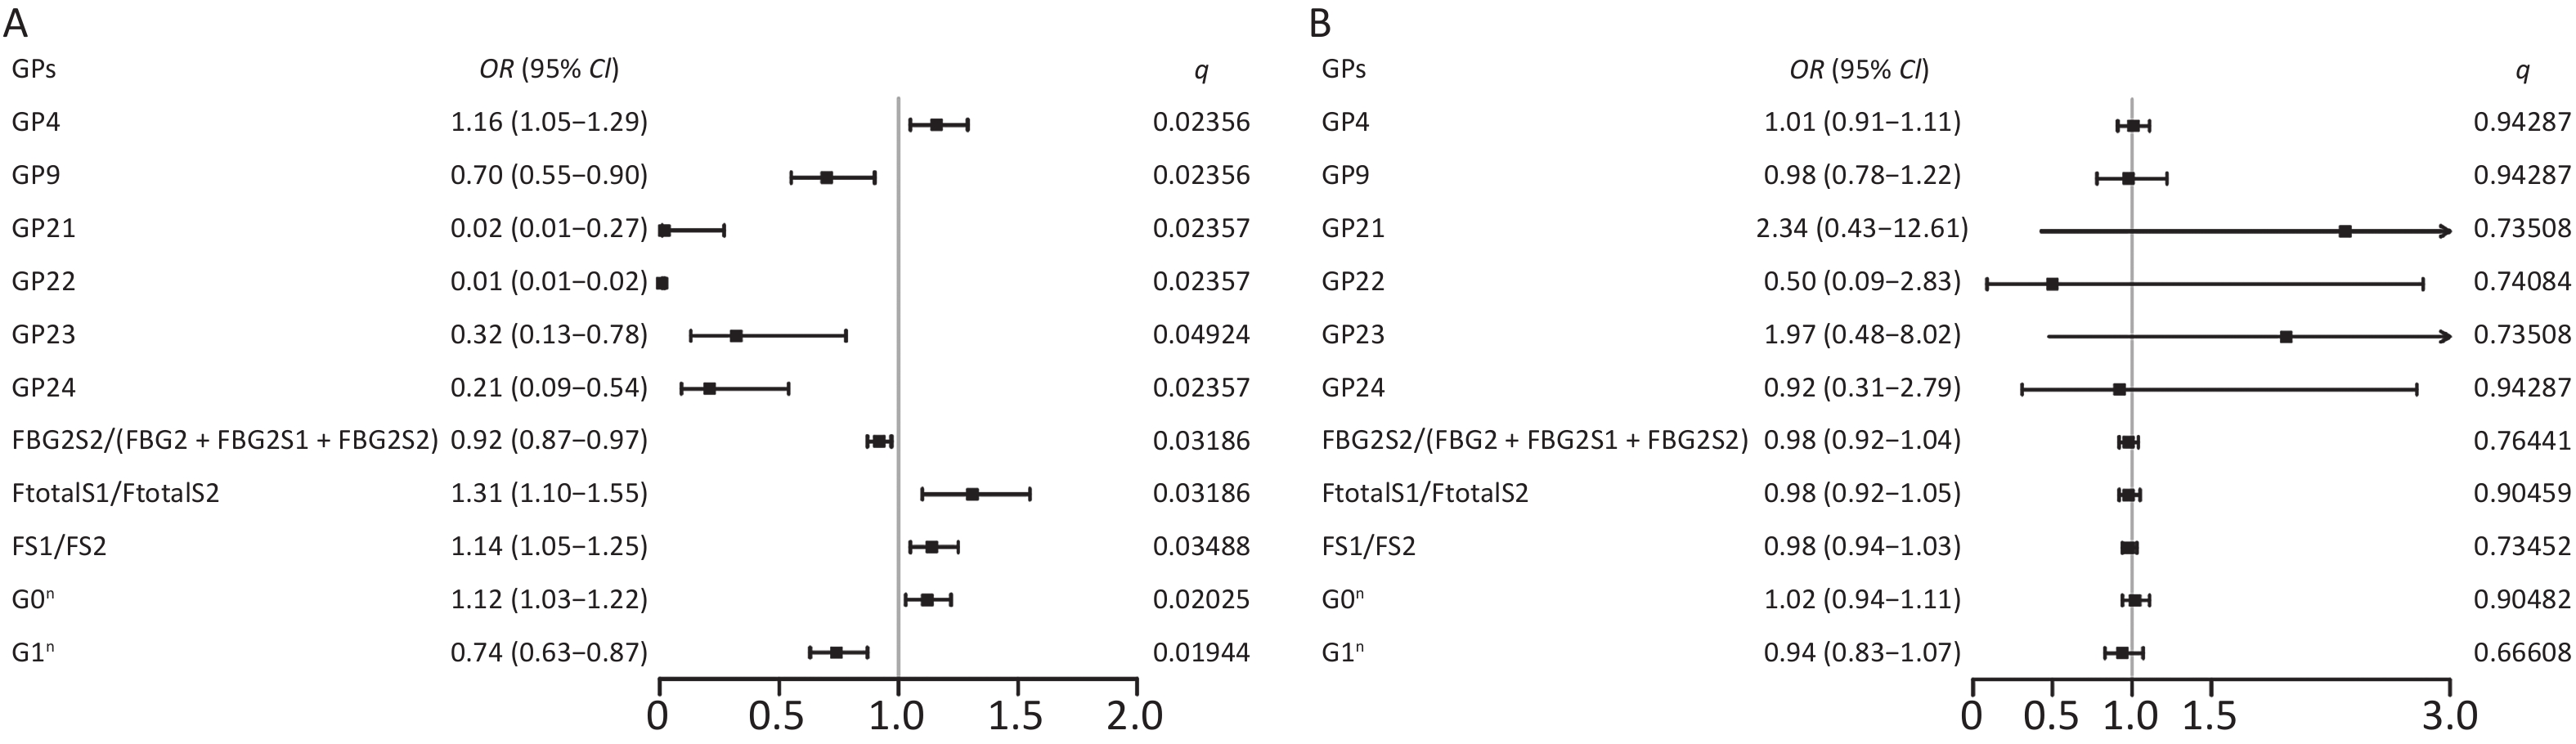
Parameters Men Women Incident IS (n = 58) Control (n = 58) P Incident IS (n = 41) Control (n = 41) P Age (years) 59 (47–61) 52 (40–62) 0.057 57 (48–61) 59 (54–62) 0.108 Waistline (cm) 92.00 (87.00–98.25) 88.00 (83.50–92.25) 0.003 84.00 (80.00–90.00) 85.00 (80.00–93.00) 0.700 Hipline (cm) 100.00 (96.75–105.00) 100.00 (97.00–102.00) 0.377 99.00 (95.00–103.50) 98.00 (96.00–103.00) 0.880 BMI (kg/m2) 26.27 (24.51–27.68) 25.00 (23.44–26.45) 0.021 24.61 (23.00–26.49) 25.00 (22.83–26.76) 0.692 SBP (mmHg) 137.00 (125.00–144.00) 123.00 (115.00–130.25) < 0.001 133.00 (120.00–147.50) 121.00 (111.00–134.00) 0.004 DBP (mmHg) 89.00 (83.00–95.25) 79.50 (72.75–87.25) < 0.001 81.00 (74.50–90.00) 74.00 (67.50–82.00) 0.007 FBG (mmHg) 5.30 (4.90–5.90) 5.20 (4.90–5.81) 0.956 5.10 (4.90–5.50) 5.10 (4.80–5.70) 0.662 TG (mmol/L) 1.33 (1.02–1.97) 1.14 (0.87–1.55) 0.031 1.45 (0.95–1.78) 1.31 (0.86–1.85) 0.813 LDL (mmol/L) 2.58 (2.21–2.99) 2.25 (1.81–2.77) 0.023 2.63 (2.30–3.39) 2.65 (2.42–3.11) 0.289 HDL (mmol/L) 1.07 (0.93–1.25) 1.11 (0.94–1.33) 0.376 1.31 (1.15–1.43) 1.27 (1.17–1.47) 0.878 TC (mmol/L) 4.58 (3.99–5.16) 4.31 (3.30–4.82) 0.047 4.89 (4.34–5.78) 4.78 (4.33–5.18) 0.321 Note. IS, ischemic stroke; BMI, body mass index; SBP, systolic blood pressure; DBP, diastolic blood pressure; FBG, fasting blood glucose; TG, total triglycerides; LDL, low-density lipoprotein; HDL, high-density lipoprotein; TC, total cholesterol. Bold type indicates statistical significance. When comparing the IgG N-glycome composition, including 24 directly measured GPs between the two groups, we observed significant differences in 7 GPs between IS patients and controls (P < 0.05, q < 0.05) (Supplementary Table S3, available in www.besjournal.com). The representative IgG N-glycan profiles of UPLC results for sex-specific IS patients and controls are shown in Figure 1. In the sex-stratified analysis, the comparisons of GPs and DGs at baseline between the IS and control groups are shown in Supplementary Tables S4–S5 (available in www.besjournal.com). Significant differences in 6 GPs and 5 DGs were observed in men after adjusting for age, waist and hip circumference, obesity, diabetes, hypertension, and dyslipidemia (Figure 2, Supplementary Tables S6–S7 available in www.besjournal.com). However, the associations of IgG N-glycan profiles and IS were not found among women (P < 0.05, q < 0.05). For the initial GPs, higher GP4 and lower GP9, GP21, GP22, GP23, and GP24 were associated with a higher risk of IS in men (GP4: OR = 1.16, 95% CI: 1.05–1.29; GP9: OR = 0.70, 95% CI: 0.55–0.90; GP21: OR = 0.02, 95% CI: 0.01–0.27; GP22: OR = 0.01, 95% CI: 0.01–0.02; GP23: OR = 0.32, 95% CI: 0.13–0.78; GP24: OR = 0.21, 95% CI: 0.09–0.54) (Figure 2, Supplementary Table S6). Among the derived glycan traits, lower levels of sialylation [FBG2S2/(FBG2 + FBG2S1 + FBG2S2)] and galactosylation (G1n) and higher levels of no galactosylation (G0n) were found in the men IS group [FBG2S2/(FBG2 + FBG2S1 + FBG2S2]: OR = 0.92, 95% CI: 0.87–0.97; G1n: OR = 0.74, 95% CI: 0.63–0.87; G0n: OR = 1.12, 95% CI: 1.03–1.22) (Figure 2, Supplementary Table S7).
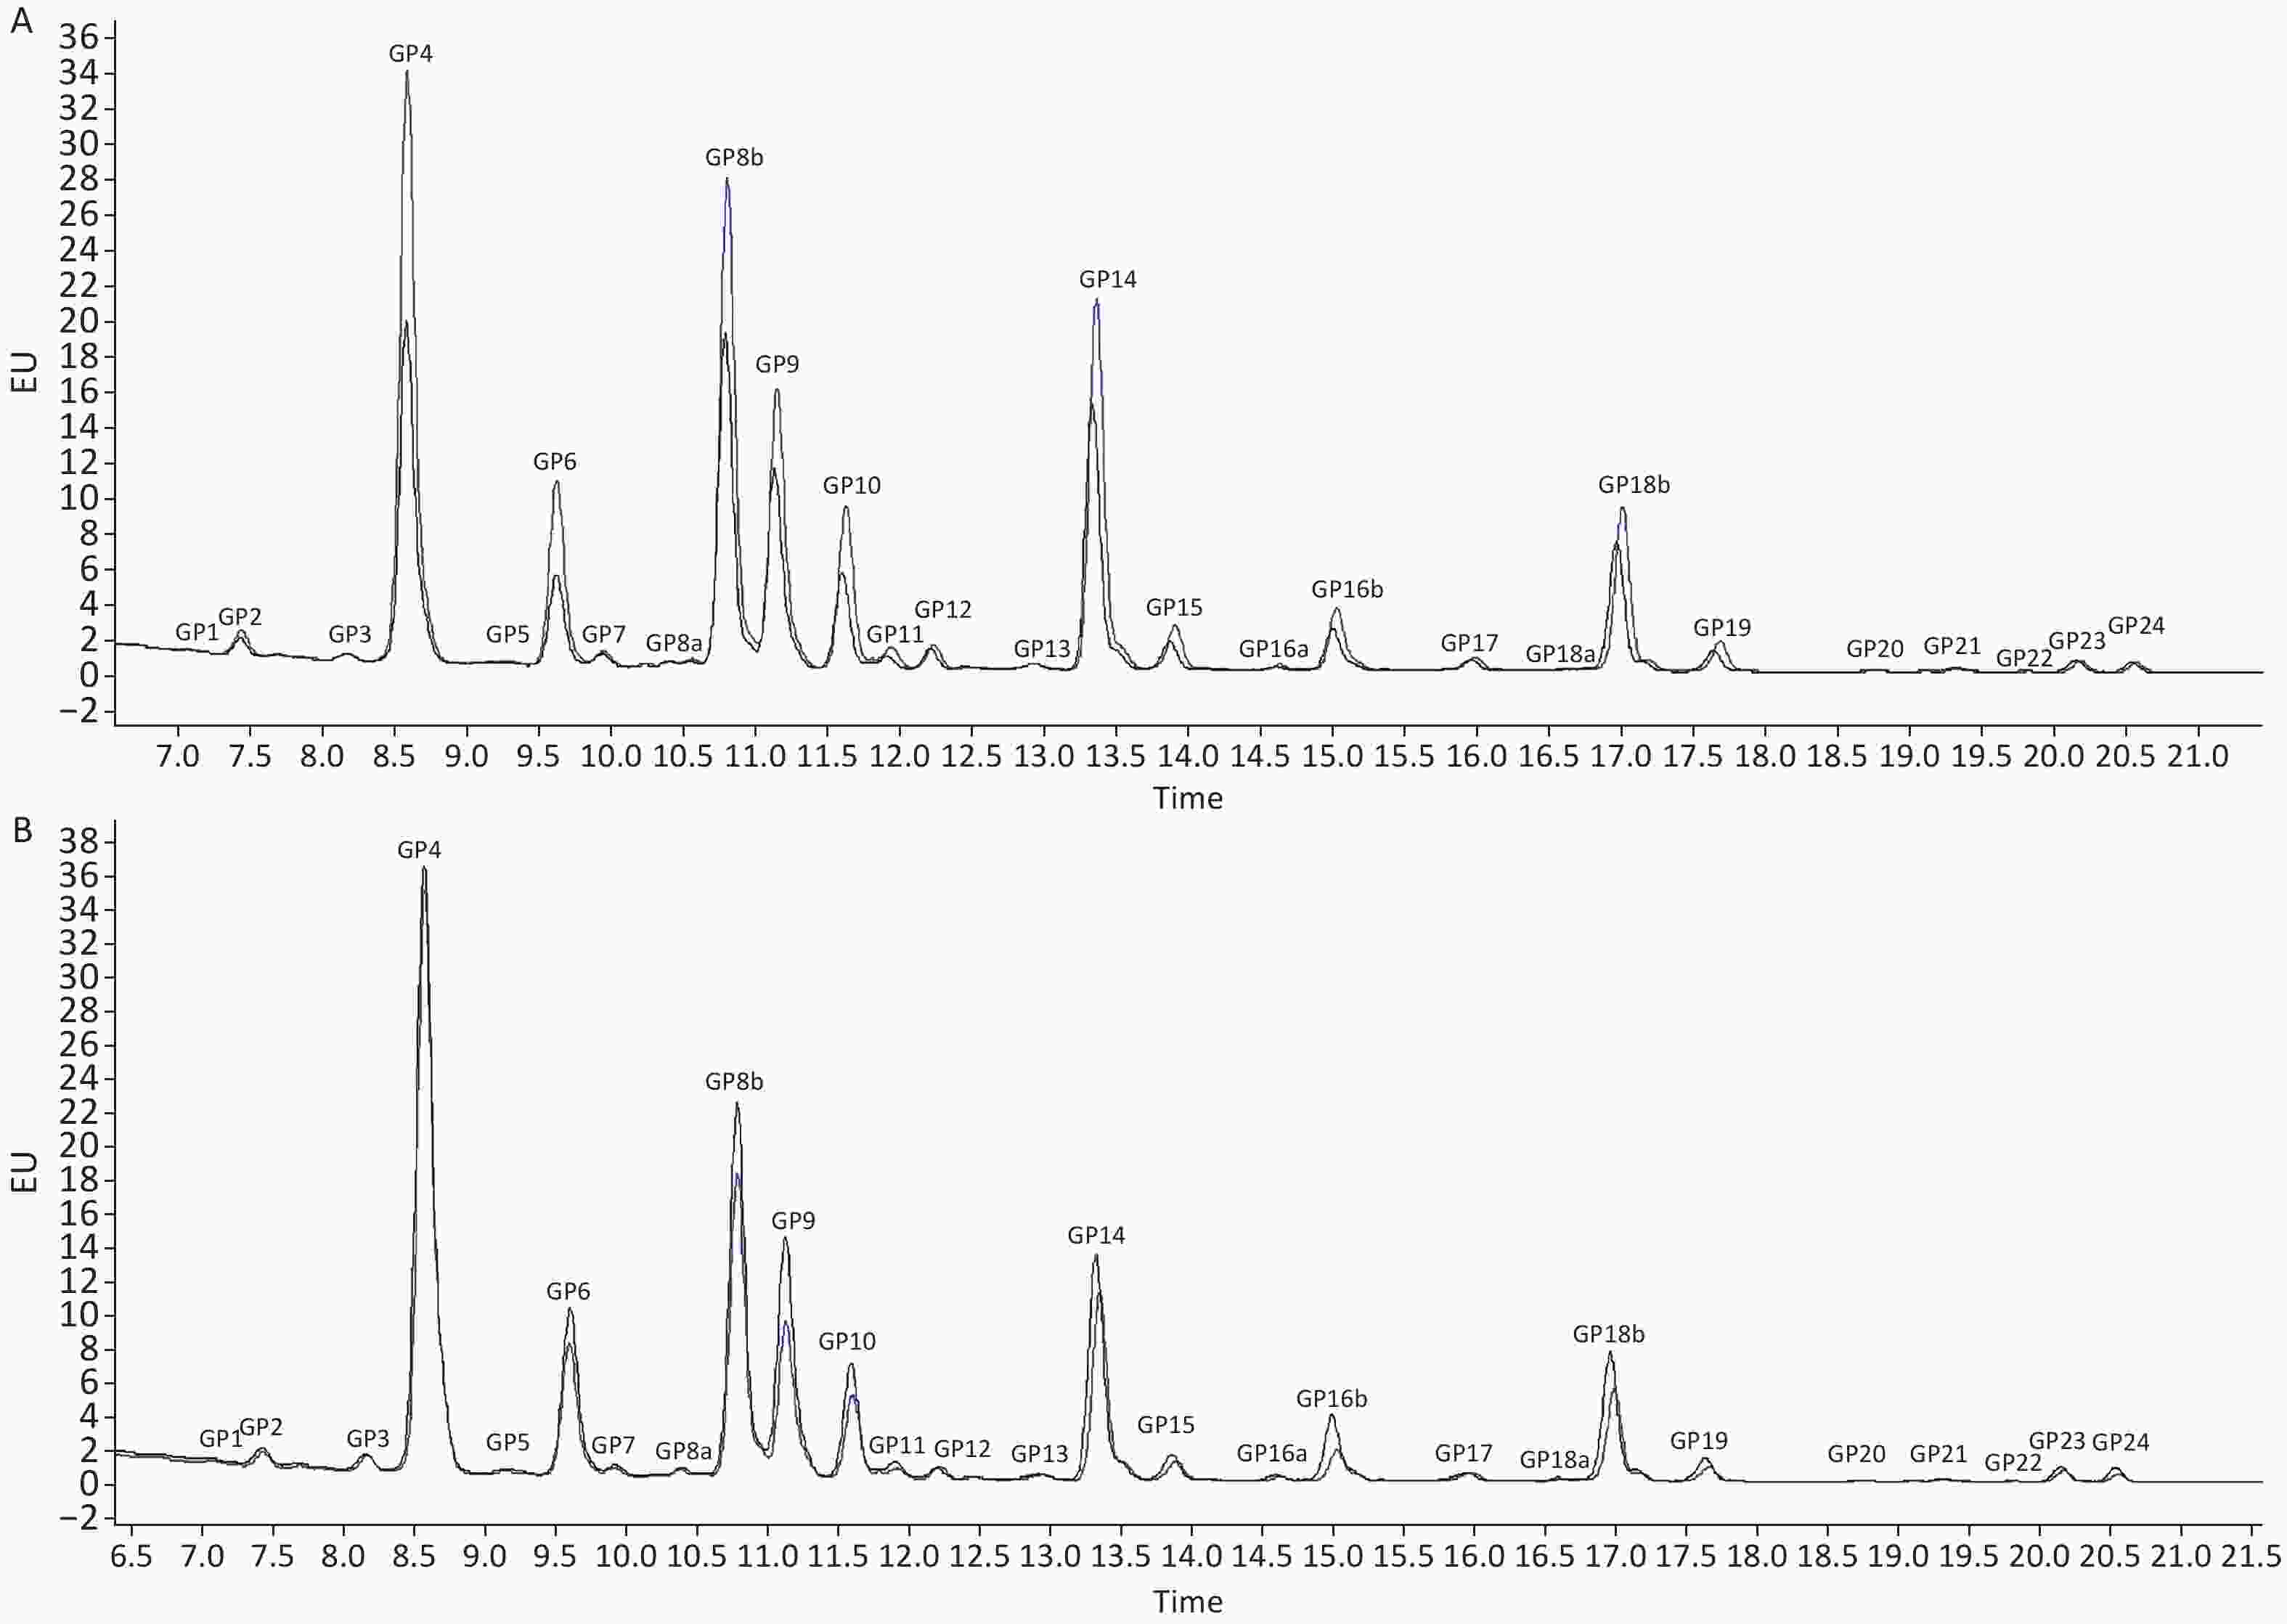
Figure 1. Ultra-Performance Liquid Chromatography of IS patients and controls in (A) men and (B) women. The profiles of glycan peaks were randomly selected from IS patients and matched controls. The 24 IgG glycan peaks are numbered. The blue line represents IS patients; the black line represents controls. IS, ischemic stroke
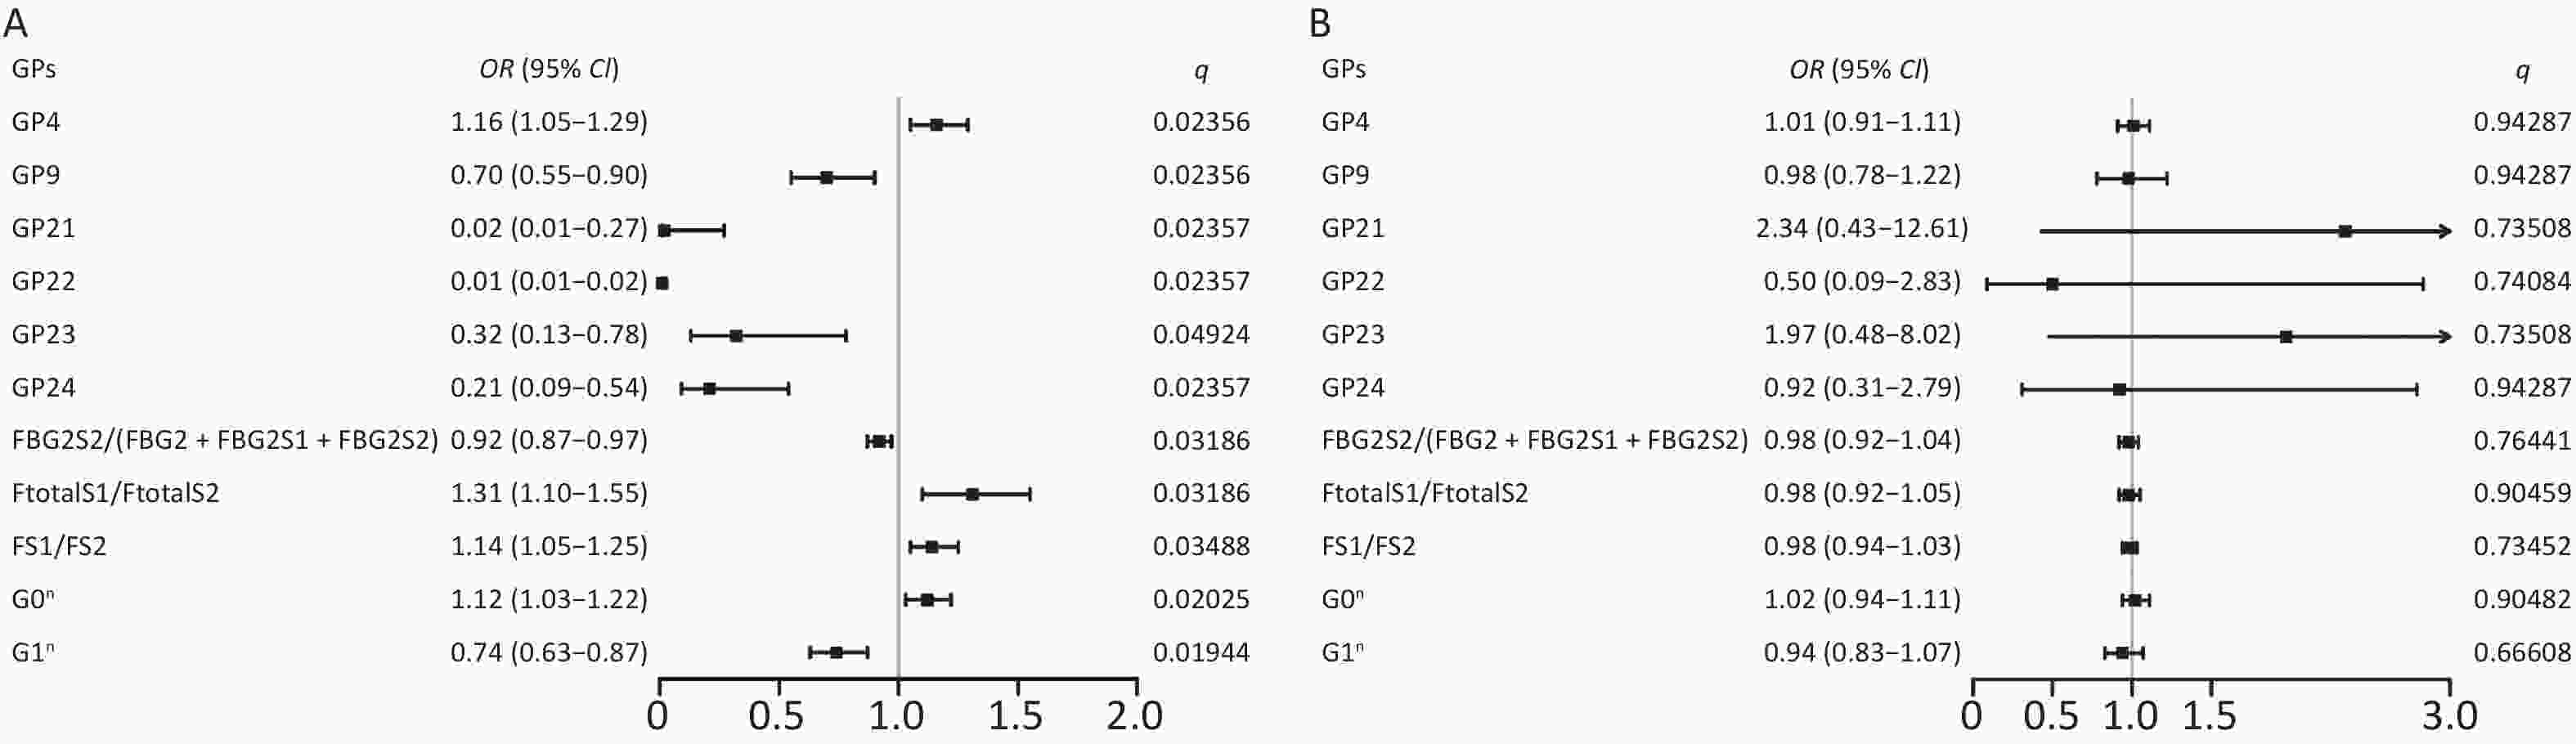
Figure 2. Odds ratios (OR) and 95% confidence intervals (95% CI) for the associations of IgG N-glycan traits with IS in (A) men and (B) women. Multiple logistic regression analysis was performed after adjusting for age, waist and hip circumference, obesity, diabetes, hypertension, and dyslipidemia. IS, ischemic stroke
Table S3. Initial glycan peaks levels in the whole study population of nested case-control study
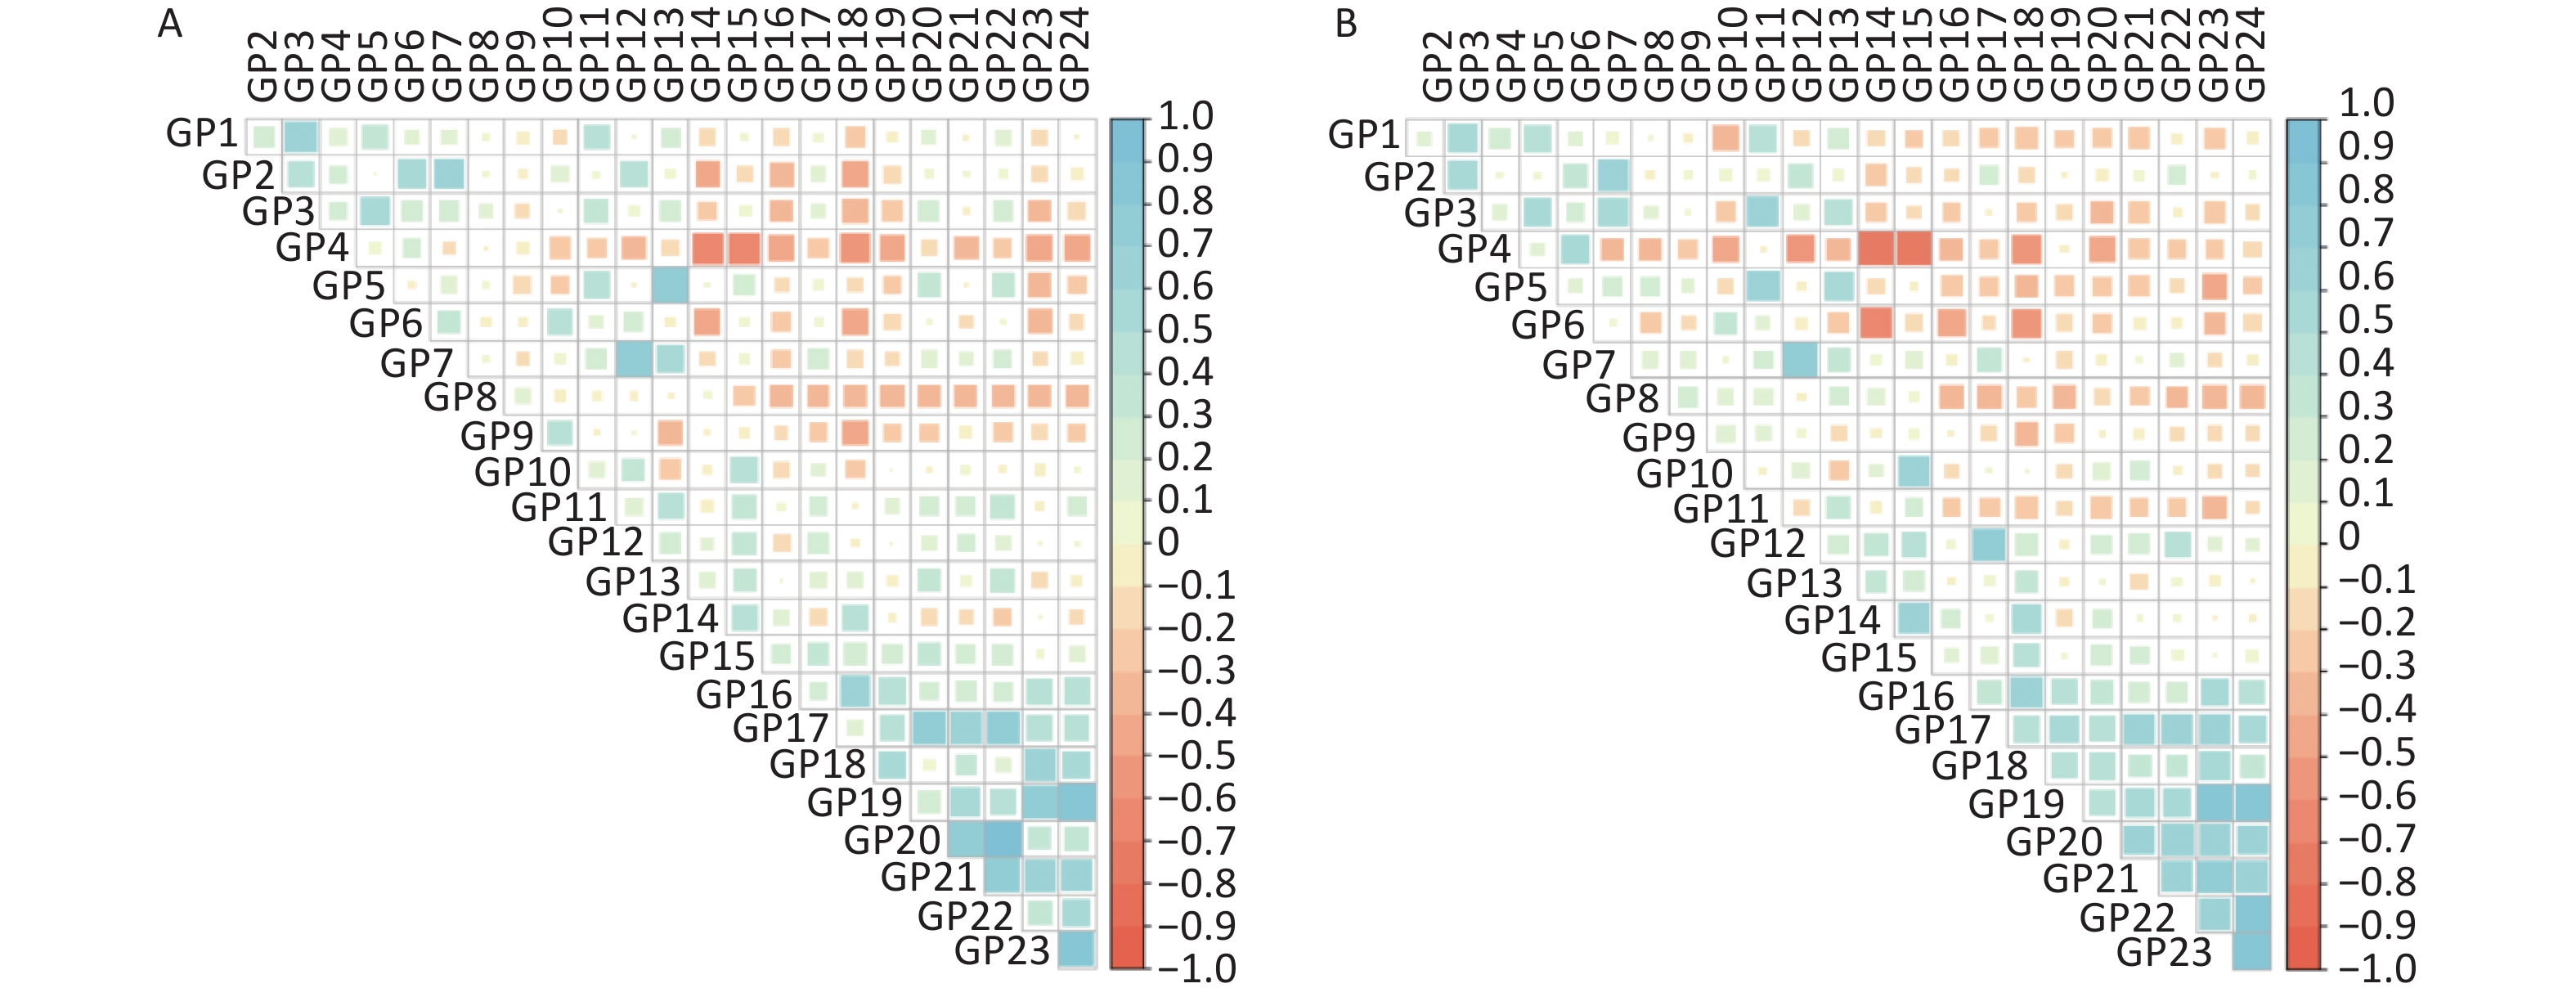
Initial glycans Incident IS Control P* q# GP1 0.09 (0.06–0.16) 0.10 (0.06–0.15) 0.92289 0.92289 GP2 0.47 (0.32–0.72) 0.54 (0.34–0.74) 0.29690 0.41915 GP3 0.14 (0.08–0.25) 0.14 (0.06–0.24) 0.50532 0.60638 GP4 27.91 (24.37–33.50) 26.28 (22.06–30.47) 0.00538* 0.02356# GP5 0.25 (0.18–0.33) 0.23 (0.17–0.28) 0.29391 0.41915 GP6 5.83 (4.73–6.84) 5.27 (4.54–6.39) 0.12498 0.27268 GP7 0.23 (0.14–0.39) 0.27 (0.16–0.45) 0.14670 0.29340 GP8 18.07 (16.66–19.25) 18.48 (16.72–20.15) 0.35356 0.47141 GP9 8.92 (6.37–9.99) 8.51 (7.52–10.29) 0.66243 0.75706 GP10 3.86 (3.47–4.71) 3.98 (3.39–4.58) 0.80409 0.87719 GP11 0.39 (0.27–0.52) 0.46 (0.35–0.65) 0.01306* 0.04478# GP12 0.44 (0.31–0.73) 0.56 (0.40–0.83) 0.02977* 0.07939 GP13 0.59 (0.37–0.76) 0.60 (0.43–0.83) 0.39073 0.49355 GP14 15.76 (13.06–18.50) 13.79 (16.21–18.45) 0.20918 0.35859 GP15 1.31 (1.13–1.69) 1.36 (1.19–1.65) 0.89766 0.92289 GP16 2.51 (2.14–2.99) 2.75 (2.40–3.11) 0.02277* 0.06831 GP17 0.62 (0.48–0.76) 0.67 (0.53–0.84) 0.25641 0.41026 GP18 8.03 (5.87–9.68) 8.58 (6.60–10.89) 0.07599 0.18238 GP19 1.22 (0.90–1.47) 1.44 (1.04–1.73) 0.00589* 0.02356# GP20 0.07 (0.04–0.10) 0.08 (0.05–0.11) 0.17033 0.31446 GP21 0.21 (0.12–0.36) 0.31 (0.18–0.45) 0.00228* 0.01368# GP22 0.04 (0.03–0.07) 0.08 (0.03–0.14) 0.00077* 0.00924# GP23 0.59 (0.35–0.98) 0.84 (0.53–1.22) 0.00195* 0.01368# GP24 0.49 (0.32–1.00) 0.93 (0.48–1.37) 0.00014* 0.00336# Note. Data were expressed median (25th–75th percentile); IS, ischemic stroke; GP, glycan peaks. *P < 0.05. #q < 0.05: significant after correction for FDR (false discovery rate). As shown in Supplementary Figure S1 (available in www.besjournal.com), the sex-specific correlation of IgG N-glycan traits indicated possible multicollinearity. GP4, GP9, and GP22 were selected by stepwise regression and ridge regression. In addition, GP4, GP9, GP22, and GP24 were selected by LASSO regression analysis in male participants. The false discrimination rates of the three methods were 0.267, 0.267, and 0.286, respectively (Supplementary Table S8, available in www.besjournal.com). In a confounder-adjusted and combined significant glycan peak logistic regression model, GP4, GP9, and GP22 were still significantly associated with IS in men (Supplementary Table S8).
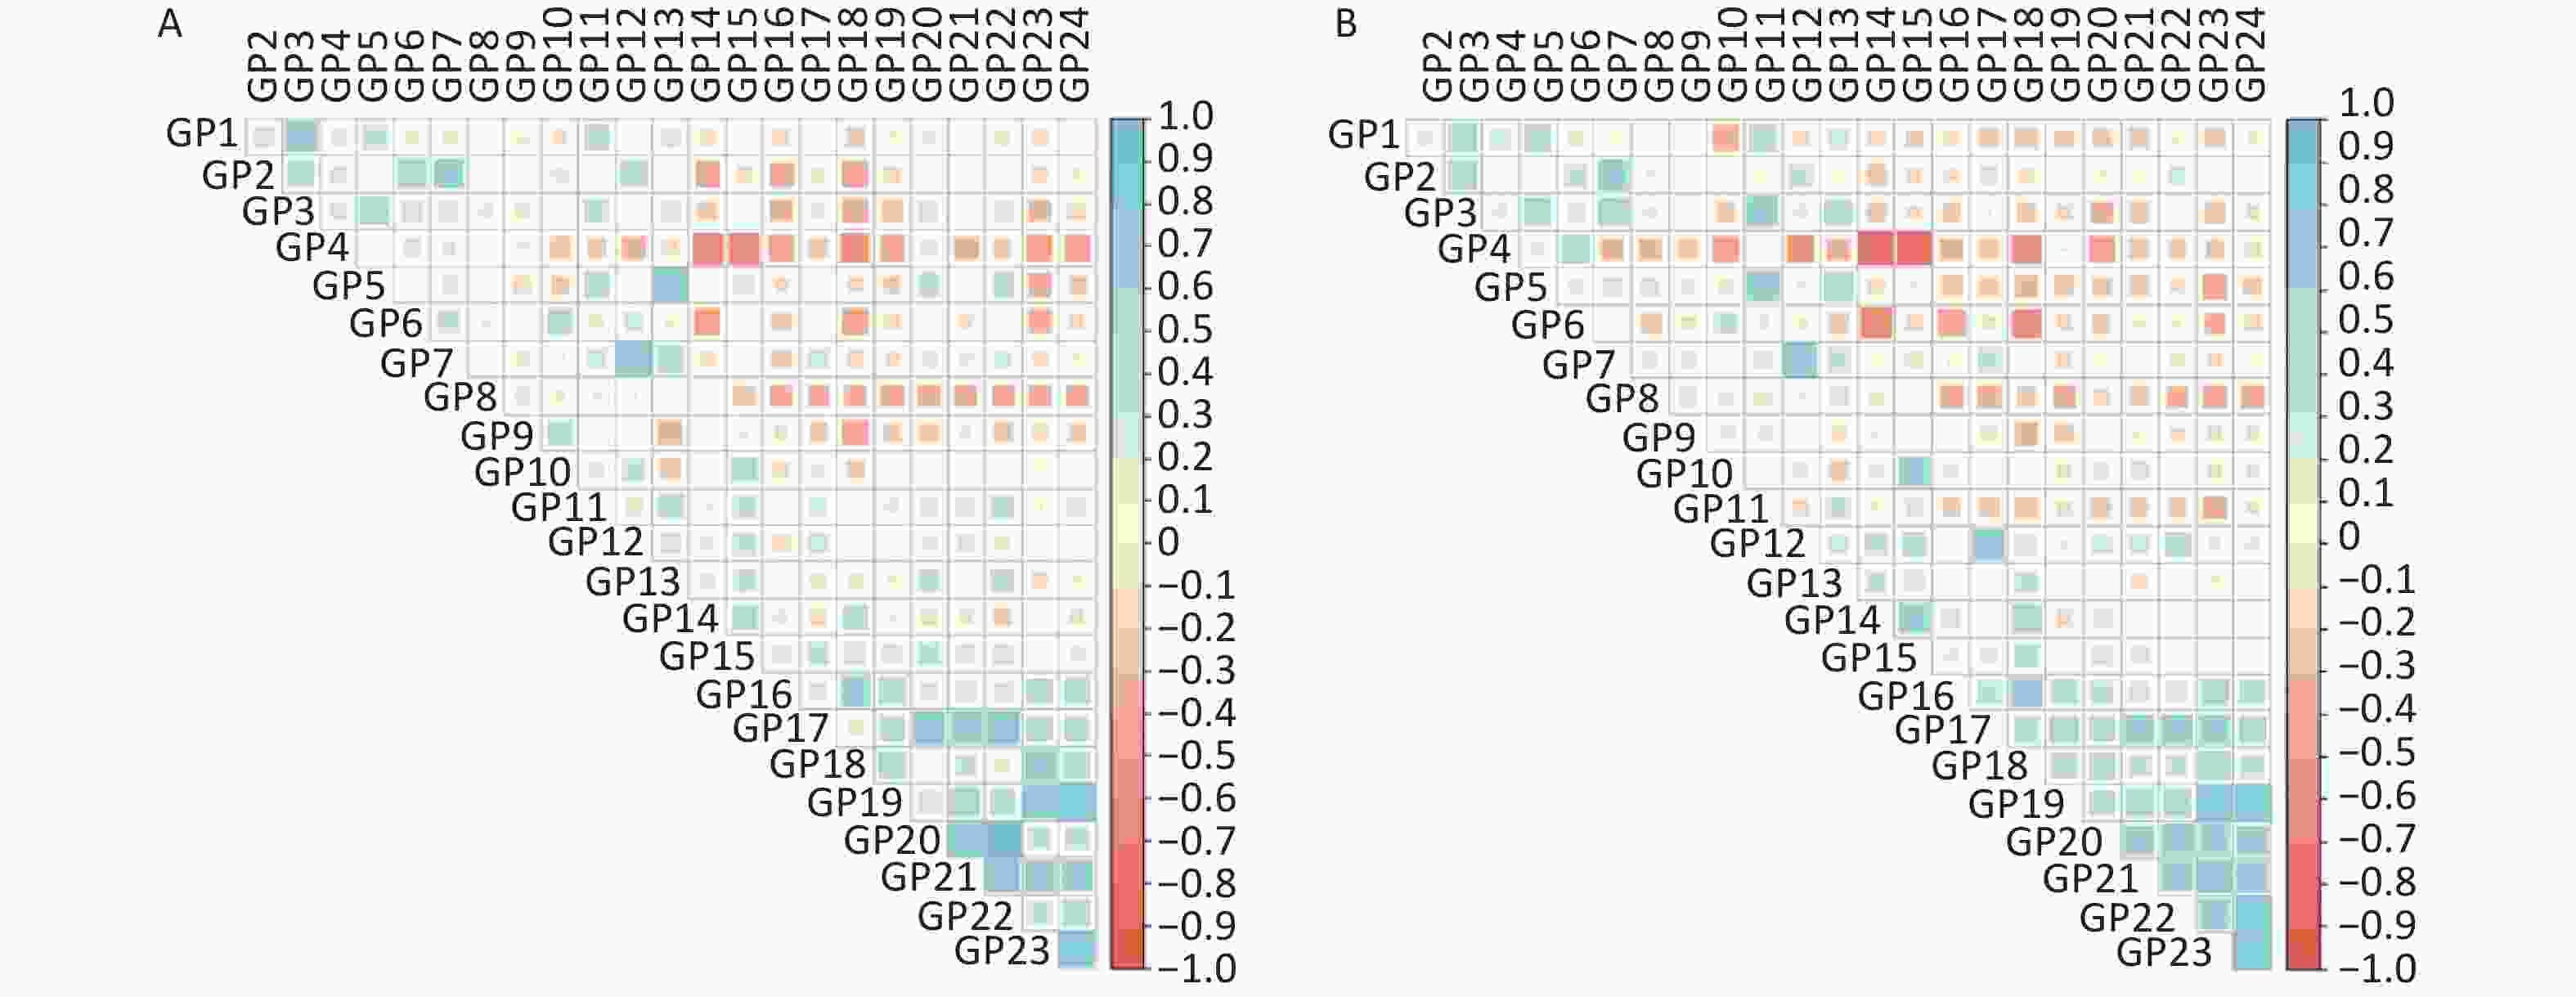
Figure S1. The correlation coefficients of independent IgG N-glycan peaks in (A) men and (B) women. The positive correlations are represented by blue, while negative correlations are represented by red.
Table S8. Initial glycan peaks after dimension reduction screening and false discrimination rates of 5-fold cross-validation in the three methods
Items Stepwise regression Ridge regression Lasso regression Initial glycan peaks GP4 0.147 0.144 0.018 GP9 –0.349 –0.393 –0.047 GP21 – – – GP22 –18.174 –12.879 –0.994 GP23 – – – GP24 – – –0.172 False discrimination rates 0.267 0.267 0.286 Note. GP, glycan peaks; –, the initial glycans were not included in the model. -
In this study, the observational results showed higher levels of GP4 and lower levels of GP9, GP21, GP22, GP23, and GP24 in male patients with IS than in controls, although we did not find such associations in women. This is the first study to investigate the possible prospective link between IgG N-glycan traits and IS. Our findings indicated that decreased sialylation and galactosylation are associated with an increased risk of IS in men, which was also observed in our previous case-control study [15]. Several studies on the general population found that levels of N-glycosylation differed between men and women [24, 25, 41]. It was speculated that galactosylation and sialylation of IgG are influenced and regulated by different sex hormone levels [26]. Furthermore, a previous sex-stratified study indicated that N-glycan biomarkers could improve the prediction ability of type 2 diabetes and cardiovascular disease, with higher predictive efficacy in men [42]. A recent study also showed higher levels of galactosylation in female mice [11], which may explain the sex differences in our study.
Associations between N-glycan traits and cardiovascular diseases have been observed in previous studies [42, 43]. Consistent with our results, a prospective study indicated that plasma N-glycan traits could improve cardiovascular event (including stroke) prediction with the established clinical risk score [42]. In this study, all glycan biomarkers of cardiovascular events stemmed from immunoglobulins, suggesting a particular role for the glycosylation-dependent immune response in cardiovascular disease etiology. Similarly, a previous cohort study of stroke‐free individuals also found that the N-glycome might be a potentially useful biomarker for silent brain infarcts. Individuals with silent brain infarcts have a 2- to 4-fold higher risk of stroke [44]. Menni et al. investigated the links between IgG N-glycan traits and the 10-year atherosclerotic cardiovascular disease risk score and subclinical atherosclerosis. They found that galactosylation and sialylation of IgG N-glycan traits were inversely associated with the 10-year atherosclerotic cardiovascular disease risk score [45].
Combined with previous research [15], our findings suggested that faintly aberrant IgG N-glycosylation might play a cascading role in the pathogenesis of IS. N-glycosylation compositions in the Fc segment of IgG can alter effector functions by modulating its affinity for distinct Fc receptors to mediate pro- and anti-inflammatory activities [46]. Abundant evidence has shown potential links between decreased galactosylation and BMI, measures of central adiposity, and hypertension [19, 47, 48], which are risk factors for IS. IgG N-glycosylation with decreased galactosylation mediates proinflammatory activity by recognizing mannose-binding lectin (MBL) and subsequently activating complement [49]. In addition, decreased galactosylation also enhances FcγRIII affinity, thus enhancing antibody-dependent cellular cytotoxicity (ADCC) activity [50]. Moreover, galactose deficiency also affects sialylation, as the addition of terminal sialylation requires galactose as the substrate for sialyltransferases [51].
A strength of this study was the use of incident cases from a prospective cohort study, which enables keeping the temporal association between IgG N-glycan traits and IS outcome in longitudinal studies. Several limitations should be noted. First, in a prospective setting, the relatively small sample size of the nested case-control study may result in an overfitted model. The results suggested that IgG N-glycan traits were prospectively associated with IS but did not provide a final assessment of predictive accuracy. Further validation of cohort studies in larger independent populations is necessary for our future work. Second, because medication information, such as antihypertensive treatment, was unavailable in the database, the potential for bias arising from medication information could not be assessed. Third, information on menopause time was not collected in the database, and more studies are needed to examine whether the changes in IgG N-glycosylation in women affected by menopausal status can influence the pathogenesis of IS in the future. Finally, this study did not include hemorrhagic stroke because of its low incidence in the cohort by the end of the follow-up. Further external validation of IgG N-glycan biomarkers is needed in large prospective studies.
-
In conclusion, the present study showed that IgG N-glycan traits with decreased galactosylation and sialylation were prospectively associated with incident IS in men, suggesting that sex discrepancy might exist in the association between IgG N-glycans and incident IS. Nevertheless, further research is needed to validate these biomarkers in cohort studies with larger sample sizes and multiethnic populations, which provide novel biomarkers to identify IS patients.
-
The data underlying this article will be shared upon reasonable request to the corresponding author.
-
Table S4. Sex-specific initial glycan peaks levels in nested case-control study
Initial glycans Men Women Incident IS Control P* q# Incident IS Control P* q# GP1 0.09 (0.06–0.16) 0.08 (0.05–0.12) 0.53245 0.61419 0.10 (0.05–0.15) 0.10 (0.07–0.17) 0.36758 0.80236 GP2 0.51 (0.32–0.74) 0.54 (0.35–0.73) 0.81231 0.82950 0.47 (0.31–0.69) 0.61 (0.34–0.75) 0.17711 0.80236 GP3 0.18 (0.09–0.29) 0.12 (0.05–0.17) 0.02494* 0.05679 0.13 (0.07–0.22) 0.22 (0.10–0.29) 0.07032 0.80236 GP4 26.64 (24.54–31.37) 22.65 (20.42–26.22) 0.00001* 0.00008# 31.87 (23.14–35.61) 30.47 (27.15–32.94) 0.88539 0.92388 GP5 0.26 (0.18–0.33) 0.21 (0.16–0.26) 0.08585 0.13736 0.25 (0.20–0.30) 0.25 (0.20–0.35) 0.60091 0.90137 GP6 5.70 (4.91–6.49) 5.12 (4.17–6.16) 0.28842 0.38115 5.96 (4.59–7.07) 5.58 (4.76–7.13) 0.82898 0.92388 GP7 0.30 (0.15–0.40) 0.28 (0.18–0.46) 0.30174 0.38114 0.22 (0.12–0.33) 0.23 (0.15–0.40) 0.30960 0.80236 GP8 18.05 (16.40–19.16) 17.72 (16.16–19.84) 0.82950 0.82950 18.07 (16.94–19.16) 18.95 (17.42–20.32) 0.09597 0.80236 GP9 8.38 (6.28–9.88) 8.71 (7.65–10.37) 0.24399 0.34445 9.09 (7.41–10.03) 8.30 (6.80–10.26) 0.59025 0.90137 GP10 3.90 (3.35–4.70) 4.02 (3.43–4.58) 0.53742 0.61419 3.85 (3.50–5.07) 3.85 (3.05–4.70) 0.33709 0.80236 GP11 0.41 (0.29–0.52) 0.49 (0.37–0.72) 0.00765* 0.02295# 0.38 (0.30–0.50) 0.43 (0.32–0.55) 0.57133 0.90137 GP12 0.51 (0.35–0.76) 0.66 (0.48–1.03) 0.02393* 0.05679 0.39 (0.25–0.61) 0.47 (0.34–0.61) 0.30100 0.80236 GP13 0.64 (0.41–0.77) 0.63 (0.45–0.92) 0.66266 0.72290 0.51 (0.35–0.72) 0.52 (0.40–0.78) 0.40118 0.80236 GP14 16.06 (14.85–18.51) 17.54 (15.13–18.98) 0.05330 0.09487 15.04 (11.94–18.36) 14.36 (12.59–16.84) 0.84204 0.92388 GP15 1.35 (1.03–1.81) 1.46 (1.29–1.71) 0.24162 0.34446 1.28 (1.07–1.58) 1.20 (1.01–1.40) 0.12404 0.80236 GP16 2.56 (2.16–2.96) 2.77 (2.41–3.40) 0.02603* 0.05679 2.51 (2.14–3.02) 2.68 (2.34–2.97) 0.37326 0.80236 GP17 0.68 (0.49–0.80) 0.74 (0.60–0.91) 0.05534 0.09487 0.58 (0.48–0.72) 0.60 (0.47–0.69) 0.73488 0.92388 GP18 7.90 (6.31–9.68) 9.82 (8.01–12.46) 0.00218* 0.00747# 7.77 (5.44–9.93) 7.59 (5.97–8.54) 0.55485 0.90136 GP19 1.22 (0.88–1.48) 1.55 (1.34–1.77) 0.00004* 0.00019# 1.25 (0.94–1.48) 1.20 (0.72–1.54) 0.40055 0.80236 GP20 0.07 (0.04–0.10) 0.10 (0.04–0.12) 0.04731* 0.09462 0.07 (0.05–0.10) 0.06 (0.05–0.09) 0.84481 0.92388 GP21 0.22 (0.12–0.38) 0.38 (0.28–0.57) 0.00002* 0.00012# 0.21 (0.11–0.34) 0.22 (0.12–0.29) 0.87464 0.92388 GP22 0.05 (0.03–0.08) 0.12 (0.06–0.20) 0.00001* 0.00008# 0.04 (0.03–0.07) 0.05 (0.02–0.09) 0.26127 0.80236 GP23 0.56 (0.35–1.09) 1.02 (0.68–1.68) 0.00008* 0.00032# 0.59 (0.36–0.90) 0.68 (0.38–0.87) 0.94823 0.94823 GP24 0.53 (0.35–1.11) 1.14 (0.79–1.62) 0.00001* 0.00008# 0.46 (0.31–0.90) 0.60 (0.33–0.99) 0.66626 0.92388 Note. Data were expressed median (25th–75th percentile); IS, ischemic stroke; GP, glycan peaks. *P < 0.05. #q < 0.05: significant after correction for FDR (false discovery rate). Table S5. Sex-specific derive glycan traits levels in nested case-control study
Derive glycans Men Women Incident IS Control P* q# Incident IS Control P* q# FGS/(FG + FGS) 21.58 (17.18–24.75) 24.82 (20.35–28.44) 0.01024* 0.03253# 19.92 (16.46–23.58) 20.47 (16.83–22.67) 0.54249 0.79174 FBGS/(FBG + FBGS) 22.28 (15.51–32.00) 31.46 (23.82–37.07) 0.00045* 0.00347# 22.06 (17.79–29.09) 23.24 (16.82–31.50) 0.74667 0.86864 FGS/(F + FG + FGS) 13.84 (10.47–16.80) 17.36 (14.10–20.75) 0.00103* 0.00556# 13.09 (9.45–16.37) 13.09 (11.09–14.74) 0.36087 0.63734 FBGS/(FB + FBG + FBGS) 13.21 (8.81–19.06) 19.22 (14.63–25.69) 0.00008* 0.00072# 12.33 (9.45–17.34) 13.58 (8.84–18.63) 0.79154 0.89048 FG1S1/(FG1 + FG1S1) 8.36 (6.87–10.13) 9.18 (8.01–11.79) 0.02131* 0.05479 7.89 (6.97–9.79) 8.92 (7.67–9.99) 0.16845 0.62776 FG2S1/(FG2 + FG2S1 + FG2S2) 31.99 (28.02–36.49) 35.12 (31.17–38.62) 0.01811* 0.05147 32.52 (28.71–34.62) 32.50 (28.72–35.54) 0.97411 0.98890 FG2S2/(FG2 + FG2S1 + FG2S2) 2.42 (1.46–4.26) 3.40 (2.68–5.14) 0.00121* 0.00594# 2.54 (1.70–4.02) 3.11 (1.43–3.89) 0.85649 0.92501 FBG2S1/(FBG2 + FBG2S1 + FBG2S2) 36.07 (31.29–41.18) 36.53 (33.98–39.56) 0.80038 0.86441 39.16 (34.44–45.11) 37.95 (32.40–42.82) 0.74219 0.86864 FBG2S2/(FBG2 + FBG2S1 + FBG2S2) 19.40 (11.83–28.99) 26.39 (20.92–32.73) 0.00002* 0.00036# 14.76 (10.66–23.97) 19.94 (12.67–27.05) 0.22264 0.62776 FtotalS1/FtotalS2 9.61 (5.97–14.64) 6.57 (5.06–8.69) 0.00007* 0.00072# 10.47 (6.26–14.49) 8.74 (6.72–13.80) 0.66629 0.83674 FS1/FS2 17.82 (11.06–29.02) 12.92 (9.23–17.11) 0.00059* 0.00354# 17.29 (10.68–23.77) 15.40 (11.99–25.66) 0.95193 0.98890 FBS1/FBS2 1.88 (1.38–3.14) 1.41 (1.09–1.71) 0.00002* 0.00036# 2.55 (1.58–3.30) 1.96 (1.48–3.32) 0.32103 0.62775 FBStotal/FStotal 0.16 (0.12–0.21) 0.19 (0.16–0.23) 0.00059* 0.00354# 0.17 (0.11–0.22) 0.16 (0.11–0.22) 0.53805 0.79174 FBS1/FS1 0.11 (0.08–0.14) 0.12 (0.10–0.16) 0.05678 0.12264 0.12 (0.09–0.16) 0.11 (0.09–0.14) 0.20666 0.62776 FBS1/FS1 + FBS1 0.09 (0.07–0.12) 0.10 (0.09–0.14) 0.06318 0.13030 0.11 (0.08–0.14) 0.10 (0.08–0.12) 0.21982 0.62776 FBS2/FS2 0.89 (0.62–1.28) 1.10 (0.84–1.33) 0.02100* 0.05479 0.79 (0.65–1.09) 1.02 (0.65–1.27) 0.53814 0.79174 FBS2/(FS2 + FBS2) 0.47 (0.38–0.56) 0.52 (0.46–0.57) 0.04908* 0.12047 0.44 (0.39–0.52) 0.50 (0.39–0.56) 0.53904 0.79174 GP1n 0.09 (0.07–0.20) 0.11 (0.07–0.16) 0.64278 0.73851 0.11 (0.06–0.18) 0.12 (0.08–0.20) 0.63293 0.81376 GP2n 0.59 (0.38–0.89) 0.66 (0.43–0.88) 0.50054 0.60065 0.54 (0.36–0.77) 0.68 (0.40–0.89) 0.17490 0.62776 GP4n 32.55 (29.13–37.07) 27.71 (25.51–31.73) 0.00003* 0.00041# 36.88 (27.52–41.70) 35.13 (31.34–37.73) 0.56569 0.79915 GP5n 0.31 (0.21–0.39) 0.26 (0.19–0.31) 0.24623 0.39107 0.28 (0.23–0.34) 0.29 (0.23–0.39) 0.45536 0.76842 GP6n 6.70 (5.83–7.69) 6.12 (5.30–7.39) 0.22027 0.36044 6.85 (5.56–8.00) 6.30 (5.47–8.23) 0.60676 0.79914 GP7n 0.34 (0.18–0.50) 0.36 (0.22–0.54) 0.15588 0.28058 0.25 (0.14–0.36) 0.28 (0.17–0.45) 0.26776 0.62776 GP8n 20.93 (19.55–23.35) 22.14 (20.06–23.57) 0.25676 0.39614 21.02 (18.93–22.51) 21.99 (20.31–23.25) 0.08556 0.62776 GP9n 9.88 (7.14–11.46) 10.60 (9.55–12.43) 0.01181* 0.03543# 10.54 (8.69–11.55) 9.72 (7.85–11.44) 0.29290 0.62776 GP10n 4.63 (3.92–5.50) 4.91 (4.29–5.72) 0.12410 0.23108 4.55 (4.06–5.68) 4.44 (3.51–5.45) 0.20555 0.62776 GP11n 0.46 (0.31–0.60) 0.61 (0.45–0.82) 0.00139* 0.00626# 0.47 (0.35–0.57) 0.49 (0.36–0.62) 0.75604 0.86864 GP12n 0.59 (0.43–0.93) 0.80 (0.60–1.25) 0.00659* 0.02224# 0.45 (0.29–0.70) 0.53 (0.38–0.74) 0.36588 0.63734 GP13n 0.76 (0.44–0.97) 0.79 (0.55–1.10) 0.35647 0.46949 0.55 (0.40–0.85) 0.61 (0.45–0.89) 0.33248 0.62776 GP14n 19.06 (15.87–22.04) 22.00 (17.94–24.04) 0.00491* 0.01768# 16.72 (13.35–22.43) 16.63 (14.41–19.71) 0.96386 0.98890 GP15n 1.62 (1.21–2.14) 1.85 (1.59–2.17) 0.05250 0.12264 1.53 (1.20–1.94) 1.39 (1.15–1.67) 0.12482 0.62776 G0n 39.81 (36.45–44.64) 35.43 (32.44–39.42) 0.00002* 0.00036# 43.89 (34.54–49.25) 42.01 (39.49–47.09) 0.84456 0.92501 G1n 36.38 (33.12–39.88) 39.15 (36.88–40.78) 0.00165* 0.00685# 36.78 (33.66–39.91) 36.74 (34.84–38.86) 0.98890 0.98890 G2n 22.03 (18.32–25.91) 25.96 (21.39–28.36) 0.00180* 0.00694# 19.87 (15.37–25.34) 19.10 (16.49–22.71) 0.71465 0.86864 Fn total 96.92 (96.19–97.85) 96.87 (95.94–97.56) 0.17436 0.29423 97.50 (96.98–98.14) 97.15 (96.61–97.84) 0.09055 0.62776 FG0n total/G0n 98.40 (97.78–98.95) 98.31 (98.60–99.50) 0.10451 0.20156 98.78 (98.27–99.10) 98.50 (97.85–98.88) 0.19258 0.62776 FG1n total/G1n 99.11 (98.62–99.52) 99.05 (98.60–99.43) 0.31759 0.46351 99.32 (99.07–99.61) 99.22 (98.87–99.52) 0.20389 0.62776 FG2n total/G2n 93.52 (92.42–94.99) 93.21 (91.72–94.47) 0.16577 0.28876 94.06 (93.36–95.44) 93.58 (92.48–94.80) 0.11383 0.79174 Fn 82.88 (81.56–85.69) 82.93 (80.58–85.59) 0.33667 0.46949 83.54 (82.34–85.73) 84.32 (81.60–86.26) 0.52525 0.79915 FG0n/G0n 81.58 (79.77–83.54) 80.41 (77.86–83.42) 0.05466 0.12264 82.35 (80.01–84.19) 82.26 (80.13–85.63) 0.60676 0.62776 FG1n/G1n 84.16 (82.80–87.17) 84.59 (82.26–86.46) 0.28216 0.42324 84.81 (83.71–86.66) 85.09 (83.44–88.06) 0.19898 0.79915 FG2n/G2n 85.71 (84.19–87.91) 85.70 (83.33–87.08) 0.45936 0.56788 85.94 (84.80–88.42) 86.82 (84.33–88.19) 0.60029 0.62776 FBn 13.85 (11.86–14.98) 13.97 (12.04–15.53) 0.52184 0.61259 13.71 (12.31–14.84) 13.19 (11.25–15.47) 0.13337 0.62776 FBG0n/G0n 16.78 (14.86–18.41) 17.86 (15.07–19.31) 0.06515 0.13030 16.61 (14.45–18.75) 16.34 (13.13–17.91) 0.31430 0.62776 FBG1n/G1n 14.72 (12.14–16.05) 14.33 (12.84–15.86) 0.94717 0.98359 14.25 (12.61–15.51) 14.34 (11.04–15.63) 0.15728 0.62776 FBG2n/G2n 7.57 (6.34–8.82) 7.50 (6.57–8.45) 0.69743 0.78461 7.58 (6.78–8.59) 7.20 (6.17–8.63) 0.10361 0.62776 FBn/Fn 16.74 (13.92–18.25) 16.83 (14.02–19.48) 0.46272 0.56788 16.43 (14.55–18.11) 15.63 (13.09–18.96) 0.27178 0.62776 FBn/Fn total 14.34 (12.22–15.44) 14.41 (12.29–16.29) 0.46272 0.56788 14.11 (12.70–15.33) 13.52 (11.57–15.94) 0.27178 0.62776 Fn/ (Bn + FBn) 5.74 (5.23–6.88) 5.63 (4.82–6.76) 0.35359 0.46949 5.82 (5.33–6.63) 6.15 (5.04–7.15) 0.32787 0.62776 Bn/ (Fn + FBn) 7.88 (4.51–9.96) 8.08 (5.64–11.28) 0.35647 0.46949 5.69 (4.04–8.69) 6.26 (4.60–9.17) 0.33713 0.62776 FBG2n/FG2n 0.09 (0.07–0.11) 0.09 (0.08–0.10) 0.97632 0.99251 0.09 (0.08–0.10) 0.08 (0.07–0.10) 0.09598 0.62776 FBG2n/(FG2n + FBG2n) 8.20 (6.75–9.68) 8.18 (7.17–9.23) 0.99251 0.99251 7.97 (7.34–9.16) 7.60 (6.69–9.08) 0.09598 0.62776 FG2n/(BG2n + FBG2n) 7.51 (6.73–9.74) 7.77 (6.74–9.29) 0.94717 0.98359 7.93 (6.96–8.90) 8.41 (7.05–9.59) 0.25983 0.62776 BG2n/(FG2n + FBG2n) 35.97 (23.84–48.16) 34.19 (23.01–45.88) 0.78248 0.86232 33.78 (24.20–42.73) 35.75 (27.10–46.79) 0.28410 0.62776 Note. Data were expressed median (25th–75th percentile); IS ischemic stroke. *represents P < 0.05. #represents q < 0.05: significant after correction for FDR (false discovery rate). Table S6. Associations of initial glycan peaks and ischemic stroke in sex-specific analysis (after adjusting for age, waist and hip circumference, obesity, diabetes, hypertension, and dyslipidemia)
Initial glycans Incident IS vs. control (men) Incident IS vs. control (women) OR (95% CI) P* q# OR (95% CI) P* q# GP1 2.07 (0.42–10.18) 0.37218 0.50995 0.60 (0.12–3.04) 0.54082 0.86531 GP2 0.53 (0.13–2.11) 0.36630 0.50995 0.81 (0.16–4.09) 0.80073 0.94287 GP3 3.03 (0.84–10.96) 0.09149 0.24397 0.42 (0.10–1.82) 0.24799 0.73508 GP4 1.16 (1.05–1.29) 0.00396* 0.02356# 1.01 (0.91–1.11) 0.90359 0.94287 GP5 3.32 (0.52–21.32) 0.20537 0.37914 0.37 (0.03–4.43) 0.42893 0.74085 GP6 1.13 (0.81–1.58) 0.46818 0.59139 1.24 (0.79–1.92) 0.36580 0.73508 GP7 0.37 (0.06–2.20) 0.27572 0.44115 0.39 (0.06–2.53) 0.32465 0.73508 GP8 0.99 (0.82–1.20) 0.93209 0.93209 0.80 (0.64–1.00) 0.05127 0.71088 GP9 0.70 (0.55–0.90) 0.00491* 0.02356# 0.98 (0.78–1.22) 0.82305 0.94287 GP10 0.67 (0.42–1.09) 0.10535 0.25284 1.47 (0.78–2.74) 0.23071 0.73508 GP11 0.29 (0.05–1.94) 0.20402 0.37914 0.54 (0.04–7.82) 0.64983 0.91740 GP12 0.26 (0.07–0.95) 0.04082* 0.12246 0.73 (0.07–7.56) 0.78904 0.94287 GP13 1.43 (0.41–5.01) 0.57682 0.65922 0.42 (0.06–2.76) 0.36754 0.73508 GP14 1.04 (0.89–1.21) 0.62048 0.67689 0.98 (0.83–1.16) 0.83265 0.94287 GP15 0.94 (0.29–2.98) 0.91178 0.93209 4.06 (0.56–29.63) 0.16662 0.73508 GP16 0.58 (0.29–1.18) 0.13407 0.29251 0.78 (0.30–2.06) 0.62133 0.91740 GP17 0.74 (0.29–1.91) 0.53150 0.63780 14.54 (0.90–234.80) 0.05924 0.71088 GP18 0.94 (0.83–1.08) 0.38246 0.50995 1.12 (0.90–1.41) 0.30969 0.73508 GP19 0.33 (0.13–0.85) 0.02092* 0.07172 1.84 (0.61–5.58) 0.27867 0.73508 GP20 0.01 (0.01–62.90) 0.25526 0.43759 1.02 (0.09–10.99) 0.99036 0.99036 GP21 0.02 (0.01–0.27) 0.00292* 0.02357# 2.34 (0.43–12.61) 0.32450 0.73508 GP22 0.01 (0.01–0.02) 0.00403* 0.02357# 0.50 (0.09–2.83) 0.43216 0.74084 GP23 0.32 (0.13–0.78) 0.01231* 0.04924# 1.97 (0.48–8.02) 0.34477 0.73508 GP24 0.21 (0.09–0.54) 0.00108* 0.02357# 0.92 (0.31–2.79) 0.88869 0.94287 Note. IS, ischemic stroke; CI confidence interval; GP, glycan peaks. *P < 0.05. #q < 0.05: significant after correction for FDR (false discovery rate). Table S7. Associations of derive glycan traits and ischemic stroke in sex-specific analysis (after adjusting for age, waist and hip circumference, obesity, diabetes, hypertension, and dyslipidemia)
Derive glycans Incident IS vs. control (men) Incident IS vs. control (women) OR (95% CI) P* q# OR (95% CI) P* q# FGS/(FG + FGS) 1.97 (0.90–1.05) 0.47035 0.58821 1.06 (0.96–1.17) 0.25252 0.66608 FBGS/(FBG + FBGS) 0.97 (0.93–1.01) 0.14862 0.32101 1.00 (0.95–1.06) 0.90261 0.98529 FGS/(F + FG + FGS) 0.93 (0.84–1.02) 0.10578 0.32101 1.08 (0.94–1.24) 0.29246 0.66608 FBGS/(FB + FBG + FBGS) 0.94 (0.88–0.99) 0.04614* 0.20763 1.01 (0.93–1.09) 0.84370 0.98529 FG1S1/(FG1 + FG1S1) 0.90 (0.76–1.08) 0.26753 0.42478 0.98 (0.79–1.21) 0.85245 0.98529 FG2S1/(FG2 + FG2S1 + FG2S2) 0.97 (0.91–1.05) 0.44277 0.58821 1.05 (0.96–1.13) 0.29063 0.66608 FG2S2/(FG2 + FG2S1 + FG2S2) 0.72 (0.55–0.94) 0.01443* 0.09740 1.18 (0.85–1.65) 0.32829 0.66608 FBG2S1/(FBG2 + FBG2S1 + FBG2S2) 1.00 (0.93–1.07) 0.93178 0.93999 1.03 (0.97–1.10) 0.35771 0.66608 FBG2S2/(FBG2 + FBG2S1 + FBG2S2) 0.92 (0.87–0.97) 0.00236* 0.03186# 0.98 (0.92–1.04) 0.43883 0.76441 FtotalS1/FtotalS2 1.31 (1.10–1.55) 0.00217* 0.03186# 0.98 (0.92–1.05) 0.58689 0.90459 FS1/FS2 1.14 (1.05–1.25) 0.00323* 0.03488# 0.98 (0.94–1.03) 0.40807 0.73452 FBS1/FBS2 1.40 (0.95–2.05) 0.08864 0.30780 1.00 (0.76–1.29) 0.96764 0.98529 FBStotal/FStotal 0.02 (0.00–0.61) 0.02354 0.14124 2.14 (0.12–37.37) 0.60306 0.90459 FBS1/FS1 0.09 (0.00–1.82) 0.11599 0.32101 6.51 (0.22–189.84) 0.27634 0.66608 FBS1/FS1 + FBS1 0.08 (0.00–2.17) 0.13119 0.32101 7.82 (0.18–338.24) 0.28483 0.66608 FBS2/FS2 0.46 (0.17–1.27) 0.13610 0.32101 0.51 (0.14–1.91) 0.31653 0.66608 FBS2/(FS2 + FBS2) 0.04 (0.00–3.17) 0.14456 0.32101 0.07 (0.00–13.69) 0.32787 0.66608 GP1n 1.85 (0.36–9.48) 0.46240 0.58821 0.78 (0.16–3.76) 0.75293 0.98529 GP2n 0.49 (0.15–1.66) 0.25350 0.42478 0.92 (0.23–3.66) 0.90194 0.98529 GP4n 1.14 (1.04–1.25) 0.00579* 0.05211 1.00 (0.93–1.09) 0.93899 0.98529 GP5n 2.86 (0.43–19.18) 0.27843 0.42478 0.13 (0.00–9.62) 0.35189 0.66608 GP6n 1.04 (0.77–1.41) 0.80101 0.84157 1.26 (0.84–1.91) 0.26759 0.66608 GP7n 0.40 (0.08–1.96) 0.25918 0.42478 0.98 (0.09–11.24) 0.98529 0.98529 GP8n 0.93 (0.79–1.08) 0.34361 0.48828 0.84 (0.69–1.03) 0.09674 0.65695 GP9n 0.65 (0.51–0.84) 0.00970* 0.07482 1.01 (0.84–1.22) 0.90422 0.98529 GP10n 0.62 (0.40–0.95) 0.02857 0.14634 1.48 (0.87–2.51) 0.14599 0.65695 GP11n 0.27 (0.05–1.42) 0.13398 0.32101 1.14 (0.31–4.15) 0.84676 0.98529 GP12n 0.29 (0.09–0.89) 0.02981* 0.14634 2.31 (0.57–9.41) 0.24438 0.66608 GP13n 1.23 (0.43–3.50) 0.69777 0.77130 0.58 (0.12–2.68) 0.48008 0.81013 GP14n 0.99 (0.88–1.10) 0.79650 0.84157 0.99 (0.87–1.13) 0.90839 0.98529 GP15n 0.75 (0.30–1.84) 0.52458 0.62949 3.46 (0.69–17.42) 0.13259 0.65695 G0n 1.12 (1.03–1.22) 0.00075* 0.02025# 1.02 (0.94–1.11) 0.61997 0.90482 G1n 0.74 (0.63–0.87) 0.00036* 0.01944# 0.94 (0.83–1.07) 0.35238 0.66608 G2n 0.97 (0.88–1.07) 0.55739 0.64580 1.01 (0.90–1.15) 0.81987 0.98529 Fn total 1.18 (0.87–1.61) 0.28319 0.42478 1.01 (0.63–1.62) 0.95728 0.98529 FG0n total/G0n 1.54 (0.96–2.51) 0.08202 0.30780 1.04 (0.59–1.80) 0.90425 0.98529 FG1n total/G1n 1.26 (0.79–2.00) 0.32894 0.48007 0.90 (0.36–2.26) 0.82569 0.98529 FG2n total/G2n 1.16 (0.95–1.41) 0.14570 0.32101 1.00 (0.78–1.27) 0.96609 0.98529 Fn 1.10 (0.96–1.25) 0.17171 0.35662 0.86 (0.68–1.08) 0.19000 0.66608 FG0n/G0n 1.11 (0.99–1.24) 0.06739 0.27992 0.92 (0.77–1.08) 0.29939 0.66608 FG1n/G1n 1.08 (0.94–1.24) 0.27107 0.42478 0.80 (0.64–1.00) 0.04944 0.65695 FG2n/G2n 1.10 (0.97–1.26) 0.14237 0.32101 0.91 (0.74–1.11) 0.34349 0.66608 FBn 0.89 (0.75–1.07) 0.22285 0.41496 1.24 (0.95–1.64) 0.11803 0.65695 FBG0n/G0n 0.89 (0.79–1.02) 0.09120 0.30780 1.13 (0.93–1.38) 0.21865 0.66608 FBG1n/G1n 0.94 (0.81–1.11) 0.47929 0.58821 1.27 (1.00–1.60) 0.05105 0.65695 FBG2n/G2n 0.94 (0.68–1.03) 0.69989 0.77130 1.48 (0.97–2.28) 0.07214 0.65695 FBn/Fn 0.92 (0.82–1.04) 0.18069 0.36138 1.16 (0.95–1.41) 0.13681 0.65695 FBn/Fn total 0.90 (0.76–1.06) 0.19347 0.37312 1.23 (0.95–1.60) 0.12297 0.65695 Fn/ (Bn + FBn) 1.20 (0.87–1.65) 0.26277 0.42478 0.65 (0.39–1.06) 0.08252 0.65695 Bn/ (Fn + FBn) 1.01 (0.92–1.11) 0.81041 0.84157 0.95 (0.82–1.10) 0.50541 0.82703 FBG2n/FG2n 0.15 (0.00–18.16) 0.43812 0.58821 0.80 (0.64–1.01) 0.05737 0.65695 FBG2n/ (FG2n + FBG2n) 0.90 (0.68–1.20) 0.47565 0.58821 1.43 (0.96–2.13) 0.07703 0.65695 FG2n/ (BG2n + FBG2n) 1.05 (0.89–1.23) 0.56209 0.64580 0.95 (0.75–1.19) 0.63963 0.90894 BG2n/ (FG2n + FBG2n) 1.00 (0.98–1.02) 0.93999 0.93999 0.99 (0.96–1.02) 0.54538 0.86619 Note. IS, ischemic stroke; CI, confidence interval. *P < 0.05. #q < 0.05: significant after correction for FDR (false discovery rate).
doi: 10.3967/bes2023.048
A Nested Case-Control Study to Explore the Association between Immunoglobulin G N-glycans and Ischemic Stroke
-
Abstract:
Objective This study prospectively investigates the association between immunoglobulin G (IgG) N-glycan traits and ischemic stroke (IS) risk. Methods A nested case-control study was conducted in the China suboptimal health cohort study, which recruited 4,313 individuals in 2013–2014. Cases were identified as patients diagnosed with IS, and controls were 1:1 matched by age and sex with cases. IgG N-glycans in baseline plasma samples were analyzed. Results A total of 99 IS cases and 99 controls were included, and 24 directly measured glycan peaks (GPs) were separated from IgG N-glycans. In directly measured GPs, GP4, GP9, GP21, GP22, GP23, and GP24 were associated with the risk of IS in men after adjusting for age, waist and hip circumference, obesity, diabetes, hypertension, and dyslipidemia. Derived glycan traits representing decreased galactosylation and sialylation were associated with IS in men (FBG2S2/(FBG2 + FBG2S1 + FBG2S2): odds ratio (OR) = 0.92, 95% confidence interval (CI): 0.87–0.97; G1n: OR = 0.74, 95% CI: 0.63–0.87; G0n: OR = 1.12, 95% CI: 1.03–1.22). However, these associations were not found among women. Conclusion This study validated that altered IgG N-glycan traits were associated with incident IS in men, suggesting that sex discrepancies might exist in these associations. -
Key words:
- Ischemic stroke /
- Immunoglobulin G /
- N-glycans /
- Nested case-control study
The study was approved by the Ethics Committee of Capital Medical University, China, and abided by the principles of the Declaration of Helsinki. All voluntary participants provided written informed consent before taking part in this study.
&These authors contributed equally to this work.
注释:1) AUTHOR CONTRIBUTIONS: 2) ETHICS APPROVAL AND CONSENT TO PARTICIPATE: -
Figure 1. Ultra-Performance Liquid Chromatography of IS patients and controls in (A) men and (B) women. The profiles of glycan peaks were randomly selected from IS patients and matched controls. The 24 IgG glycan peaks are numbered. The blue line represents IS patients; the black line represents controls. IS, ischemic stroke
Figure 2. Odds ratios (OR) and 95% confidence intervals (95% CI) for the associations of IgG N-glycan traits with IS in (A) men and (B) women. Multiple logistic regression analysis was performed after adjusting for age, waist and hip circumference, obesity, diabetes, hypertension, and dyslipidemia. IS, ischemic stroke
S1. The correlation coefficients of independent IgG N-glycan peaks in (A) men and (B) women. The positive correlations are represented by blue, while negative correlations are represented by red.
S1. Description of structures for UPLC results of IgG glycan peaks
Glycan peak Structures of
glycan peakGraphic peak
compositionGlycan peak Structures of
glycan peakGraphic peak
compositionGP1 FA1 GP13 A2BG2 GP2 A2 GP14 FA2G2 GP3 A2B GP15 FA2BG2 GP4 FA2 GP16 FA2G1S1 GP5 M5 GP17 A2G2S1 GP6 FA2B GP18 FA2G2S1 GP7 A2G1 GP19 FA2BG2S1 GP8 FA2[6]G1 GP20 FA2FG2S1 GP9 FA2[3]G1 GP21 A2G2S2 GP10 FA2[6]BG1 GP22 A2BG2S2 GP11 FA2[3]BG1 GP23 FA2G2S2 GP12 A2G2 GP24 FA2BG2S2 Note. UPLC, ultra-performance liquid chromatography; IgG, immunoglobulin G; GP, glycan peaks; F, represents a fucose attached to core N-acetylglucosamine; M, represents mannoses attached to core N-acetylglucosamine; A, represents N-acetylglucosamine attached to core triple mannose; B, represents bisected N-acetylglucosamine linked to core triple mannose; G, represents galactose; [3]G1 and [6]G1 represent galactose attached to α1–3 and α1–6 mannose respectively; S represents N-acetylneuraminic acid attached to galactose; blue square represents N-acetylglucosamine; red triangle represents fucose; green circle represents mannose; yellow circle represents galactose; purple square represents N-acetylneuraminic acid.  下载: 导出CSV
S2. Description of structures and calculation formula of derived glycan traits
Derived glycan traits Structures of derived glycan traits Calculation formula FGS / (FG + FGS) Sialylation of fucosylated galactosylated structures without bisecting GlcNAc SUM (GP16 + GP18 + GP23) / SUM (GP16 + GP18 + GP23 + GP8 + GP9 + GP14) × 100 FBGS / (FBG + FBGS) Sialylation of fucosylated galactosylated structures with bisecting GlcNAc SUM (GP19 + GP24) / SUM (GP19 + GP24 + GP10 + GP11 + GP15) × 100 FGS / (F + FG + FGS) Sialylation of all fucosylated structures without bisecting GlcNAc SUM (GP16 + GP18 + GP23) / SUM (GP16 + GP18 + GP23 + GP4 + GP8 + GP9 + GP14) × 100 FBGS / (FB + FBG + FBGS) Sialylation of all fucosylated structures with bisecting GlcNAc SUM (GP19 + GP24) / SUM (GP19 + GP24 + GP6 + GP10 + GP11 + GP15) × 100 FG1S1 / (FG1 + FG1S1) Monosialylation of fucosylated monogalactosylated structures GP16 / SUM (GP16 + GP8 + GP9) × 100 FG2S1 / (FG2 + FG2S1 + FG2S2) Monosialylation of fucosylated digalactosylated structures GP18 / SUM (GP18 + GP14 + GP23) × 100 FG2S2 / (FG2 + FG2S1 + FG2S2) Disialylation of fucosylated digalactosylated structures GP23 / SUM (GP23 + GP14 + GP18) × 100 FBG2S1 / (FBG2 + FBG2S1 + FBG2S2) Monosialylation of fucosylated digalactosylated structures with bisecting GlcNAc GP19 / SUM (GP19 + GP15 + GP24) × 100 FBG2S2 / (FBG2 + FBG2S1 + FBG2S2) Disialylation of fucosylated digalactosylated structures with bisecting GlcNAc GP24 / SUM (GP24 + GP15 + GP19) × 100 FtotalS1 / FtotalS2 Ratio of all fucosylated monosialylated and disialylated structures SUM (GP16 + GP18 + GP19) / SUM (GP23 + GP24) FS1 / FS2 Ratio of fucosylated (without bisecting GlcNAc) monosialylated and disialylated structures SUM (GP16 + GP18) / GP23 FBS1 / FBS2 Ratio of fucosylated (with bisecting GlcNAc) monosialylated and disialylated structures GP19 / GP24 FBStotal / FStotal Ratio of all fucosylated sialylated structures with and without bisecting GlcNAc SUM (GP19 + GP24) / SUM (GP16 + GP18 + GP23) FBS1 / FS1 Fucosylated monosialylated structures with and without bisecting GlcNAc GP19 / SUM (GP16 + GP18) FBS1 / (FS1 + FBS1) Bisecting GlcNAc in all fucosylated monosialylated structures GP19 / SUM (GP16 + GP18 + GP19) FBS2 / FS2 Ratio of fucosylated disialylated structures with and without bisecting GlcNAc GP24 / GP23 FBS2 / (FS2 + FBS2) Bisecting GlcNAc in all fucosylated disialylated structures GP24 / SUM (GP23 + GP24) GP1n GP1 in total neutral glycan fraction GP1 / GPn × 100 GP2n GP2 in total neutral glycan fraction GP2 / GPn × 100 GP4n GP4 in total neutral glycan fraction GP4 / GPn × 100 GP5n GP5 in total neutral glycan fraction GP5 / GPn × 100 GP6n GP6 in total neutral glycan fraction GP6 / GPn × 100 GP7n GP7 in total neutral glycan fraction GP7 / GPn × 100 GP8n GP8 in total neutral glycan fraction GP8 / GPn × 100 GP9n GP9 in total neutral glycan fraction GP9 / GPn × 100 GP10n GP10 in total neutral glycan fraction GP10 / GPn × 100 GP11n GP11 in total neutral glycan fraction GP11 / GPn × 100 GP12n GP12 in total neutral glycan fraction GP12 / GPn × 100 GP13n GP13 in total neutral glycan fraction GP13 / GPn × 100 GP14n GP14 in total neutral glycan fraction GP14 / GPn × 100 GP15n GP15 in total neutral glycan fraction GP15 / GPn × 100 G0n G0 in total neutral glycan fraction SUM (GP1n: GP4n + GP6n) G1n G1 in total neutral glycan fraction SUM (GP7n: GP11n) G2n G2 in total neutral glycan fraction SUM (GP12n: GP15n) Fn total All fucosylated structures in total neutral glycan fraction SUM (GP1n + GP4n + GP6n + GP8n + GP9n + GP10n + GP11n + GP14n + GP15n) FG0n total / G0n Fucosylation in agalactosylated structures SUM (GP1n + GP4n + GP6n) / G0n × 100 FG1n total / G1n Fucosylation in monogalactosylated structures SUM (GP8n + GP9n + GP10n + GP11n) / G1n × 100 FG2n total / G2n Fucosylation in digalactosylated structures SUM (GP14n + GP15) / G2n × 100 Fn Fucosylation (without bisecting GlcNAc) in total neutral glycan fraction SUM (GP1n + GP4n + GP8n + GP9n + GP14n) FG0n / G0n Fucosylation (without bisecting GlcNAc) in agalactosylated structures SUM (GP1n + GP4n) / G0n × 100 FG1n / G1n Fucosylation (without bisecting GlcNAc) in monogalactosylated structures SUM (GP8n + GP9n) / G1n × 100 FG2n / G2n Fucosylation (without bisecting GlcNAc) in digalactosylated structures GP14n / G2n × 100 FBn Fucosylation (with bisecting GlcNAc) structures in total neutral glycan fraction SUM (GP6n + GP10n + GP11n + GP15n) FBG0n / G0n Fucosylation (with bisecting GlcNAc) of agalactosylated structures GP6n/ G0n × 100 FBG1n / G1n Fucosylation (with bisecting GlcNAc) of monogalactosylated structures SUM (GP10n + GP11n) / G1n × 100 FBG2n / G2n Fucosylation (with bisecting GlcNAc) of digalactosylated structures GP15n / G2n × 100 FBn / Fn Ratio of fucosylated structures with and without bisecting GlcNAc FBn / Fn × 100 FBn / Fn total Bisecting GlcNAc in all fucosylated structures in total neutral glycan fraction FBn / Fn total × 100 Fn / (Bn + FBn) Ratio of fucosylated non–bisecting GlcNAc structures and all structures with bisecting GlcNAc Fn / (GP13n + FBn) Bn / (Fn + FBn) Ratio of structures with bisecting GlcNAc and all fucosylated structures (with and without bisecting GlcNAc) GP13n / (Fn + FBn) × 1,000 FBG2n / FG2n Ratio of fucosylated digalactosylated structures with and without bisecting GlcNAc GP15n / GP14n FBG2n / (FG2n + FBG2n) Bisecting GlcNAc in all fucosylated digalactosylated structures in total neutral glycan fraction GP15n / (GP14n + GP15n) × 100 FG2n / (BG2n + FBG2n) Fucosylated digalactosylated without bisecting GlcNAc structures in all digalactosylated structures GP14n / (GP13n + GP15n) BG2n / (FG2n + FBG2n) Digalactosylated structures with bisecting GlcNAc in all fucosylated digalactosylated structures (with and without bisecting GlcNAc) GP13n / (GP14n + GP15n) × 1,000 Note. F, a fucose attached to core N-acetylglucosamine; B, bisected N-acetylglucosamine linked to core triple mannose; G, galactose; S, N-acetylneuraminic acid attached to galactose; n, neutral glycans.
下载: 导出CSV
Table 1. Baseline characteristics of study subjects
Parameters Men Women Incident IS (n = 58) Control (n = 58) P Incident IS (n = 41) Control (n = 41) P Age (years) 59 (47–61) 52 (40–62) 0.057 57 (48–61) 59 (54–62) 0.108 Waistline (cm) 92.00 (87.00–98.25) 88.00 (83.50–92.25) 0.003 84.00 (80.00–90.00) 85.00 (80.00–93.00) 0.700 Hipline (cm) 100.00 (96.75–105.00) 100.00 (97.00–102.00) 0.377 99.00 (95.00–103.50) 98.00 (96.00–103.00) 0.880 BMI (kg/m2) 26.27 (24.51–27.68) 25.00 (23.44–26.45) 0.021 24.61 (23.00–26.49) 25.00 (22.83–26.76) 0.692 SBP (mmHg) 137.00 (125.00–144.00) 123.00 (115.00–130.25) < 0.001 133.00 (120.00–147.50) 121.00 (111.00–134.00) 0.004 DBP (mmHg) 89.00 (83.00–95.25) 79.50 (72.75–87.25) < 0.001 81.00 (74.50–90.00) 74.00 (67.50–82.00) 0.007 FBG (mmHg) 5.30 (4.90–5.90) 5.20 (4.90–5.81) 0.956 5.10 (4.90–5.50) 5.10 (4.80–5.70) 0.662 TG (mmol/L) 1.33 (1.02–1.97) 1.14 (0.87–1.55) 0.031 1.45 (0.95–1.78) 1.31 (0.86–1.85) 0.813 LDL (mmol/L) 2.58 (2.21–2.99) 2.25 (1.81–2.77) 0.023 2.63 (2.30–3.39) 2.65 (2.42–3.11) 0.289 HDL (mmol/L) 1.07 (0.93–1.25) 1.11 (0.94–1.33) 0.376 1.31 (1.15–1.43) 1.27 (1.17–1.47) 0.878 TC (mmol/L) 4.58 (3.99–5.16) 4.31 (3.30–4.82) 0.047 4.89 (4.34–5.78) 4.78 (4.33–5.18) 0.321 Note. IS, ischemic stroke; BMI, body mass index; SBP, systolic blood pressure; DBP, diastolic blood pressure; FBG, fasting blood glucose; TG, total triglycerides; LDL, low-density lipoprotein; HDL, high-density lipoprotein; TC, total cholesterol. Bold type indicates statistical significance.
下载: 导出CSV
S3. Initial glycan peaks levels in the whole study population of nested case-control study
Initial glycans Incident IS Control P* q# GP1 0.09 (0.06–0.16) 0.10 (0.06–0.15) 0.92289 0.92289 GP2 0.47 (0.32–0.72) 0.54 (0.34–0.74) 0.29690 0.41915 GP3 0.14 (0.08–0.25) 0.14 (0.06–0.24) 0.50532 0.60638 GP4 27.91 (24.37–33.50) 26.28 (22.06–30.47) 0.00538* 0.02356# GP5 0.25 (0.18–0.33) 0.23 (0.17–0.28) 0.29391 0.41915 GP6 5.83 (4.73–6.84) 5.27 (4.54–6.39) 0.12498 0.27268 GP7 0.23 (0.14–0.39) 0.27 (0.16–0.45) 0.14670 0.29340 GP8 18.07 (16.66–19.25) 18.48 (16.72–20.15) 0.35356 0.47141 GP9 8.92 (6.37–9.99) 8.51 (7.52–10.29) 0.66243 0.75706 GP10 3.86 (3.47–4.71) 3.98 (3.39–4.58) 0.80409 0.87719 GP11 0.39 (0.27–0.52) 0.46 (0.35–0.65) 0.01306* 0.04478# GP12 0.44 (0.31–0.73) 0.56 (0.40–0.83) 0.02977* 0.07939 GP13 0.59 (0.37–0.76) 0.60 (0.43–0.83) 0.39073 0.49355 GP14 15.76 (13.06–18.50) 13.79 (16.21–18.45) 0.20918 0.35859 GP15 1.31 (1.13–1.69) 1.36 (1.19–1.65) 0.89766 0.92289 GP16 2.51 (2.14–2.99) 2.75 (2.40–3.11) 0.02277* 0.06831 GP17 0.62 (0.48–0.76) 0.67 (0.53–0.84) 0.25641 0.41026 GP18 8.03 (5.87–9.68) 8.58 (6.60–10.89) 0.07599 0.18238 GP19 1.22 (0.90–1.47) 1.44 (1.04–1.73) 0.00589* 0.02356# GP20 0.07 (0.04–0.10) 0.08 (0.05–0.11) 0.17033 0.31446 GP21 0.21 (0.12–0.36) 0.31 (0.18–0.45) 0.00228* 0.01368# GP22 0.04 (0.03–0.07) 0.08 (0.03–0.14) 0.00077* 0.00924# GP23 0.59 (0.35–0.98) 0.84 (0.53–1.22) 0.00195* 0.01368# GP24 0.49 (0.32–1.00) 0.93 (0.48–1.37) 0.00014* 0.00336# Note. Data were expressed median (25th–75th percentile); IS, ischemic stroke; GP, glycan peaks. *P < 0.05. #q < 0.05: significant after correction for FDR (false discovery rate).
下载: 导出CSV
S8. Initial glycan peaks after dimension reduction screening and false discrimination rates of 5-fold cross-validation in the three methods
Items Stepwise regression Ridge regression Lasso regression Initial glycan peaks GP4 0.147 0.144 0.018 GP9 –0.349 –0.393 –0.047 GP21 – – – GP22 –18.174 –12.879 –0.994 GP23 – – – GP24 – – –0.172 False discrimination rates 0.267 0.267 0.286 Note. GP, glycan peaks; –, the initial glycans were not included in the model.
下载: 导出CSV
S4. Sex-specific initial glycan peaks levels in nested case-control study
Initial glycans Men Women Incident IS Control P* q# Incident IS Control P* q# GP1 0.09 (0.06–0.16) 0.08 (0.05–0.12) 0.53245 0.61419 0.10 (0.05–0.15) 0.10 (0.07–0.17) 0.36758 0.80236 GP2 0.51 (0.32–0.74) 0.54 (0.35–0.73) 0.81231 0.82950 0.47 (0.31–0.69) 0.61 (0.34–0.75) 0.17711 0.80236 GP3 0.18 (0.09–0.29) 0.12 (0.05–0.17) 0.02494* 0.05679 0.13 (0.07–0.22) 0.22 (0.10–0.29) 0.07032 0.80236 GP4 26.64 (24.54–31.37) 22.65 (20.42–26.22) 0.00001* 0.00008# 31.87 (23.14–35.61) 30.47 (27.15–32.94) 0.88539 0.92388 GP5 0.26 (0.18–0.33) 0.21 (0.16–0.26) 0.08585 0.13736 0.25 (0.20–0.30) 0.25 (0.20–0.35) 0.60091 0.90137 GP6 5.70 (4.91–6.49) 5.12 (4.17–6.16) 0.28842 0.38115 5.96 (4.59–7.07) 5.58 (4.76–7.13) 0.82898 0.92388 GP7 0.30 (0.15–0.40) 0.28 (0.18–0.46) 0.30174 0.38114 0.22 (0.12–0.33) 0.23 (0.15–0.40) 0.30960 0.80236 GP8 18.05 (16.40–19.16) 17.72 (16.16–19.84) 0.82950 0.82950 18.07 (16.94–19.16) 18.95 (17.42–20.32) 0.09597 0.80236 GP9 8.38 (6.28–9.88) 8.71 (7.65–10.37) 0.24399 0.34445 9.09 (7.41–10.03) 8.30 (6.80–10.26) 0.59025 0.90137 GP10 3.90 (3.35–4.70) 4.02 (3.43–4.58) 0.53742 0.61419 3.85 (3.50–5.07) 3.85 (3.05–4.70) 0.33709 0.80236 GP11 0.41 (0.29–0.52) 0.49 (0.37–0.72) 0.00765* 0.02295# 0.38 (0.30–0.50) 0.43 (0.32–0.55) 0.57133 0.90137 GP12 0.51 (0.35–0.76) 0.66 (0.48–1.03) 0.02393* 0.05679 0.39 (0.25–0.61) 0.47 (0.34–0.61) 0.30100 0.80236 GP13 0.64 (0.41–0.77) 0.63 (0.45–0.92) 0.66266 0.72290 0.51 (0.35–0.72) 0.52 (0.40–0.78) 0.40118 0.80236 GP14 16.06 (14.85–18.51) 17.54 (15.13–18.98) 0.05330 0.09487 15.04 (11.94–18.36) 14.36 (12.59–16.84) 0.84204 0.92388 GP15 1.35 (1.03–1.81) 1.46 (1.29–1.71) 0.24162 0.34446 1.28 (1.07–1.58) 1.20 (1.01–1.40) 0.12404 0.80236 GP16 2.56 (2.16–2.96) 2.77 (2.41–3.40) 0.02603* 0.05679 2.51 (2.14–3.02) 2.68 (2.34–2.97) 0.37326 0.80236 GP17 0.68 (0.49–0.80) 0.74 (0.60–0.91) 0.05534 0.09487 0.58 (0.48–0.72) 0.60 (0.47–0.69) 0.73488 0.92388 GP18 7.90 (6.31–9.68) 9.82 (8.01–12.46) 0.00218* 0.00747# 7.77 (5.44–9.93) 7.59 (5.97–8.54) 0.55485 0.90136 GP19 1.22 (0.88–1.48) 1.55 (1.34–1.77) 0.00004* 0.00019# 1.25 (0.94–1.48) 1.20 (0.72–1.54) 0.40055 0.80236 GP20 0.07 (0.04–0.10) 0.10 (0.04–0.12) 0.04731* 0.09462 0.07 (0.05–0.10) 0.06 (0.05–0.09) 0.84481 0.92388 GP21 0.22 (0.12–0.38) 0.38 (0.28–0.57) 0.00002* 0.00012# 0.21 (0.11–0.34) 0.22 (0.12–0.29) 0.87464 0.92388 GP22 0.05 (0.03–0.08) 0.12 (0.06–0.20) 0.00001* 0.00008# 0.04 (0.03–0.07) 0.05 (0.02–0.09) 0.26127 0.80236 GP23 0.56 (0.35–1.09) 1.02 (0.68–1.68) 0.00008* 0.00032# 0.59 (0.36–0.90) 0.68 (0.38–0.87) 0.94823 0.94823 GP24 0.53 (0.35–1.11) 1.14 (0.79–1.62) 0.00001* 0.00008# 0.46 (0.31–0.90) 0.60 (0.33–0.99) 0.66626 0.92388 Note. Data were expressed median (25th–75th percentile); IS, ischemic stroke; GP, glycan peaks. *P < 0.05. #q < 0.05: significant after correction for FDR (false discovery rate).
下载: 导出CSV
S5. Sex-specific derive glycan traits levels in nested case-control study
Derive glycans Men Women Incident IS Control P* q# Incident IS Control P* q# FGS/(FG + FGS) 21.58 (17.18–24.75) 24.82 (20.35–28.44) 0.01024* 0.03253# 19.92 (16.46–23.58) 20.47 (16.83–22.67) 0.54249 0.79174 FBGS/(FBG + FBGS) 22.28 (15.51–32.00) 31.46 (23.82–37.07) 0.00045* 0.00347# 22.06 (17.79–29.09) 23.24 (16.82–31.50) 0.74667 0.86864 FGS/(F + FG + FGS) 13.84 (10.47–16.80) 17.36 (14.10–20.75) 0.00103* 0.00556# 13.09 (9.45–16.37) 13.09 (11.09–14.74) 0.36087 0.63734 FBGS/(FB + FBG + FBGS) 13.21 (8.81–19.06) 19.22 (14.63–25.69) 0.00008* 0.00072# 12.33 (9.45–17.34) 13.58 (8.84–18.63) 0.79154 0.89048 FG1S1/(FG1 + FG1S1) 8.36 (6.87–10.13) 9.18 (8.01–11.79) 0.02131* 0.05479 7.89 (6.97–9.79) 8.92 (7.67–9.99) 0.16845 0.62776 FG2S1/(FG2 + FG2S1 + FG2S2) 31.99 (28.02–36.49) 35.12 (31.17–38.62) 0.01811* 0.05147 32.52 (28.71–34.62) 32.50 (28.72–35.54) 0.97411 0.98890 FG2S2/(FG2 + FG2S1 + FG2S2) 2.42 (1.46–4.26) 3.40 (2.68–5.14) 0.00121* 0.00594# 2.54 (1.70–4.02) 3.11 (1.43–3.89) 0.85649 0.92501 FBG2S1/(FBG2 + FBG2S1 + FBG2S2) 36.07 (31.29–41.18) 36.53 (33.98–39.56) 0.80038 0.86441 39.16 (34.44–45.11) 37.95 (32.40–42.82) 0.74219 0.86864 FBG2S2/(FBG2 + FBG2S1 + FBG2S2) 19.40 (11.83–28.99) 26.39 (20.92–32.73) 0.00002* 0.00036# 14.76 (10.66–23.97) 19.94 (12.67–27.05) 0.22264 0.62776 FtotalS1/FtotalS2 9.61 (5.97–14.64) 6.57 (5.06–8.69) 0.00007* 0.00072# 10.47 (6.26–14.49) 8.74 (6.72–13.80) 0.66629 0.83674 FS1/FS2 17.82 (11.06–29.02) 12.92 (9.23–17.11) 0.00059* 0.00354# 17.29 (10.68–23.77) 15.40 (11.99–25.66) 0.95193 0.98890 FBS1/FBS2 1.88 (1.38–3.14) 1.41 (1.09–1.71) 0.00002* 0.00036# 2.55 (1.58–3.30) 1.96 (1.48–3.32) 0.32103 0.62775 FBStotal/FStotal 0.16 (0.12–0.21) 0.19 (0.16–0.23) 0.00059* 0.00354# 0.17 (0.11–0.22) 0.16 (0.11–0.22) 0.53805 0.79174 FBS1/FS1 0.11 (0.08–0.14) 0.12 (0.10–0.16) 0.05678 0.12264 0.12 (0.09–0.16) 0.11 (0.09–0.14) 0.20666 0.62776 FBS1/FS1 + FBS1 0.09 (0.07–0.12) 0.10 (0.09–0.14) 0.06318 0.13030 0.11 (0.08–0.14) 0.10 (0.08–0.12) 0.21982 0.62776 FBS2/FS2 0.89 (0.62–1.28) 1.10 (0.84–1.33) 0.02100* 0.05479 0.79 (0.65–1.09) 1.02 (0.65–1.27) 0.53814 0.79174 FBS2/(FS2 + FBS2) 0.47 (0.38–0.56) 0.52 (0.46–0.57) 0.04908* 0.12047 0.44 (0.39–0.52) 0.50 (0.39–0.56) 0.53904 0.79174 GP1n 0.09 (0.07–0.20) 0.11 (0.07–0.16) 0.64278 0.73851 0.11 (0.06–0.18) 0.12 (0.08–0.20) 0.63293 0.81376 GP2n 0.59 (0.38–0.89) 0.66 (0.43–0.88) 0.50054 0.60065 0.54 (0.36–0.77) 0.68 (0.40–0.89) 0.17490 0.62776 GP4n 32.55 (29.13–37.07) 27.71 (25.51–31.73) 0.00003* 0.00041# 36.88 (27.52–41.70) 35.13 (31.34–37.73) 0.56569 0.79915 GP5n 0.31 (0.21–0.39) 0.26 (0.19–0.31) 0.24623 0.39107 0.28 (0.23–0.34) 0.29 (0.23–0.39) 0.45536 0.76842 GP6n 6.70 (5.83–7.69) 6.12 (5.30–7.39) 0.22027 0.36044 6.85 (5.56–8.00) 6.30 (5.47–8.23) 0.60676 0.79914 GP7n 0.34 (0.18–0.50) 0.36 (0.22–0.54) 0.15588 0.28058 0.25 (0.14–0.36) 0.28 (0.17–0.45) 0.26776 0.62776 GP8n 20.93 (19.55–23.35) 22.14 (20.06–23.57) 0.25676 0.39614 21.02 (18.93–22.51) 21.99 (20.31–23.25) 0.08556 0.62776 GP9n 9.88 (7.14–11.46) 10.60 (9.55–12.43) 0.01181* 0.03543# 10.54 (8.69–11.55) 9.72 (7.85–11.44) 0.29290 0.62776 GP10n 4.63 (3.92–5.50) 4.91 (4.29–5.72) 0.12410 0.23108 4.55 (4.06–5.68) 4.44 (3.51–5.45) 0.20555 0.62776 GP11n 0.46 (0.31–0.60) 0.61 (0.45–0.82) 0.00139* 0.00626# 0.47 (0.35–0.57) 0.49 (0.36–0.62) 0.75604 0.86864 GP12n 0.59 (0.43–0.93) 0.80 (0.60–1.25) 0.00659* 0.02224# 0.45 (0.29–0.70) 0.53 (0.38–0.74) 0.36588 0.63734 GP13n 0.76 (0.44–0.97) 0.79 (0.55–1.10) 0.35647 0.46949 0.55 (0.40–0.85) 0.61 (0.45–0.89) 0.33248 0.62776 GP14n 19.06 (15.87–22.04) 22.00 (17.94–24.04) 0.00491* 0.01768# 16.72 (13.35–22.43) 16.63 (14.41–19.71) 0.96386 0.98890 GP15n 1.62 (1.21–2.14) 1.85 (1.59–2.17) 0.05250 0.12264 1.53 (1.20–1.94) 1.39 (1.15–1.67) 0.12482 0.62776 G0n 39.81 (36.45–44.64) 35.43 (32.44–39.42) 0.00002* 0.00036# 43.89 (34.54–49.25) 42.01 (39.49–47.09) 0.84456 0.92501 G1n 36.38 (33.12–39.88) 39.15 (36.88–40.78) 0.00165* 0.00685# 36.78 (33.66–39.91) 36.74 (34.84–38.86) 0.98890 0.98890 G2n 22.03 (18.32–25.91) 25.96 (21.39–28.36) 0.00180* 0.00694# 19.87 (15.37–25.34) 19.10 (16.49–22.71) 0.71465 0.86864 Fn total 96.92 (96.19–97.85) 96.87 (95.94–97.56) 0.17436 0.29423 97.50 (96.98–98.14) 97.15 (96.61–97.84) 0.09055 0.62776 FG0n total/G0n 98.40 (97.78–98.95) 98.31 (98.60–99.50) 0.10451 0.20156 98.78 (98.27–99.10) 98.50 (97.85–98.88) 0.19258 0.62776 FG1n total/G1n 99.11 (98.62–99.52) 99.05 (98.60–99.43) 0.31759 0.46351 99.32 (99.07–99.61) 99.22 (98.87–99.52) 0.20389 0.62776 FG2n total/G2n 93.52 (92.42–94.99) 93.21 (91.72–94.47) 0.16577 0.28876 94.06 (93.36–95.44) 93.58 (92.48–94.80) 0.11383 0.79174 Fn 82.88 (81.56–85.69) 82.93 (80.58–85.59) 0.33667 0.46949 83.54 (82.34–85.73) 84.32 (81.60–86.26) 0.52525 0.79915 FG0n/G0n 81.58 (79.77–83.54) 80.41 (77.86–83.42) 0.05466 0.12264 82.35 (80.01–84.19) 82.26 (80.13–85.63) 0.60676 0.62776 FG1n/G1n 84.16 (82.80–87.17) 84.59 (82.26–86.46) 0.28216 0.42324 84.81 (83.71–86.66) 85.09 (83.44–88.06) 0.19898 0.79915 FG2n/G2n 85.71 (84.19–87.91) 85.70 (83.33–87.08) 0.45936 0.56788 85.94 (84.80–88.42) 86.82 (84.33–88.19) 0.60029 0.62776 FBn 13.85 (11.86–14.98) 13.97 (12.04–15.53) 0.52184 0.61259 13.71 (12.31–14.84) 13.19 (11.25–15.47) 0.13337 0.62776 FBG0n/G0n 16.78 (14.86–18.41) 17.86 (15.07–19.31) 0.06515 0.13030 16.61 (14.45–18.75) 16.34 (13.13–17.91) 0.31430 0.62776 FBG1n/G1n 14.72 (12.14–16.05) 14.33 (12.84–15.86) 0.94717 0.98359 14.25 (12.61–15.51) 14.34 (11.04–15.63) 0.15728 0.62776 FBG2n/G2n 7.57 (6.34–8.82) 7.50 (6.57–8.45) 0.69743 0.78461 7.58 (6.78–8.59) 7.20 (6.17–8.63) 0.10361 0.62776 FBn/Fn 16.74 (13.92–18.25) 16.83 (14.02–19.48) 0.46272 0.56788 16.43 (14.55–18.11) 15.63 (13.09–18.96) 0.27178 0.62776 FBn/Fn total 14.34 (12.22–15.44) 14.41 (12.29–16.29) 0.46272 0.56788 14.11 (12.70–15.33) 13.52 (11.57–15.94) 0.27178 0.62776 Fn/ (Bn + FBn) 5.74 (5.23–6.88) 5.63 (4.82–6.76) 0.35359 0.46949 5.82 (5.33–6.63) 6.15 (5.04–7.15) 0.32787 0.62776 Bn/ (Fn + FBn) 7.88 (4.51–9.96) 8.08 (5.64–11.28) 0.35647 0.46949 5.69 (4.04–8.69) 6.26 (4.60–9.17) 0.33713 0.62776 FBG2n/FG2n 0.09 (0.07–0.11) 0.09 (0.08–0.10) 0.97632 0.99251 0.09 (0.08–0.10) 0.08 (0.07–0.10) 0.09598 0.62776 FBG2n/(FG2n + FBG2n) 8.20 (6.75–9.68) 8.18 (7.17–9.23) 0.99251 0.99251 7.97 (7.34–9.16) 7.60 (6.69–9.08) 0.09598 0.62776 FG2n/(BG2n + FBG2n) 7.51 (6.73–9.74) 7.77 (6.74–9.29) 0.94717 0.98359 7.93 (6.96–8.90) 8.41 (7.05–9.59) 0.25983 0.62776 BG2n/(FG2n + FBG2n) 35.97 (23.84–48.16) 34.19 (23.01–45.88) 0.78248 0.86232 33.78 (24.20–42.73) 35.75 (27.10–46.79) 0.28410 0.62776 Note. Data were expressed median (25th–75th percentile); IS ischemic stroke. *represents P < 0.05. #represents q < 0.05: significant after correction for FDR (false discovery rate).
下载: 导出CSV
S6. Associations of initial glycan peaks and ischemic stroke in sex-specific analysis (after adjusting for age, waist and hip circumference, obesity, diabetes, hypertension, and dyslipidemia)
Initial glycans Incident IS vs. control (men) Incident IS vs. control (women) OR (95% CI) P* q# OR (95% CI) P* q# GP1 2.07 (0.42–10.18) 0.37218 0.50995 0.60 (0.12–3.04) 0.54082 0.86531 GP2 0.53 (0.13–2.11) 0.36630 0.50995 0.81 (0.16–4.09) 0.80073 0.94287 GP3 3.03 (0.84–10.96) 0.09149 0.24397 0.42 (0.10–1.82) 0.24799 0.73508 GP4 1.16 (1.05–1.29) 0.00396* 0.02356# 1.01 (0.91–1.11) 0.90359 0.94287 GP5 3.32 (0.52–21.32) 0.20537 0.37914 0.37 (0.03–4.43) 0.42893 0.74085 GP6 1.13 (0.81–1.58) 0.46818 0.59139 1.24 (0.79–1.92) 0.36580 0.73508 GP7 0.37 (0.06–2.20) 0.27572 0.44115 0.39 (0.06–2.53) 0.32465 0.73508 GP8 0.99 (0.82–1.20) 0.93209 0.93209 0.80 (0.64–1.00) 0.05127 0.71088 GP9 0.70 (0.55–0.90) 0.00491* 0.02356# 0.98 (0.78–1.22) 0.82305 0.94287 GP10 0.67 (0.42–1.09) 0.10535 0.25284 1.47 (0.78–2.74) 0.23071 0.73508 GP11 0.29 (0.05–1.94) 0.20402 0.37914 0.54 (0.04–7.82) 0.64983 0.91740 GP12 0.26 (0.07–0.95) 0.04082* 0.12246 0.73 (0.07–7.56) 0.78904 0.94287 GP13 1.43 (0.41–5.01) 0.57682 0.65922 0.42 (0.06–2.76) 0.36754 0.73508 GP14 1.04 (0.89–1.21) 0.62048 0.67689 0.98 (0.83–1.16) 0.83265 0.94287 GP15 0.94 (0.29–2.98) 0.91178 0.93209 4.06 (0.56–29.63) 0.16662 0.73508 GP16 0.58 (0.29–1.18) 0.13407 0.29251 0.78 (0.30–2.06) 0.62133 0.91740 GP17 0.74 (0.29–1.91) 0.53150 0.63780 14.54 (0.90–234.80) 0.05924 0.71088 GP18 0.94 (0.83–1.08) 0.38246 0.50995 1.12 (0.90–1.41) 0.30969 0.73508 GP19 0.33 (0.13–0.85) 0.02092* 0.07172 1.84 (0.61–5.58) 0.27867 0.73508 GP20 0.01 (0.01–62.90) 0.25526 0.43759 1.02 (0.09–10.99) 0.99036 0.99036 GP21 0.02 (0.01–0.27) 0.00292* 0.02357# 2.34 (0.43–12.61) 0.32450 0.73508 GP22 0.01 (0.01–0.02) 0.00403* 0.02357# 0.50 (0.09–2.83) 0.43216 0.74084 GP23 0.32 (0.13–0.78) 0.01231* 0.04924# 1.97 (0.48–8.02) 0.34477 0.73508 GP24 0.21 (0.09–0.54) 0.00108* 0.02357# 0.92 (0.31–2.79) 0.88869 0.94287 Note. IS, ischemic stroke; CI confidence interval; GP, glycan peaks. *P < 0.05. #q < 0.05: significant after correction for FDR (false discovery rate).
下载: 导出CSV
S7. Associations of derive glycan traits and ischemic stroke in sex-specific analysis (after adjusting for age, waist and hip circumference, obesity, diabetes, hypertension, and dyslipidemia)
Derive glycans Incident IS vs. control (men) Incident IS vs. control (women) OR (95% CI) P* q# OR (95% CI) P* q# FGS/(FG + FGS) 1.97 (0.90–1.05) 0.47035 0.58821 1.06 (0.96–1.17) 0.25252 0.66608 FBGS/(FBG + FBGS) 0.97 (0.93–1.01) 0.14862 0.32101 1.00 (0.95–1.06) 0.90261 0.98529 FGS/(F + FG + FGS) 0.93 (0.84–1.02) 0.10578 0.32101 1.08 (0.94–1.24) 0.29246 0.66608 FBGS/(FB + FBG + FBGS) 0.94 (0.88–0.99) 0.04614* 0.20763 1.01 (0.93–1.09) 0.84370 0.98529 FG1S1/(FG1 + FG1S1) 0.90 (0.76–1.08) 0.26753 0.42478 0.98 (0.79–1.21) 0.85245 0.98529 FG2S1/(FG2 + FG2S1 + FG2S2) 0.97 (0.91–1.05) 0.44277 0.58821 1.05 (0.96–1.13) 0.29063 0.66608 FG2S2/(FG2 + FG2S1 + FG2S2) 0.72 (0.55–0.94) 0.01443* 0.09740 1.18 (0.85–1.65) 0.32829 0.66608 FBG2S1/(FBG2 + FBG2S1 + FBG2S2) 1.00 (0.93–1.07) 0.93178 0.93999 1.03 (0.97–1.10) 0.35771 0.66608 FBG2S2/(FBG2 + FBG2S1 + FBG2S2) 0.92 (0.87–0.97) 0.00236* 0.03186# 0.98 (0.92–1.04) 0.43883 0.76441 FtotalS1/FtotalS2 1.31 (1.10–1.55) 0.00217* 0.03186# 0.98 (0.92–1.05) 0.58689 0.90459 FS1/FS2 1.14 (1.05–1.25) 0.00323* 0.03488# 0.98 (0.94–1.03) 0.40807 0.73452 FBS1/FBS2 1.40 (0.95–2.05) 0.08864 0.30780 1.00 (0.76–1.29) 0.96764 0.98529 FBStotal/FStotal 0.02 (0.00–0.61) 0.02354 0.14124 2.14 (0.12–37.37) 0.60306 0.90459 FBS1/FS1 0.09 (0.00–1.82) 0.11599 0.32101 6.51 (0.22–189.84) 0.27634 0.66608 FBS1/FS1 + FBS1 0.08 (0.00–2.17) 0.13119 0.32101 7.82 (0.18–338.24) 0.28483 0.66608 FBS2/FS2 0.46 (0.17–1.27) 0.13610 0.32101 0.51 (0.14–1.91) 0.31653 0.66608 FBS2/(FS2 + FBS2) 0.04 (0.00–3.17) 0.14456 0.32101 0.07 (0.00–13.69) 0.32787 0.66608 GP1n 1.85 (0.36–9.48) 0.46240 0.58821 0.78 (0.16–3.76) 0.75293 0.98529 GP2n 0.49 (0.15–1.66) 0.25350 0.42478 0.92 (0.23–3.66) 0.90194 0.98529 GP4n 1.14 (1.04–1.25) 0.00579* 0.05211 1.00 (0.93–1.09) 0.93899 0.98529 GP5n 2.86 (0.43–19.18) 0.27843 0.42478 0.13 (0.00–9.62) 0.35189 0.66608 GP6n 1.04 (0.77–1.41) 0.80101 0.84157 1.26 (0.84–1.91) 0.26759 0.66608 GP7n 0.40 (0.08–1.96) 0.25918 0.42478 0.98 (0.09–11.24) 0.98529 0.98529 GP8n 0.93 (0.79–1.08) 0.34361 0.48828 0.84 (0.69–1.03) 0.09674 0.65695 GP9n 0.65 (0.51–0.84) 0.00970* 0.07482 1.01 (0.84–1.22) 0.90422 0.98529 GP10n 0.62 (0.40–0.95) 0.02857 0.14634 1.48 (0.87–2.51) 0.14599 0.65695 GP11n 0.27 (0.05–1.42) 0.13398 0.32101 1.14 (0.31–4.15) 0.84676 0.98529 GP12n 0.29 (0.09–0.89) 0.02981* 0.14634 2.31 (0.57–9.41) 0.24438 0.66608 GP13n 1.23 (0.43–3.50) 0.69777 0.77130 0.58 (0.12–2.68) 0.48008 0.81013 GP14n 0.99 (0.88–1.10) 0.79650 0.84157 0.99 (0.87–1.13) 0.90839 0.98529 GP15n 0.75 (0.30–1.84) 0.52458 0.62949 3.46 (0.69–17.42) 0.13259 0.65695 G0n 1.12 (1.03–1.22) 0.00075* 0.02025# 1.02 (0.94–1.11) 0.61997 0.90482 G1n 0.74 (0.63–0.87) 0.00036* 0.01944# 0.94 (0.83–1.07) 0.35238 0.66608 G2n 0.97 (0.88–1.07) 0.55739 0.64580 1.01 (0.90–1.15) 0.81987 0.98529 Fn total 1.18 (0.87–1.61) 0.28319 0.42478 1.01 (0.63–1.62) 0.95728 0.98529 FG0n total/G0n 1.54 (0.96–2.51) 0.08202 0.30780 1.04 (0.59–1.80) 0.90425 0.98529 FG1n total/G1n 1.26 (0.79–2.00) 0.32894 0.48007 0.90 (0.36–2.26) 0.82569 0.98529 FG2n total/G2n 1.16 (0.95–1.41) 0.14570 0.32101 1.00 (0.78–1.27) 0.96609 0.98529 Fn 1.10 (0.96–1.25) 0.17171 0.35662 0.86 (0.68–1.08) 0.19000 0.66608 FG0n/G0n 1.11 (0.99–1.24) 0.06739 0.27992 0.92 (0.77–1.08) 0.29939 0.66608 FG1n/G1n 1.08 (0.94–1.24) 0.27107 0.42478 0.80 (0.64–1.00) 0.04944 0.65695 FG2n/G2n 1.10 (0.97–1.26) 0.14237 0.32101 0.91 (0.74–1.11) 0.34349 0.66608 FBn 0.89 (0.75–1.07) 0.22285 0.41496 1.24 (0.95–1.64) 0.11803 0.65695 FBG0n/G0n 0.89 (0.79–1.02) 0.09120 0.30780 1.13 (0.93–1.38) 0.21865 0.66608 FBG1n/G1n 0.94 (0.81–1.11) 0.47929 0.58821 1.27 (1.00–1.60) 0.05105 0.65695 FBG2n/G2n 0.94 (0.68–1.03) 0.69989 0.77130 1.48 (0.97–2.28) 0.07214 0.65695 FBn/Fn 0.92 (0.82–1.04) 0.18069 0.36138 1.16 (0.95–1.41) 0.13681 0.65695 FBn/Fn total 0.90 (0.76–1.06) 0.19347 0.37312 1.23 (0.95–1.60) 0.12297 0.65695 Fn/ (Bn + FBn) 1.20 (0.87–1.65) 0.26277 0.42478 0.65 (0.39–1.06) 0.08252 0.65695 Bn/ (Fn + FBn) 1.01 (0.92–1.11) 0.81041 0.84157 0.95 (0.82–1.10) 0.50541 0.82703 FBG2n/FG2n 0.15 (0.00–18.16) 0.43812 0.58821 0.80 (0.64–1.01) 0.05737 0.65695 FBG2n/ (FG2n + FBG2n) 0.90 (0.68–1.20) 0.47565 0.58821 1.43 (0.96–2.13) 0.07703 0.65695 FG2n/ (BG2n + FBG2n) 1.05 (0.89–1.23) 0.56209 0.64580 0.95 (0.75–1.19) 0.63963 0.90894 BG2n/ (FG2n + FBG2n) 1.00 (0.98–1.02) 0.93999 0.93999 0.99 (0.96–1.02) 0.54538 0.86619 Note. IS, ischemic stroke; CI, confidence interval. *P < 0.05. #q < 0.05: significant after correction for FDR (false discovery rate).
下载: 导出CSV
-
[1] GBD 2019 Diseases and Injuries Collaborators. Global burden of 369 diseases and injuries in 204 countries and territories, 1990-2019: a systematic analysis for the Global Burden of Disease Study 2019. Lancet, 2020; 396, 1204−22. doi: 10.1016/S0140-6736(20)30925-9 [2] Hankey GJ. Stroke. Lancet, 2017; 389, 641−54. doi: 10.1016/S0140-6736(16)30962-X [3] Wang YJ, Li ZX, Gu HQ, et al. China Stroke Statistics: an update on the 2019 report from the National Center for Healthcare Quality Management in Neurological Diseases, China National Clinical Research Center for Neurological Diseases, the Chinese Stroke Association, National Center for Chronic and Non-communicable Disease Control and Prevention, Chinese Center for Disease Control and Prevention and Institute for Global Neuroscience and Stroke Collaborations. Stroke Vasc Neurol, 2022; 7, 415−50. doi: 10.1136/svn-2021-001374 [4] Cuenca-López MD, Brea D, Segura T, et al. [Inflammation as a therapeutic agent in cerebral infarction: cellular inflammatory response and inflammatory mediators]. Rev Neurol, 2010; 50, 349−59. [5] Rudd PM, Wormald MR, Dwek RA. Glycosylation and the immune system. J Protein Chem, 1998; 17, 519. [6] Kronimus Y, Dodel R, Galuska SP, et al. IgG Fc N-glycosylation: alterations in neurologic diseases and potential therapeutic target? J Autoimmun, 2019; 96, 14-23. [7] Anthony RM, Wermeling F, Ravetch JV. Novel roles for the IgG Fc glycan. Ann N Y Acad Sci, 2012; 1253, 170−80. doi: 10.1111/j.1749-6632.2011.06305.x [8] Russell A, Adua E, Ugrina I, et al. Unravelling immunoglobulin G Fc N-glycosylation: a dynamic marker potentiating predictive, preventive and personalised medicine. Int J Mol Sci, 2018; 19, 390. doi: 10.3390/ijms19020390 [9] Varki A. Biological roles of glycans. Glycobiology, 2017; 27, 3−49. doi: 10.1093/glycob/cww086 [10] Krištić J, Zaytseva OO, Ram R, et al. Profiling and genetic control of the murine immunoglobulin G glycome. Nat Chem Biol, 2018; 14, 516−24. doi: 10.1038/s41589-018-0034-3 [11] Zaytseva OO, Seeling M, Krištić J, et al. Fc-linked IgG N-glycosylation in FcγR knock-out mice. Front Cell Dev Biol, 2020; 8, 67. doi: 10.3389/fcell.2020.00067 [12] Klarić L, Tsepilov YA, Stanton CM, et al. Glycosylation of immunoglobulin G is regulated by a large network of genes pleiotropic with inflammatory diseases. Sci Adv, 2020; 6, eaax0301. doi: 10.1126/sciadv.aax0301 [13] Knezević A, Polašek O, Gornik O, et al. Variability, heritability and environmental determinants of human plasma N-glycome. J Proteome Res, 2009; 8, 694−701. doi: 10.1021/pr800737u [14] Novokmet M, Lukić E, Vučković F, et al. Changes in IgG and total plasma protein glycomes in acute systemic inflammation. Sci Rep, 2014; 4, 4347. doi: 10.1038/srep04347 [15] Liu D, Zhao ZY, Wang AX, et al. Ischemic stroke is associated with the pro-inflammatory potential of N-glycosylated immunoglobulin G. J Neuroinflammation, 2018; 15, 123. doi: 10.1186/s12974-018-1161-1 [16] Liu D, Li Q, Dong J, et al. The association between normal BMI with central adiposity and proinflammatory potential immunoglobulin G N-glycosylation. Diabetes Metab Syndr Obes, 2019; 12, 2373−85. doi: 10.2147/DMSO.S216318 [17] Greto VL, Cvetko A, Štambuk T, et al. Extensive weight loss reduces glycan age by altering IgG N-glycosylation. Int J Obes (Lond), 2021; 45, 1521−31. doi: 10.1038/s41366-021-00816-3 [18] Gao Q, Dolikun M, Štambuk J, et al. Immunoglobulin G N-glycans as potential postgenomic biomarkers for hypertension in the Kazakh population. OMICS, 2017; 21, 380−9. doi: 10.1089/omi.2017.0044 [19] Wang YX, Klarić L, Yu XW, et al. The association between glycosylation of immunoglobulin g and hypertension: a multiple ethnic cross-sectional study. Medicine (Baltimore), 2016; 95, e3379. doi: 10.1097/MD.0000000000003379 [20] Lemmers RFH, Vilaj M, Urda D, et al. IgG glycan patterns are associated with type 2 diabetes in independent European populations. Biochim Biophys Acta Gen Subj, 2017; 1861, 2240−9. doi: 10.1016/j.bbagen.2017.06.020 [21] Liu D, Chu X, Wang H, et al. The changes of immunoglobulin G N-glycosylation in blood lipids and dyslipidaemia. J Transl Med, 2018; 16, 235. doi: 10.1186/s12967-018-1616-2 [22] Cvetko A, Kifer D, Gornik O, et al. Glycosylation alterations in multiple sclerosis show increased proinflammatory potential. Biomedicines, 2020; 8, 410. doi: 10.3390/biomedicines8100410 [23] Ząbczyńska M, Link-Lenczowski P, Novokmet M, et al. Altered N-glycan profile of IgG-depleted serum proteins in Hashimoto's thyroiditis. Biochim Biophys Acta Gen Subj, 2020; 1864, 129464. doi: 10.1016/j.bbagen.2019.129464 [24] Sun Y, Wang YX, Zhang J, et al. Comparison of gender specific structure profiles of immunoglobulin G N-glycans. Chin J Epidemiol, 2016; 37, 1409−12. (In Chinese [25] Krištić J, Vučković F, Menni C, et al. Glycans are a novel biomarker of chronological and biological ages. J Gerontol A Biol Sci Med Sci, 2014; 69, 779−89. doi: 10.1093/gerona/glt190 [26] Ercan A, Kohrt WM, Cui J, et al. Estrogens regulate glycosylation of IgG in women and men. JCI Insight, 2017; 2, e89703. [27] Wang YX, Ge SQ, Yan YX, et al. China suboptimal health cohort study: rationale, design and baseline characteristics. J Transl Med, 2016; 14, 291. doi: 10.1186/s12967-016-1046-y [28] World Health Organization. Recommendations on stroke prevention, diagnosis, and therapy. Report of the WHO Task Force on Stroke and other Cerebrovascular Disorders. Stroke, 1989; 20, 1407−31. doi: 10.1161/01.STR.20.10.1407 [29] Haslam DW, James WPT. Obesity. Lancet, 2005; 366, 1197−1209. doi: 10.1016/S0140-6736(05)67483-1 [30] Yu CZ, Wang J, Li YR, et al. Exposure to the Chinese famine in early life and hypertension prevalence risk in adults. J Hypertens, 2017; 35, 63−8. doi: 10.1097/HJH.0000000000001122 [31] Wang S, Xu L, Jonas JB, et al. Prevalence and associated factors of dyslipidemia in the adult Chinese population. PLoS One, 2011; 6, e17326. doi: 10.1371/journal.pone.0017326 [32] John M Cruickshank. Follow-up of intensive glucose control in type 2 diabetes. N Engl J Med, 2009; 360, 417−8. [33] Liu D, Xu XZ, Li YJ, et al. Immunoglobulin G N-glycan analysis by ultra-performance liquid chromatography. J Vis Exp,doi: 10.3791/60104. [34] Meng XN, Song MS, Vilaj M, et al. Glycosylation of IgG Associates with hypertension and type 2 diabetes mellitus comorbidity in the Chinese Muslim ethnic minorities and the Han Chinese. J Pers Med, 2021; 11, 614. doi: 10.3390/jpm11070614 [35] Trbojević-Akmačić I, Vilaj M, Lauc G. High-throughput analysis of immunoglobulin G glycosylation. Expert Rev Proteomics, 2016; 13, 523−34. doi: 10.1080/14789450.2016.1174584 [36] Pučić-Baković M. High-throughput analysis of the IgG N-Glycome by UPLC-FLR. In: Lauc G, Wuhrer M. High-Throughput Glycomics and Glycoproteomics. Humana Press. 2017, 21-29. [37] Pučić M, Knežević A, Vidič J, et al. High throughput isolation and glycosylation analysis of IgG-variability and heritability of the IgG glycome in three isolated human populations. Mol Cell Proteomics, 2011; 10, M111.010090. doi: 10.1074/mcp.M111.010090 [38] Wu GY, Wan X, Xu BH. A new estimation of protein-level false discovery rate. BMC Genomics, 2018; 19, 567. doi: 10.1186/s12864-018-4923-3 [39] Peng CY, Manz BD, Keck J. Modeling categorical variables by logistic regression. Am J Health Behav, 2001; 25, 278−84. doi: 10.5993/AJHB.25.3.15 [40] Witten DM, Tibshirani R. Covariance-regularized regression and classification for high dimensional problems. J Roy Stat Soc Series B Stat Methodol, 2009; 71, 615−36. doi: 10.1111/j.1467-9868.2009.00699.x [41] Ding N, Nie H, Sun XM, et al. Human serum N-glycan profiles are age and sex dependent. Age Ageing, 2011; 40, 568−75. doi: 10.1093/ageing/afr084 [42] Wittenbecher C, Štambuk T, Kuxhaus O, et al. Plasma N-Glycans as emerging biomarkers of cardiometabolic risk: a prospective investigation in the EPIC-potsdam cohort study. Diabetes Care, 2020; 43, 661−8. doi: 10.2337/dc19-1507 [43] Štambuk T, Klasić M, Zoldoš V, et al. N-glycans as functional effectors of genetic and epigenetic disease risk. Mol Aspects Med, 2021; 79, 100891. doi: 10.1016/j.mam.2020.100891 [44] Vilar-Bergua A, Riba-Llena I, Vanhooren V, et al. N-glycome profile levels relate to silent brain infarcts in a cohort of hypertensives. J Am Heart Assoc, 2015; 4, e002669. doi: 10.1161/JAHA.115.002669 [45] Menni C, Gudelj I, Macdonald-Dunlop E, et al. Glycosylation profile of immunoglobulin G is cross-sectionally associated with cardiovascular disease risk score and subclinical atherosclerosis in two independent cohorts. Circ Res, 2018; 122, 1555−64. doi: 10.1161/CIRCRESAHA.117.312174 [46] Kaneko Y, Nimmerjahn F, Ravetch JV. Anti-inflammatory activity of immunoglobulin G resulting from Fc sialylation. Science, 2006; 313, 670−3. doi: 10.1126/science.1129594 [47] Nikolac Perkovic M, Pucic Bakovic M, Kristic J, et al. The association between galactosylation of immunoglobulin G and body mass index. Prog Neuropsychopharmacol Biol Psychiatry, 2014; 48, 20−5. doi: 10.1016/j.pnpbp.2013.08.014 [48] Russell AC, Kepka A, Trbojević-Akmačić I, et al. Increased central adiposity is associated with pro-inflammatory immunoglobulin G N-glycans. Immunobiology, 2019; 224, 110−5. doi: 10.1016/j.imbio.2018.10.002 [49] Matsumoto A, Shikata K, Takeuchi F, et al. Autoantibody activity of IgG rheumatoid factor increases with decreasing levels of galactosylation and sialylation. J Biochem, 2000; 128, 621−8. doi: 10.1093/oxfordjournals.jbchem.a022794 [50] Ackerman ME, Crispin M, Yu XJ, et al. Natural variation in Fc glycosylation of HIV-specific antibodies impacts antiviral activity. J Clin Invest, 2013; 123, 2183−92. doi: 10.1172/JCI65708 [51] Vidarsson G, Dekkers G, Rispens T. IgG subclasses and allotypes: from structure to effector functions. Front Immunol, 2014; 5, 520. -
 22360+Supplementary Materials.pdf

-

 点击查看大图
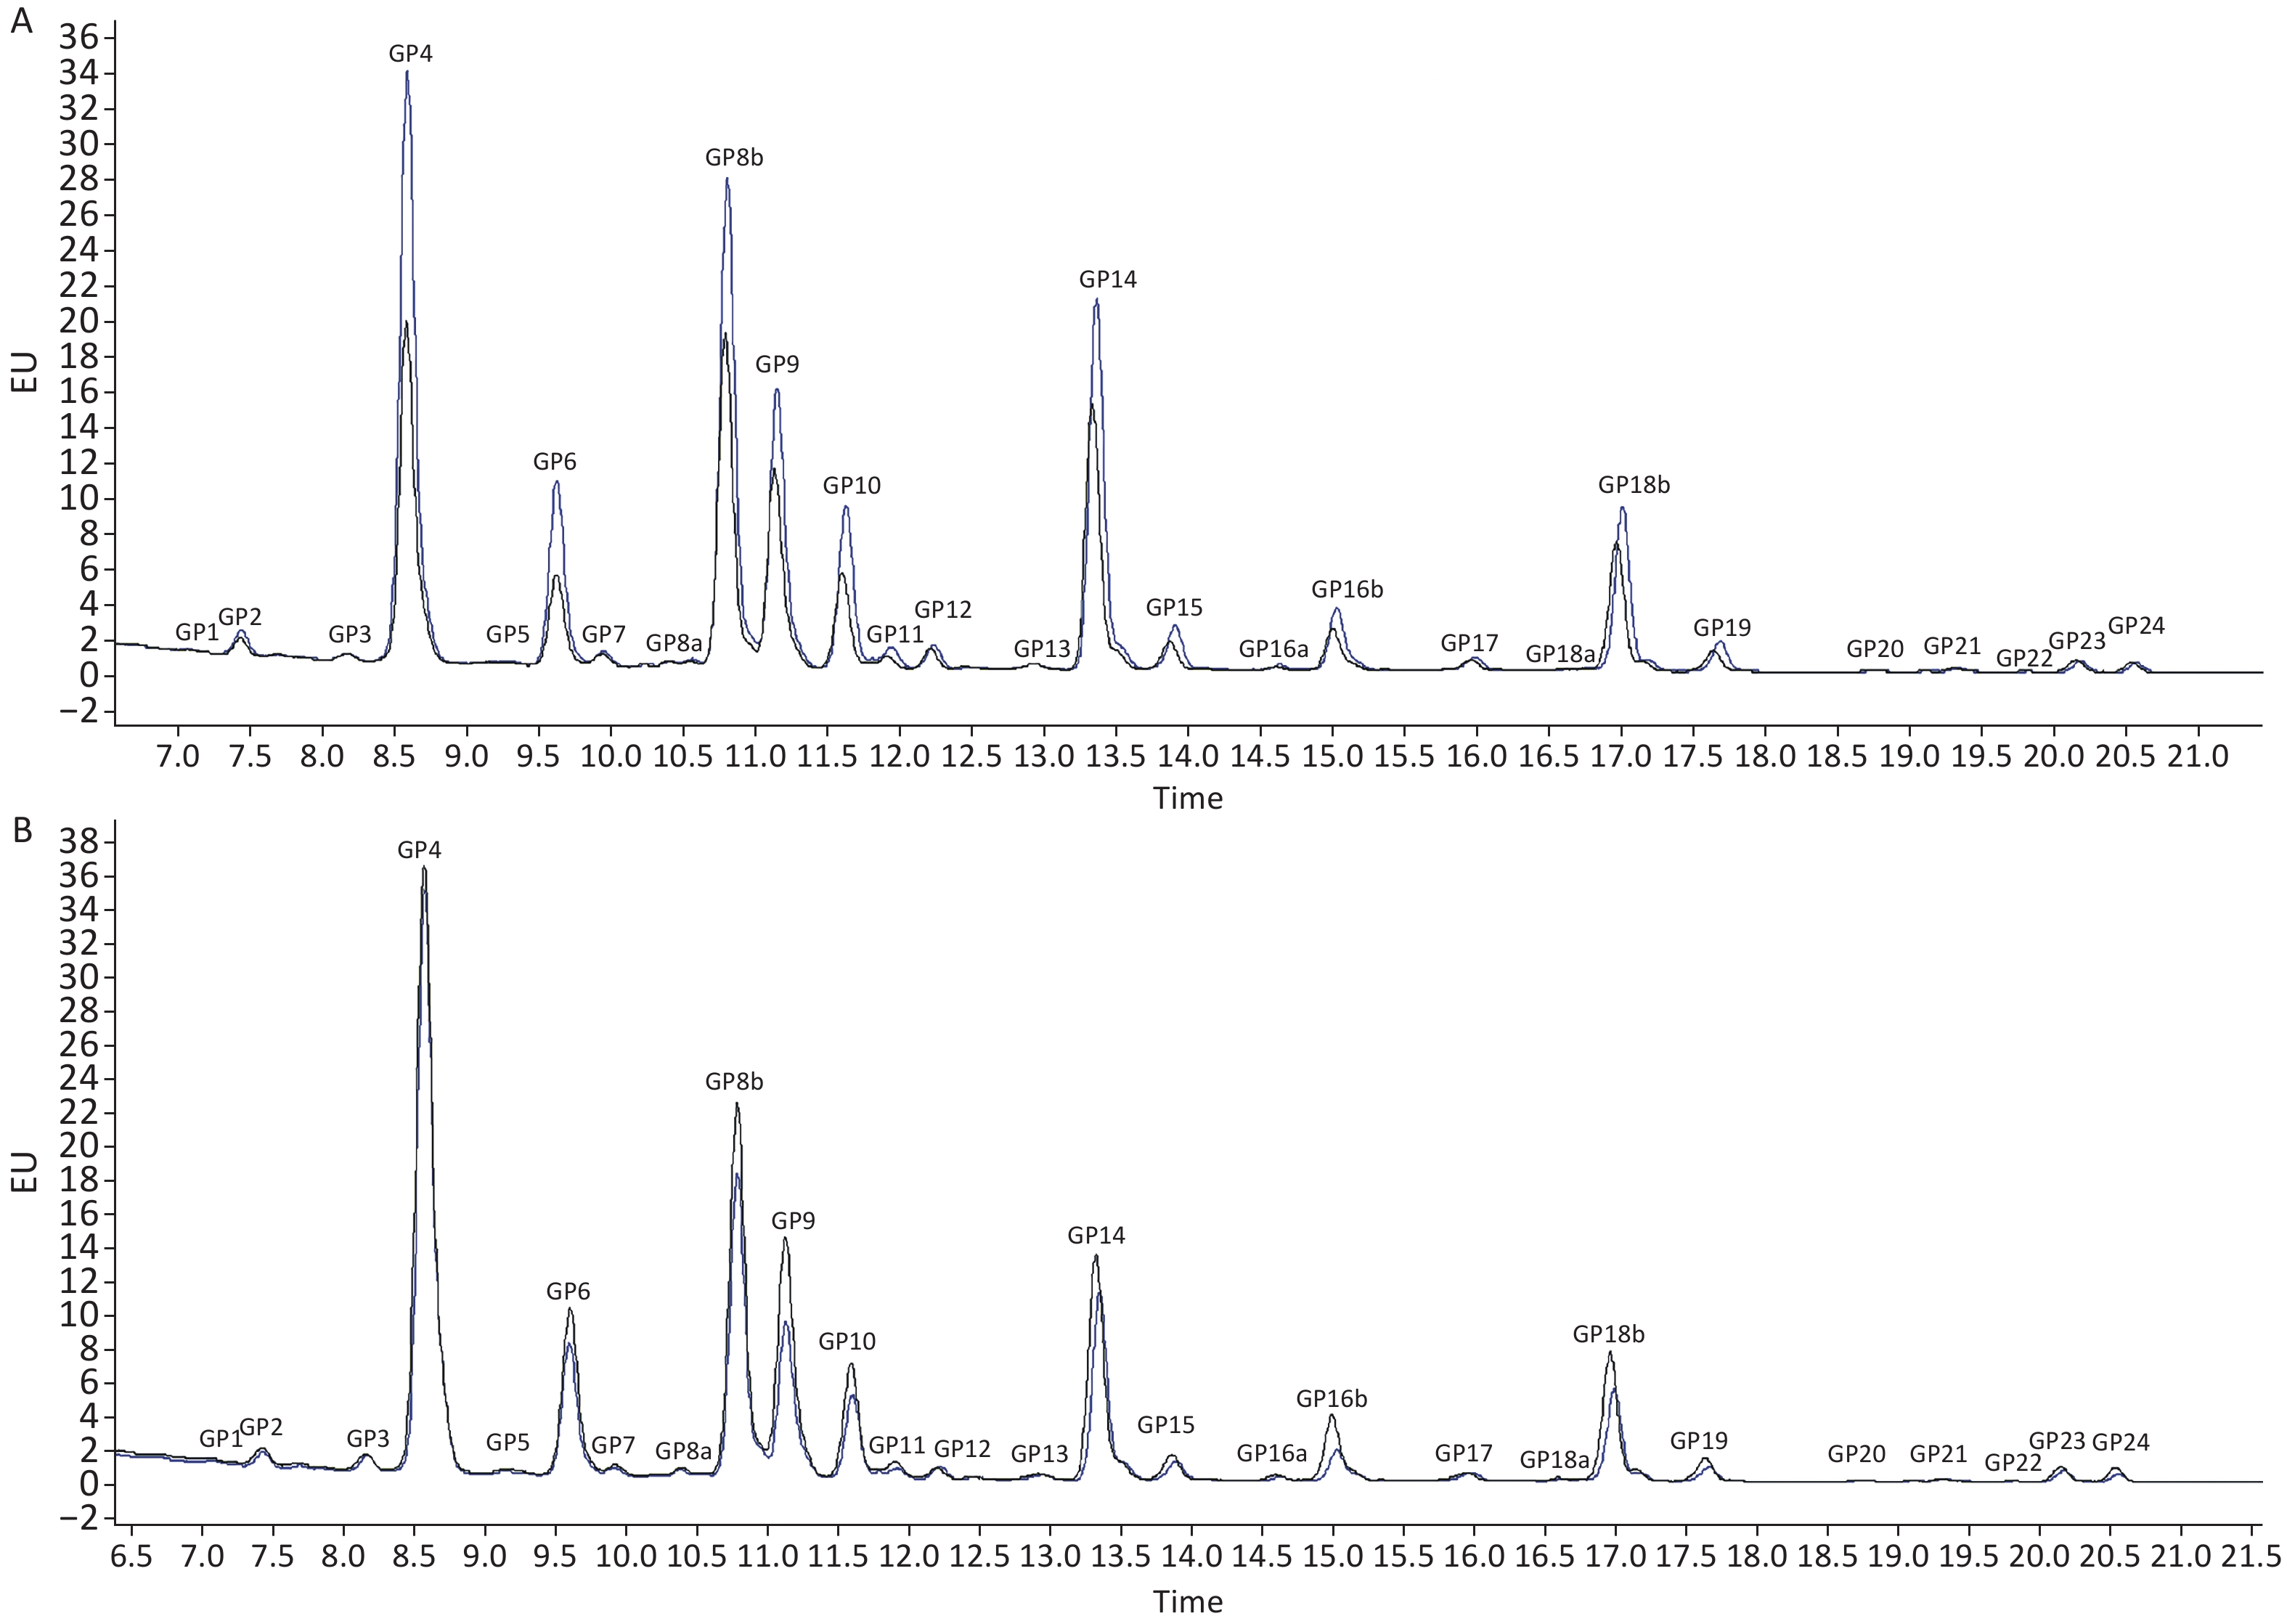
计量
- 文章访问数: 596
- HTML全文浏览量: 281
- PDF下载量: 69
- 被引次数: 0

 Quick Links